Muskie Archives and Special Collections Library
|
|
|
- Aubrie Bathsheba Sharp
- 5 years ago
- Views:
Transcription

1 Bates College SCARAB Walter Lawrance Papers Muskie Archives and Special Collections Library L.A. General Data Walter A. Lawrance Bates College Follow this and additional works at: Part of the Earth Sciences Commons, and the Environmental Sciences Commons Recommended Citation Walter A. Lawrance Androscoggin River Studies Twenty Seventh Annual Report, October, 1969, Androscoggin River Studies, Box 5, Folder 3, Walter A. Lawrance Papers, Edmund S. Muskie Archives and Special Collections Library, Bates College, Lewiston, Maine. This Article is brought to you for free and open access by the Muskie Archives and Special Collections Library at SCARAB. t has been accepted for inclusion in Walter Lawrance Papers by an authorized administrator of SCARAB. For more information, please contact batesscarab@bates.edu.
2 TWENTY-SEVENTH ANNUAL REPORT Part Four LEWSTON-AUBURN GENERAL DATA 1969 ntrgdyction. During most of the summer air and water conditions, due to pollution, were more favorable than in 196. River flows were large and fewer temperature extremes were recorded. There were no fish kills observed or reported in the Lewiston area. Daily Repprt!. Daily reports numbered one to ninetyone contain a reoord oft a. River odor. type and intensity b. Air temperatures c. General weather conditions d. Direction of wind e. Surfaoe appearance of the river f. Conditions at Gulf sland and Deer Rips Dams (Frequent but not daily.) These reports were mailed to Messrs Webber, Cooper and Stevens, at frequent intervals, iver Odor. Types tc. Pig-pen odor was dominant in the Pool from Mile Two northward and frequently observed in the region of the Dams. Hydrogen sulfide odor was prevalent in the Mile One area apd very noticeable at the Dams during the last three weeks in July, when the holiday shutdowns and other abnonnally large discharges of pollutants arrived. ef Part three of this report.
3 River odor was reported in the downtown area on eleven days during the season. The flow over the Lewiston Falls (known as Great Falls) was much more frequent than in recent years. The majority of the odor observations was in the North Bridge area. On July )0 hydrogen sulfide was detectable on the bridge and for about a hundred yards up Main Street. On August first the odor was recorded as Musty-Mouldy #2. Pig-pen odor was present on four days and was very noticeable on June seventeen. River odor has not been detected in the downtown area since August six. Air Temperature$. Mean hourly temperatures were above the eighty-five year average during June, August and September and below during July. The temperature pattern was very different from that of 196t! season. TABLE #1 Mean Hourlr Temperatures (OF) ( ewiston) Year June July August September A ) !.2) gg l... g ) g5 year average g Deviation from average f ; f 0.24 The averages for May through August were below the twenty-seven year average; for September the average was o.goe higher. This season the
4 highest temperature observed at Gulf sland Dam was 24.50C on July 18 and August 19. compared to 27 C in TABLE #2 Water Temperatures (OC) Gulf sland Dam Year May* June July August September a ,,0 27 year average Deviation from average *Thursdayts only. Precipitation. n the Lewiston area the average monthly preeipitation was higher than the ninety-five year average during June, August and September and below during July. 3 higher than the long range average. The precipitation during September was TABLE #3 Monthly PreCipitation (inches) (Lewiston) Year June July August September ) J.n! 2.2) year averag Deviation from average /.0,, 68 /-1.02

5 ( ( ( l p=.._- - TT l i WATER TEMPERATURE c,, ' T,, i-f W-,, -' NORTH TURNER BRDBE E r==-,,,, '7 ;) q : --, -H :-:-rtti 11 1 i T; J-4l3tn!i l', 7 -- f, mw-rn TTTf i i t,, r :l===!=l TURNER CENTER BRDGE [, ',, i,,, ttffi# t' {#t_ --t---..,, i i=--=r-+--- ;. ", -==1- _n-l--- T,,, i!-., i,,,!, 1----,, T,, n, T i i i, "Ti ft1 i i - --t-- W GULF SLAND DAM,n 'i!f P t t-;_l -- :... _ ' 1 i:1 L=tt=--t- ' :r :2ut-_ l:::::+-+ i! j -- L F --: ii,!,, l i -T-T, ' - - H =t= : _.:, --L_ f:=!..l+ -=-'-1 h+,.". _:..--:-_!--'o-i --:+'Ti-,..,! ;":-:-;'1'1,..., -, ':--ri-r *';' , MAY JUNE " FF rv JULY 1 fl 6 9 T tt j!t, T j n T',, rt 17,,, ', J T -9 r c ;,, itti f h r- ii " i' ""j, ' ii l---'...llj...l., i' " i, i, :,H--t+-rl,, i 1 -,,-,-, -r T r-r TT l,,! i! T Tl n i.!!" AUGUST '.,.L ', -, T i --r ffi -. - E LL _ j, H '' ii i ill TTl ill G LW ", -' -'-'-1,, ';,, : i-t-h- -,,-,-,,t-j--c- l--r--r-t -,--+'1 - i 171 7'i: +,... Ị! i x-, j u,,, :=F --'_---, -+- ; j-, --i-' T, j,, --+- T T 1 Ti i, * ' ':" --r-;--r; 1 '+,, i t+1+i T J ii f '- ",--;, ; i : n, T, ' :-::± B T t+t r _. TTi ,- ' r ' -rrr : rtri ' ', T - q-', SEPTE';\SER YEAR 0 C>6
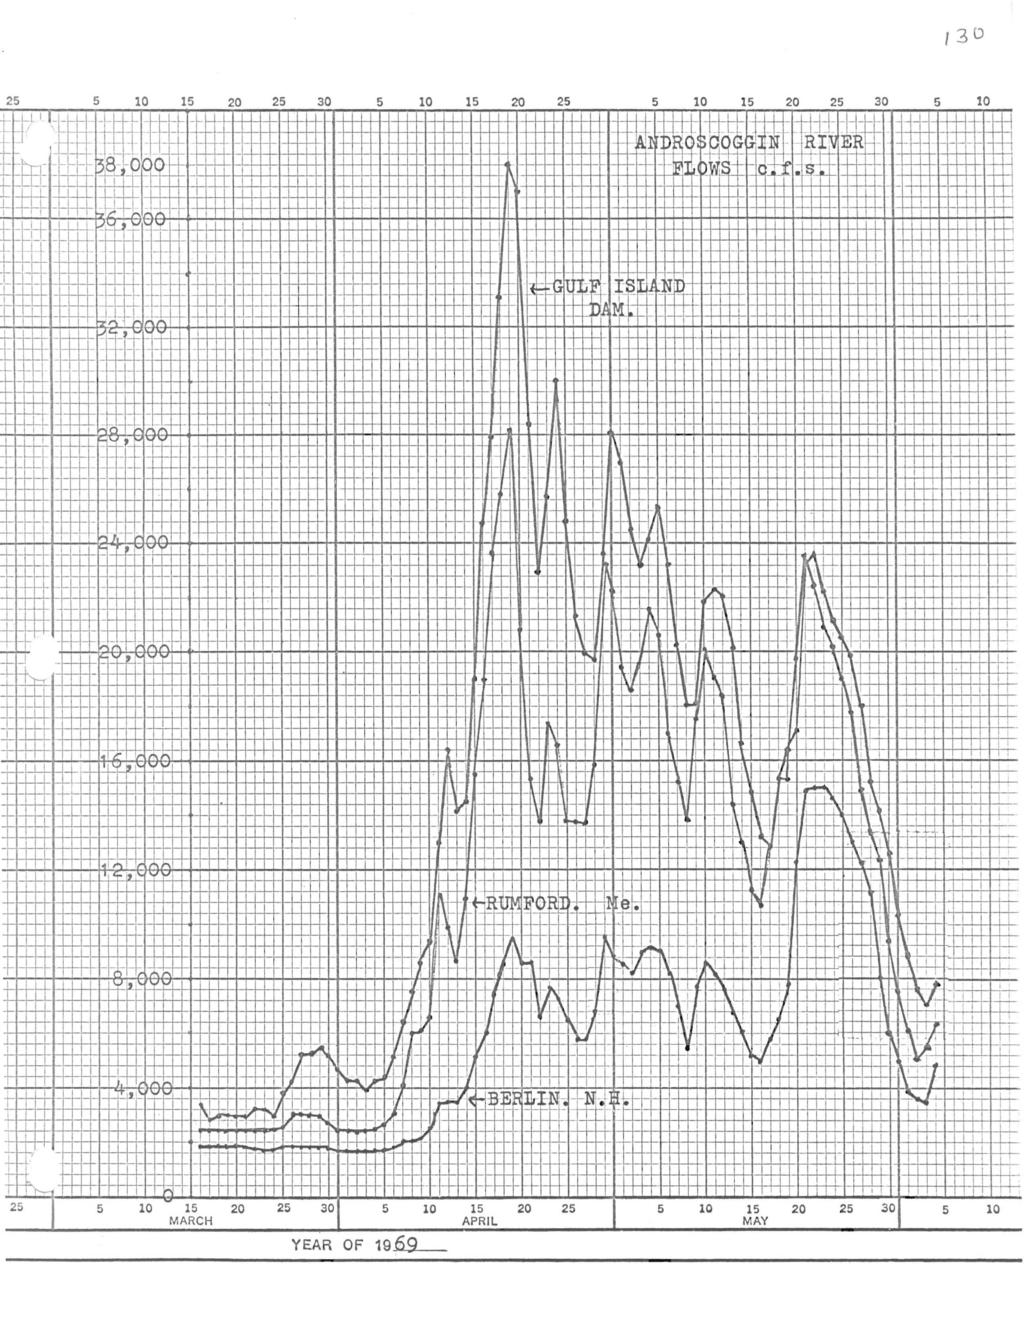
6 River Flows. River flows were much above the thirtytwo year average during May through September; flows during May and August were almost twice as high as the long range average. The high level (99%) of upstream storage after the heavy rains (July 28.Aug.2) made possible the augmentation of natural river flow during the entire month of August and September. TABLE #4 Average Dail t Flows (c,f.s.) (Gulf sland Dam) Year May June July Aug. Sept. J.A.S. average a year aver Rl l ver Surface Foam was somewhat less persistant this Conditions. year, probably due to greater dilution of the Kraft soaps and other detergents. However, large river flows resulted in more spilling over dams and larger areas of foam than were present in 1968 Floating water vegetation was conspicuous by its absence. Blue-green algae were seldom observed and then only on very small pieces of slimy sludge. Dissolved oxygen content of the river water was much larger than last year mainly due to the increase in flows. The lowest dissolved oxygen recorded during the season in Lewiston downtown,
7

8 ( ( ( --- RVER FLOWS l!) nt.ao 10 S c.f.s. 10 S S 20 2S S i 0(1"110 BERLN EA= '+H t--, -i-:-:...l r: " i i i - i j, ' f T-' ; i!,! f ;-n T T: iii! l l!!, T!!'"ii, RUMFORD H-tttt-H n Tl i n [ TTl, j " FH-t f -L.! i r 11,, Tl, ' f r : : '70. " T j it ft'tt " tt L J T t ' T t 0 1 0, '- -; " 1" ;-:1 ; "1, t,' ' ; j, j, i rr 1.8:±±, T TTTl -, 1 '",-,-, T, ; j '1 : il l +, +- T, T T 11 -, " T l ' ' rrrfl-m+n ;W;, ft +-- LL!,",-T-h 'r, Rr:-rr:: r t. - f:r::f. T i j i' t- T i-oj n n ' ;, T, J4=+il-+R, i : ; ;- - L n itt ',, ' i H-+tT++ ' i 1\1 i ;-r;, -,f- it! ii ' O i-n 1Tt1:T!J...l. j r\+h 1 1 n,; i [!.' ' n #' n ell LL! -H- ", Ll ij Lt - ri-; 1-- :Wl il,: r-' T'::-:-_ =r-_-=---1-, _ LL!, ;--,-+-:-,-r'-f. - ' -+;- -rr+- P LU " ii-j' ; rho: TTl!! j '! ' r-, ' TmTTflTVl H+H=H.",j '" Tl R f! 1\ 1,,! J' : i: +ft-tt j q::r 1 T t...l1 i l l n TTl 1" 1 11 ffi rn - L l+t:fi C +tl,,- -,, 1 f T ] 1 :, ',, ' j, ' 1 j ill j iii Ll i ' ';01, r j +- _t f, GUL, F SLAND DAM -+T, T Sft-l##tffffi n LLL :n, (5VVO 10 S S S /.AY JUNE JULY AUGUST SEPTE-.1BER l:j 6! YEAR OF 19 '-11 Him 11, i j
9 was 0.1 ppm on September one when the water in the oanal was stagnant during the holiday. La ieton 1969 TABLE 115 River Data* Date Water ph Dissolved Oxygen B.O.D. River Temp. ppm %Satn. 5 day Flow oc ppm May ,6 12.g g g g June g , July : ) ) g.l Aug ) ,,) l.g Sept, ut , *Thursday only
10 133 LEWSTON May, June, 1969 Date Temp. ph D. O. D. O. B.O. D. ppm %Sat. ppm May B.O B June B
11 LEWSTON July, 1969 Date TEMP. C ) No Tests ; ) ) _2 ph , D.O. ppm 3.oa 27) O.t? , , l.g D.O. B.O"D. Sat. ppm 34.6 ) )
12 /35' LEWSTON August Date TEMP. ph D.O. ppm D.O, %Sat. B.O.D. ppm S ) i.l , ) ) ,
13 LEWSTON September, 1969 Date Temp , : HLo ph D.O. ppm ) O.g ,, , B.O.D. %Sat. ppm f:t
14 ANDROSCOGGN RVER FLOW C. F. 3. March Date BERLN ) ) g RUMFORD LVERMORE FALLS GULF SLAND DAM
15 13 ANDnCOGO!N c. F. S. R!VF.R FLOW o to BERLm R't!:fORO t V"RVon F- OUlF St,4,ND FAJ.lLS OA}Jl ) ) 2470 )) ) t '20 ) )4eto 4)00 l 1840 )040 ) ) a 2071 S970 S9Ao 7S M S ' z.oo 11 )415 11) = 'S )SO 1) S S15) )4 2) a S93 2,A20 2%ao ; )2)00 )7)O 20 ft ) t\619 lssoo 24f180 26)9(} 22 66S1 1) ) ) O )S 1) sab, 1)2)0 17a20 21)50 27 S79 1)1atJ 16A g 6ft7s 1SAac ) ) )610 30!!1l06 22)
16 ANDROSCOGGN RVER FLOW C. F. S. May, 1969 Date BERLN RUMFORD H3g H , esti mated 7460 LVERMORE FALLS GULF SLAND DAM H!O ;
17 ANDROSCOGGN RVER FLOW C. F, S, June, 1969 Date BERLN RUMFORD LVEm.lORE GULF SLAND FALLS DAM e H!
18 ( eft ANDROSCOGGN RVER FLOW C.. F, S. July, 1969 Date BERLN RUMFORD LVERMORE GULF SLAND FALLS DAM 1 19)0 2)80 26) '9 2) ) ) t S g ) ) ) ) t ) ) i8O ) ) ) 2) ) ) )
19 ANDROSCOGGN RVER FLOW c. F. S. August, 1969 Date BERLN RUMFORD LVERMORE GULF SLAND FALLS DAM 1 2 ) )) ) ) ) )6) ) ) ) ) ro 28 0 )000 ) ; )460 ))20 ) ) ) ) ) ;0 )040 31go )1) )
20 ANDROSCOGGN RVER FLOW c. F. s. September, 1969 Date BERLN RUMFORD LVERMORE GULF SLAND FALLS DAM S it o g ; to lt iS S m g eo '
Muskie Archives and Special Collections Library
 Bates College SCARAB Walter Lawrance Papers Muskie Archives and Special Collections Library 10-1966 Mill Pollution Walter A. Lawrance Bates College Follow this and additional works at: http://scarab.bates.edu/lawrance
Muskie Archives and Special Collections Library
 Bates College SCARAB Walter Lawrance Papers Muskie Archives and Special Collections Library 10-1971 L.A. General Data Walter A. Lawrance Bates College Follow this and additional works at: http://scarab.bates.edu/lawrance
Thirty Years of Climatological Data: 1969 to 1998
 Thirty Years of Climatological Data: 1969 to 1998 NMSU's Agricultural Science Center at Farmington, New Mexico Agricultural Experiment Station Research Report 744 College of Agriculture and Home Economics
Local Climatological Data Summary Aurora, Illinois
 SWS Miscellaneous Publication 98-15 STATE OF ILLINOIS DEPARTMENT OF NATURAL RESOURCES Local Climatological Data Summary Aurora, Illinois 1901-1996 Herbert Hoffman 1, Audrey A. Bryan 2 and Wayne Wendland
Local Climatological (Data Summary Molim, Illinois
 SWS Miscellaneous Publication 98-13 STATE OF ILLINOIS DEPARTMENT OF ENERGY AND NATURAL RESOURCES Local Climatological (Data Summary Molim, Illinois 1872-1992 by Audrey A. Bryan and Wayne Wendland Climatological
2014 Meteorological and Oceanographic Summary for the Bocas del Toro Research Station. Prepared by: Steven Paton
 0 2014 Meteorological and Oceanographic Summary for the Bocas del Toro Research Station Prepared by: Steven Paton 1 Introduction This is the second of a series of yearly reports summarising the past year
LAKE CHELAN ANNUAL FLOW AND WATER TEMPERATURE REPORT Final
 LAKE CHELAN ANNUAL FLOW AND WATER TEMPERATURE REPORT 2013 LICENSE ARTICLES 405 & 408 Final LAKE CHELAN HYDROELECTRIC PROJECT FERC Project No. 637 April 30, 2014 Public Utility District No. 1 of Chelan
Meteorology of Monteverde, Costa Rica 2005
 Meteorology of Monteverde, Costa Rica 2005 Technical Report submitted to the Monteverde Institute Andrew J. Guswa, Asst Professor, Picker Engineering Program Amy L. Rhodes, Asst Professor, Department of
CLIMATOLOGICAL SUMMARY
 DEPARTMENT OF REGISTRATION AND EDUCATION CTATP OF ILLINOIS ILLINOIS STATE WATER SURVEY DIVISION URBANA, ILLINOIS ISWS MP-19 Archive ISWS Illinois State Water Survey )CAL CLIMATOLOGICAL DATA MP-19 LOCAL
Meter Insights for Downtown Store
 Meter Insights for Downtown Store Commodity: Analysis Period: Prepared for: Report Date: Electricity 1 December 2013-31 December 2014 Arlington Mills 12 February 2015 Electricity use over the analysis
LOCAL CLIMATOLOGICAL DATA
 ILLINOIS STATE WATER SURVEY DIVISION URBANA, ILLINOIS ISWS MP-21 Archive SWS0964 Illinois State Water Survey LOCAL CLIMATOLOGICAL DATA FDR HILLSBORO, IL. 1901-1962 LOCAL CLIMATOLOGICAL DATA 1901-1962 HILLSBORO
2016 Meteorological and Oceanographic Summary for the Bocas del Toro Research Station. Prepared by: Steven Paton
 0 2016 Meteorological and Oceanographic Summary for the Bocas del Toro Research Station Prepared by: Steven Paton 1 Introduction This is the forth of a series of yearly reports summarising the past year
ENVIRONMENTAL & ENGINEERING SERVICES DEPARTMENT
 CITY OF LONDON ENVIRONMENTAL & ENGINEERING SERVICES DEPARTMENT WASTEWATER TREATMENT OPERATIONS VAUXHALL WASTEWATER TREATMENT PLANT 2013 ANNUAL REPORT FEBRUARY 2014 Vauxhall Wastewater Treatment Plant 2013
Fairbanks, Alaska. A Climate Almanac
 A Climate Almanac History of Climate Observations at Fairbanks Cooperative climate observations were initiated in Fairbanks by the Rev. Hudson Stuck on September!, "#$!. Observations were made with Weather
2019 Western North Carolina Weather Calendar. Department of Atmospheric Sciences The University of North Carolina at Asheville
 209 Western North Carolina Weather Calendar Department of Atmospheric Sciences The University of North Carolina at Asheville www.atms.unca.edu 209 Western North Carolina Weather Calendar Climatological
2017 Meteorological and Oceanographic Summary for the Bocas del Toro Research Station. Prepared by: Steven Paton
 0 2017 Meteorological and Oceanographic Summary for the Bocas del Toro Research Station Prepared by: Steven Paton 1 Introduction This is the 5 th of a series of yearly reports summarising the past year
Field Performance Report on PVC Pipe Campbell County
 Transportation Kentucky Transportation Center Research Report University of Kentucky Year 1995 Field Performance Report on PVC Pipe Campbell County L. John Fleckenstein David L. Allen University of Kentucky,
CCoWS. Central Coast Watershed Studies. Summary of Precipitation and Streamflow for Potrero and San Clemente Creeks in Water-Year 2007
 Central Coast Watershed Studies CCoWS Summary of Precipitation and Streamflow for Potrero and San Clemente Creeks in Water-Year 2007 Santa Lucia Preserve Monterey County, California Publication No. WI-2008-01
m ,416 ~ 7 156,745 7 ~ 167,074 t-;'i4
 FORM L5W REV #2 7J9S 4:ti( ';t!il BARGE CBC-7035 NAGE TABLE PORT OR STAR 0 2 t-lli..!!! jg tirl!i r0 r' jq. r..lli r! * 68 --'.. 880 ri,079,278,478 r-j..,759 ri 2,040 2,322 4,22 fl! 4,549 4,878 5,205 2,603
Design Criteria Data
 LAS VEGAS/MCCARRAN NV Latitude = 36.8 N WMO No. 72386 Longitude =115.1 W Elevation = 2179 feet Period of Record = 1973 to 1996 Average Pressure = 27.67 inches Hg Design Criteria Data Mean Coincident (Average)
Section 16 - Julian Date, Cycle and Notice Calendars
 16-1 Section 16 - Julian Date, Cycle and Notice Calendars (BMF Accelerated Paper-Filed Refund Cycle Charts and IDRS Input Tables) 1 Nature of Changes Description Page No. 2013 Posting Cycle Enterprise
2016 Meteorological Summary for the Galeta Marine Island Laboratory. Prepared by: Steven Paton
 0 2016 Meteorological Summary for the Galeta Marine Island Laboratory Prepared by: Steven Paton 1 Introduction This is the fourth in a series of yearly reports summarising the past year s Smithsonian Tropical
2017 Meteorological Summary for the Galeta Marine Island Laboratory. Prepared by: Steven Paton
 0 2017 Meteorological Summary for the Galeta Marine Island Laboratory Prepared by: Steven Paton 1 Introduction This is the 5 th in a series of yearly reports summarising the past year s Smithsonian Tropical
Provisional Review of Fatal Collisions. January to December 31 st 2017
 Provisional Review of Fatal Collisions January to December 31 st 17 2 nd January 18 Review of 17 fatal collision statistics as of 31st December 17 Overview This report summarises the main trends in road
Crane Inspection Log. Mailing Address: P.O. Box Tulsa, OK Phone: (918) Fax: (918)
 Fax: (918)") 999978000 Crane Inspection Log Mailing Address: P.O. Box 581510 Tulsa, OK 74158-1510 Physical Address: 4707 North Mingo Road Tulsa, OK 74117-5904 Phone: (918) 836-0463 Fax: (918) 834-5979 www.autocrane.com
999978000 Crane Inspection Log Mailing Address: P.O. Box 581510 Tulsa, OK 74158-1510 Physical Address: 4707 North Mingo Road Tulsa, OK 74117-5904 Phone: (918) 836-0463 Fax: (918) 834-5979 www.autocrane.com
SNOHOMISH COUNTY PUBLIC UTILITY DISTRICT NO.1. Your Northwest renewables utility
 SNOHOMISH COUNTY PUBLIC UTILITY DISTRICT NO.1 Your Northwest renewables utility May 17, 2013 VIA ELECTRONIC FILING Kimberly D. Bose, Secretary Federal Energy Regulatory Commission (FERC) 888 First Street
Hyslop Field Laboratory Microstation Climate Survey
 [05 REPLACEMENT r--55 no-500 REVISED ED. AVAILABLE /979 (tr J sgo `1\ Hyslop Field Laboratory Microstation Climate Survey LIIRRARY 17:i. OREGON STATE r". 'e-c71 16P/6 UNIVERSITY r,kicq). (Special Report
Dark and light bottle studies in the lower York River, Virginia, June August 1962
 College of William and Mary W&M ScholarWorks Reports 963 Dark and light bottle studies in the lower York River, Virginia, June 96 - August 962 ernard C. Patten D. K. Young Charles L. Rutherford Virginia
Design Criteria Data
 OKLAHOMA CITY OK Latitude = 35.4 N WMO No. 72353 Longitude = 97.6 W Elevation = 133 feet Period of Record = 1973 to 1996 Average Pressure = 28.62 inches Hg Design Criteria Data Mean Coincident (Average)
*iiiii. May 31, 2017 VIA ELECTRONIC FILING
 *iiiii. PUBLIC UTILITY DISTRICT NO. I of CHELAN COUNTY P.O. Box 1231, Wenatchee, WA 98807-1231 327 N. Wenatchee Ave., Wenatchee, WA 98801 (509) 663-8121 Toll free 1-888-663-8121 www.chelanpud.org May 31,
Design Criteria Data
 MEDFORD/JACKSON CO. OR Latitude = 42.37 N WMO No. 72597 Longitude =122.8 W Elevation = 1329 feet Period of Record = 1973 to 1996 Average Pressure = 28.61 inches Hg Design Criteria Data Mean Coincident
NOTE: ALL PRINTED EQUIPMENT OPERATING PROCEDURES ARE CONSIDERED UNCONTROLLED UNLESS STAMPED IN RED: CONTROLLED DOCUMENT.
 EOP 7K01-0011 OPERATION OF AEROBIC DIGESTER AND SPRAY IRRIGATION PROCEDURE 1-11 I. INTRODUCTION II. BACK FLUSHING SPRAY IRRIGATION PUMPS III. PUMPING SLUDGE IV. CLEANING BASKET STRAINERS V. APPENDIX A
CCoWS. Central Coast Watershed Studies. Summary of Precipitation and Streamflow for Potrero and San Clemente Creeks in Water-Year 2008
 Central Coast Watershed Studies CCoWS Summary of Precipitation and Streamflow for Potrero and San Clemente Creeks in Water-Year 2008 Santa Lucia Preserve Monterey County, California Publication No. WI-2009-01
Design Criteria Data
 DES MOINES IA Latitude = 41.53 N WMO No. 72546 Longitude = 93.65 W Elevation = 965 feet Period of Record = 1973 to 1996 Average Pressure = 28.96 inches Hg Design Criteria Data Mean Coincident (Average)
ALBENI FALLS DAM AND LAKE PEND OREILLE
 ALBENI FALLS DAM AND LAKE PEND OREILLE Fall Public Meeting 237 237 237 217 217 217 200 200 200 0 0 0 163 163 163 131 132 122 Aug. 7, 2017 255 255 255 239 65 53 80 119 27 252 174.59 83 36 118 110 135 120
Within the service area of the District from lines of 115,000 volts or 34,500 volts.
 Rate Schedule LP-4 Lo u p La r g e Li g h t a n d Po w e r - Su b t r a n s m i s s i o n De l i v e r y w i t h Cu s t o m e r Ge n e r a t i o n Un d e r Buy/Sell Concept Loup River Public Power District
Design Criteria Data
 PHOENIX/SKY HARBOR AZ Latitude = 33.43 N WMO No. 72278 Longitude =112. W Elevation = 116 feet Period of Record = 1973 to 1996 Average Pressure = 28.72 inches Hg Design Criteria Data Mean Coincident (Average)
Design Criteria Data
 JACKSONVILLE FL Latitude = 3.5 N WMO No. 7226 Longitude = 81.7 W Elevation = 3 feet Period of Record = 1973 to 1996 Average Pressure = 3.1 inches Hg Design Criteria Data Mean Coincident (Average) Values
City Of London Environmental & Engineering Services Department Wastewater Treatment Operations
 City Of London Environmental & Engineering Services Department Wastewater Treatment Operations Greenway Wastewater Treatment Centre 2016 Annual Report February 2017 Page 1 of 96 SUMMARY This annual report
Design Criteria Data
 MINNEAPOLIS-ST PAUL MN Latitude = 44.88 N WMO No. 72658 Longitude = 93.22 W Elevation = 837 feet Period of Record = 1973 to 1996 Average Pressure = 29.7 inches Hg Design Criteria Data Mean Coincident (Average)
Design Criteria Data
 DULUTH MN Latitude = 46.83 N WMO No. 72745 Longitude = 92.18 W Elevation = 1417 feet Period of Record = 1973 to 1996 Average Pressure = 28.43 inches Hg Design Criteria Data Mean Coincident (Average) Values
2017 Adjusted Count Report February 12, 2018
 A statewide multi-use trail user study and volunteer data collection program 2017 Adjusted Count Report February 12, 2018 The following report includes the final adjusted infrared (IR) counter data at
Field Test Results of Green Roofs, Cool Roofs, and Conventional Roofs CNY Engineering Expo Oncenter, Syracuse, NY November 9, 2015
 Field Test Results of Green Roofs, Cool Roofs, and Conventional Roofs CNY Engineering Expo Oncenter, Syracuse, NY November 9, 2015 Hugh I. Henderson, Jr. P.E CDH Energy Corp. Cazenovia, NY Project Goals
Design Criteria Data
 CHICAGO/O HARE IL Latitude = 41.98 N WMO No. 7253 Longitude = 87.9 W Elevation = 673 feet Period of Record = 1967 to 1996 Average Pressure = 29.27 inches Hg Design Criteria Data Mean Coincident (Average)
Georgia Pacific Crossett Operations Hydrogen Sulfide and Meteorological Monitoring Program
 Results you can rely on Georgia Pacific Crossett Operations Hydrogen Sulfide and Meteorological Monitoring Program 6-Month Report for October 1, 2014 through March 31, 2015 TRC Project Number: 222437.0000.0000
A Lucky Numbers Numerology Chart Analysis. for. John Hancock. Hans Decoz. Birth data: John Peter Hancock. Copyright 1985, 2003, Hans Decoz.
 A Lucky Numbers Numerology Chart Analysis for John Hancock by Hans Decoz Birth data: John Peter Hancock June 8, 1992 Copyright 1985, 2003, Hans Decoz. INTRODUCTION An Introduction to Lucky Numbers Why
Appendix N. The 2006 Fish Passage Implementation Plan
 Appendix N The 2006 Fish Passage Implementation Plan 2006 Fish Passage Implementation Plan March 31, 2006 Background: The 2006 Fish Passage Implementation Plan describes the Corps plan for fish passage
NORTHEAST NEBRASKA PUBLIC POWER DISTRICT RATE SCHEDULE LP-2 Large Power Service. Effective: For bills rendered on and after January 1, 2014.
 NORTHEAST NEBRASKA PUBLIC POWER DISTRICT RATE SCHEDULE LP-2 Large Power Service Effective: For bills rendered on and after January 1, 2014. SECTION 1. AVAILABILITY AND APPLICABILITY 1.1 This Rate Schedule
Action Requested From AMWG
 Action Requested From AMWG NONE, These Two Presentations Are For Information Transfer Only The information is derived from a multi-year synthesis research effort related to existing data on flow, sediment-transport
Revising the Historic Monthly Mean Niagara River Flow at Buffalo to Reflect Better Estimates of Maid-of-the-Mist Pool Outflows
 Revising the Historic Monthly Mean Niagara River Flow at Buffalo to Reflect Better Estimates of Maid-of-the-Mist Pool Outflows 1961-2007 Background The Niagara River flow at Buffalo is currently computed
Design Criteria Data
 BURLINGTON VT Latitude = 44.47 N WMO No. 72617 Longitude = 73.15 W Elevation = 341 feet Period of Record = 1973 to 1996 Average Pressure = 29.61 inches Hg Design Criteria Data Mean Coincident (Average)
Design Criteria Data
 RAPID CITY SD Latitude = 44.5 N WMO No. 72662 Longitude =3. W Elevation = 3169 feet Period of Record = 1973 to 1996 Average Pressure = 26.67 inches Hg Design Criteria Data Mean Coincident (Average) Values
Design Criteria Data
 COLUMBIA SC Latitude = 33.95 N WMO No. 7231 Longitude = 81.12 W Elevation = 226 feet Period of Record = 1973 to 1996 Average Pressure = 29.8 inches Hg Design Criteria Data Mean Coincident (Average) Values
Design Criteria Data
 PHILADELPHIA PA Latitude = 39.88 N WMO No. 7248 Longitude = 75.25 W Elevation = 3 feet Period of Record = 1973 to 1996 Average Pressure = 29.98 inches Hg Design Criteria Data Mean Coincident (Average)
Design Criteria Data
 MACON/LEWIS WILSON GA Latitude = 32.7 N WMO No. 72217 Longitude = 83.65 W Elevation = 361 feet Period of Record = 1973 to 1996 Average Pressure = 29.66 inches Hg Design Criteria Data Mean Coincident (Average)
Design Criteria Data
 HONOLULU/OAHU HI Latitude = 21.35 N WMO No. 91182 Longitude =157.9 W Elevation = 16 feet Period of Record = 1967 to 1996 Average Pressure = 29.96 inches Hg Design Criteria Data Mean Coincident (Average)
Design Criteria Data
 PIERRE SD Latitude = 44.38 N WMO No. 726686 Longitude =1.2 W Elevation = 1742 feet Period of Record = 1973 to 1996 Average Pressure = 28.1 inches Hg Design Criteria Data Mean Coincident (Average) Values
Design Criteria Data
 INDIANAPOLIS IN Latitude = 39.73 N WMO No. 72438 Longitude = 86.27 W Elevation = 87 feet Period of Record = 1973 to 1996 Average Pressure = 29.15 inches Hg Design Criteria Data Mean Coincident (Average)
Design Criteria Data
 ANCHORAGE AK Latitude = 61.17 N WMO No. 7273 Longitude =15. W Elevation = 131 feet Period of Record = 1973 to 1996 Average Pressure = 29.6 inches Hg Design Criteria Data Mean Coincident (Average) Values
Design Criteria Data
 DENVER/STAPLETON CO Latitude = 39.75 N WMO No. 72469 Longitude =14.8 W Elevation = 5332 feet Period of Record = 1973 to 1995 Average Pressure = 24.66 inches Hg Design Criteria Data Mean Coincident (Average)
11. Electrical energy tariff rating
 799 11. Electrical energy tariff rating 800 11. ELECTRICAL ENERGY TARIFF RATING There is no universal system for billing electrical energy. Each country generally adopts its own method, taking into account
Giant foxtail was effectively control with all PRE/POST and total POST treatments, 99 percent control (9/21 rating date).
.") Comparison of PRE/POST and POST only Weed Control Systems in Liberty Link Soybeans at Rochester, MN, in 2011. Breitenbach, Fritz R., Lisa M. Behnken, Ryan P. Miller, Adam Hazel and Bo Beyer The objective
Comparison of PRE/POST and POST only Weed Control Systems in Liberty Link Soybeans at Rochester, MN, in 2011. Breitenbach, Fritz R., Lisa M. Behnken, Ryan P. Miller, Adam Hazel and Bo Beyer The objective
Design Criteria Data
 SPOKANE WA Latitude = 47.63 N WMO No. 72785 Longitude =117.5 W Elevation = 2366 feet Period of Record = 1973 to 1996 Average Pressure = 27.5 inches Hg Design Criteria Data Mean Coincident (Average) Values
The Economic Downturn Lessons on the Correlation between Economic Growth and Energy
 The Economic Downturn Lessons on the Correlation between Economic Growth and Energy Demand presented to Indiana State Bar Association Utility Law Spring Seminar April 9, 2010 presented by Doug Gotham State
Design Criteria Data
 LOUISVILLE/STANDIFORD KY Latitude = 38.18 N WMO No. 72423 Longitude = 85.73 W Elevation = 489 feet Period of Record = 1973 to 1996 Average Pressure = 29.49 inches Hg Design Criteria Data Mean Coincident
Design Criteria Data
 DAYTON/JAMES M COX OH Latitude = 39.9 N WMO No. 72429 Longitude = 84.2 W Elevation = 14 feet Period of Record = 1973 to 1996 Average Pressure = 28.95 inches Hg Design Criteria Data Mean Coincident (Average)
Design Criteria Data
 SPRINGFLD MO Latitude = 37.23 N WMO No. 7244 Longitude = 93.38 W Elevation = 127 feet Period of Record = 1973 to 1996 Average Pressure = 28.66 inches Hg Design Criteria Data Mean Coincident (Average) Values
YMCA SWIM SCHEDULE. Pearson Park Summer 2018 NEW! ANAHEIM FAMILY YMCA 240 S. Euclid St., Anaheim, CA P: W: anaheimymca.
 YMCA SWIM SCHEDULE Pearson Park Summer 2018 Sessions (Monday-Thursday) Session 1 Session 2 Session 3 Session 4 Session 5 Session Dates: 6/4-6/14 6/18-6/28 7/2-7/12 7/16-7/26 7/30-8/9 Online Registration:
Design Criteria Data
 BIRMINGHAM AL Latitude = 33.57 N WMO No. 72228 Longitude = 86.75 W Elevation = 63 feet Period of Record = 1973 to 1996 Average Pressure = 29.36 inches Hg Design Criteria Data Mean Coincident (Average)
Who has trouble reporting prior day events?
 Vol. 10, Issue 1, 2017 Who has trouble reporting prior day events? Tim Triplett 1, Rob Santos 2, Brian Tefft 3 Survey Practice 10.29115/SP-2017-0003 Jan 01, 2017 Tags: missing data, recall data, measurement
Design Criteria Data
 BOSTON/LOGAN MA Latitude = 42.37 N WMO No. 7259 Longitude = 71.3 W Elevation = 3 feet Period of Record = 1967 to 1996 Average Pressure = 29.95 inches Hg Design Criteria Data Mean Coincident (Average) Values
Design Criteria Data
 MIDLAND TX Latitude = 31.95 N WMO No. 72265 Longitude =2. W Elevation = 2861 feet Period of Record = 1973 to 1996 Average Pressure = 27.3 inches Hg Design Criteria Data Mean Coincident (Average) Values
Design Criteria Data
 NEW YORK/JOHN F KENNEDY NY Latitude = 4.65 N WMO No. 74486 Longitude = 73.78 W Elevation = 23 feet Period of Record = 1973 to 1996 Average Pressure = 29.98 inches Hg Design Criteria Data Mean Coincident
Design Criteria Data
 WASHINGTON/DULLES VA Latitude = 38.95 N WMO No. 7243 Longitude = 77.45 W Elevation = 322 feet Period of Record = 1973 to 1996 Average Pressure = 29.68 inches Hg Design Criteria Data Mean Coincident (Average)
Marlborough Lines Limited Electricity Line Charges from 1 April 2014
 consumer. For more information visit http://www.marlboroughlines.co.nz/about-us/disclosures.aspx Marlborough Lines Limited Electricity Line Charges Marlborough Lines Limited Electricity Line Charges Marlborough
Design Criteria Data
 LANDER/HUNT WY Latitude = 42.82 N WMO No. 72576 Longitude =18.7 W Elevation = 5558 feet Period of Record = 1973 to 1996 Average Pressure = 24.44 inches Hg Design Criteria Data Mean Coincident (Average)
Design Criteria Data
 ALBUQUERQUE NM Latitude = 35.5 N WMO No. 72365 Longitude =16.6 W Elevation = 5315 feet Period of Record = 1967 to 1996 Average Pressure = 24.72 inches Hg Design Criteria Data Mean Coincident (Average)
Design Criteria Data
 MINOT AFB ND Latitude = 48.42 N WMO No. 727675 Longitude =11.3 W Elevation = 1667 feet Period of Record = 1967 to 1996 Average Pressure = 28.16 inches Hg Design Criteria Data Mean Coincident (Average)
Design Criteria Data
 CHARLESTON/KANAWHA WV Latitude = 38.37 N WMO No. 72414 Longitude = 81.6 W Elevation = 981 feet Period of Record = 1973 to 1996 Average Pressure = 29. inches Hg Design Criteria Data Mean Coincident (Average)
COTTONWOOD COUNTY Independent School District No. 177, Windom. An Inventory of Its Records
 MINNESOTA HISTORICAL SOCIETY Minnesota State Archives COTTONWOOD COUNTY Independent School District No. 177, Windom An Inventory of Its Records OVERVIEW OF THE RECORDS Agency: Minnesota. Independent School
Determination of Monthly Means of Daily Solar Radiation and its Variability: A Summary (continued)
") Introduction Section 5.3 MONTHLY MEANS OF DAILY SOLAR RADIATION AND ITS VARIABILITY R.E. Schulze, M. Maharaj and R.D. Chapman The maps and statistics of solar radiation in this Section supersede the ones
Introduction Section 5.3 MONTHLY MEANS OF DAILY SOLAR RADIATION AND ITS VARIABILITY R.E. Schulze, M. Maharaj and R.D. Chapman The maps and statistics of solar radiation in this Section supersede the ones
2016 Yukon Wildland Fires Overview
 2016 Y ill Fis vviw l 1:5,000,000 0 50 100 200 300 400 500 bs q jti (st llls: 61 40' & 68 00') 117 117 li A f Itst Fi I i tbl (F t l) *t tis t sts gfig ifti i Ab Abt 9.0 ig 117B 117A 116 l w 116 116 106
FILED: NEW YORK COUNTY CLERK 12/22/ :56 PM INDEX NO /2016 NYSCEF DOC. NO. 28 RECEIVED NYSCEF: 12/22/2017
 FLED: NEW YORK COUNTY CLERK 12/22/2017 01:56 PM NDEX NO. 159297/2016 NYSCEF DOC. NO. 28 RECEVED NYSCEF: 12/22/2017 FLED: NEW YORK COUNTY CLERK 12/22/2017 01:56 PM NDEX NO. 159297/2016 NYSCEF DOC. NO. 28
Presented by Eric Englert Puget Sound Energy September 11, 2002
 Results from PSE s First Year of Time of Use Program Presented by Eric Englert Puget Sound Energy September 11, 2002 Puget Sound Energy Overview 973,489 Total Electric Customers 908,949 are AMR Capable
Design Criteria Data
 MADISON/DANE CO. RGNL WI Latitude = 43.13 N WMO No. 72641 Longitude = 89.33 W Elevation = 866 feet Period of Record = 1973 to 1996 Average Pressure = 29.5 inches Hg Design Criteria Data Mean Coincident
NORTHEAST NEBRASKA PUBLIC POWER DISTRICT RATE SCHEDULE LP-2 Large Power Service. Effective: For bills rendered on and after February 1, 2019.
 NORTHEAST NEBRASKA PUBLIC POWER DISTRICT RATE SCHEDULE LP-2 Large Power Service Effective: For bills rendered on and after February 1, 2019. SEDC:60/7/8/9 SECTION 1. AVAILABILITY AND APPLICABILITY 1.1
Design Criteria Data
 RENO/CANNON INTL NV Latitude = 39.5 N WMO No. 72488 Longitude =119.7 W Elevation = 44 feet Period of Record = 1973 to 1996 Average Pressure = 25.57 inches Hg Design Criteria Data Mean Coincident (Average)
Cost Reflective Tariffs
 Cost Reflective Tariffs for Large Government,Commercial and Industrial Customers Customer Guide Introduction On September 2016, the Council of Ministers had approved the introduction Cost of Reflective
TABLE C-42. Sales and inventories in manufacturing and trade, [Amounts in millions of dollars] Manufacturing. Inventories Ratio 3.
![TABLE C-42. Sales and inventories in manufacturing and trade, [Amounts in millions of dollars] Manufacturing. Inventories Ratio 3.](/thumbs/80/81413912.jpg "TABLE C-42. Sales and inventories in manufacturing and trade, [Amounts in millions of dollars] Manufacturing. Inventories Ratio 3.") 1970 TABLE C-4. and inventories in manufacturing, 1947-69 Inyentories i 1947 1948 1949 1950 1951 195 1953 1954 1955 1956 1957 1958 1959 35,60 54,33 5,507 59,8 70,4 7,377,1 89,05 86,9 1.4 16,16 1,714,59
1970 TABLE C-4. and inventories in manufacturing, 1947-69 Inyentories i 1947 1948 1949 1950 1951 195 1953 1954 1955 1956 1957 1958 1959 35,60 54,33 5,507 59,8 70,4 7,377,1 89,05 86,9 1.4 16,16 1,714,59
Season Totals by Port for All Weeks
 Salmon Fishery Estimates for the Area from Cape Falcon to the Oregon/California Border No. Fish Harvested No. Fish Released Retained Catch Port Per Garibaldi 6,372 2,206 697 1,213 125 0.46 Pacific City
Friction Factor Tests on High Density Polyethylene Pipe
 Utah State University DigitalCommons@USU Reports Utah Water Research Laboratory January 1988 Friction Factor Tests on High Density Polyethylene Pipe Steven L. Barfuss J. Paul Tullis Follow this and additional
2 nd. Monitoring period: 01/01/ /12/2011. Version 2.0. June 20, Climate Bridge Ltd.
 VGS Emission Reductions Monitoring Report Gansu Nanyangshan 1.26MW Hydropower Project (GS 547) 2 nd Monitoring period: 01/01/2010-31/12/2011 Version 2.0 June 20, 2012 Climate Bridge Ltd. 1. Introduction
University of Central Florida Police Department. Traffic Statistical Report
 University of Central Florida Police Department Traffic Statistical Report 214-216 Richard Beary, Chief of Police Report completed January 11, 216 The University of Central Florida, home to the UCF Knights,
Owner letters will be mailed based upon part number and production date, starting with earlier production vehicles.
 TO: ALL TOYOTA DEALER PRINCIPALS, SERVICE MANAGERS, PARTS MANAGERS SUBJECT: SPECIAL SERVICE CAMPAIGN (SSC) 50J PHASE 1 (FRONT SUSPENSION LOWER BALL JOINT) As announced in May, 2005, Toyota will initiate
Airworthiness Directive
 Airworthiness Directive AD No.: 2018-0060R1 Issued: 19 July 2018 EASA AD No.: 2018-0060R1 Note: This Airworthiness Directive (AD) is issued by EASA, acting in accordance with Regulation (EC) 216/2008 on
SeagrassNet Monitoring in Great Bay, New Hampshire, 2016
 University of New Hampshire University of New Hampshire Scholars' Repository PREP Reports & Publications Institute for the Study of Earth, Oceans, and Space (EOS) 9-28-2017 SeagrassNet Monitoring in Great
NPCC Natural Gas Disruption Risk Assessment Background. Summer 2017
 Background Reliance on natural gas to produce electricity in Northeast Power Coordinating Council (NPCC) Region has been increasing since 2000. The disruption of natural gas pipeline transportation capability
3. Atmospheric Supply of Nitrogen to the Baltic Sea in 2009
 3. Atmospheric Supply of Nitrogen to the Baltic Sea in 2009 Nitrogen emission data, as well as the model results presented here have been approved by the 35 th Session of the Steering Body of EMEP in Geneva
METRO Light Rail Update
 American Society of Highway Engineers METRO Light Rail Update Brian Buchanan Director, Design and Construction October 13, 2009 1 High Capacity Transit System 2 20-Mile Light Rail Line 3 Operations Operations
FOR IMMEDIATE RELEASE
 Article No. 5842 Available on www.roymorgan.com Roy Morgan Unemployment Profile Thursday, 2 October 2014 Unemployment climbs to 9.9% in September as full-time work lowest since October 2011; 2.2 million