Star Rating Roads for Safety Results for Consultation with Stakeholders SLOVENIA
|
|
|
- Randolf Simon
- 5 years ago
- Views:
Transcription


1 Star Rating Roads for Safety Results for Consultation with Stakeholders SLOVENIA
2 The SENSoR Project About SENSOR The road infrastructure of a country not only serves the basic need for safe transport of people and goods but is also considered vital for its growth and development. Decisions for public and private investments, related to these infrastructures must take into consideration the overall level of their safety capacity in a measurable way. Road traffic injuries are a global, man-made and preventable epidemic with a health burden on the scale of HIV/AIDS and Malaria. According to the World Health Organization, about 1.24 million people die every year as a result of road traffic crashes, while the annual number of road deaths worldwide is projected to increase to about 2.4 million by Specifically in the European Union, more than persons were killed and about 1,5 million persons were injured in more than 1,1 million car accidents. On this basis, the United Nations announced in 2010 the Global Plan for the Decade of Action for Road Safety The Plan encourages countries and stakeholders to implement actions that contribute to the reduction of the forecasted road fatalities rate. The categories of activities (pillars) that the Plan proposes as focusing areas are: building road safety management capacity; improving the safety of road infrastructure and broader transport networks; further developing the safety of vehicles; enhancing the behaviour of road users; and improving post-crash care. Focusing on the Infrastructure pillar, the countries should be able to assess the safety capacity of the road network for all road users and further implement infrastructure improvements through targeted investment programs. Moreover, the European Directive 2008/96/EC on Road Safety Infrastructure Management provided the requirements for safety management of the Trans-European Road Network that include Road Safety Inspection, Safety Ranking and Audits, suggesting investments on road sections with the highest number of collisions and/or the highest collision reduction potential. Within this framework the South East Neighbourhood Safe Routes (SENSoR) project has taken safety rating to the next level moving from measurement to action by assessing the risks that road users face from infrastructure and by identifying the potential improvements that can save the most lives for the money available. To do so, the Project Partners applied the latest tools of the International Road Assessment Programme (irap), a charity supporting countries and financial institutions worldwide during the UN Decade. The results give GPSmapped sites where improvements, often as simple as barriers, school crossings or roadside hazard clearance, can make the difference. SENSoR builds on outstanding cooperation between automobile clubs, universities and road authorities. Having been co-financed by the South East Europe (SEE) Transnational Cooperation Programme and the European Union, the 2-year project brought together 14 countries Greece, Slovakia, Hungary, Slovenia, Republic of Moldova, Serbia, Former Yugoslav Republic of Macedonia, Bosnia and Herzegovina, Croatia, Albania, Montenegro, Bulgaria, Romania and Ukraine. The project was launched in September 2012 and finished in September It included the road inspection, coding, analyses and reporting of RAP road safety assessments of almost kms in the above mentioned countries. The current report presents the Star Rating results for 3,152 kms part of the major road network in Slovenia. The assessment was performed by AMZS/UL FGG-PTI, which is an accredited RAP supplier. For more information, contact UL FGG-PTI (info-pti@fgg.uni-lj.si).

3 SENSoR Star Rating Coverage Figure 1: SENSoR Star Rating Coverage Map
4 [Page intentionally left blank]
5 Contents 1 Introduction Road Assessment in Slovenia Results for consultation with stakeholders The RAP Method Measuring the road infrastructure safety The Star Rating process Developing the Safer Road Investment Plans (SRIPs) The inspected road network Coverage and basic characteristics Details of the recorded road attributes Data collection and coding Road Survey Quality Assurance procedure provided by RoadSafety Foundation for Star RatingRoad Survey Equipment Coding Team Data coding Traffic Volume Pedestrian and Bicycle volume Operating Speed Crash Data Countermeasures costs Economic data Star Rating Results Overall Star Ratings Results Star Rating results Motorways/Expressways Star Rating results Main/Regional roads Detailed Star Ratings Results Motorways and Expressways Main and Regional Roads Safer Roads Investments Plan (SRIP) Overall SRIP Results Overall SRIP Results Motorways/Expressways Overall SRIP Results Main/Regional roads Detailed SRIP Results Motorway AC-A3 Sežana Gabrk Regional road R1-204 Nova Gorica Sežana... 62
6 6 Tailoring SRIP for a specific road section Conclusions Annex 1 Traffic Volume Annex 2 Operating speed Annex 3 Countermeasure costs Annex 4 Minimum 3-star safety rating standard
 part of the major road network in Slovenia. These results are only a part of the analysis of almost 16.")
7 1 Introduction 1.1 Road Assessment in Slovenia The current report presents the Star Rating results for a 3,152 kms (official section lengths) - 3,186.3 km (from RoadSurvey and ViDA software) part of the major road network in Slovenia. These results are only a part of the analysis of almost km of the TEN-T road network in 14 countries in South East Europe, which was performed within the framework of the SENSoR Project. In Slovenia, according to the World Health Organization, the number of road fatalities is about 125 (2013) and 130 (2012) per year, the number of serious injuries is about 708 (2013) and the estimated Gross Domestic Product loss due to road traffic crashes reaches the 1.36% in 2013 (Source: AVP). The Road Fatalities Rate in Slovenia is 6.1 per people. Figure 2: Road Fatalities per people 1.2 Results for consultation with stakeholders This report is presented as results for consultation with stakeholders because the SENSoR Project Partners wish to discuss with those who influence the safety of roads and road infrastructure the detail of these surveys and the priorities and possibilities for investing to save lives and serious injuries. The results are based upon surveys carried out between [April 2013 and September 2014] and upon data collected at other times and with the support of Project Partners, government and police agencies. The SENSoR project is grateful for this support. An outcome of the SENSoR project is that the individual participating countries now have a Safer Roads Investment Plan which may be used to prioritise spending on crash countermeasures. This Plan is not a bill of works and it and the assumptions used in the model must be carefully assessed by local engineers and others who have contributed to the Page 3
8 work or who have a legitimate interest in the roads. In particular, they must assess such features as the value of life and injury used in the work, the data used in estimating injury savings, traffic volumes, countermeasure costs and operating speed on the network. The data for the SENSoR surveys are held in irap s ViDA software. In circumstances where the printed output differs from that held in ViDA, the material held within the software takes precedence. The printed report provides the results of the survey and also gives an entry-level guide to the software and the analysis possibilities that are available within it. Any changes in the modelling assumptions, coding corrections, minor model changes or differences in the presentation of results (such as rounding) will always be reflected in results held in the ViDA software. 1.3 The RAP Method The protocols used here were developed by the International Road Assessment Programme (irap). irap is a registered charity dedicated to saving lives through safer roads. irap provides tools and training to help countries make roads safe. Its activities include: inspecting high-risk roads and developing Star Ratings, Safer Roads Investment Plans and Risk Maps providing training, technology and support that will build and sustain national, regional and local capability tracking road safety performance so that funding agencies can assess the benefits of their investments. The programme is the umbrella organisation for EuroRAP, AusRAP, usrap, KiwiRAP and ChinaRAP. Road Assessment Programmes (RAP) are now active in more than 70 countries throughout Europe, Asia Pacific, North, Central and South America and Africa. irap is financially supported by the FIA Foundation for the Automobile and Society and the Road Safety Fund. Projects receive support from the Global Road Safety Facility, automobile associations, regional development banks and donors. National governments, automobile clubs and associations, charities, the motor industry and institutions such as the European Commission also support RAPs in the developed world and encourage the transfer of research and technology to irap. In addition, many individuals donate their time and expertise to support irap. irap is a member of the United Nations Road Safety Collaboration. The main objective of the RAP method is the improvement of the road users safety by proposing cost-effective investment plans. The most crucial point in the RAP is that engineers and planners in developed countries have for over twenty years adopted an underlying philosophy of designing a forgiving road system to minimize the chances of injuries when road users make mistakes that result in crashes. The method indicates that the severity of a road accident can be reduced through the intervention at the sequence of events happening during this accident. As it is known, an injury accident results from a chain of events, starting with an initial event, probably resulting from several factors, which leads to a dangerous situation. The basic idea is to intervene at any point of this chain, in order to reduce the kinetic energy of all road users who are involved in the accident to a tolerable level. Such an intervention may not only reduce the number of accidents but also the severity of injuries. The initial step for the implementation of the RAP method is the inspection and record of the infrastructure elements of a road network, which relate to the road safety. The record leads to the quantification of the safety that a road section provides to its users by awarding safety scores (Star Rating Scores). The Star Rating Scores express the safety capacity of a road Page 4
9 section in a 5-Stars scale. This quantification aims to identifying the most appropriate countermeasures, which will increase the infrastructure s road safety score. The Safer Roads Investment Plan (SRIP) includes all the countermeasures proved able to provide the greater safety capacity and maximize the benefit over spent cost of the planned investments. Thus, the SRIPs are considered as a valuable tool for the authorities, stakeholders and investors in order to decide for the most cost-effective and efficient road infrastructure investments Measuring the road infrastructure safety The assessment of the road safety requires the Road Safety Inspections of the road network sections and the assignment of a safety score to them. The inspection is conducted by visual observation and record of the road infrastructure elements which are related -directly or not- to road safety and have a proven influence on the likelihood of an accident or its severity. The RAP uses two types of inspection; the drive-through and the video-based inspection. During the first one, the record of the infrastructure s elements is performed manually, with the help of specialized software, while during the second, a specially equipped vehicle is used, so as the recorded video to be used for a virtual drive-through of the network and an automated identification of the infrastructure s elements. Following the RSI, the Road Protection Score (RPS) is calculated. The RPS is a unit-less indicator, which depicts the infrastructure s safety capacity for each road user type and it is calculated for 100m road segments. Road user types are considered the car occupants, the motorcyclists, the bicyclists and the pedestrians, who may be involved in road accidents. For each road user type and for 100m road segmentation the respective RPS is calculated as follows: RPS = RPS = L * S * OS * EFI * MT n,u n,u,c n,u,c n,u,c n,u,c n,u,c n,u,c c c where n is the number of 100m road segment, u the type of road user and c the crash type that the road user type u may be involved in. The following variables are taken into consideration: L: the Likelihood that the i crash may be initiated, S: the Severity of the i crash, OS: the degree to which risk changes with the Operating Speed for the specific i crash type, EFL: the degree to which a person s risk of being involved in the i type of crash is a function of another person s use of the road (External Flow Influence), MT: the potential that an errant vehicle will cross a median (Median Traversability) The Star Rating process The aim of the Star Rating process is the award of the n 100m road segments with Stars, depicting the safety offered to each of the u road users types. The Star Rating system uses the typical international practice of recognising the best performing category as 5-star and the worst as 1-star (5 stars scale), so that a 5-star road means that the probability of a crash occurrence, which may lead to death or serious injury is very low. The Star Rate is determined by assigning each RPS calculated to the Star Rating bands. The thresholds of each band are different for each road user and were set following significant sensitivity testing to determine how RPS varies with changes in road infrastructure elements. The assignment procedure leads to the development of a risk-worm chart, which depicts the variation of the RPS score in relation to the position (distance from the beginning) on the road under consideration. The final output of the Star Rating is the Star Rating Maps, in which the n road sections are shown with different colour, depending on their Star award (5-star green and 1-star black). Page 5
10 1.3.3 Developing the Safer Road Investment Plans (SRIPs) The development of the most appropriate SRIP presupposes the assessment of the number of fatalities and serious injuries that could be prevented for each 100m road segment on an annual basis when a set of countermeasures is applied. The number of fatalities is calculated as follows: F n= u where n is the number of the 100m road segment, u the type of road user, c the crash type that the road user u may be involved in and F the number of fatalities that can be prevented on a time period of 20 years, given that a specific set of countermeasures is applied. The number is related to four main factors: (1) the safety score of the specific road segment, (2) the u road users flow, (3) the fatality growth, which indicates the underlying trend in road fatalities and (4) the calibration factor, which inserts the actual number of fatalities that occur in the specific road section. The calculation of this factor presupposes the existence of similar crash data. The assessment of the number of serious injuries that could be prevented for a 100m road segment is a function of the Fn,u,c value and the ratio of the actual number of serious injuries to the actual number of fatalities to the relevant number of fatalities. In case of lack of appropriate data, the competent authorities should estimate this actual number as previously, or the ratio of 10 serious injuries to 1 death is used, which is proposed by McMahon et al. in [19]. The next step in establishing the SRIPs is the identification of the most appropriate countermeasures. Countermeasures are the engineering improvements that the road authorities should take so as to reduce the fatalities and serious injuries rates. Each countermeasure is characterized by its trigger sets and its effectiveness for each of the 100m road segments. Each trigger set describes all the cases in which this certain countermeasure can be used. The effectiveness is calculated according to the number of fatalities and serious injuries that can be prevented in this segment and the RPS of this segment before and after the application of the countermeasure. It is important to mention that in the case that multiple countermeasures act on a certain road segment, the total effectiveness is not the simple sum of each countermeasure s effectiveness. Instead, a reduction factor should act, which calibrates the total effectiveness. The procedure of selecting the most appropriate countermeasures is the basis for the technoeconomic analysis of the investment plan and aims to the calculation of the Benefit-Cost ratio (BCR) for each countermeasure. The economic benefit is considered as the benefit of preventing a death or a serious injury. The calculations are conducted following the assumption that the cost of a human life is 70 times the GDP per capita, the cost of a serious injury is the 25% of the cost of a human life and the ratio of 10 serious injuries for 1 death, if more accurate information is not available. The countermeasure cost includes all the construction costs, the maintenance costs over a 20 year period and/or probable reconstruction costs. All the benefits/costs should reflect the actual local prices, taking into account the economic life of each countermeasure and the discount rate. The outcome of this procedure is the BCR calculation for each countermeasure applied to a specific road segment. The SRIP is conducted for a period of 20 years and shows the list of the most cost effective improvements that are able to reduce the crash risk for all road user types. In that way the SRIP enables the road authorities to set the priorities properly when developing infrastructure s maintenance and/or rehabilitation plans. c F n,u,c Page 6
11 2 The inspected road network Coverage and basic characteristics The inspected road network in Slovenia is a part of the TEN-T network (1,041 km of motorways and expressways). The following Table presents the roads and sections inspected, along with the dates that the survey took place. Road Section Type (Divided/ Undivided) From-To Length (km) Date of inspection A Divided Meja A(Predor)-Hrušica A Divided Hrušica-Lipce A Divided Lipce-Lesce A Divided Lesce-Brezje A Divided Brezje-Podtabor A Divided Podtabor-Kranj Z A Divided Kranj Z-Kranj V A Divided Kranj V-Brnik A Divided Brnik-Vodice A Divided Vodice-Lj(Šmartno) A Divided Lj(Šmartno-Brod) A Divided Lj(Brod-Šentvid) A Divided Šentvid - Koseze A Divided Lj(Koseze-Brdo) A Divided Lj(Brdo-Kozarje) A Divided Lj(Vič-Kozarje) A Divided Lj(Barjanska-Vič) A Divided Lj(Dolenjska-Barjanska) A Divided Lj (Malence-Dolenjska C.) A Divided Lj(Malence)-Šmarje-Sap A Divided Šmarje Sap-Grosuplje A Divided Grosuplje-Ivančna Gorica A Divided Ivančna Gorica-Bič A Divided Trebnje-Novo Mesto A Divided Novo Mesto-Kronovo A Divided Kronovo-Dobruška Vas A Divided Dobruška Vas-Drnovo A Divided Drnovo-Brežice A Divided Brežice-Obrežje A Divided Meja A-Šentilj A Divided Šentilj-Pesnica H Divided Pesnica-Maribor H Divided Maribor-Tezno A Divided Slivnica A Divided Slivnica-Fram A Divided Fram-Sl.Bistrica A Divided Sl.Bistrica-Sl.Konjice A Divided Sl.Konjice-Dramlje A Divided Dramlje-Celje A Divided Celje-Arja Vas A Divided Arja Vas-Šentrupert A Divided Šentrupert-Vransko A Divided Vransko-Trojane A Divided Blagovica-Krtina A Divided Krtina-Domžale Page 7
12 A Divided Domžale-Šentjakob A Divided Šentjakob-Lj(Zadobrova) A Divided Lj(Zadobrova-Zaloška) A Divided Lj(Zaloška-Litijska) A Divided Lj(Litijska-Malence) A Divided Lj(Kozarje)-Brezovica A Divided Brezovica-Vrhnika A Divided Vrhnika-Logatec A Divided Logatec-Unec A Divided Unec-Postojna A Divided Postojna-Razdrto A Divided Razdrto-Senožeče A Divided Senožeče-Gabrk A Divided Gabrk-Divača A Divided Divača-Kozina A Divided Kozina-Črni Kal A Divided Črni Kal-Srmin A Divided Pesnica - Dragučova A Divided Maribor(Ptujska)-Slivnica A Divided Trojane-Blagovica A Divided Gabrk-Sežana V A Divided Sežana V-Sežana Z A Divided Sežana Z-Fernetiči A Divided Dragučova - Mb (Ptujska) A Divided Bič-Trebnje H Divided Lj(Zadobrova-Šmartinska) H Divided Lj(Šmartinska-Tomačevo) Divided Lj(Črnuče-Tomačevo) H Divided Lj(Tomačevo-Dunajska) H Divided Lj(Dunajska-Celovška) H Divided Lj(Celovška-Koseze) A Divided Slivnica - Hajdina A Divided Hajdina-Draženci A Divided Draženci(-Podlehnik) A Divided [Jurovci] - Gruškovje - R Hrvaška Undivided Korensko Sedlo-Podkoren Undivided Podkoren-Kr.Gora Undivided Kr.Gora-Mojstrana-Dovje Undivided Dovje-Mojstrana-Kraje Undivided Kraje - Hrušica Undivided Javornik-Žirovnica Undivided Žirovnica-Lesce Undivided Lesce-Črnivec Undivided Kranj(Labore)-Jeprca Undivided Jeprca-Lj(Šentvid) Undivided Lj(Šentvid-Obvoznica) Undivided Škofljica-Šmarje Sap Undivided Priklj. Trebnje Z-Trebnje Undivided Grm - Šentjurij Undivided Priklj. Nm Zahod-Ločna Undivided Nm(Mačkovec)-Otočec Undivided Otočec-Kronovo Undivided Zvirče-Podtabor Undivided Bistrica(Tržič)-Zvirče Undivided Ljubelj-Bistrica(Tržič) Undivided Rateče-Podkoren Undivided Državna Meja-Rateče H Divided Srmin-Bertoki H Divided Bertoki-Kp(Škocjan) H Divided Koper (Slavček-Semedela) Undivided Valeta-Sečovlje Divided Mb (Tržaška C.)-Miklavž Page 8
13 Undivided Ptuj (Budina-Center) Undivided Ptuj-Spuhlja Undivided Spuhlja-Ormož Undivided Ormož-Most Čez Dravo Undivided Novo Mesto (Ac-Ločna) Undivided Novo Mesto(Krka-Revoz) Undivided Novo Mesto(Revoz)-Metlika Undivided Novo Mesto (Ločna-Krka) Undivided Metlika-Most Čez Kolpo Undivided Maribor(Ptujska)-Hoče Undivided Slivnica-Sl.Bistrica Undivided Sl.Bistrica Undivided Sl.Bistrica-Ložnica Undivided Ložnica-Tepanje Undivided Tepanje-Sl.Konjice Undivided Sl.Konjice Undivided Sl.Konjice-Stranice Undivided Stranice-Višnja Vas Undivided Višnja Vas-Celje Undivided Medlog-Petrovče Undivided Petrovče-Žalec Undivided Šempeter-Latkova Vas Undivided Latkova Vas-Šentrupert Undivided Šentrupert-Ločica Undivided Ločica-Trojane Undivided Trojane-Želodnik Undivided Želodnik-Domžale Undivided Domžale-Trzin Divided Trzin-Lj(Črnuče) Undivided Brezovica-Vrhnika Undivided Vrhnika-Logatec Undivided Logatec (Tržaška C.) Undivided Kalce-Planina Undivided Planina-Ravbarkomanda Undivided Ravbarkomanda-Postojna Undivided Postojna-Razdrto Undivided Razdrto-Senožeče Undivided Senožeče-Divača Undivided Divača-Matavun Undivided Matavun-Kozina Undivided Kozina-Kastelec Undivided Kastelec-Črni Kal Undivided Rižana-Dekani Undivided Radenci-Petanjci Undivided Petanjci-M.Sobota (Gaj) Divided Mb (Kor. Most-C. Proletarskih Brigad) Undivided Most Čez Muro - G. Radgona Undivided Celje-Šmarjeta Undivided Šmarjeta-Rimske Toplice Undivided Rim.Toplice-Zidani Most Undivided Zidani Most-Radeče Undivided Radeče-Boštanj Undivided Boštanj Undivided Boštanj-Impoljca Undivided Impoljca-Brestanica Undivided Krško-Drnovo Undivided Postojna-Pivka Undivided Pivka-Ribnica Undivided Ribnica-Prem Undivided Prem-Il.Bistrica Undivided Il.Bistrica (Trnovo) Undivided Il.Bistrica-Jelšane Page 9
14 Undivided Razdrto-Manče Undivided Manče-Vipava Undivided Ajdovščina-Selo Undivided Selo-Nova Gorica Undivided N.Gorica-Rožna Dolina Undivided Jurovci-Gruškovje Undivided Kozina-Krvavi Potok Undivided Obrov-Kozina Undivided Podgrad-Obrov Undivided Starod-Podgrad Undivided Lendava-Petišovci Undivided Lj(Vič)-Brezovica Undivided Radeče Undivided Brestanica-Krško Undivided Jurovci Undivided Il.Bistrica (Do Podgrajske Ul.) Divided Mb (C. Prol. Brig.-Tržaška C.) Undivided Nova Gorica Undivided Gornja Radgona-Radenci Undivided Žalec-Šempeter Undivided Hrušica-Javornik Undivided Medlog-Celje Undivided Ruda(Izola)-Valeta Undivided Hoče-Slivnica Undivided Ajdovščina (Obvoznica) H Divided Škofije-Srmin H Divided Koper (Semedela-Žusterna)-(Izola) Undivided Pragersko-Šikole Undivided Šikole-Hajdina Undivided Ptuj (Turnišče- Budina) Undivided Ormož Z-Ormož V A Divided Meja A(Predor)-Hrušica A Divided Hrušica-Lipce A Divided Lipce-Lesce A Divided Lesce-Brezje A Divided Brezje-Podtabor A Divided Podtabor-Kranj Z A Divided Kranj Z-Kranj V A Divided Kranj V-Brnik A Divided Brnik-Vodice A Divided Vodice-Lj(Šmartno) A Divided Lj(Šmartno-Brod) A Divided Lj(Brod-Šentvid) A Divided Šentvid - Koseze A Divided Lj(Koseze-Brdo) A Divided Lj(Brdo-Kozarje) A Divided Lj(Vič-Kozarje) A Divided Lj(Barjanska-Vič) A Divided Lj(Dolenjska-Barjanska) A Divided Lj(Malence-Dolenjska C.) A Divided Lj(Malence)-Šmarje-Sap A Divided Šmarje Sap-Grosuplje A Divided Grosuplje-Ivančna Gorica A Divided Ivančna Gorica-Bič A Divided Trebnje-Novo Mesto A Divided Novo Mesto-Kronovo A Divided Kronovo-Dobruška Vas A Divided Dobruška Vas-Drnovo A Divided Drnovo-Brežice A Divided Brežice-Obrežje A Divided Meja A-Šentilj A Divided Šentilj-Pesnica Page 10
15 H Divided Pesnica-Maribor H Divided Maribor-Tezno A Divided Slivnica A Divided Slivnica-Fram A Divided Fram-Sl.Bistrica A Divided Sl.Bistrica-Sl.Konjice A Divided Sl.Konjice-Dramlje A Divided Dramlje-Celje A Divided Celje-Arja Vas A Divided Arja Vas-Šentrupert A Divided Šentrupert-Vransko A Divided Vransko-Trojane A Divided Blagovica-Krtina A Divided Krtina-Domžale A Divided Domžale-Šentjakob A Divided Šentjakob-Lj(Zadobrova) A Divided Lj(Zadobrova-Zaloška) A Divided Lj(Zaloška-Litijska) A Divided Lj(Litijska-Malence) A Divided Lj(Kozarje)-Brezovica A Divided Brezovica-Vrhnika A Divided Vrhnika-Logatec A Divided Logatec-Unec A Divided Unec-Postojna A Divided Postojna-Razdrto A Divided Razdrto-Senožeče A Divided Senožeče-Gabrk A Divided Gabrk-Divača A Divided Divača-Kozina A Divided Kozina-Črni Kal A Divided Črni Kal-Srmin A Divided Pesnica - Dragučova A Divided Maribor(Ptujska)-Slivnica A Divided Trojane-Blagovica A Divided Gabrk-Sežana V A Divided Sežana V-Sežana Z A Divided Sežana Z-Fernetiči A Divided Dragučova - Mb (Ptujska) A Divided Bič-Trebnje H Divided Lj(Zadobrova-Šmartinska) H Divided Lj(Šmartinska-Tomačevo) Divided Lj(Črnuče-Tomačevo) H Divided Lj(Tomačevo-Dunajska) H Divided Lj(Dunajska-Celovška) H Divided Lj(Celovška-Koseze) A Divided Slivnica - Hajdina A Divided Hajdina-Draženci A Divided Draženci(-Podlehnik) A Divided [Jurovci] - Gruškovje - R Hrvaška Divided Mb (Kor. Most-C. Proletarskih Brigad) H Divided Srmin-Bertoki H Divided Bertoki-Kp(Škocjan) H Divided Koper (Slavček-Semedela) Divided Mb (Tržaška C.)-Miklavž Divided Mb (C. Proletarskih Brigad-Tržaška C.) Divided Ruda(Izola)-Valeta H Divided Škofije-Srmin H Divided Koper (Semedela-Žusterna)-(Izola) Divided Trzin-Lj(Črnuče) A Divided Dragučova - Lenart A Divided Lenart - Sv. Trojica A Divided Sv. Trojica-Sv. Jurij Ob Ščavnici Page 11
16 A Divided Sv. Jurij Ob Ščavnici-Vučja Vas A Divided Vučja Vas-Murska Sobota A Divided Murska Sobota-Lipovci A Divided Lipovci - Turnišče A Divided Turnišče-Dolga Vas A Divided Dolga Vas-Lendava H Divided A5-Dolga Vas A Divided Lendava-Pince H Divided Dolga Vas - Rondo Dolga Vas Divided Maribor(Ptujska)-Hoče Divided Hoče-Slivnica A Divided Dragučova - Lenart A Divided Lenart - Sv. Trojica A Divided Sv. Trojica-Sv. Jurij Ob Ščavnici A Divided Sv. Jurij Ob Ščavnici-Vučja Vas A Divided Vučja Vas-Murska Sobota A Divided Murska Sobota-Lipovci A Divided Lipovci - Turnišče A Divided Turnišče-Dolga Vas A Divided Dolga Vas-Lendava H Divided A5-Dolga Vas A Divided Lendava-Pince H Divided Dolga Vas - Rondo Dolga Vas Undivided Predel-Bovec Undivided Bovec(Po Obvoznici)-Žaga Undivided Žaga-Kobarid Undivided Kobarid-Idrsko Undivided Idrsko-Peršeti Undivided Šempeter-Dornberk Undivided Dornberk-Štanjel Undivided Štanjel-Dutovlje Undivided Dutovlje-Sežana Undivided Divača-Lokev-Lipica Undivided Kranjska Gora-Erika Undivided Vršič-Trenta Undivided Trenta-Bovec Undivided Staro Selo-Kobarid Undivided Robič-Staro Selo Undivided Godovič-Kalce Undivided Sp.Idrija-Godovič Undivided Spodnja Idrija Undivided Želin-Sp.Idrija(Marof) Undivided Dol.Trebuša-Želin Undivided Bača-Dol.Trebuša Undivided Most Na Soči-Bača Undivided Peršeti-Most Na Soči Undivided Ruska Cesta (Erika-Vršič) Undivided Godovič-Črni Vrh Undivided Črni Vrh-Col Undivided Kortine-Gračišče Undivided Gračišče-Sočerga Undivided Koper-Dragonja Undivided Škofja Loka Undivided Škofja Loka-Jeprca Undivided Kamnik(Mekinje)-Stahovica Undivided Stahovica-Črnivec Undivided Črnivec-Radmirje Undivided Lesce-Bled Undivided Bled-Soteska Undivided Soteska-Bitnje Undivided Bitnje-Boh.Bistrica Undivided Boh.Bistrica-Jezero Page 12
17 Undivided Zg.Jezersko-Sp.Jezersko Undivided Sp.Jezersko-Preddvor Undivided Preddvor-Kr(Primskovo) Undivided Kr(Primskovo-Labore) Undivided Kranj-Škofja Loka Undivided Šk.Loka-Gorenja Vas Undivided Gorenja Vas-Trebija Undivided Trebija-Sovodenj Undivided Sovodenj-Cerkno Undivided Cerkno-Želin Undivided Priključek Unec-Unec Undivided Unec-Rakek Undivided Rakek-Cerknica Undivided Cerknica-Bl.Polica Undivided Bl.Polica-Sodražica Undivided Sodražica-Žlebič Undivided Kranj-Sp.Brnik Undivided Sp.Brnik-Moste Undivided Moste-Mengeš Undivided Mengeš (Kolodvorska C.)-Trzin Undivided Mengeš-Duplica Undivided Rižana-Kortine Undivided Črnomelj Undivided Vinica Undivided Kočevje-Stari Log Undivided Stari Log-Dvor Undivided Žužemberk-Dvor Undivided Pluska - Priklj. Trebnje Z Undivided Trebnje-Mokronog Undivided Mokronog-Boštanj Undivided Radenci Undivided Krka-Žužemberk Undivided Dvor-Soteska Undivided Soteska-Črmošnjice Undivided Črmošnjice-Črnomelj Undivided Črnuče-Šentjakob Undivided Šentjakob-Ribče Undivided Ribče-Litija Undivided Litija-Zagorje Undivided Zagorje-Trbovlje Undivided Trbovlje-Hrastnik Undivided Hrastnik-Zidani Most Undivided Ivančna Gorica-Grm Undivided Grm-Pluska Undivided Soteska-Novo Mesto Undivided Novo Mesto-Šentjernej Undivided Šentjernej-Križaj Undivided Križaj-Čatež Ob Savi Undivided Livold-Brezovica Undivided Brezovica-Kanižarica Undivided Metlika-Podzemelj Undivided Podzemelj-Črnomelj Undivided Črnomelj-Kanižarica Undivided Kanižarica-Vinica Undivided Vinica-Most Čez Kolpo Undivided Želodnik-Drtija Undivided Drtija-Izlake Undivided Izlake-Zagorje Undivided Zagorje-Bevško Undivided Bevško-Trbovlje Undivided Trbovlje-Boben-Hrastnik Undivided Hrastnik-Šmarjeta Page 13
18 Undivided Trojane-Izlake Undivided Zagorje-Most Čez Savo Undivided Bevško-Most Čez Savo Undivided Hrastnik-Most Čez Savo Undivided Sl.Bistrica-Poljčane Undivided Poljčane-Podplat Undivided Mestinje-Podplat Undivided Mestinje-Golobinjek Undivided Golobinjek-Bistrica Undivided Bistrica-Bizeljsko Undivided Bizeljsko-Čatež Undivided Soteska-Šentrupert Undivided Mozirje-Soteska Undivided Radmirje-Mozirje Undivided Holmec-Poljana Undivided Poljana-Ravne Undivided Ravne-Dravograd Undivided Dravograd-Otiški Vrh Undivided Otiški Vrh-Sl.Gradec Undivided Sl.Gradec-Zg.Dolič Undivided Zg.Dolič-Velenje Undivided Velenje-Črnova Undivided Črnova-Arja Vas Undivided Ravne-Kotlje Undivided Celje-Šentjur Undivided Šentjur-Mestinje Undivided Podplat-Rogatec Undivided Rogatec-Dobovec Undivided Dole-Šentjur Undivided Rogoznica-Senarska Undivided Sl.Bistrica-Pragersko Undivided Spuhlja-Zavrč Undivided Radenci-Vučja Vas Undivided Križevci-Ljutomer Undivided Ljutomer-Pavlovci Undivided Pavlovci-Ormož Undivided Ormož Undivided Ormož-Središče Ob Dravi Undivided Hodoš-Petrovci Undivided Petrovci-Martjanci Undivided Martjanci-M.Sobota Undivided Razkrižje-Stročja Vas Undivided Gibina-Razkrižje Undivided Stročja Vas-Ljutomer Undivided Krško-Brežice Undivided Duplica-Kamnik Undivided Bloška Polica-Pudob Undivided Pudob-Babno Polje Undivided Ivančna Gorica-Krka Undivided Mengeš (Kamniška C. Kolod. C.) Undivided M.Sobota (Gaj)-Priklj. M.Sobota Undivided Vučja Vas-Križevci Undivided Priklj. Celje Z-Medlog Undivided M.Sobota-Lipovci Undivided Poljčane Undivided Col-Ajdovščina Undivided Križevci Undivided Ptuj-Rogoznica Undivided Bistrica Ob Sotli Undivided Kotlje-Slovenj Gradec Undivided Kamnik(-Mekinje) Undivided Polica-Podtabor Page 14
19 Undivided Gobovce-Črnivec Undivided Črni Kal-Kortine Undivided Kortine-Rižana Undivided Dekani-Priklj. Srmin Undivided Sl.Gradec Undivided Odcep Do Priklj Sl.Bistrica Sever Undivided Mejni Plato - Meja Madžarska Undivided Kalce-Logatec Undivided Logatec Undivided Murska Sobota Undivided Kranj Z-Polica Undivided Vipava-Ajdovščina Undivided Slavček-Luka Koper Undivided Dramlje-Dole Undivided Čatež Ob Savi Undivided Grm - Trebnje Undivided Priklj. Trebnje V - Grm Undivided Mengeš (Slovenska C.) Undivided Draženci-Jurovci (Lancova Vas) Undivided Koper (Žusterna)-Izola (Ruda) Undivided Trebnje (Odrga-Kamna Gora) Undivided Karteljevo-Priklj. Nm Zahod Undivided Novo Mesto (Krka) Undivided Novo Mesto (Ločna-Mačkovec) Undivided Kronovo-Dolenje Kronovo Undivided Dolenje Kronovo-Dobrava Undivided Podtabor-Gobovce Table 1: The inspected road network in Slovenia The largest portion (63%) of the road is a single carriageway. The lane width is over 3.25 m, in the length of 1,381 km. Concerning physical separation between opposing traffic flows, the centreline separating traffic is present in the length of 1,996 km, and a wide centreline (0.3 to 1 m wide) in the length of 17 km. Metal median barrier separating traffic lanes by directions, is placed in the length of 910 km. Hard shoulders are mainly paved, and are mostly 0 to 1 m wide. As for the pedestrian facilities, they do not exist at the 97% of the inspected road, i.e. there is a very small number of signalized pedestrian crossings, with or without traffic lights, refuges and grade separated facilities. Regarding hazardous objects at the side of a driver or passenger in the front seat, such objects are recorded in the length of 1,722 km (53%), at the distance of 1 to 5 m from the edge line. These objects include in the first place deep canals, steep slopes, trees and poles of a diameter greater than 10 cm, etc. However, the most common hazardous objects are safety barriers with their unsafe start and end points. Page 15
20 2.1.2 Details of the recorded road attributes On the basis of the analysis of the inspection s data the following Table presents details of the inspected network. Area type km % Rural / open area 2, Urban / rural town or village Bicycle observed flow km % None 3, bicycle observed to 3 bicycles observed to 5 bicycles observed Carriageway label[1] km % Carriageway A of a divided carriageway road Carriageway B of a divided carriageway road Undivided road 2, Centreline rumble strips km % Not present 3, Present 0 0 Curvature km % Straight or gently curving 2, Moderate Sharp Very sharp Quality of curve km % Adequate 1, Poor Not applicable Delineation km % Adequate 3, Poor Facilities for bicycles km % Off-road path with barrier Off-road path On-road lane None 2, Extra wide outside (>=4.2m) Signed shared roadway Shared use path Facilities for motorised two wheelers km % None 3, Grade km % >= 0% to <7% 3, Intersection type km % Page 16
21 Merge lane Roundabout leg (unsignalised) with protected turn lane leg (unsignalised) with no protected turn lane leg (signalised) with no protected turn lane leg (unsignalised) with protected turn lane leg (unsignalised) with no protected turn lane leg (signalised) with protected turn lane leg (signalised) with no protected turn lane None 2, Railway Crossing - passive (signs only) Railway Crossing - active (flashing lights / boom gates) Mini roundabout Intersecting road volume Points % >=15,000 vehicles ,000 to 15,000 vehicles ,000 to 10,000 vehicles ,000 to 5,000 vehicles to 1,000 vehicles to 100 vehicles None 2, Intersection channelisation Points % Not present 3, Present Intersection quality Points % Adequate Poor Not applicable 2, Land use - driver-side km % Undeveloped areas 2, Farming and agricultural Residential Commercial Educational Industrial and manufacturing 16.8 Land use - passenger-side km % Undeveloped areas 2, Farming and agricultural Residential Commercial Educational Industrial and manufacturing Lane width km % Wide (>= 3.25m) 1, Medium (>= 2.75m to < 3.25m) 1, Page 17
22 Narrow (>= 0m to < 2.75m) Median type km % Safety barrier - metal Safety barrier - concrete Physical median width >= 20.0m Physical median width >= 10.0m to < 20.0m Physical median width >= 5.0m to < 10.0m Physical median width >= 1.0m to < 5.0m Physical median width >= 0m to < 1.0m Flexipost Central hatching (>1m) Centre line 1, Safety barrier - motorcycle friendly One way Wide centre line (0.3m to 1m) Motorcycle observed flow km % None 3, motorcycle observed to 3 motorcycles observed to 5 motorcycles observed Number of lanes km % One 1, Two 1, Three Four or more Two and one Paved shoulder - driver-side km % Wide (>= 2.4m) Medium (>= 1.0m to < 2.4m) Narrow (>= 0m to < 1.0m) 1, None 1, Paved shoulder - passenger-side km % Wide (>= 2.4m) Medium (>= 1.0m to < 2.4m) Narrow (>= 0m to < 1.0m) 1, None 1, Shoulder rumble strips km % Not present 3, Pedestrian crossing facilities - inspected road Points % Grade separated facility Signalised with refuge Signalised without refuge Unsignalised marked crossing with refuge Unsignalised marked crossing without a refuge No facility 3, Page 18
23 Pedestrian crossing facilities - intersecting road Points % Grade separated facility Signalised with refuge Signalised without refuge Unsignalised marked crossing with refuge Unsignalised marked crossing without a refuge No facility 3, Pedestrian crossing quality Points % Adequate Poor Not applicable 3, Pedestrian fencing km % Not present 3, Present Pedestrian observed flow across the road km % None 3, pedestrian crossing observed to 3 pedestrians crossing observed to 5 pedestrians crossing observed to 7 pedestrians crossing observed Pedestrian observed flow along the road driver-side km % None 3, pedestrian along driver-side observed to 3 pedestrians along driver-side observed to 5 pedestrians along driver-side observed to 7 pedestrians along driver-side observed pedestrians along driver-side observed Pedestrian observed flow along the road passenger-side km % None 3, pedestrian along passenger-side observed to 3 pedestrians along passenger-side observed to 5 pedestrians along passenger-side observed to 7 pedestrians along passenger-side observed pedestrians along passenger-side observed Property access points km % Commercial Access Residential Access Residential Access 1 or None 2, Road condition km % Good 2, Medium Poor Roadside severity - driver-side distance km % 0 to <1m Page 19
24 1 to <5m 1, to <10m >= 10m Roadside severity - driver-side object km % Safety barrier - metal 1, Safety barrier - concrete Safety barrier - motorcycle friendly Safety barrier - wire rope Aggressive vertical face Upwards slope - rollover gradient Upwards slope - no rollover gradient Deep drainage ditch Downwards slope Cliff Tree >=10cm dia Sign, post or pole >= 10cm dia Non-frangible structure/bridge or building Frangible structure or building Unprotected safety barrier end Large boulders >=20cm high None Roadside severity - passenger-side distance km % 0 to <1m 1, to <5m 1, to <10m >=10m Roadside severity - passenger-side object km % Safety barrier - metal Safety barrier - concrete Safety barrier - motorcycle friendly Safety barrier - wire rope Aggressive vertical face Upwards slope - rollover gradient Upwards slope - no rollover gradient Deep drainage ditch Downwards slope Cliff Tree >= 10cm dia Sign, post or pole >=10cm dia Non-frangible structure/bridge or building Frangible structure or building Unprotected safety barrier end Large boulders >= 20cm high None Page 20
25 Roadworks km % No road works 3, Minor road works in progress Major road works in progress School zone crossing supervisor Points % Not applicable (no school at the location) 3, School zone warning Points % Not applicable (no school at the location) 3, Service road km % Not present 3, Present Sidewalk - driver-side km % Physical barrier Non-physical separation >= 3.0m Non-physical separation 1.0m to <3.0m Non-physical separation 0m to <1.0m None 2, Informal path >= 1.0m Informal path 0m to <1.0m Sidewalk - passenger-side km % Physical barrier Non-physical separation >= 3.0m Non-physical separation 1.0m to <3.0m Non-physical separation 0m to <1.0m None 2, Informal path >= 1.0m Informal path 0m to <1.0m Sight distance km % Adequate 3, Poor Skid resistance / grip km % Sealed - adequate 3, Sealed - medium Unsealed - adequate Speed limit km % <30km/h km/h km/h km/h km/h km/h km/h 1, km/h km/h km/h Page 21
26 Motorcycle speed limit km % <30km/h km/h km/h km/h km/h km/h km/h 1, km/h km/h km/h Truck speed limit km % <30km/h km/h km/h km/h km/h km/h km/h 1, km/h Differential speeds km % Not present 2, Present Speed management / traffic calming km % Not present 3, Present Street lighting km % Not present 2, Present Upgrade cost km % Low 1, Medium High Vehicle parking km % Low 3, Medium High Table 2: Details of the inspected road network in Slovenia Page 22
27 From the detailed information, we can find that 63% of the inspected road network is undivided road. The 98% of the undivided roads have one lane per direction. The delineation of 2% road segments is not adequate. 15% of length of SENSoR inspected road network is in urban area, 85% in rural area. There is 6% of length as sharp and 1% of length as very sharp curvature. There is 43% of wide lane width, 54% of medium lane width and 3% of narrow lane width. 93% of road condition is rated as good, 7% as medium and 1% a poor. In regard to driver side protection, there are 33% of safety barriers-metal, 14% of tree (>=10cm dia.), 10% of sign, post or pole (>= 10cm dia.), 8% of unprotected safety barrier end and others. The distance to driver side objects is in 31% 0-1m, in 54% 1-5m, in 6% 5-10m and in 9% >=10m. In regard to passenger side protection, there are 24% of safety barriers-metal, 15% of tree (>=10cm dia.), 11% of sign, post or pole (>= 10cm dia.), 11% of unprotected safety barrier end and others. The distance to passenger side objects is in 27% 0-1m, in 60% 1-5m, in 5% 5-10m and in 7% >=10m. Sight distance is adequate in 99% of inspected network length. Speed limit of 50 km/h (state road urban) on 15% of length, 90 km/h (state road rural) on 41% of length, 110 km/h (expressways) on 5%, 130 km/h (motorways) on 25% of inspected network length, other speed limits as specifically posted. In regard to possible upgrade costs, the assessed costs are as low on 54% length, as medium on 24% of length and as high on 22% of length of SENSoR inspected road network. Page 23

28 3 Data collection and coding 3.1 Road Survey Inspection & Safety Rating: o Participation in course»video Inspection and Coding«, Ljubljana, July 2013 o Participation in course»safer Roads Investment Plan«, Basingstoke, February 2014 o»video Inspection«carried out on 3,152 km of selected TEN-T and state roads o»roadsurvey V3 coding«on video data with road/roadside elements ranking performed o Quality and error check of input data, joining traffic volume data and other technical details for»star Rating«according to Vida V3 o Two input files»datasets«prepare, separately for highways + motorways and for main + regional roads o Import of input data files into Vida V3, online results check Quality Assurance procedure provided by RoadSafety Foundation for Star RatingRoad Survey Equipment The road inspection vehicle used was equipped with high-resolution cameras (three cameras in the front capturing the 180 o driver s view front). Digital images of minimum resolution 1280x960 pixels were collected in 10m intervals while driving at the normal speed. Georeferenced data have been provided for each digital image, including the distance along the road (from the determined start point), longitude and latitude, date and time. Figure 3: The inspection vehicle Page 24


29 3.1.2 Coding Team AMZS has organised SENSOR training Inspection and Safety Rating, which took place between July 17 and July 19, The training has been performed by James Bradford (irap). There were 10 participants on day 1 and 11 participants on day 2. Star Rating analysis and reporting tutorial has been carried out internally James Bradford has performed it for Jure Kostanjšek from University of Ljubljana, Faculty of Civil and Geodetic Engineering external contractor of AMZS in SENSOR project. The equipment used for training: PC or laptop computer (1 per 2 persons), with (windows 7/windows 8, office, internet explorer), high speed internet connection and overhead projector. The training has been held in a conference room in AMZS. All participants received invitation with the program for each day of the training. Figure 4: Training Inspection and Safety Rating (Ljubljana 2014) Figure 5: Training Inspection and Safety Rating (Ljubljana 2014) Page 25
 Analysis team has been formed and trained.")

30 Figure 6: Training Inspection and Safety Rating (Ljubljana 2014) Figure 7: Vida Course (Basingstoke 2014) Analysis team has been formed and trained. Analysis team: Rok Marsetič, Irena Strnad, Darja Šemrov, Simon Detellbach, Katja Pešec, Tadeja Lavrič and Marjeta Škufca. A dedicated coding room with two workstations, each with two wide-screen monitors and RoadSurvey V3 software has been installed. Page 26

31 Figure 8: Analysis team Analysis has been finished, for all SENSoR roads. Xls output files were produced for all coded roads and sections. Two xls files were prepared for final upload: xls for motorways and expressways, xls for main and regional roads. 3.2 Data coding After the completion of the road inspection phase, the process of coding of video material took place. Coding represents the process of determining specific road attributes, for each of the 100 meters interval of the inspected roads, according to the RAP-SR-2.1 Star Rating and Investment Plan Survey and Coding Specification and the RAP-SR-2.2 Star Rating coding manual. The quality assurance process was the next important phase of the coding process and assessed whether the road attributes captured in the road inspection had been rated correctly. It was an important validation step prior to calculation of Star Ratings, data interrogation and further consultation with stakeholders. A requirement of the RAP method, according to the RAP-SR-2-4 Road Coding Quality Assurance Guide, is the external review of a minimum 10% of the data coded from road inspections, which was done in early The Quality Assurance of the specific dataset was performed by Road Safety Foundation, which is an accredited RAP supplier and was commissioned by the SENSOR project to perform the QA task. The basic assumptions used regarding the traffic volume, the pedestrian and bicycle volume, the operating speed, the crash data, the countermeasure costs and the economic data on which star rating is based, are presented in the following paragraphs. Page 27
32 3.2.1 Traffic Volume Traffic volume data is used in the irap model as a multiplier to estimate the number of deaths and serious injuries that could be prevented on the roads. Automatic vehicle counters and classificators official data were used for traffic volume data, supplied by Ministry of Infrastructure and Spatial Planning - Slovenian Roads Agency (DRSC). Details are in Annex Pedestrian and Bicycle volume Only car RPS and star rating was done in SENSoR, since no data on pedestrians and bicyclists Operating Speed The level of risk of death or serious injury on a road is highly dependent on the speed at which the traffic travels. The RAP method indicates that risk assessments must be performed using the operating speed on a road. Operating speed is defined as being the greater of the legislated speed limit or the measured 85th percentile speed. Automatic vehicle counters and classificators official data is used for traffic volume data and operating speeds assessment, supplied by Ministry of Infrastructure and Spatial Planning - Slovenian Roads Agency (DRSC). The classes and types of roads to assess operating speeds are: motorways, expressways, state roads: main and regional roads and distinction between: urban roads rural roads. At state road network, five types of automatic vehicle (traffic) counters, which count traffic continuously throughout the year, namely QLD-3, QLD-5, QLD-6 QLTC-8 and QLTC-10 are used. Some of automatic counters also measure speed. Speed data for the 2013 from 27 locations on Motorways, 9 locations on Expressways and 297 locations on Main and Regional Roads was analysed. In total, about vehicles were detected automatically, counted and speed measures by automatic traffic counting system, on SENSoR roads in Speed adjustments due to road curvature and grade: The estimated speeds on a road or section of road were adjusted in accordance with the following principles: Traffic volume impact on speed is already incorporated in data analysis The curvature and grade of section will impact the operating speed, the situation below will be considered: o The sharp and very sharp curvature section s operating speed is 0.8 times of estimated speed. Page 28
33 Details are in Annex 2. o The continual sharp and very sharp curvature section s operating speed is 0.6 times of estimated speed. o The steep grade and sharp curvature section s operating speed is 0.5 times of estimated speed Crash Data The crash number, the death person number and the serious injured person number for all roads are used to support the countermeasure selection and economic analysis. Official data were used for crash data, supplied by Ministry of interior - Police Supporting data upload File Fatality Data Motorways/Expressways Total network fatalities Reported road deaths on surveyed network/road: 57 Sample Period (number of years) 3 Fatality under reporting factor: 1 Estimated no. of fatals on network per year 19 Distribution of fatalities by road user category (%) Vehicle occupants 88.9 % Motorcyclists 0 % Pedestrians 11.1 % Bicyclists 0 % total 100% Initial distribution of estimated fatalities (per year on surveyed network) Vehicle occupants 16.9 Motorcyclists 0 Pedestrians 2.1 Bicyclists 0.0 total 19 Vehicle Occupant crash type % Annual Fatalities Vehicle run-off LOC driver-side 21.2% 3.58 Vehicle run-off LOC passenger-side 34.5% 5.82 Vehicle head-on LOC 3.8% 0.64 Vehicle head-on OT 0.0% 0.00 Vehicle Int 12.7% 2.12 Vehicle prop. access 0.0% 0.00 Vehicle other 27.8% % Page 29
34 Supporting data upload File Fatality Data Main/Regional Roads Total network fatalities Reported road deaths on surveyed network/road: 106 Sample Period (number of years) 3 Fatality under reporting factor: 1 Estimated no. of fatals on network per year 35.3 Distribution of fatalities by road user category (%) Vehicle occupants 47.1 % Motorcyclists 14.7 % Pedestrians 11.8 % Bicyclists 26.5% total 100% Initial distribution of estimated fatalities (per year on surveyed network) Vehicle occupants 16.6 Motorcyclists 5.2 Pedestrians 4.2 Bicyclists 9.4 total 35.4 Vehicle Occupant crash type % Annual Fatalities Vehicle run-off LOC driver-side 4.8% 0.79 Vehicle run-off LOC passenger-side 7.8% 1.29 Vehicle head-on LOC 62.8% Vehicle head-on OT 0% 0.00 Vehicle Int 18.8% 3.12 Vehicle prop. access 0% 0.00 Vehicle other 6.3% % Countermeasures costs In order the Safer Road Investment Plan to be developed, the costs of various countermeasures must be estimated. This will enable the determination of the benefit-cost ratio of each proposed countermeasure. The costs must include all costs of design, engineering, materials, work, land as well as maintenance for their entire life cycle. Within SESoR, these costs were determined using a common approach followed by all project partners. This approach was based on a research implemented by the SENSOR project partner AMZS Slovenia and its contractor, and is presented in Annex 3. The costs are in Euros. The countermeasure costs data used output should be considered as model patterns; however the ViDA online software allows calibrating the countermeasure costs according to exact data, given by the particular national road authorities. Details are in Annex Economic data Official economic data were used and supplied by Statistical Office of the Republic of Slovenia. Page 30
35 1. Analysis period The number of years over which the economic benefits of the Safer Roads Investment Plan is calculated. The value for this project is set to 20 years. 2. Gross Domestic Product The key figure for the Safer Road Investment Plan is the GDP per capita in local currency. As the source of this figure the IMF World Economic Outlook Database of October 2013 was used. The GDP per capita in Slovenia for 2014 is euro. 3. Discount rate and minimum attractive rate of return Discounting is a technique used, among other things, to estimate costs and benefits that occur in different time periods and is used to calculate the Net Present Values (NPV) and budgets required within irap s ViDA software. The appropriate discount rate to use can vary by country and in many investment project modelling exercises is set in consultation with the funder. Typically, the discount rate varies from 4% to 12%, the latter figure being often used in World Bank transport projects. In SENSoR, a figure of 12% has been used in many countries, whereas in others, after local consultation, 9% and 4% has been used. A sensitivity analysis conducted within the ViDA Model showed that from a practical perspective, at a 12% discount rate compared with 4%, the total Present Value of safety benefits was approximately halved, the overall estimated cost of the investment is reduced by about a third and the estimated number of fatal and serious injuries saved over 20 years is reduced by about 10%. Lists of triggered countermeasures are similar with, as expected, slightly fewer sites or lengths of road recommended for improvement when the discount rate is higher. Again, as part of the consultation process in individual countries, variations on the discount rate can be trialled. In Slovenia, a discount rate of 4% has been used in this consultation report. The minimum attractive rate of return has been set at the decimal fraction equivalent. High discount rates and the implied zero-traffic growth assumption within the model would mean that the Benefit Cost Ratios and estimates of casualties saved are highly conservative. 4. Value of life This figure reflects the social cost of one fatality on the road. In this project the irap recommendation of GDP x 70 (see McMahon and Dahdah (2008) was used. Thus, the value of life was estimated as 1,198, Value of serious injury This figure reflects the social cost of one serious injury on the road. In this project the irap recommendation of Value of life x 0.25 (see McMahon and Dahdah (2008) was used. Thus, the value of serious was estimated as 299,740. Page 31

36 4 Star Rating Results Based on the coded and supporting data, the ViDA online software produces star rating of the surveyed network. The star rating is based on individual relative risk for four user groups vehicle occupants, passengers, motorcyclists and bicyclists. Therefore, four different star ratings were produced. The software is also capable of smoothing the data in order to eliminate random star rating differences over short sections of road. 4.1 Overall Star Ratings Results The Star Ratings results for the entire road network analysed are presented in the next figures for car RPS only. SENSoR Slovenia road network coded data was divided in two main datasets/road networks: Motorways and expressways Main and regional roads. All following ratings, results, srips and other ViDA outputs are presented separately, for the above two mentioned datasets/road networks Star Rating results Motorways/Expressways Figure 9: Star Rating map Motorways/Expressways Page 32
 Page")
37 Figure 10: Star Ratings table Motorways/Expressways Figure 11: Star Ratings table Motorways/Expressways (Smoothed) Page 33
38 Figure 12: Star Ratings chart Motorways/Expressways Figure 13: Star Ratings chart Motorways/Expressways (Smoothed) From the detailed information, we can find that majority 65% of the road network of Motorways/Expressways are 3 Stars, 26% are 2 Stars, 4% are 4 Stars and 2% are 5 Stars. Smoothed results show 3 Stars 83% and 2 Stars 17% of motorway/expressway network. Page 34

39 4.1.2 Star Rating results Main/Regional roads Figure 14: Star Rating map Main/Regional roads Figure 15: Star Ratings table Main/Regional roads Page 35
40 Figure 16: Star Ratings table Main/Regional roads (Smoothed) Figure 17: Star Ratings chart Main/Regional roads Page 36
41 Figure 18: Star Ratings chart Main/Regional roads (Smooothed) From the detailed information, we can find that majority 35% of the road network of main and regional roads are 3 Stars, 30% are 2 Stars, 34% are 1 Stars, and 6% are 4 Stars. Smoothed results show 3 Stars 27%, 2 Stars 38% and 1 Star 34% of SENSoR selected main and regional roads network. Page 37

42 4.2 Detailed Star Ratings Results Motorways and Expressways Motorway AC-A3 Sežana Gabrk Figure 19: Star Rating map Motorway AC-A3 Sežana Gabrk Figure 20: Star Ratings table Motorway AC-A3 Sežana Gabrk Page 38
 Figure 22: Risk Worm Motorway AC-A3 Sežana Gabrk")
43 Figure 21: Star Ratings table Motorway AC-A3 Sežana Gabrk (Smoothed) Figure 22: Risk Worm Motorway AC-A3 Sežana Gabrk Page 39
44 Figure 23: Star Ratings chart Motorway AC-A3 Sežana Gabrk Figure 24: Star Ratings chart Motorway AC-A3 Sežana Gabrk (Smoothed) Page 40


45 Example 2-star AC-A3 Gabrk-Sežana, Section 0668, km Steel Barrier 1-5 m, Paved shoulder 0,50 m, 2 x lane 3.75 m. Paved shoulder 2.50 m, Grade 0-7 %, AADT 13500, Upgrade cost: Low. Speed Limit: 130 km/h 85 th percentile speed: 130 km/h Mean speed 110 km/h Figure 25: Example 2-star Motorway AC-A3 Sežana Gabrk Typical SLO Motorway profile 3-star Steel Barrier 1-5m, Paved shoulder 0,50m, 2x lane 3,75m. Paved shoulder 2,50m, Steel Barrier 1-5m, Grade 0-7%, AADT 21000, Upgrade cost: Low. Speed Limit: 130 km/h 85 th percentile speed: 130 km/h Mean speed 110 km/h Figure 26: Typical SLO 3-stars SLO Motorway profile Page 41

46 4-star Steel Barrier 1-5m, Paved shoulder 0,50m, 2x lane 3,75m. Paved shoulder 2,50m, Steel Barrier 1-5m, Grade 0-7%, AADT 21000, Upgrade cost: Low. Speed Limit: 80 km/h 85 th percentile speed: 90 km/h Mean speed 80 km/h Figure 27: Typical SLO 4-stars SLO Motorway profile Page 42


47 4.2.2 Main and Regional Roads Regional road R1-204 Nova Gorica-Sežana Figure 28: Star Rating map Regional road R1-204 Figure 29: Star Ratings table Regional road R1-204 Page 43
48 Figure 30: Star Ratings table Regional road R1-204 (Smoothed) Figure 31: Star Ratings chart Regional road R1-204 Page 44

49 Figure 32: Star Ratings chart Regional road R1-204 (Smoothed) Example 1-Star Regional road R1-204 Section 1013, km Carriageway: Undivided road, Upgrade cost: High, Right object: Aggressive face, Left object: Cliff, Paved shoulder 0-1 m, Lane width: Narrow, Grade 0-7 %, AADT 2200, Speed Limit: 90 km/h 85 th percentile speed: 80 km/h Mean speed 65 km/h Figure 33: Example 1-star Regional road R1-204 Page 45


50 Figure 34: Star Rating map Regional road R Section 1013 Figure 35: Star Ratings table Regional road R Section 1013 Page 46
 Figure 37: Risk Worm Regional road R1-2042 Section 1013")
51 Figure 36: Star Ratings table Regional road R Section 1013 (Smoothed) Figure 37: Risk Worm Regional road R Section 1013 Page 47
52 Figure 38: Star Ratings chart Regional road R Section 1013 Figure 39: Star Ratings chart Regional road R Section 1013 (Smoothed) Page 48
53 5 Safer Roads Investments Plan (SRIP) The basic output of the RAP method, as described in paragraph 1 is the Safer Roads Investment Plan. The SRIP presents all the countermeasures proved able to provide the greater safety capacity and maximize the benefit over spent cost of the planned investments. The cost of each countermeasure is compared to the value of life and serious injuries that could be saved and Benefit to Cost Ratio (BCR) is calculated for each countermeasure proposed. The minimum BCR for the entire SRIP was set to 3. The countermeasures listed are indicative and will need to be assessed and sense-checked with local engineers. The Safer Roads Investment Plan is not a bill of works. 5.1 Overall SRIP Results The SRIP for the entire surveyed network would save 4,790 fatalities and serious injuries over the analysis period of 20 years. The cost of these countermeasures adds up to approx. 169,891,121. The total BCR of the entire investment plan is 7. The next Figure presents the top 10 countermeasures of the SRIP in terms of saved lives and serious injuries (FSI). All following ratings, results, srips and other ViDA outputs are presented separately for Motorways/expressways and Main/regional roads. Page 49

54 5.1.1 Overall SRIP Results Motorways/Expressways Figure 40: Top 10 countermeasures for the entire road network (Motorways/Expressways), threshold BCR=3 unrounded data The Star Rating results for Motorways and Expressways after adopting all the proposed countermeasures are presented in the next figures. Page 50
")

55 Figure 41: Star Rating map Motorways/Expressways (After) Figure 42: Star Ratings table Motorways/Expressways (After) Page 51
56 Figure 43: Star Ratings table Motorways/Expressways (After Smoothed) Figure 44: Star Ratings chart Motorways/Expressways (After) Page 52

57 Figure 45: Star Ratings chart Motorways/Expressways (After - Smoothed) The next figure presents the predicted casualty reductions after implementing the proposed SRIP. Figure 46: Predicted casualty reduction map Motorways/Expressways Page 53

58 5.1.2 Overall SRIP Results Main/Regional roads Figure 47: Top 10 countermeasures for the entire road network (Main/Regional roads), threshold BCR=3 unrounded data The Star Rating results for Main and Regional roads after adopting all the proposed countermeasures are presented in the next figures. Page 54
")

59 Figure 48: Star Rating map Main/Regional roads (After) Figure 49: Star Ratings table Main/Regional roads (After) Page 55
 Figure 51: Star Ratings table Main/Regional roads")
60 Figure 50: Star Ratings table Main/Regional roads (After Smoothed) Figure 51: Star Ratings table Main/Regional roads (After) Page 56

61 Figure 52: Star Ratings chart Main/Regional roads (After - Smoothed) Figure 53: Predicted casualty reduction map Main/Regional roads Page 57
62 5.2 Detailed SRIP Results The next tables present the top countermeasures for each road. Motorway AC-A3 Sežana Gabrk Countermeasure Length / Sites FSIs saved PV of safety benefit Estimated Cost Cost per FSI saved BCR Roadside barriers - passenger side Clear roadside hazards - passenger side Roadside barriers - driver side 3.9 km 4 1,196, ,260 67, km 1 15, , km 1 52,551 7,940 39,167 7 Shoulder rumble strips 3.4 km 1 311,507 67,690 56,332 5 Total 6 1,575, ,873 63,804 4 Regional road R1-204 Nova Gorica - Sežana Countermeasure Signalise intersection (3- leg) Length / Sites FSIs saved PV of safety benefit Estimated Cost Cost per FSI saved 1 sites 1 154,584 48,800 81,834 3 BCR Clear roadside hazards - passenger side Clear roadside hazards - driver side Sideslope improvement - passenger side Roadside barriers - passenger side Roadside barriers - driver side Shoulder sealing passenger side (>1m) 7.3 km 3 908,002 41,300 11, km 3 911,576 39,220 11, km 1 13,176 1,080 21, km 10 2,833, ,480 38, km 13 3,418, ,860 35, km 1 177,271 51,780 75,719 3 Shoulder rumble strips 10.1 km 5 1,407, ,830 34,595 7 Shoulder sealing driver side (>1m) 2.7 km 1 158,836 46,120 75,270 3 Total 38 9,982,668 1,304,471 33,874 8 The Star Rating results for the specific road after adopting all the proposed countermeasures are presented in the next figures. Page 58

")
63 5.2.1 Motorway AC-A3 Sežana Gabrk Figure 54: Star Rating map Motorway AC-A3 Sežana Gabrk (After) Figure 55: Star Ratings table Motorway AC-A3 Sežana Gabrk (After) Page 59


64 Figure 56: Star Ratings table Motorway AC-A3 Sežana Gabrk (After Smoothed) Figure 57: Risk Worm Motorway AC-A3 Sežana Gabrk (After) Page 60
) Page")
65 Figure 58: Star Ratings chart Motorway AC-A3 Sežana Gabrk (After) Figure 59: Star Ratings chart Motorway AC-A3 Sežana Gabrk (After Smoothed)) Page 61


66 5.2.2 Regional road R1-204 Nova Gorica Sežana Figure 60: Star Rating map Regional road R1-204 (After) Figure 61: Star Ratings table Regional road R1-204 (After) Page 62
 Figure 63: Star Ratings chart Regional road R1-204")
67 Figure 62: Star Ratings table Regional road R1-204 (After Smoothed) Figure 63: Star Ratings chart Regional road R1-204 (After) Page 63
 Page")
68 Figure 64: Star Ratings chart Regional road R1-204 (After Smoothed)) Regional road R1-204, Section 1013 Figure 65: Star Ratings table Regional road R Section 1013 (After) Page 64

")
69 Figure 66: Star Ratings table Regional road R Section 1013 (After - Smoothed) Figure 67: Risk Worm Regional road R1-204 (After) Page 65
70 Figure 68: Star Ratings chart Regional road R Section 1013 (After) Figure 69: Star Ratings chart Regional road R Section 1013 (After - Smoothed) Page 66
71 6 Tailoring SRIP for a specific road section Having identified a priority location or section of road, it is possible to further tailor the countermeasure plan to suit specific circumstances. This is especially useful if budget constraints have changed. Figure below provides an example of the way in which costeffectiveness may be used to generate a list of priority countermeasures within a limited budget. The initial SRIP involved production of list of all countermeasures that could feasibly be built on the road, sorted in order of descending BCR. The countermeasure download file, available online, was used to generate this list. Motorway AC-A3 Sežana Gabrk As an example, an initial SRIP might show that the cumulative cost of investments with a BCR of 1 or more was slightly over 641,000, as indicated by the red line. An alternative is to set an initial a budget of, say, 300,000. This is indicated by the green line. For this budget, all countermeasures with a BCR of 3 or more could be implemented. Chainage (km) Countermeasure Cost (20 years) Cumulative cost (20 years) BCR 9.7 Clear roadside hazards - passenger side Clear roadside hazards - passenger side Clear roadside hazards - passenger side 490 1, Clear roadside hazards - passenger side 490 1, Roadside barriers - passenger side 8,140 10, Shoulder sealing driver side (>1m) 1,690 11, Shoulder rumble strips 1,100 12, Shoulder rumble strips 1,400 14, Shoulder rumble strips 1,100 15, Roadside barriers - driver side 7,940 23, Roadside barriers - passenger side 7,940 31, Shoulder rumble strips 1,100 32, Roadside barriers - passenger side 7, , Roadside barriers - passenger side 8, , Shoulder rumble strips 1, , Shoulder rumble strips 1, , Roadside barriers - passenger side 7, , Shoulder rumble strips 1, , Shoulder rumble strips 1, , Roadside barriers - passenger side 7, , Roadside barriers - passenger side 7, , Roadside barriers - passenger side 7, , Roadside barriers - passenger side 7, , Roadside barriers - passenger side 7, , Roadside barriers - passenger side 7, , Roadside barriers - passenger side 7, , Shoulder sealing driver side (>1m) 1, , Shoulder sealing driver side (>1m) 1, , Shoulder sealing driver side (>1m) 1, , Shoulder sealing driver side (>1m) 1, , Shoulder sealing driver side (>1m) 1, , Shoulder sealing driver side (>1m) 2, , Shoulder sealing driver side (>1m) 2, , Shoulder sealing driver side (>1m) 2, , Shoulder sealing driver side (>1m) 2, , Roadside barriers - passenger side 7, , Roadside barriers - passenger side 7, , The most cost effective countermeasure is listed first. With a 300,000 budget, all countermeasures with a BCR greater than 3 could be considered. If budget was unlimited, all Countermeasures with a BCR greater than 1 could be considered (above red line). Countermeasures with a BCR below 1.0 should not be considered (below red line). Page 67
72 Regional road R1-204 As an example, an initial SRIP might show that the cumulative cost of investments with a BCR of 1 or more was slightly over 3,587,000, as indicated by the red line. An alternative is to set an initial a budget of, say, 1,000,000. This is indicated by the green line. For this budget, all countermeasures with a BCR of 3.12 or more could be implemented. Chainage (km) Countermeasure Cost (20 years) Cumulative cost (20 years) BCR 0.9 Clear roadside hazards - passenger side Clear roadside hazards - passenger side Clear roadside hazards - driver side 460 1, Clear roadside hazards - passenger side 460 1, Clear roadside hazards - driver side 460 2, Shoulder rumble strips 1,400 3, Clear roadside hazards - driver side 530 4, Clear roadside hazards - passenger side 530 4, Clear roadside hazards - passenger side 530 5, Clear roadside hazards - driver side 460 5, Shoulder sealing driver side (>1m) 1, , Shoulder rumble strips 1, , Roadside barriers - passenger side 8, , Roadside barriers - driver side 8, , Roadside barriers - passenger side 8, , Roadside barriers - passenger side 8, , Roadside barriers - passenger side 8, , Roadside barriers - driver side 8,140 1,006, Roadside barriers - passenger side 8,140 1,014, Shoulder sealing driver side (>1m) 1,690 1,016, Shoulder sealing driver side (>1m) 1,690 1,018, Shoulder sealing driver side (>1m) 1,690 1,019, Shoulder sealing driver side (>1m) 1,480 1,021, Shoulder sealing driver side (>1m) 1,480 1,022, Roadside barriers - driver side 7,660 3,553, Roadside barriers - passenger side 7,660 3,560, Roadside barriers - driver side 7,660 3,568, Shoulder rumble strips 1,100 3,569, Shoulder sealing passenger side (<1m) 1,550 3,571, Roadside barriers - passenger side 7,940 3,579, Roadside barriers - driver side 8,140 3,587, Shoulder rumble strips 1,000 3,588, Centreline rumble strip / flexi-post 2,070 3,590, Centreline rumble strip / flexi-post 2,070 3,592, Centreline rumble strip / flexi-post 2,070 3,594, Central hatching 1,700 3,596, Central hatching 1,700 3,597, Central hatching 1,700 3,599, The most cost effective countermeasure is listed first. With a 1,000,000 budget, all countermeasures with a BCR greater than 3.12 could be considered. If budget was unlimited, all Countermeasures with a BCR greater than 1 could be considered (above red line). Countermeasures with a BCR below 1.0 should not be considered (below red line). Page 68
73 7 Conclusions In 2013, 3,186.3 km of the strategic road network in Slovenia were surveyed by UL FGG-PTI/AMZS using a dedicated survey vehicle and specialised technology. The roads surveyed were SLO motorways/expressways and selected main/regional roads, on total, about half of SLO state road network. The Star Rating results for infrastructure safety are presented for different classes of road user (on a 1-5 scale) vehicle occupants and motorcyclists. 29% of motorways/expressways rate as less than 3-star for vehicle occupants and 7% of the sections rate as less than 3-star for motorcyclists. 59% of selected main/regional roads rate as less than 3-star for vehicle occupants and 70% of the sections rate as less than 3-star for motorcyclists. On the single carriageway parts of the network, the features that lead to death and serious injury in the event of a crash were as expected found to be widely present: o lack of head-on protection, o o o junctions where brutal right-angled side-impacts may occur, hazards such as unprotected trees close to the road, lack of provision for pedestrians and cyclists. These results have been assessed with the potential for fatal and serious casualty reduction predicted in the RAP online software ViDA. On SENSoR SLO motorway/expressway road network, there were 51 fatalities and 169 serious injuries in period , an average of 17 fatalities and 56 serious injuries per year. In total, 1,040 fatalities and serious injuries over 20 years period or 28% could be saved on motorway/expressway road network by implementing SENSoR proposed countermeasures and network upgrading. (Allowing for differences in definition, reporting levels and healthcare, the RAP model assumes 10 serious casualties for every death). The estimated cost of upgrading and rehabilitation along the length of motorway/expressway network is assumed to be about 43,000,000 EUR and will provide a BCR of more than 6. Page 69
74 Proposed countermeasures along the length of motorway/expressway network include installing roadside barriers (passenger side/driver side), shoulder rumble strips, shoulder sealing (drivers and passenger side). On SENSoR SLO main/regional road network, there were 119 fatalities and 664 serious injuries in period , an average of 40 fatalities and 221 serious injuries per year. In total, 3,750 fatalities and serious injuries over 20 years period or 43% could be saved on main/regional road network by implementing SENSoR proposed countermeasures and network upgrading. (Allowing for differences in definition, reporting levels and healthcare, the RAP model assumes 10 serious casualties for every death). The estimated cost of upgrading and rehabilitation along the length of main/regional network is assumed to be about 127,000,000 EUR and will provide a BCR of more than 8. Proposed countermeasures along the length of main/regional network include installing roadside barriers (passenger side/driver side), clearing roadside hazards (passenger and driver side), shoulder rumble strips, shoulder sealing (drivers and passenger side). Benefit Cost Ratios Across the 14 countries for which there are data in the SENSoR project, the range of Benefit Cost Ratios is generally 5 or 6 (8 for Main/Regional roads in Slovenia) for the overall investment programmes when the threshold BCR is 3 (1 in Greece, Bulgaria, Moldova, Romania and Ukraine). For individual countermeasures, the BCRs of those with greatest lifesaving potential are of course higher and in most countries include many in the range between 5 and 10, but in some often up to and around 20. BCRs for some countermeasures are predicted to be even higher, typically if costs of the measures are low (such as with delineation) if the risk reduction is focussed on a very limited part of the network (for example, at crossing facilities for pedestrians at a few sites of high activity), or if a predicted risk is precisely matched with a countermeasure (such as median barriers countering head-on crashes) BCRs for overall country programmes or countermeasures dependent upon many elements, including the acceptance threshold that is set for matching countermeasures with risk over every 100m, the value of life and the countermeasure costs selected. These results for consultation provide a limited scenario of costs and benefits and the ViDA software offers the opportunity for local engineers and policy makers to vary the parameters to match them local circumstances and budgets. Page 70


75 Examples Some of the most effective proposed countermeasures are (photos courtesy of irap): Safety barriers Improve curve delineation Rumble strips Page 71

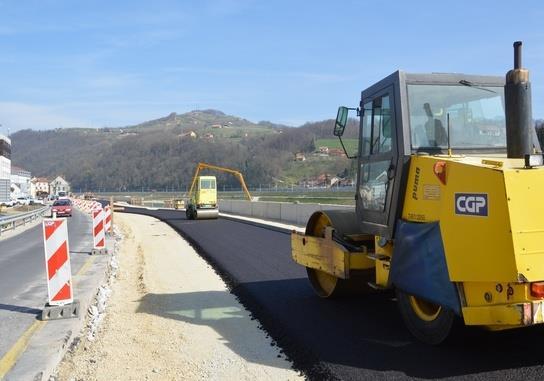
76 Road surface rehabilitation Page 72
77 Annex 1 Traffic Volume Location Road name Location description Start point (km) Survey Motorized Traffic Volumes (AADT) End point Count Type Date/Period Goods (km) Cars Motorcycles vehicles Total AC-A1/0016 LJ(VIČ-KOZARJE) Assessed AC-A1/0017 LJ(BARJANSKA-VIČ) Assessed AC-A1/0018 LJ(DOLENJSKA-BARJANSKA) Assessed AC-A1/0018 LJ(DOLENJSKA-BARJANSKA) QLTC AC-A1/0019 LJ(MALENCE-DOLENJSKA C.) Assessed AC-A1/0030 MEJA A-ŠENTILJ QLD AC-A1/0030 MEJA A-ŠENTILJ QLTC AC-A1/0031 ŠENTILJ-PESNICA QLD AC-A1/0034 SLIVNICA Assessed AC-A1/0035 SLIVNICA-FRAM QLTC AC-A1/0036 FRAM-SL.BISTRICA QLTC AC-A1/0036 FRAM-SL.BISTRICA QLD AC-A1/0037 SL.BISTRICA-SL.KONJICE QLD AC-A1/0037 SL.BISTRICA-SL.KONJICE QLD AC-A1/0038 SL.KONJICE-DRAMLJE QLD AC-A1/0039 DRAMLJE-CELJE QLD AC-A1/0039 DRAMLJE-CELJE Assessed AC-A1/0040 CELJE-ARJA VAS QLTC AC-A1/0040 CELJE-ARJA VAS Assessed Page 73
78 AC-A1/0041 ARJA VAS-ŠENTRUPERT Assessed AC-A1/0041 ARJA VAS-ŠENTRUPERT Assessed AC-A1/0042 ŠENTRUPERT-VRANSKO QLD AC-A1/0043 VRANSKO-TROJANE QLTC AC-A1/0044 BLAGOVICA-KRTINA QLD AC-A1/0044 BLAGOVICA-KRTINA Assessed AC-A1/0045 KRTINA-DOMŽALE Assessed AC-A1/0046 DOMŽALE-ŠENTJAKOB QLTC AC-A1/0047 ŠENTJAKOB-LJ(ZADOBROVA) Assessed AC-A1/0047 ŠENTJAKOB-LJ(ZADOBROVA) Assessed AC-A1/0048 LJ(ZADOBROVA-ZALOŠKA) Assessed AC-A1/0049 LJ(ZALOŠKA-LITIJSKA) Assessed AC-A1/0050 LJ(LITIJSKA-MALENCE) QLTC AC-A1/0051 LJ(KOZARJE)-BREZOVICA Assessed AC-A1/0052 BREZOVICA-VRHNIKA QLTC AC-A1/0053 VRHNIKA-LOGATEC QLD AC-A1/0054 LOGATEC-UNEC QLD AC-A1/0055 UNEC-POSTOJNA QLTC AC-A1/0056 POSTOJNA-RAZDRTO QLD AC-A1/0056 POSTOJNA-RAZDRTO QLD AC-A1/0057 RAZDRTO-SENOŽEČE Assessed AC-A1/0058 SENOŽEČE-GABRK QLTC AC-A1/0059 GABRK-DIVAČA Assessed AC-A1/0060 DIVAČA-KOZINA QLD Page 74
79 AC-A1/0060 DIVAČA-KOZINA QLD AC-A1/0061 KOZINA-ČRNI KAL QLD AC-A1/0061 KOZINA-ČRNI KAL Assessed AC-A1/0062 ČRNI KAL-SRMIN QLTC AC-A1/0065 PESNICA - DRAGUČOVA Assessed AC-A1/0066 MARIBOR(PTUJSKA)-SLIVNICA QLTC AC-A1/0066 MARIBOR(PTUJSKA)-SLIVNICA Assessed AC-A1/0067 TROJANE-BLAGOVICA QLD AC-A1/0071 DRAGUČOVA - MB (PTUJSKA) QLTC AC-A1/0071 DRAGUČOVA - MB (PTUJSKA) Assessed AC-A2/0001 MEJA A(PREDOR)-HRUŠICA QLTC AC-A2/0002 HRUŠICA-LIPCE Assessed AC-A2/0003 LIPCE-LESCE QLTC AC-A2/0004 LESCE-BREZJE QLD AC-A2/0004 LESCE-BREZJE Assessed AC-A2/0005 BREZJE-PODTABOR Assessed AC-A2/0006 PODTABOR-KRANJ Z Assessed AC-A2/0006 PODTABOR-KRANJ Z QLTC AC-A2/0007 KRANJ Z-KRANJ V Assessed AC-A2/0008 KRANJ V-BRNIK Assessed AC-A2/0009 BRNIK-VODICE QLD AC-A2/0010 VODICE-LJ(ŠMARTNO) QLTC AC-A2/0011 LJ(ŠMARTNO-BROD) Assessed AC-A2/0012 LJ(BROD-ŠENTVID) Assessed Page 75
80 AC-A2/0013 ŠENTVID - KOSEZE QLTC AC-A2/0014 LJ(KOSEZE-BRDO) Assessed AC-A2/0015 LJ(BRDO-KOZARJE) QLTC AC-A2/0020 LJ(MALENCE)-ŠMARJE-SAP QLTC AC-A2/0021 ŠMARJE SAP-GROSUPLJE QLD AC-A2/0021 ŠMARJE SAP-GROSUPLJE Assessed AC-A2/0022 GROSUPLJE-IVANČNA GORICA Assessed AC-A2/0022 GROSUPLJE-IVANČNA GORICA QLTC AC-A2/0023 IVANČNA GORICA-BIČ QLD AC-A2/0024 TREBNJE-NOVO MESTO Assessed AC-A2/0024 TREBNJE-NOVO MESTO QLTC AC-A2/0024 TREBNJE-NOVO MESTO Assessed AC-A2/0025 NOVO MESTO-KRONOVO Assessed AC-A2/0026 KRONOVO-DOBRUŠKA VAS QLTC AC-A2/0027 DOBRUŠKA VAS-DRNOVO Assessed AC-A2/0027 DOBRUŠKA VAS-DRNOVO QLD AC-A2/0027 DOBRUŠKA VAS-DRNOVO QLD AC-A2/0028 DRNOVO-BREŽICE QLD AC-A2/0029 BREŽICE-OBREŽJE QLTC AC-A2/0029 BREŽICE-OBREŽJE Assessed AC-A2/0029 BREŽICE-OBREŽJE QLD AC-A2/0072 BIČ-TREBNJE Assessed AC-A2/0072 BIČ-TREBNJE Assessed AC-A3/0068 GABRK-SEŽANA V QLD Page 76
81 AC-A3/0069 SEŽANA V-SEŽANA Z Assessed AC-A3/0070 SEŽANA Z-FERNETIČI QLTC AC-A3/0070 SEŽANA Z-FERNETIČI QLD AC-A4/0091 SLIVNICA - HAJDINA Assessed AC-A4/0091 SLIVNICA - HAJDINA Assessed AC-A4/0091 SLIVNICA - HAJDINA QLTC AC-A4/0091 SLIVNICA - HAJDINA Assessed AC-A4/0092 HAJDINA-DRAŽENCI Assessed AC-A4/0093 DRAŽENCI(-PODLEHNIK) Assessed AC-A4/0094 [JUROVCI] - GRUŠKOVJE - R HRVAŠKA 2012 Assessed AC-A5/0806 DRAGUČOVA - LENART QLTC AC-A5/0806 DRAGUČOVA - LENART QLTC AC-A5/0807 LENART - SV. TROJICA Assessed AC-A5/0808 SV. TROJICA-SV. JURIJ OB ŠČAVNICI Assessed AC-A5/0808 SV. TROJICA-SV. JURIJ OB ŠČAVNICI Assessed AC-A5/0809 SV. JURIJ OB ŠČAVNICI-VUČJA VAS QLTC AC-A5/0810 VUČJA VAS-MURSKA SOBOTA QLTC AC-A5/0811 MURSKA SOBOTA-LIPOVCI QLTC AC-A5/0812 LIPOVCI - TURNIŠČE Assessed AC-A5/0812 LIPOVCI - TURNIŠČE Assessed AC-A5/0813 TURNIŠČE-DOLGA VAS Assessed AC-A5/0814 DOLGA VAS-LENDAVA QLTC AC-A5/0816 LENDAVA-PINCE QLTC AC-A5/0816 LENDAVA-PINCE Assessed Page 77
82 G1-1/0246 MB (TRŽAŠKA C.)-MIKLAVŽ QLTC G1-1/0326 MB (KOR. MOST-C. PROL. BRIGAD) QLTC G1-1/0364 MB (C. PROL. BRIG.-TRŽAŠKA C.) Assessed G1-11/1062 KOPER-DRAGONJA QLTC G1-11/1062 KOPER-DRAGONJA QLD G1-11/1062 KOPER-DRAGONJA QLD G1-11/1475 SLAVČEK-LUKA KOPER Assessed G1-11/1475 SLAVČEK-LUKA KOPER Assessed G1-2/0249 PTUJ-SPUHLJA QLTC G1-2/0250 SPUHLJA-ORMOŽ QLTC G1-2/0250 SPUHLJA-ORMOŽ QLD G1-2/0392 PRAGERSKO-ŠIKOLE QLTC G1-2/0393 ŠIKOLE-HAJDINA QLTC G1-2/0393 ŠIKOLE-HAJDINA QLTC G1-2/0395 PTUJ (TURNIŠČE- BUDINA) QLTC G1-2/0398 ORMOŽ Z-ORMOŽ V QLD G1-2/1290 SL.BISTRICA-PRAGERSKO QLTC G1-2/1313 ORMOŽ-SREDIŠČE OB DRAVI QLD G1-2/1313 ORMOŽ-SREDIŠČE OB DRAVI QLD G1-4/1257 DRAVOGRAD-OTIŠKI VRH QLTC G1-4/1258 OTIŠKI VRH-SL.GRADEC QLD G1-4/1259 SL.GRADEC-ZG.DOLIČ QLTC G1-4/1259 SL.GRADEC-ZG.DOLIČ QLTC G1-4/1260 ZG.DOLIČ-VELENJE QLTC Page 78
83 G1-4/1261 VELENJE-ČRNOVA QLTC G1-4/1262 ČRNOVA-ARJA VAS QLTC G1-4/1445 SL.GRADEC Assessed G1-5/0328 CELJE-ŠMARJETA Assessed G1-5/0328 CELJE-ŠMARJETA QLTC G1-5/0328 CELJE-ŠMARJETA QLTC G1-5/0329 ŠMARJETA-RIMSKE TOPLICE QLD G1-5/0330 RIM.TOPLICE-ZIDANI MOST Manual G1-5/0331 ZIDANI MOST-RADEČE QLD G1-5/0332 RADEČE-BOŠTANJ QLTC G1-5/0333 BOŠTANJ QLTC G1-5/0334 BOŠTANJ-IMPOLJCA Assessed G1-5/0335 IMPOLJCA-BRESTANICA QLD G1-5/0336 KRŠKO-DRNOVO QLTC G1-5/0336 KRŠKO-DRNOVO Assessed G1-5/0360 RADEČE Assessed G1-5/0361 BRESTANICA-KRŠKO QLTC G1-5/0370 MEDLOG-CELJE QLTC G1-5/1401 PRIKLJ. CELJE Z-MEDLOG QLD G1-6/0338 POSTOJNA-PIVKA QLTC G1-6/0339 PIVKA-RIBNICA QLTC G1-6/0340 RIBNICA-PREM Manual G1-6/0341 PREM-IL.BISTRICA Manual G1-6/0342 IL.BISTRICA (TRNOVO) Assessed Page 79
84 G1-6/0343 IL.BISTRICA-JELŠANE QLD G1-6/0343 IL.BISTRICA-JELŠANE QLTC G1-6/0363 IL.BISTRICA (DO PODGRAJSKE UL.) Assessed G1-7/0353 KOZINA-KRVAVI POTOK QLTC G1-7/0354 OBROV-KOZINA QLD G1-7/0355 PODGRAD-OBROV QLTC G1-7/0356 STAROD-PODGRAD QLTC G1-8/0213 LJ(ŠENTVID-OBVOZNICA) QLD G1-9/0351 JUROVCI-GRUŠKOVJE QLTC G1-9/0351 JUROVCI-GRUŠKOVJE QLTC G1-9/0362 JUROVCI Assessed G1-9/1503 DRAŽENCI-JUROVCI (LANCOVA VAS) Assessed G2-101/0230 ZVIRČE-PODTABOR Manual G2-101/0231 BISTRICA(TRŽIČ)-ZVIRČE QLD G2-101/0232 LJUBELJ-BISTRICA(TRŽIČ) QLD G2-102/1005 KOBARID-IDRSKO QLD G2-102/1006 IDRSKO-PERŠETI QLD G2-102/1030 STARO SELO-KOBARID Manual G2-102/1031 ROBIČ-STARO SELO QLD G2-102/1031 ROBIČ-STARO SELO QLD G2-102/1033 GODOVIČ-KALCE QLTC G2-102/1034 SP.IDRIJA-GODOVIČ QLD G2-102/1035 SPODNJA IDRIJA Assessed G2-102/1036 ŽELIN-SP.IDRIJA(MAROF) QLD Page 80
85 G2-102/1037 DOL.TREBUŠA-ŽELIN QLD G2-102/1038 BAČA-DOL.TREBUŠA QLD G2-102/1039 MOST NA SOČI-BAČA Manual G2-102/1040 PERŠETI-MOST NA SOČI QLD G2-102/1460 KALCE-LOGATEC QLD G2-102/1461 LOGATEC QLTC G2-104/0087 LJ(ČRNUČE-TOMAČEVO) QLTC G2-104/0087 LJ(ČRNUČE-TOMAČEVO) Assessed G2-104/0295 TRZIN-LJ(ČRNUČE) QLTC G2-104/1136 KRANJ-SP.BRNIK QLTC G2-104/1136 KRANJ-SP.BRNIK QLD G2-104/1137 SP.BRNIK-MOSTE QLTC G2-104/1138 MOSTE-MENGEŠ QLTC G2-104/1139 MENGEŠ (KOLODVORSKA C.)-TRZIN QLTC G2-104/1139 MENGEŠ (KOLODVORSKA C.)-TRZIN QLTC G2-104/1388 MENGEŠ (KAMNIŠKA C. KOLOD. C.) Assessed G2-104/1496 MENGEŠ (SLOVENSKA C.) Assessed G2-105/0254 NOVO MESTO (AC-LOČNA) Assessed G2-105/0255 NOVO MESTO(KRKA-REVOZ) QLTC G2-105/0256 NOVO MESTO(REVOZ)-METLIKA QLD G2-105/0257 NOVO MESTO (LOČNA-KRKA) QLTC G2-105/0258 METLIKA-MOST ČEZ KOLPO QLD G2-105/1511 NOVO MESTO (KRKA) QLTC G2-106/0216 ŠKOFLJICA-ŠMARJE SAP QLD Page 81
86 G2-107/1238 MESTINJE-PODPLAT QLTC G2-107/1274 CELJE-ŠENTJUR QLTC G2-107/1274 CELJE-ŠENTJUR QLD G2-107/1275 ŠENTJUR-MESTINJE QLD G2-107/1275 ŠENTJUR-MESTINJE QLD G2-107/1276 PODPLAT-ROGATEC QLD G2-107/1276 PODPLAT-ROGATEC QLD G2-107/1276 PODPLAT-ROGATEC QLD G2-107/1277 ROGATEC-DOBOVEC Assessed G2-107/1277 ROGATEC-DOBOVEC QLD G2-108/1180 ČRNUČE-ŠENTJAKOB QLD G2-108/1181 ŠENTJAKOB-RIBČE QLD G2-108/1181 ŠENTJAKOB-RIBČE QLD G2-108/1182 RIBČE-LITIJA QLD G2-108/1183 LITIJA-ZAGORJE QLD G2-108/1184 ZAGORJE-TRBOVLJE QLD G2-108/1185 TRBOVLJE-HRASTNIK QLD G2-108/1186 HRASTNIK-ZIDANI MOST QLD G2-109/0357 LENDAVA-PETIŠOVCI Manual G2-109/0357 LENDAVA-PETIŠOVCI QLD G2-109/1453 MEJNI PLATO - MEJA MADŽARSKA QLTC G2-111/0239 VALETA-SEČOVLJE Assessed G2-111/0239 VALETA-SEČOVLJE QLD G2-111/0239 VALETA-SEČOVLJE QLD Page 82
87 G2-111/0373 RUDA(IZOLA)-VALETA QLTC G2-111/0373 RUDA(IZOLA)-VALETA QLTC G2-111/1504 KOPER (ŽUSTERNA)-IZOLA (RUDA) QLTC G2-112/1254 HOLMEC-POLJANA QLD G2-112/1255 POLJANA-RAVNE QLD G2-112/1255 POLJANA-RAVNE QLTC G2-112/1256 RAVNE-DRAVOGRAD QLD HC-H2/0032 PESNICA-MARIBOR QLTC HC-H2/0033 MARIBOR-TEZNO Assessed HC-H2/0033 MARIBOR-TEZNO QLTC HC-H3/0085 LJ(ZADOBROVA-ŠMARTINSKA) QLTC HC-H3/0085 LJ(ZADOBROVA-ŠMARTINSKA) QLTC HC-H3/0086 LJ(ŠMARTINSKA-TOMAČEVO) Assessed HC-H3/0088 LJ(TOMAČEVO-DUNAJSKA) Assessed HC-H3/0089 LJ(DUNAJSKA-CELOVŠKA) Assessed HC-H3/0089 LJ(DUNAJSKA-CELOVŠKA) QLTC HC-H3/0089 LJ(DUNAJSKA-CELOVŠKA) Assessed HC-H3/0090 LJ(CELOVŠKA-KOSEZE) QLTC HC-H5/0236 SRMIN-BERTOKI Assessed HC-H5/0237 BERTOKI-KP(ŠKOCJAN) QLTC HC-H5/0388 ŠKOFIJE-SRMIN QLD HC-H5/0388 ŠKOFIJE-SRMIN QLTC HC-H5/0388 ŠKOFIJE-SRMIN Assessed HC-H5/0388 ŠKOFIJE-SRMIN Assessed Page 83
88 HC-H6/0238 KOPER (SLAVČEK-SEMEDELA) Assessed HC-H6/0389 KOPER (SEMEDELA-ŽUSTERNA)-(IZOLA) Assessed HC-H7/0815 A5-DOLGA VAS Assessed HC-H7/0817 DOLGA VAS - RONDO DOLGA VAS Assessed R1-201/0201 KORENSKO SEDLO-PODKOREN QLD R1-201/0202 PODKOREN-KR.GORA Assessed R1-201/0203 KR.GORA-MOJSTRANA-DOVJE QLTC R1-201/0203 KR.GORA-MOJSTRANA-DOVJE QLD R1-201/0204 DOVJE-MOJSTRANA-KRAJE QLD R1-201/0205 KRAJE - HRUŠICA QLD R1-202/0233 RATEČE-PODKOREN Manual R1-202/0234 DRŽAVNA MEJA-RATEČE QLD R1-203/1002 PREDEL-BOVEC QLD R1-203/1002 PREDEL-BOVEC Manual R1-203/1003 BOVEC(PO OBVOZNICI)-ŽAGA QLD R1-203/1004 ŽAGA-KOBARID QLD R1-204/1012 ŠEMPETER-DORNBERK QLD R1-204/1012 ŠEMPETER-DORNBERK QLD R1-204/1013 DORNBERK-ŠTANJEL QLD R1-204/1014 ŠTANJEL-DUTOVLJE Manual R1-204/1015 DUTOVLJE-SEŽANA QLD R1-205/1026 DIVAČA-LOKEV-LIPICA QLD R1-206/1027 KRANJSKA GORA-ERIKA QLD R1-206/1028 VRŠIČ-TRENTA QLD Page 84
89 R1-206/1029 TRENTA-BOVEC QLD R1-206/1043 RUSKA CESTA (ERIKA-VRŠIČ) Assessed R1-207/1057 GODOVIČ-ČRNI VRH QLD R1-207/1058 ČRNI VRH-COL Assessed R1-207/1413 COL-AJDOVŠČINA QLD R1-208/1059 KORTINE-GRAČIŠČE QLD R1-208/1060 GRAČIŠČE-SOČERGA Manual R1-208/1060 GRAČIŠČE-SOČERGA QLTC R1-208/1149 RIŽANA-KORTINE Manual R1-208/1434 ČRNI KAL-KORTINE QLD R1-209/1088 LESCE-BLED QLTC R1-209/1089 BLED-SOTESKA QLD R1-209/1089 BLED-SOTESKA QLD R1-209/1090 SOTESKA-BITNJE Assessed R1-209/1091 BITNJE-BOH.BISTRICA Assessed R1-209/1092 BOH.BISTRICA-JEZERO QLD R1-210/1077 ŠKOFJA LOKA QLTC R1-210/1078 ŠKOFJA LOKA-JEPRCA QLD R1-210/1105 ZG.JEZERSKO-SP.JEZERSKO QLD R1-210/1105 ZG.JEZERSKO-SP.JEZERSKO Assessed R1-210/1106 SP.JEZERSKO-PREDDVOR QLD R1-210/1107 PREDDVOR-KR(PRIMSKOVO) QLD R1-210/1108 KR(PRIMSKOVO-LABORE) QLTC R1-210/1109 KRANJ-ŠKOFJA LOKA QLTC Page 85
90 R1-210/1110 ŠK.LOKA-GORENJA VAS QLD R1-210/1111 GORENJA VAS-TREBIJA QLD R1-210/1112 TREBIJA-SOVODENJ QLD R1-210/1113 SOVODENJ-CERKNO Assessed R1-210/1114 CERKNO-ŽELIN QLD R1-211/0211 KRANJ(LABORE)-JEPRCA QLD R1-211/0212 JEPRCA-LJ(ŠENTVID) QLTC R1-211/0212 JEPRCA-LJ(ŠENTVID) QLTC R1-211/0212 JEPRCA-LJ(ŠENTVID) Assessed R1-212/1115 PRIKLJUČEK UNEC-UNEC Assessed R1-212/1116 UNEC-RAKEK QLTC R1-212/1117 RAKEK-CERKNICA QLD R1-212/1118 CERKNICA-BL.POLICA QLD R1-212/1119 BL.POLICA-SODRAŽICA QLD R1-212/1120 SODRAŽICA-ŽLEBIČ QLTC R1-213/1365 BLOŠKA POLICA-PUDOB QLD R1-213/1366 PUDOB-BABNO POLJE QLD R1-214/1156 KOČEVJE-STARI LOG Assessed R1-214/1157 STARI LOG-DVOR QLD R1-215/1162 TREBNJE-MOKRONOG PRAZNO R1-215/1162 TREBNJE-MOKRONOG QLD R1-215/1163 MOKRONOG-BOŠTANJ QLD R1-215/1490 GRM - TREBNJE Assessed R1-215/1491 PRIKLJ. TREBNJE V - GRM Assessed Page 86
91 R1-215/1506 TREBNJE (ODRGA-KAMNA GORA) Assessed R1-216/1158 ŽUŽEMBERK-DVOR QLD R1-216/1175 KRKA-ŽUŽEMBERK QLD R1-216/1176 DVOR-SOTESKA QLD R1-216/1177 SOTESKA-ČRMOŠNJICE QLD R1-216/1178 ČRMOŠNJICE-ČRNOMELJ Manual R1-216/1178 ČRMOŠNJICE-ČRNOMELJ QLD R1-216/1367 IVANČNA GORICA-KRKA QLD R1-217/1208 LIVOLD-BREZOVICA QLD R1-217/1209 BREZOVICA-KANIŽARICA Manual R1-217/1209 BREZOVICA-KANIŽARICA QLD R1-218/1152 ČRNOMELJ Assessed R1-218/1153 VINICA Assessed R1-218/1211 METLIKA-PODZEMELJ Manual R1-218/1212 PODZEMELJ-ČRNOMELJ QLD R1-218/1213 ČRNOMELJ-KANIŽARICA QLD R1-218/1214 KANIŽARICA-VINICA QLD R1-218/1215 VINICA-MOST ČEZ KOLPO QLD R1-219/1236 SL.BISTRICA-POLJČANE QLD R1-219/1237 POLJČANE-PODPLAT QLD R1-219/1239 MESTINJE-GOLOBINJEK QLD R1-219/1240 GOLOBINJEK-BISTRICA QLD R1-219/1241 BISTRICA-BIZELJSKO QLD R1-219/1242 BIZELJSKO-ČATEŽ QLD Page 87
92 R1-219/1242 BIZELJSKO-ČATEŽ QLTC R1-219/1410 POLJČANE Assessed R1-219/1421 BISTRICA OB SOTLI Assessed R1-219/1480 ČATEŽ OB SAVI Assessed R1-220/1334 KRŠKO-BREŽICE QLD R1-220/1334 KRŠKO-BREŽICE QLD R1-221/1218 IZLAKE-ZAGORJE QLD R1-221/1219 ZAGORJE-BEVŠKO QLD R1-221/1220 BEVŠKO-TRBOVLJE QLD R1-221/1221 TRBOVLJE-BOBEN-HRASTNIK Manual R1-221/1222 HRASTNIK-ŠMARJETA QLD R1-221/1227 TROJANE-IZLAKE QLD R1-222/1228 ZAGORJE-MOST ČEZ SAVO QLD R1-223/1229 BEVŠKO-MOST ČEZ SAVO QLTC R1-224/1230 HRASTNIK-MOST ČEZ SAVO QLTC R1-225/1083 KAMNIK(MEKINJE)-STAHOVICA QLD R1-225/1083 KAMNIK(MEKINJE)-STAHOVICA Assessed R1-225/1084 STAHOVICA-ČRNIVEC Manual R1-225/1085 ČRNIVEC-RADMIRJE QLD R1-225/1085 ČRNIVEC-RADMIRJE QLD R1-225/1140 MENGEŠ-DUPLICA QLTC R1-225/1246 SOTESKA-ŠENTRUPERT QLD R1-225/1246 SOTESKA-ŠENTRUPERT QLD R1-225/1246 SOTESKA-ŠENTRUPERT Assessed Page 88
93 R1-225/1246 SOTESKA-ŠENTRUPERT QLD R1-225/1247 MOZIRJE-SOTESKA Manual R1-225/1248 RADMIRJE-MOZIRJE QLD R1-225/1248 RADMIRJE-MOZIRJE QLTC R1-225/1359 DUPLICA-KAMNIK QLTC R1-225/1424 KAMNIK(-MEKINJE) Assessed R1-227/1264 RAVNE-KOTLJE QLD R1-227/1423 KOTLJE-SLOVENJ GRADEC QLTC R1-227/1423 KOTLJE-SLOVENJ GRADEC Assessed R1-228/1291 SPUHLJA-ZAVRČ QLTC R1-228/1291 SPUHLJA-ZAVRČ QLD R1-229/0248 PTUJ (BUDINA-CENTER) Assessed R1-229/1286 ROGOZNICA-SENARSKA QLD R1-229/1417 PTUJ-ROGOZNICA Assessed R1-230/0251 ORMOŽ-MOST ČEZ DRAVO QLD R1-230/0327 MOST ČEZ MURO - G. RADGONA QLTC R1-230/0366 GORNJA RADGONA-RADENCI QLD R1-230/1164 RADENCI Assessed R1-230/1308 RADENCI-VUČJA VAS QLD R1-230/1309 KRIŽEVCI-LJUTOMER QLTC R1-230/1310 LJUTOMER-PAVLOVCI QLD R1-230/1311 PAVLOVCI-ORMOŽ QLTC R1-230/1312 ORMOŽ Assessed R1-230/1399 VUČJA VAS-KRIŽEVCI QLD Page 89
94 R1-230/1415 KRIŽEVCI Assessed R1-231/1323 RAZKRIŽJE-STROČJA VAS Assessed R1-231/1325 GIBINA-RAZKRIŽJE QLD R1-231/1327 STROČJA VAS-LJUTOMER QLD R1-232/1314 HODOŠ-PETROVCI QLD R1-232/1314 HODOŠ-PETROVCI Assessed R1-232/1314 HODOŠ-PETROVCI QLD R1-232/1315 PETROVCI-MARTJANCI Assessed R1-232/1315 PETROVCI-MARTJANCI QLD R1-232/1316 MARTJANCI-M.SOBOTA QLD R1-232/1406 M.SOBOTA-LIPOVCI QLD R1-232/1470 MURSKA SOBOTA Assessed R1-234/1280 DOLE-ŠENTJUR QLD R1-234/1476 DRAMLJE-DOLE QLD R1-235/0317 RADENCI-PETANJCI QLD R1-235/0318 PETANJCI-M.SOBOTA (GAJ) QLD R1-235/1396 M.SOBOTA (GAJ)-PRIKLJ. M.SOBOTA QLD R2-409/0300 BREZOVICA-VRHNIKA QLTC R2-409/0300 BREZOVICA-VRHNIKA QLD R2-409/0301 VRHNIKA-LOGATEC QLD R2-409/0302 LOGATEC (TRŽAŠKA C.) Assessed R2-409/0303 KALCE-PLANINA Manual R2-409/0304 PLANINA-RAVBARKOMANDA QLD R2-409/0305 RAVBARKOMANDA-POSTOJNA Assessed Page 90
95 R2-409/0305 RAVBARKOMANDA-POSTOJNA Assessed R2-409/0306 POSTOJNA-RAZDRTO QLTC R2-409/0307 RAZDRTO-SENOŽEČE Manual R2-409/0308 SENOŽEČE-DIVAČA QLD R2-409/0309 DIVAČA-MATAVUN QLD R2-409/0310 MATAVUN-KOZINA Manual R2-409/0311 KOZINA-KASTELEC QLD R2-409/0312 KASTELEC-ČRNI KAL Assessed R2-409/0313 RIŽANA-DEKANI QLD R2-409/0358 LJ(VIČ)-BREZOVICA QLTC R2-409/1435 KORTINE-RIŽANA Assessed R2-409/1438 DEKANI-PRIKLJ. SRMIN Assessed R2-411/1428 POLICA-PODTABOR QLD R2-411/1428 POLICA-PODTABOR QLD R2-411/1429 GOBOVCE-ČRNIVEC QLD R2-411/1471 KRANJ Z-POLICA Assessed R2-411/1528 PODTABOR-GOBOVCE Assessed R2-415/1216 ŽELODNIK-DRTIJA Assessed R2-415/1216 ŽELODNIK-DRTIJA QLD R2-415/1216 ŽELODNIK-DRTIJA Assessed R2-415/1217 DRTIJA-IZLAKE Assessed R2-415/1217 DRTIJA-IZLAKE QLD R2-419/1203 SOTESKA-NOVO MESTO QLD R2-419/1203 SOTESKA-NOVO MESTO QLD Page 91
96 R2-419/1203 SOTESKA-NOVO MESTO Assessed R2-419/1204 NOVO MESTO-ŠENTJERNEJ Manual R2-419/1204 NOVO MESTO-ŠENTJERNEJ QLD R2-419/1205 ŠENTJERNEJ-KRIŽAJ QLD R2-419/1205 ŠENTJERNEJ-KRIŽAJ QLD R2-419/1206 KRIŽAJ-ČATEŽ OB SAVI QLD R2-430/0273 MARIBOR(PTUJSKA)-HOČE Assessed R2-430/0273 MARIBOR(PTUJSKA)-HOČE Assessed R2-430/0274 SLIVNICA-SL.BISTRICA QLD R2-430/0274 SLIVNICA-SL.BISTRICA QLD R2-430/0275 SL.BISTRICA Assessed R2-430/0276 SL.BISTRICA-LOŽNICA PRAZNO R2-430/0277 LOŽNICA-TEPANJE QLD R2-430/0278 TEPANJE-SL.KONJICE QLD R2-430/0279 SL.KONJICE Assessed R2-430/0280 SL.KONJICE-STRANICE QLTC R2-430/0280 SL.KONJICE-STRANICE QLD R2-430/0281 STRANICE-VIŠNJA VAS QLD R2-430/0282 VIŠNJA VAS-CELJE QLD R2-430/0282 VIŠNJA VAS-CELJE QLTC R2-430/0381 HOČE-SLIVNICA QLTC R2-430/1452 ODCEP DO PRIKLJ SL.BISTRICA SEVER Manual R2-444/0344 RAZDRTO-MANČE QLD R2-444/0345 MANČE-VIPAVA QLD Page 92
97 R2-444/0346 AJDOVŠČINA-SELO QLD R2-444/0347 SELO-NOVA GORICA QLD R2-444/0347 SELO-NOVA GORICA QLTC R2-444/0347 SELO-NOVA GORICA QLD R2-444/0348 N.GORICA-ROŽNA DOLINA QLD R2-444/0365 NOVA GORICA Assessed R2-444/0387 AJDOVŠČINA (OBVOZNICA) QLTC R2-444/1473 VIPAVA-AJDOVŠČINA Assessed R2-444/1473 VIPAVA-AJDOVŠČINA QLD R2-447/0286 MEDLOG-PETROVČE QLD R2-447/0287 PETROVČE-ŽALEC Assessed R2-447/0288 ŠEMPETER-LATKOVA VAS Assessed R2-447/0289 LATKOVA VAS-ŠENTRUPERT Assessed R2-447/0290 ŠENTRUPERT-LOČICA QLD R2-447/0290 ŠENTRUPERT-LOČICA QLD R2-447/0291 LOČICA-TROJANE QLD R2-447/0292 TROJANE-ŽELODNIK QLD R2-447/0292 TROJANE-ŽELODNIK QLD R2-447/0293 ŽELODNIK-DOMŽALE QLD R2-447/0294 DOMŽALE-TRZIN QLTC R2-447/0294 DOMŽALE-TRZIN QLTC R2-447/0367 ŽALEC-ŠEMPETER QLTC R2-447/0367 ŽALEC-ŠEMPETER QLD R2-448/0220 PRIKLJ. TREBNJE Z-TREBNJE QLD Page 93
98 R2-448/0221 GRM - ŠENTJURIJ QLD R2-448/0222 PRIKLJ. NM ZAHOD-LOČNA Assessed R2-448/0223 NM(MAČKOVEC)-OTOČEC QLTC R2-448/0223 NM(MAČKOVEC)-OTOČEC QLD R2-448/0224 OTOČEC-KRONOVO QLD R2-448/1160 PLUSKA - PRIKLJ. TREBNJE Z Assessed R2-448/1196 IVANČNA GORICA-GRM QLD R2-448/1197 GRM-PLUSKA Manual R2-448/1510 KARTELJEVO-PRIKLJ. NM ZAHOD Manual R2-448/1512 NOVO MESTO (LOČNA-MAČKOVEC) Manual R2-448/1513 KRONOVO-DOLENJE KRONOVO Assessed R2-448/1514 DOLENJE KRONOVO-DOBRAVA QLD R2-448/1514 DOLENJE KRONOVO-DOBRAVA Assessed R2-452/0206 JAVORNIK-ŽIROVNICA QLD R2-452/0207 ŽIROVNICA-LESCE QLD R2-452/0208 LESCE-ČRNIVEC QLD R2-452/0208 LESCE-ČRNIVEC QLD R2-452/0208 LESCE-ČRNIVEC Manual R2-452/0368 HRUŠICA-JAVORNIK QLD R2-452/0368 HRUŠICA-JAVORNIK Assessed R2-452/0368 HRUŠICA-JAVORNIK QLD Page 94
99 Annex 2 Operating speed SLO SENSoR Speeds (all speeds in km/h) Road Type Legislated speed limit Analysed mean speed Coded Mean speed as in raw data file Analysed 85th percentile speed Coded 85th percentile as in raw data file Motorways 130 km/h 107 km/h 110 km/h 125 km/h 130 km/h Motorways 110 km/h 103 km/h 105 km/h 127 km/h 125 km/h Motorways 100 km/h 100 km/h 100 km/h 114 km/h 115 km/h Motorway junctions 80 km/h 81 km/h* 80 km/h 92 km/h* 90 km/h Motorway toll stations 60 km/h 65 km/h* 65 km/h 75 km/h* 75 km/h Motorway toll stations 40 km/h 50 km/h* 50 km/h 57 km/h* 55 km/h Expressways 110 km/h 100 km/h 100 km/h 115 km/h 115 km/h Expressways 80 km/h 85 km/h 85 km/h 92 km/h 90 km/h State roads (Rural) 90 km/h 65 km/h 65 km/h 80 km/h 80 km/h State roads (Rural) 80 km/h 65 km/h 65 km/h 78 km/h 80 km/h State roads (Rural) 70 km/h 65 km/h 65 km/h 77 km/h 75 km/h State roads (Rural) 60 km/h 62 km/h 60 km/h 75 km/h 75 km/h State roads (Rural) 50 km/h 54 km/h 55 km/h 65 km/h 65 km/h State roads (Rural) 40 km/h 45 km/h 45 km/h 55 km/h 50 km/h State roads (Semi- Urban) State roads (Semi- Urban) 90 km/h 80 km/h* 80 km/h 90 km/h* 90 km/h 80 km/h 70 km/h* 70 km/h 80 km/h* 80 km/h State roads (Urban) 70 km/h 62 km/h 60 km/h 75 km/h 75 km/h State roads (Urban) 60 km/h 52 km/h 50 km/h 60 km/h 60 km/h State roads (Urban) 50 km/h 53 km/h 55 km/h 63 km/h 60 km/h State roads (Urban) 40 km/h 48 km/h 50 km/h 58 km/h 60 km/h State roads (Urban) 30 km/h 34 km/h* 35 km/h 40 km/h* 40 km/h * expert estimation Page 95
100 Mean speeds reductions Road Type Legislated speed limit Mean speed Sharp and very sharp curve (-20%) Continual sharp and very sharp curves (-40%) Steep grade and sharp curvature (-50%) Analysed Coded Analysed Coded Analysed Coded Analysed Coded Motorways / / / / / / Motorways / / / / / / Motorways / / / / / / Motorway junctions 80 81* 80 / / / / / / Motorway toll stations 60 65* 65 / / / / / / Motorway toll stations 40 50* 50 / / / / / / Expressways / / / / / / Expressways / / / / / / State roads (Rural) State roads (Rural) State roads (Rural) State roads (Rural) State roads (Rural) State roads (Rural) State roads (Semi-Urban) 90 80* State roads (Semi-Urban) 80 70* State roads (Urban) State roads (Urban) State roads (Urban) State roads (Urban) State roads (Urban) 30 34* * expert estimation / not applicable Page 96
101 85 th percentile speeds reductions Road Type Legislated speed limit 85th percentile speed Analysed Coded Motorways Motorways Motorways Motorway junctions 80 92* 90 Motorway toll stations 60 75* 75 Motorway toll stations 40 57* 55 Expressways Expressways State roads (Rural) State roads (Rural) State roads (Rural) State roads (Rural) State roads (Rural) State roads (Rural) State roads (Semi-Urban) 90 90* 90 State roads (Semi-Urban) 80 80* 80 State roads (Urban) State roads (Urban) State roads (Urban) State roads (Urban) State roads (Urban) 30 40* 40 * expert estimation Page 97
102 Annex 3 Countermeasure costs Countermeasure Carriageway Code Unit of Cost Service Life (1) RURAL Low Upgrade Cost RURAL Med Upgrade Cost RURAL High Upgrade Cost URBAN Low Upgrade Cost URBAN Med Upgrade Cost URBAN High Upgrade Cost Improve Delineation Individual lane km 5 7,300 7,300 7,300 9,000 9,400 10,700 Bicycle Lane (on-road) Individual per km 20 6,000 11,600 24,600 8,000 9,000 10,000 Bicycle Lane (off-road) Individual per km 20 87,600 95, , , , ,300 Motorcycle Lane (Painted logos only on-road) Individual per km 5 2,960 2,960 2,960 3,200 3,500 4,300 Motorcycle Lane (Construct on-road) Individual per km 20 67, , ,600 74, , ,000 Motorcycle Lane (Segregated) Individual per km 20 97, , , , , ,500 Horizontal Realignment Individual lane km , , , , , ,600 Improve Curve Delineation Individual per cw km 5 8,800 12,700 18,000 13,500 16,000 23,600 Lane widening (up to 0.5m) Individual lane km , , , , , ,200 Lane widening (>0.5m) Individual lane km , , , , , ,200 Protected turn lane (unsignalised 3 leg) Multi intersection 10 31, , ,800 38, , ,500 Protected turn lane (unsignalised 4 leg) Multi intersection 10 31, , ,100 43, , ,800 Delineation and signing (intersection) Multi intersection 5 9,100 10,700 13,600 12,000 14,100 26,500 Protected turn provision at existing signalised site (3-leg) Multi intersection 10 11,600 15,000 28,000 17,000 26,000 47,300 Protected turn provision at existing signalised site (4-leg) Multi intersection 10 11,600 15,100 25,800 17,000 28,000 46,400 Signalise intersection (3-leg) Multi intersection 20 48,800 48,800 48,800 63,500 63,500 63,500 Signalise intersection (4-leg) Multi intersection 20 57,400 57,400 57,400 78,000 78,000 78,000 Page 98
103 Grade separation Multi intersection 50 1,230,000 2,835,000 5,376,000 1,600,000 3,700,000 7,000,000 Rail crossing upgrade Multi intersection 20 80, , ,000 98, , ,000 Roundabout Multi intersection , , , , , ,000 Central hatching Multi per km 10 15,000 15,000 15,000 17,000 17,000 17,000 Rumble strip / flexi-post Multi per km 10 20,700 22,500 26,200 24,000 25,800 29,500 Central turning lane full length Multi per km , , , , , ,100 Central median barrier (no duplication) Multi per km 10 80,400 97, , , , ,000 Duplication with median barrier Undivided Only per cw km 20 3,200,000 3,700,000 4,700,000 4,500,000 5,250,000 6,750,000 Duplicate - <1m median Undivided Only per cw km 20 2,590,000 3,027,000 3,903,000 3,050,000 3,550,000 4,550,000 Duplicate m median Undivided Only per cw km 20 2,320,000 2,620,000 3,220,000 3,400,000 3,900,000 4,900,000 Duplicate m median Undivided Only per cw km 20 2,560,000 2,860,000 3,460,000 3,700,000 4,200,000 5,200,000 Duplicate m median Undivided Only per cw km 20 3,120,000 3,323,000 3,853,000 4,400,000 4,829,000 5,693,000 Duplicate - >20m median Undivided Only per cw km 20 4,320,000 4,583,000 5,047,000 5,900,000 6,289,000 7,179,000 Service road Individual per km , , , , , ,500 Additional lane (2 + 1 road) Individual per km 20 1,140,000 1,265,000 1,515,000 1,800,000 2,050,000 2,550,000 Implement one way network Undivided Only per cw km 20 65,000 71,300 83,800 90,000 99, ,100 Upgrade pedestrian facility quality Individual unit 10 6,000 6,500 7,500 7,000 9,000 11,500 Refuge Island Multi unit 10 16,000 19,000 25,000 25,000 30,100 40,100 Unsignalised crossing Multi unit 10 3,400 3,600 3,900 6,800 7,200 7,800 Signalised crossing Multi unit 20 21,320 25,120 32,620 47,900 57,900 77,900 Grade separated pedestrian facility Multi unit 50 90, , , , , ,000 Road surface rehabilitation Individual lane km 10 13,040 15,540 20,540 26,000 30,000 40,000 Clear roadside hazards - passenger side Individual per linear km 20 4,600 4,900 5,300 6,500 6,800 7,400 Clear roadside hazards - driver side Individual per linear km 20 4,600 4,900 5,300 6,500 6,800 7,400 Page 99
104 Sideslope improvement - passenger side Individual per linear km 20 10,800 13,800 17,200 13,500 16,000 21,000 Sideslope improvement - driver side Individual per linear km 20 10,800 13,800 17,200 13,500 16,000 21,000 Roadside barriers - passenger side Individual per linear km 20 76,600 79,400 81,400 87,000 95, ,300 Roadside barriers - driver side Individual per linear km 20 76,600 79,400 81,400 87,000 95, ,300 Shoulder sealing passenger side (<1m) Individual per linear km 20 10,900 14,200 17,600 13,500 15,500 19,400 Shoulder sealing passenger side (>1m) Individual per linear km 20 14,800 16,900 20,900 22,500 25,900 32,900 Restrict/combine direct access points Individual per km 10 89, , , , , ,200 Footpath provision passenger side (adjacent to road) Individual per km 20 72,000 82, ,200 90, , ,600 Footpath provision passenger side (>3m from road) Individual per km 20 89, , , , , ,900 Speed management reviews Individual per cw km 5 6,700 7,600 9,400 24,000 28,900 39,100 Traffic calming Individual per cw km 10 21,800 25,700 33,200 33,500 39,700 52,300 Vertical realignment (major) Individual lane km , , , , , ,500 Overtaking or additional lane Individual per linear km 20 1,140,000 1,265,000 1,515,000 1,800,000 2,050,000 2,550,000 Median Crossing Upgrade Multi intersection 10 80, , , , , ,900 Clear roadside hazards (bike lane) Individual per km Sideslope improvement (bike lane) Individual per km Roadside barriers (bike lane) Individual per km Clear roadside hazards (seg MC lane) passenger side Individual per km Sideslope improvement (seg MC lane) passenger side Individual per km Roadside barriers (seg MC lane) passenger side Individual per km Speed management reviews (MC Lane) Individual per cw km Page 100
105 Central median barrier (MC lane) Multi per km Skid Resistance (paved road) Individual lane km 10 71,000 81, ,800 88, , ,500 Skid Resistance (unpaved road) Individual per cw km 10 24,600 28,400 36,600 32,000 36,800 47,200 Pave road surface Individual lane km , , , , , ,600 Street lighting (mid-block) Individual lane km , , , , , ,000 Street lighting (intersection) Individual intersection 20 53,800 62,700 80,100 63,500 73,400 93,400 Street lighting (ped crossing) Individual unit 20 10,000 11,000 13,100 12,500 13,800 16,300 Shoulder rumble strips Individual per cw km 10 10,000 11,000 14,000 12,000 13,000 15,000 Parking improvements Individual per cw km 20 11,800 13,100 14,500 16,500 18,200 20,300 Sight distance (obstruction removal) Individual per cw km 20 15,300 17,200 20,300 21,000 23,700 28,700 Pedestrian fencing Individual per cw km 20 13,000 14,000 16,000 17,000 18,000 20,000 Side road grade separated pedestrian facility Individual intersection , , , , , ,000 Side road signalised pedestrian crossing Individual unit 20 37,600 45,100 60,100 49,500 59,500 79,500 Side road unsignalised pedestrian crossing Individual intersection 10 13,600 15,600 19,600 17,000 19,500 24,500 Footpath provision passenger side (with barrier) Individual per km 20 81,000 92, , , , ,400 Footpath provision passenger side (informal path >1m) Individual per km 10 20,000 27,000 30,000 23,000 28,000 35,000 Footpath provision driver side (informal path >1m) Individual per km 10 60,400 70,400 89,100 73,000 84, ,800 Footpath provision driver side (with barrier) Individual per km 20 81,000 92, , , , ,400 Footpath provision driver side (>3m from road) Individual per km 20 89, , , , , ,900 Footpath provision driver side (adjacent to road) Individual per km 20 72,000 82, ,200 90, , ,600 Shoulder sealing driver side (<1m) Individual per linear km 20 10,900 14,200 17,600 13,500 15,500 19,400 Page 101
106 Shoulder sealing driver side (>1m) Individual per linear km 20 14,800 16,900 20,900 22,500 25,900 32,900 Realignment (sight distance improvement) Individual lane km , , , , , ,500 Central median barrier (1+1) Undivided Only per km , , , , , ,200 Clear roadside hazards (seg MC lane) driver side Individual per km Sideslope improvement (seg MC lane) driver side Individual per km Roadside barriers (seg MC lane) driver side Individual per km Wide centreline Undivided Only per linear km 20 65,000 65,600 67,300 90,500 92,500 96,600 Page 102
107 Annex 4 Minimum 3-star safety rating standard A 3-star EuroRAP/iRAP rating is a minimum target to achieve. For example, the government of the Netherlands has committed to achieving a 3-star minimum for its national roads by Similar targets are being used in some low- and middle-income countries in contracts for road improvements 1. Increasing the Star Rating is associated with a decrease in fatal and serious injury crash costs or crash rate about a halving in the metric by an increase of one star. The figure below shows this and the resulting dramatic reductions in crash costs at a 3-star rating 2. Figure 70: Smoothed vehicle occupant Star Ratings and fatal and serious injury costs per vehicle kilometre travelled The latest version of the EuroRAP/iRAP model released in 2014 makes achieving the 3-star target more difficult than the earlier versions. This recalibration is common in other fields too for example, in the European New Car Assessment Programme. Recalibration is a way of improving standards through time. 1 In road improvement contracts, the percentage kilometrage with at least 3-star rating can form part of a results indicator, subject to the availability of economically viable infrastructure countermeasures. At locations where it is not economically viable to lift the Star Ratings to at least 3-stars using infrastructure countermeasures, lowering operating speeds is also be considered. 2 See and for further details. Page 103


108 The operating speed of the road is a large factor in determining what the Star Rating will be. Roads are rated at the higher of the 85th percentile operating speed or the posted speed limit 3. The figures below show the relationship of speed with Star Rating for different scenarios and illustrate the speeds at which a road may achieve 3-star or 4-star rating. Intersection frequency is also a factor. Figure 71: Common scenarios of the relationship between speed and Star Rating: Motorway A 90 to 150km/h Flow: 35,000 AADT Median: barrier 0-1m offset Roadside: barrier 1-5m offset Intersections: merge lane A World Free of High Risk Roads 3 An explanation of this is provided at: 3/methodology?download=135:irap-methodology-fact-sheet-7-star-rating-bands and Page 104


109 Motorway B 90 to 150km/h Flow: 35,000 AADT Median: barrier 1-5 m offset Roadside: barrier 1-5m offset Intersections: merge lane A World Free of High Risk Roads Expressway A 70 to 130km/h Flow: 35,000 AADT Median: metal barrier 0-1m offset Roadside: poles 5-10m offset Intersections: merge lane A World Free of High Risk Roads In some situations it is not difficult to see how to increase the safety and the Star Rating of road sections in order to achieve 3-star. Some of the more obvious countermeasures which benefit various road users and have been used in other EuroRAP and irap studies to increase the Star Rating include: Safety barriers Page 105
Driving Restrictions, Goods Transport, 2016 Slovenia
 Driving Restrictions, Goods Transport, 2016 Slovenia 1. General restrictions Vehicles concerned trucks and combination vehicles with an MPW of more than 7.5t Prohibition on all road sections listed below,
Driving Restrictions, Goods Transport Slovenia
 Driving Restrictions, Goods Transport Slovenia 1. General restrictions on all road sections listed below, in both directions: on Sundays, public holidays and non-working days from 08h00 to 21h00; on Good
Driving Restrictions, Goods Transport, 2018 Slovenia
 Driving Restrictions, Goods Transport, 2018 Slovenia 1. General restrictions Vehicles concerned trucks and combination vehicles with an MPW of more than 7.5t Prohibition on all road sections listed below,
AusRAP assessment of Peak Downs Highway 2013
 AusRAP assessment of Peak Downs Highway 2013 SUMMARY The Royal Automobile Club of Queensland (RACQ) commissioned an AusRAP assessment of Peak Downs Highway based on the irap protocol. The purpose is to
ROAD INFRASTRUCTURES RISK ASSESSMENT: A VALUABLE TOOL FOR INVESTMENTS DECISIONS
 ROAD INFRASTRUCTURES RISK ASSESSMENT: A VALUABLE TOOL FOR INVESTMENTS DECISIONS Evangelos Bellos 1 *, Stelios Efstathiadis 2, Ioannis Gkremos 3, Vrassidas Leopoulos 4 1 Mechanical Engineering Department,
Road fatalities in 2012
 Lithuania 1 Inhabitants Vehicles/1 000 inhabitants Road fatalities in 2012 Fatalities /100 000 inhabitants in 2012 2.98 million 751 301 10.1 1. Road safety data collection Definitions Road fatality: person
Driving restrictions, goods transport Croatia
 Driving restrictions, goods transport Croatia Article I lorries and combined vehicles with a maximum permitted weight of over 7.5t; lorries and combined vehicles which exceed 14m in length; tractors; horse-drawn
[Insert name] newsletter CALCULATING SAFETY OUTCOMES FOR ROAD PROJECTS. User Manual MONTH YEAR
![[Insert name] newsletter CALCULATING SAFETY OUTCOMES FOR ROAD PROJECTS. User Manual MONTH YEAR](/thumbs/75/72619921.jpg "[Insert name] newsletter CALCULATING SAFETY OUTCOMES FOR ROAD PROJECTS. User Manual MONTH YEAR") [Insert name] newsletter MONTH YEAR CALCULATING SAFETY OUTCOMES FOR ROAD PROJECTS User Manual MAY 2012 Page 2 of 20 Contents 1 Introduction... 4 1.1 Background... 4 1.2 Overview... 4 1.3 When is the Worksheet
[Insert name] newsletter MONTH YEAR CALCULATING SAFETY OUTCOMES FOR ROAD PROJECTS User Manual MAY 2012 Page 2 of 20 Contents 1 Introduction... 4 1.1 Background... 4 1.2 Overview... 4 1.3 When is the Worksheet
Upgrading motorways in Slovakia A before and after study improving irap Star Ratings and increasing safety using a Safer Roads Investment Plan
 Upgrading motorways in Slovakia A before and after study improving irap Star Ratings and increasing safety using a Safer Roads Investment Plan 1 About EuroRAP The European Road Assessment Programme (EuroRAP)
Risk Mapping Based on Structured Data
 Risk Mapping Based on Structured Data INDIA CHAPTER Dr. P K Sikdar President, ICT Pvt. Ltd. Advisor, IRF (India Ch) Jigesh Bhavsar ICT Pvt. Ltd. Road Safety Engineer, irap India Project Structure of Presentation
Respecting the Rules Better Road Safety Enforcement in the European Union. ACEA s Response
 Respecting the Rules Better Road Safety Enforcement in the European Union Commission s Consultation Paper of 6 November 2006 1 ACEA s Response December 2006 1. Introduction ACEA (European Automobile Manufacturers
RSWGM meeting European Commission DG MOVE 3-4 April 2017
 Podgorica RSWGM meeting European Commission DG MOVE 3-4 April 2017 Mobility and Transport 1 WHITE PAPER 2011: Towards a zero-vision on road safety POLICY ORIENTATIONS ON ROAD SAFETY 2011-2020 The -50%
Driving restrictions, goods transport Bulgaria
 Driving restrictions, goods transport Bulgaria There is no general driving ban for international traffic on Sundays or on public holidays. There are however several local restrictions. Road concerned all
Road Map For Safer Vehicles & Fleet Safety
 Road Map For Safer Vehicles & Fleet Safety David Ward Secretary General Global New Car Assessment Programme Global Fleet Conference Miami 6-8 June 2017 Changing Geography of Vehicle Use Global NCAP - Building
Safety and Green Vehicle Performance Rating
 Safety and Green Vehicle Performance Rating presentation by David Ward Secretary General Global New Car Assessment Programme 2014 Fleet Forum Budapest 3 rd April 2014 Changing Geography of Vehicle Use
ROAD SAFETY ANNUAL REPORT 2018 LITHUANIA
 ROAD SAFETY ANNUAL REPORT 2018 LITHUANIA LITHUANIA In 2017, 192 persons lost their lives in traffic crashes. Lithuania is one of the IRTAD countries that has achieved the strongest reduction in the number
Recommendations of the Expert Group on Preventing Motorcycle Injuries in Children
 Recommendations of the Expert Group on Preventing Motorcycle Injuries in Children All Member States in the WHO South-East Asia (SEA) Region are low- and middle-income countries. In the SEA Region, the
! " # $ % # & " ' % ( ' ) "
") "#!! $% ! " # $ % # " ' % ( ' ) ",-..*-/--0"-00"0**0 2 In agreement with the Terms of Reference, we have conducted an analysis of the road user charges (RUC) paid by the users of the road networks in the
"#!! $% ! " # $ % # " ' % ( ' ) ",-..*-/--0"-00"0**0 2 In agreement with the Terms of Reference, we have conducted an analysis of the road user charges (RUC) paid by the users of the road networks in the
IRTAD Activities and Management of Road Infrastructure Safety
 IRTAD Activities and Management of Road Infrastructure Safety Sangjin Han Expert Group Meeting on Road Safety Seoul, 8-10 May 2013 2 Outline IRTAD in a nutshell Twinning program Management of Road Infrastructure
GOVERNMENT STATUS REPORT OF JAPAN
 GOVERNMENT STATUS REPORT OF JAPAN Hidenobu KUBOTA Director, Policy Planning Office for Automated Driving Technology, Engineering Policy Division, Road Transport Bureau, Ministry of Land, Infrastructure,
INTERNATIONAL GOOD PRACTICES IN ROAD INFRASTRUCTURE SAFETY MANAGEMENT (RISM) & LESSONS FOR ROMANIA
 & LESSONS FOR ROMANIA") INTERNATIONAL GOOD PRACTICES IN ROAD INFRASTRUCTURE SAFETY MANAGEMENT (RISM) & LESSONS FOR ROMANIA Radoslaw Czapski With contributions from: Raphael Grzebieta, Robert Moraru, Mara Bubberman June 2017 CONTENTS
INTERNATIONAL GOOD PRACTICES IN ROAD INFRASTRUCTURE SAFETY MANAGEMENT (RISM) & LESSONS FOR ROMANIA Radoslaw Czapski With contributions from: Raphael Grzebieta, Robert Moraru, Mara Bubberman June 2017 CONTENTS
THE PRAGERSKO HODOŠ RAILWAY LINE
 THE PRAGERSKO HODOŠ RAILWAY LINE P H O T O B O O K OSTANE BELA Dunaj Budimpešta Šentilj Hodoš Murska Sobota MODERNISATION OF THE PRAGERSKO HODOŠ RAILWAY LINE Lyon Torino Milano Verona Benetke Ljubljana
Target Zero: Underutilized Strategies in Traffic Safety That Work
 Target Zero: Underutilized Strategies in Traffic Safety That Work James C. Fell National Opinion Research Center (NORC) at the University of Chicago, Bethesda, MD Office The Problem In 2015, 35,092 people
Regional Cooperation Infrastructure Development and Operation. EU Energy Governance. Olaf Ziemann Member of ENTSO-E s System Operations Committee
 Regional Cooperation Infrastructure Development and Operation EU Energy Governance 30 April 2014, Berlin Olaf Ziemann Member of ENTSO-E s System Operations Committee About ENTSO-E 41 TSOs from 34 countries
POLICY POSITION ON THE PEDESTRIAN PROTECTION REGULATION
 POLICY POSITION ON THE PEDESTRIAN PROTECTION REGULATION SAFETY Executive Summary FIA Region I welcomes the European Commission s plan to revise Regulation 78/2009 on the typeapproval of motor vehicles,
Labelling Smart Roads DISCUSSION PAPER 4/2015
 DISCUSSION PAPER 4/2015 December 2015 TABLE OF CONTENTS 1. Introduction... 3 2. The Smart Roads of the Future... 3 3. : Sustainability of road infrastructure... 4 4. : Sustainability in mobility management
Guidelines for Retro-fitting Existing Roads to Optimise Safety Benefits. A Practitioners Experience and Assessment of Options for Improvement.
 Guidelines for Retro-fitting Existing Roads to Optimise Safety Benefits. A Practitioners Experience and Assessment of Options for Improvement. Author: Stephen Levett, Manager, Safer Roads Policy, Standards
Stronger road safety. in South Australia. Presented by Tamra Fedojuk Senior Statistician Road Safety Policy
 Stronger road safety performance monitoring in South Australia Presented by Tamra Fedojuk Senior Statistician Road Safety Policy Outline Introduction Challenges for road safety in South Australia Current
Green Power Feasibility Study Econet Lesotho
 Green Power This document has been written to provide information to mobile operators who are considering or planning to deploy green renewable power resources for base station and transmission sites.
Public consultation on road infrastructure and tunnel safety
 Contribution ID: 591a77da-d40e-405b-a330-47a866c53883 Date: 26/06/2017 11:22:48 Public consultation on road infrastructure and tunnel safety Fields marked with are mandatory. Introduction The EU regulatory
Safer Journeys and the Safe System Approach
 Safer Journeys and the Safe System Approach Applicability to Low Volume Roads Colin Brodie Lead Advisor: Safety and Environment NZ Transport Agency 2017 Safer Journeys and the Safe System Approach The
The potential for insurance markets to reduce road trauma. Samantha Cockfield, Manager Road Safety
 The potential for insurance markets to reduce road trauma Samantha Cockfield, Manager Road Safety Outline TAC at a glance Role in road safety Road trauma the strategy Key reduction measures safer roads
Safety: a major challenge for road transport
 www.maids-study.eu Safety: a major challenge for road transport The growing amount of traffic on European roads requires to address the issue of safety with a thorough and scientific understanding. Effective
National Road Safety Action Plan in China
 Sixth SHRP 2 Safety Research Symposium National Road Safety Action Plan in China Dr. Yan Wang July 14, 2011 Washington DC, USA Outline 1 Initiative of Road Safety Action Plan 2 Phase I 3 For Next Phase?
ECONOMIC AND FINANCIAL ANALYSIS
 South Asia Subregional Economic Cooperation Dhaka Northwest Corridor Road Project, Phase 2 (RRP BAN 40540) A. Introduction ECONOMIC AND FINANCIAL ANALYSIS 1. The proposed project primarily aims at capacity
Evaluation tool TARVA for estimating current safety and safety effects of road improvements Harri Peltola Principal Scientist
 VTT TECHNICAL RESEARCH CENTRE OF FINLAND LTD Evaluation tool TARVA for estimating current safety and safety effects of road improvements Harri Peltola Principal Scientist harri.peltola@vtt.fi Content o
Fuel Cells and Hydrogen 2 Joint Undertaking (FCH 2 JU) Frequently Asked Questions
 Frequently Asked Questions") Fuel Cells and Hydrogen 2 Joint Undertaking (FCH 2 JU) Frequently Asked Questions Background information: The Fuel Cells and Hydrogen Joint Undertaking was established in 2008-2013, as the first publicprivate
Fuel Cells and Hydrogen 2 Joint Undertaking (FCH 2 JU) Frequently Asked Questions Background information: The Fuel Cells and Hydrogen Joint Undertaking was established in 2008-2013, as the first publicprivate
Traffi S c afety i S n weden Astrid Linder , PhD PhD
 Traffic Safety in Sweden Astrid Linder, PhD 1 Swedish National Road and Transport Research Institute Independent research institute 4 offices in Sweden 180 employees 2 Research Areas» Economics Crash»
The 3 rd European Road Safety Action Programme
 ROAD SAFETY: the European Union Policy 2001-2010 & 2011-2020 SEETO, 18.10.2010 J.P Repussard/G. Bergot European Commission, Directorate General for Mobility & Transport Unit «Road Safety and Transport
Access to the market & profession: quality-based regulations
 Access to the market & profession: quality-based regulations SSATP REC-TCC meeting 2-6 July 2018 Abuja iru.org 1. ECMT Quality Charter Multi-lateral permits a step towards a liberalised international market
Successes and failures of road safety policy in Europe
 of road safety Francesco Mitis WHO Regional Office for Europe Athens, 22 November 2012 http://www.euro.who.int/en/what-we-do/health-topics/diseaseprevention/violence-and-injuries mit@euro.who.int Road
EXCEPTION TO STANDARDS REPORT
 EXCEPTION TO STANDARDS REPORT PROJECT DESCRIPTION AND NEED The project is located in Section 6, Township 23 North, Range 9 East and Section 31 Township 24 North, Range 9 East, in the Town of Stockton,
10th Eastern Partnership Transpot Panel
 10th Eastern Partnership Transpot Panel 11th May 2016 Maria Teresa SANZ VILLEGAS Road Safety Unit Directorate-General for Mobility and European Commission WHITE PAPER 2011: Towards a zero-vision on road
Road Traffic Injury in Tanzania: Development of a Local Government Road Safety Programme
 Road Traffic Injury in Tanzania: Development of a Local Government Road Safety Programme 8 th Africa T2 Conference Livingstone, Zambia 8 th to 10 th May 2017 Dr Fikiri Magafu and Tom Bishop Summary of
-Mobility Solutions. Electric Taxis
 -Mobility Solutions Electric Taxis This paper was prepared by: SOLUTIONS project This project was funded by the Seventh Framework Programme (FP7) of the European Commission Solutions project www.uemi.net
is an independent and internationally prominent research institute within the transport sector
 In brief VTI Swedish National Road and Transport Research Institute is an independent and internationally prominent research institute within the transport sector organised under the Ministry of Enterprise,
RESULTS OF THE CROSS BORDERS SURVEY
 Technical Secretariat Pan-European Transport Corridor X ARISTOTLE UNIVERSITY OF THESSALONIKI SCHOOL OF TECHNOLOGY FACULTY OF RURAL AND SURVEYING ENGINEERING DEPARTMENT OF TRANSPORTATION AND HYDRAULIC ENGINEERING
Road safety time for Europe to shift gears
 Road safety time for Europe to shift gears The number of people dying on Europe s roads nearly halved between 2000 and 2010. But this spectacular progress has now grinded to a halt. In 2014 and 2015 fatality
RESEARCH AT THE NATIONAL AND EUROPEAN LEVELS ON THE MAIN FIELDS OF INTERVENTION COVERED BY THE EU DIRECTIVE ON ROAD INFRASTRUCTURE SAFETY MANAGEMENT
 RESEARCH AT THE NATIONAL AND EUROPEAN LEVELS ON THE MAIN FIELDS OF INTERVENTION COVERED BY THE EU DIRECTIVE ON ROAD INFRASTRUCTURE SAFETY MANAGEMENT The Experience of a National Research Laboratory (LNEC)
City of Pacific Grove
 Regional Study Utilizing Caltrans Intersection Evaluation Section 7: City of Pacific Grove s: FIRST STREET AT CENTRAL AVENUE Transportation Agency for Monterey County Prepared by Transportation Agency
Ex-Ante Evaluation (for Japanese ODA Loan)
") Japanese ODA Loan Ex-Ante Evaluation (for Japanese ODA Loan) 1. Name of the Project Country: India Project: Delhi Mass Rapid Transport System Project Phase 2 (V) Loan Agreement: March 31, 2010 Loan Amount:
Japanese ODA Loan Ex-Ante Evaluation (for Japanese ODA Loan) 1. Name of the Project Country: India Project: Delhi Mass Rapid Transport System Project Phase 2 (V) Loan Agreement: March 31, 2010 Loan Amount:
Holistic approach to Road Safety
 TOTAL Ethiopia Holistic approach to Road Safety Florent Frimat, Logistics Manager Codatu XV 23rd October Addis-Ababa TOTAL Ethiopia, FF, Oct. 2012, Addis-Ababa 2 - TOTAL Ethiopia, FF, Oct.2012, Addis-Ababa
actsheet Car-Sharing
 actsheet Car-Sharing This paper was prepared by: SOLUTIONS project This project was funded by the Seventh Framework Programme (FP7) of the European Commission Solutions project www.uemi.net The graphic
northeast group, llc Central & Eastern Europe Smart Grid: Market Forecast ( ) April group.com
 April group.com") northeast group, llc Central & Eastern Europe Smart Grid: Market Forecast (2013 2023) April 2013 www.northeast- group.com Central & Eastern Europe Smart Grid: Market Forecast (2013-2023) Countries in the
northeast group, llc Central & Eastern Europe Smart Grid: Market Forecast (2013 2023) April 2013 www.northeast- group.com Central & Eastern Europe Smart Grid: Market Forecast (2013-2023) Countries in the
Electric City Transport Ele.C.Tra project. Challenges of New Urban Mobility Models Towards EU 2020 Targets
 Electric City Transport Ele.C.Tra project Challenges of New Urban Mobility Models Towards EU 2020 Targets The Ele.C.Tra Project developed a new model of sustainable urban mobility based on electric light
Road Safety and the Italian Tolled Motorway Network: where we are and what we are doing?
 Italian Association of Toll Motorways and Tunnels Operators Road Safety and the Italian Tolled Motorway Network: where we are and what we are doing? WORKSHOP ON MANAGING OPERATIONAL RISK IN ROAD OPERATIONS
Alberta Transportation Rumble Strips - C-TEP Lunch and Learn
 Alberta Transportation Rumble Strips - C-TEP Lunch and Learn Bill Kenny P.Eng, Director: Design, Project Management and Training, Technical Standards Branch. - July 2011 What are Rumble Strips? A preventative
Monitoring the CO 2 emissions from new passenger cars in the EU: summary of data for 2010
 Monitoring the CO 2 emissions from new passenger cars in the EU: summary of data for 2010 EXECUTIVE SUMMARY EEA has collected data submitted by Member States on vehicle registrations in the year 2010,
Global Status Report on Road Safety: Respondents' Questionnaire
 Global Status Report on Road Safety: Respondents' Questionnaire Country: Respondent's Information Name: Position: Institution: Email: Telephone: Fax: National Data Coordinator Name: Position: Institution:
Financing Public Transport Projects by EBRD
 SPUNIC Regional Conference 3 rd Working Group Meeting Financing Public Transport Projects by EBRD Guido Bruggeman Urban Transport Specialist former Employee European Bank for Reconstruction and Development
Kentucky Highway District 6
 Kentucky Highway District 6 ROAD AND BRIDGE CONDITIONS, TRAFFIC SAFETY, TRAVEL TRENDS, AND NEEDS MARCH 2018 PREPARED BY WWW.TRIPNET.ORG Founded in 1971, TRIP of Washington, DC, is a nonprofit organization
Sleet in Slovenia, February 2014
 Sleet in Slovenia, February 2014 Branko Dervodel, deputy director general URSZR DPPI SEE Regional Mee0ng, Pržno, Montenegro 22-24 April 2014 SLEET IN SLOVENIA History repeats itself years 1899 and 2014
D1.3 FINAL REPORT (WORKPACKAGE SUMMARY REPORT)
") WP 1 D1.3 FINAL REPORT (WORKPACKAGE SUMMARY REPORT) Project Acronym: Smart RRS Project Full Title: Innovative Concepts for smart road restraint systems to provide greater safety for vulnerable road users.
WP 1 D1.3 FINAL REPORT (WORKPACKAGE SUMMARY REPORT) Project Acronym: Smart RRS Project Full Title: Innovative Concepts for smart road restraint systems to provide greater safety for vulnerable road users.
BEYOND KYOTO FRANK VAN WEST. XVII ACI Technical Conference. Rome, 16 March 2006
 BEYOND KYOTO FRANK VAN WEST XVII ACI Technical Conference Rome, 16 March 2006 www.fiafoundation.com Content Wat is the FIA Foundation? Objectives of the Foundation Kyoto Voluntary agreements car industry
Spatial planning and sustainable urban transport systems
 Jean-Christophe Goudouneix Rita Magris Laura Richter Nicolae Serban Stef Tomesen George Yates Erasmus Intensive Programme 2013 Oradea Group 4 Spatial planning and sustainable urban transport systems Developing
Safe System Approach. Claes Tingvall (Swedish Transport Administration) Peter Larsson (Swedish Transport Agency)
 Peter Larsson (Swedish Transport Agency)") Safe System Approach Claes Tingvall (Swedish Transport Administration) Peter Larsson (Swedish Transport Agency) 3. CONSIDERS that the level of road fatalities and injuries remain unacceptably high and
Safe System Approach Claes Tingvall (Swedish Transport Administration) Peter Larsson (Swedish Transport Agency) 3. CONSIDERS that the level of road fatalities and injuries remain unacceptably high and
ASIAN DEVELOPMENT FUND (ADF) ADF XI REPLENISHMENT MEETING 7 9 March 2012 Manila, Philippines. Post-Conflict Assistance to Afghanistan
 ADF XI REPLENISHMENT MEETING 7 9 March 2012 Manila, Philippines. Post-Conflict Assistance to Afghanistan") ASIAN DEVELOPMENT FUND (ADF) ADF XI REPLENISHMENT MEETING 7 9 March 2012 Manila, Philippines Post-Conflict Assistance to Afghanistan February 2012 ABBREVIATIONS ADB Asian Development Bank ADF Asian Development
ASIAN DEVELOPMENT FUND (ADF) ADF XI REPLENISHMENT MEETING 7 9 March 2012 Manila, Philippines Post-Conflict Assistance to Afghanistan February 2012 ABBREVIATIONS ADB Asian Development Bank ADF Asian Development
Getting Electricity A pilot indicator set from the Doing Business Project. of the World Bank
 Getting Electricity A pilot indicator set from the Doing Business Project International Conference on Infrastructure Economics and Development (Toulouse, January 14-15, 2010). of the World Bank Connecting
irap Innovation Workshop 2016 Maximising Travel on 3-Star or Better Roads
 irap Innovation Workshop 2016 Maximising Travel on 3-Star or Better Roads Malaysia leads the way for low, middle income countries (LMICs) with star rating policy target Prof. Dr. Wong Shaw Voon & Alvin
A Cost-Benefit Analysis of Heavy Vehicle Underrun Protection
 A Cost-Benefit Analysis of Heavy Vehicle Underrun Protection Narelle Haworth 1 ; Mark Symmons 1 (Presenter) 1 Monash University Accident Research Centre Biography Mark Symmons is a Research Fellow at Monash
Priorities for future vehicle safety improvements in the Western Australian light vehicle fleet
 Priorities for future vehicle safety improvements in the Western Australian light vehicle fleet a, L. & Newstead a, S. a Monash University Accident Research Centre & Curtin-Monash Accident Research Centre,
PRODUCT DESCRIPTION. X-Tension DS. is suitable for all road types: Motorways, country roads, city streets for speed categories up to 110 km/h.
 INDEX Introduction 2 Product Description 3 Installation 6 Specifications 7 Crash Tests Table 8 Reusability 9 FAQ 10 Annexes 14 Drawings 15 Pictures 16 Crash Tests Results 18 Approvals 23 INTRODUCTION Improving
RUMBLE STRIPS QUESTIONS AND ANSWERS
 RUMBLE STRIPS QUESTIONS AND ANSWERS Rumble strips are a key safety initiative that help prevent crashes by providing drivers with a wake up call if they stray over the edgeline or centreline. The NZ Transport
How to make urban mobility clean and green
 POLICY BRIEF Decarbonising Transport Initiative How to make urban mobility clean and green The most effective way to decarbonise urban passenger transport? Shared vehicles, powered by clean electricity,
An International Mission 12 May Isabelle Fonverne, UIC
 An International Mission 12 May 2016 Isabelle Fonverne, UIC UIC in 2016 2 240 Members in 95 countries 2 UIC, its missions Promoting the development of rail transport at world level, in order to meet challenges
Cheescutters, Eggslicers and Motorcyclists Wire Rope Safety Barriers and the risks posed to Motorcyclists. Nicholas Rodger Dip.Eng (Civil), GIPENZ
, GIPENZ") Cheescutters, Eggslicers and Motorcyclists Wire Rope Safety Barriers and the risks posed to Motorcyclists Nicholas Rodger Dip.Eng (Civil), GIPENZ Background Recent years have seen growing concern amongst
Cheescutters, Eggslicers and Motorcyclists Wire Rope Safety Barriers and the risks posed to Motorcyclists Nicholas Rodger Dip.Eng (Civil), GIPENZ Background Recent years have seen growing concern amongst
The Backseat Passenger Protection Point of View in Car Design Requirements
 The Backseat Passenger Protection Point of View in Car Design Requirements J. Kadlecová* & J. Kovanda Faculty of Transportation Sciences, Czech Technical University in Prague, Czech republic *Corresponding
Speed Limit Study: Traffic Engineering Report
 Speed Limit Study: Traffic Engineering Report This report documents the engineering and traffic investigation required by Vermont Statutes Annotated Title 23, Chapter 13 1007 for a municipal legislative
1. INTERNATIONAL OVERVIEW. 1.0 Area and population. population (1,000) area
 area") 1.0 Area and population area population (1,000) km 2 2000 2010 2018 1 inhabitants per km 2 Belgium 30,530 10,251 10,920 11,443 375 Germany 357,380 82,212 81,777 82,952 232 Estonia 45,230 1,397 1,331 1,315
1.0 Area and population area population (1,000) km 2 2000 2010 2018 1 inhabitants per km 2 Belgium 30,530 10,251 10,920 11,443 375 Germany 357,380 82,212 81,777 82,952 232 Estonia 45,230 1,397 1,331 1,315
Major Widening/New Roadway
 Revised Evaluation s Major Widening/New Roadway This page provides a summary of any revisions made to the draft scores presented at the October th Attributable Funds Committee meeting. The information
Toward the Realization of Sustainable Mobility
 GIES 2008 Toward the Realization of Sustainable Mobility March 13, 2008 Toyota Motor Corporation Senior Technical Executive Hiroyuki Watanabe 1 CO 2 Emission from Transportation Sector Distribution by
Why Zero health losses is a logical and rational target
 1 Why Zero health losses is a logical and rational target Claes Tingvall Anders Lie Monash University Accident Research Centre 2 Vision Zero Zero Fatalities (At least not only) Vision Zero = 5 dimensions
The Value of Travel-Time: Estimates of the Hourly Value of Time for Vehicles in Oregon 2007
 The Value of Travel-Time: Estimates of the Hourly Value of Time for Vehicles in Oregon 2007 Oregon Department of Transportation Long Range Planning Unit June 2008 For questions contact: Denise Whitney
Road safety in Greece
 Athens, Greece April 23-26 2012 Transport Research Arena Europe 2012 Road safety in Greece George Yannis, Eleonora Papadimitriou National Technical University of Athens, Greece Background and objectives
TTI TRAFFIC SAFETY CONFERENCE. John A. Barton, P.E.
 TTI TRAFFIC SAFETY CONFERENCE John A. Barton, P.E. Introduction TxDOT Mission Work with others to provide safe and reliable transportation solutions for Texas. 2 Mission Zero Is a Journey toward: Zero
211 STATISTICAL APPENDIX
 211 STATISTICAL APPENDIX For the user s convenience, as well as to lighten the text, the Economic Survey of Europe includes a set of appendix tables showing time series for the main economic indicators
Table 1: Candidate global targets and indicators for review
 Table 1: Candidate global targets and indicators for review Core area Objective and target Indicator Data source How data are collected Justification Road management Improve road management across all
STH 60 Northern Reliever Route Feasibility Study Report
 #233087 v3 STH 60 Northern Reliever Route Feasibility Study Report Washington County Public Works Committee Meeting September 28, 2016 1 STH 60 Northern Reliever Route Feasibility Study Hartford Area Development
ADR: Accord Européen Relatif au Transport International des Marchandises Dangereuses par Route
 ADR: Accord Européen Relatif au Transport International des Marchandises Dangereuses par Route (European Agreement concerning the International Carriage of Dangerous Goods by Road) The European Agreement
Road Surface characteristics and traffic accident rates on New Zealand s state highway network
 Road Surface characteristics and traffic accident rates on New Zealand s state highway network Robert Davies Statistics Research Associates http://www.statsresearch.co.nz Joint work with Marian Loader,
BBL on Infrastructure Safety Management Current and Best Practices
 BBL on Infrastructure Safety Management Current and Best Practices Said Dahdah Road Safety Specialist May 20, 2010 Infrastructure Safety Management Yes New Road? No Road Safety Audit (RSA) Yes Do you have
Bus The Case for the Bus
 Bus 2020 The Case for the Bus Bus 2020 The Case for the Bus Introduction by Claire Haigh I am sure we are all pleased that the economy is on the mend. The challenge now is to make sure people, young and
Developments within the ECMT Multilateral Quota System
 Developments within the ECMT Multilateral Quota System Elene Shatberashvili International Transport Forum IRU GOODS TRANSPORT COUNCIL (CTM) 8 November 2012 2 International Transport Forum An Intergovernmental
CONNECTED AUTOMATION HOW ABOUT SAFETY?
 CONNECTED AUTOMATION HOW ABOUT SAFETY? Bastiaan Krosse EVU Symposium, Putten, 9 th of September 2016 TNO IN FIGURES Founded in 1932 Centre for Applied Scientific Research Focused on innovation for 5 societal
ROAD SAFETY ANNUAL REPORT 2018 NEW ZEALAND
 ROAD SAFETY ANNUAL REPORT 2018 NEW ZEALAND NEW ZEALAND Following the all-time low in fatalities achieved in 2013, New Zealand registered four consecutive years of increases in the number of road deaths.
Current status of Lead and Sulphur in Fuels in Central and Eastern Europe, the Caucasus and Central Asia
 status of and Sulphur in Fuels in Central and Eastern Europe, the Caucasus and Central Asia Albania Unleaded Imports of leaded petrol banned 07/ 2005. National legislation limit is 0.005 g/l for lead.
Green Line LRT: Beltline Segment Update April 19, 2017
 Green Line LRT: Beltline Segment Update April 19, 2017 Quick Facts On April 11, 2017, City Council approved Administration s recommendation for the Green Line to be underground in the Beltline from 2 Street
Preventing Road Accidents and Injuries for the Safety of Employees Case Study: ALSA FACTFILE. Company: ALSA
 PRAISE Preventing Road Accidents and Injuries for the Safety of Employees Case Study: ALSA ETSC s PRAISE project addresses the safety aspects of driving at work and driving to work. Its aim is to promote
EIB experience in financing smart meter roll-outs
 EIB experience in financing smart meter roll-outs Donal Cannon Head of Representation South Aisa India EU Smart Grid Workshop European Investment Bank The EIB who? The EU s treaty bank (1958) owned by
CITY OF LONDON STRATEGIC MULTI-YEAR BUDGET ADDITIONAL INVESTMENTS BUSINESS CASE # 6
 2016 2019 CITY OF LONDON STRATEGIC MULTI-YEAR BUDGET ADDITIONAL INVESTMENTS BUSINESS CASE # 6 STRATEGIC AREA OF FOCUS: SUB-PRIORITY: STRATEGY: INITIATIVE: INITIATIVE LEAD(S): BUILDING A SUSTAINABLE CITY