Westland Monitor Farm Project
|
|
|
- John Evans
- 5 years ago
- Views:
Transcription
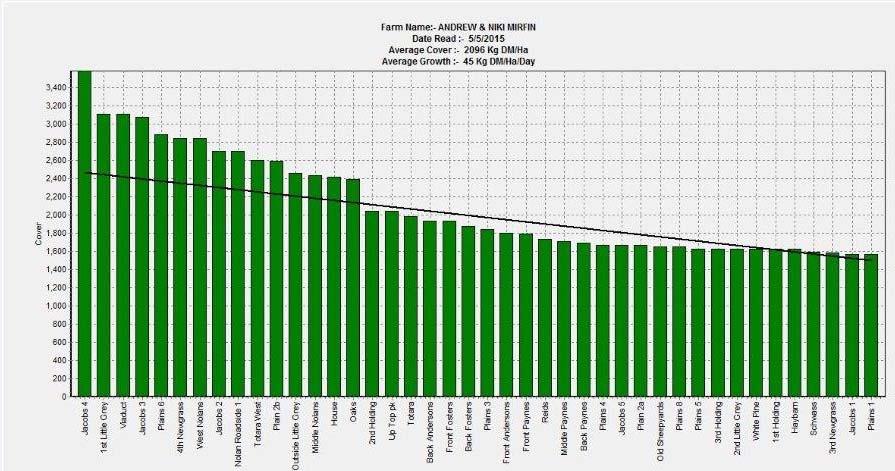
1 Westland Monitor Farm Project Weekly Update 29 May 2015 CO comment With the end of this season and the start of the next imminent, there will be new staff starting out on farms. Ensure you have employment agreements in place for all employees on your farm permanent, fixed term and casual. Employment agreements are quick to implement, minimise risk and are the right thing to do for everyone. If you haven t got them, visit to purchase farming specific employment agreements. An important point to note is that if you have new employees starting on farm and want to use the 90 day trial period (which must be in good faith) ensure you have this clause included in your employment agreement before your new employee starts work otherwise the clause is void. Set aside time to introduce any new employees to your farm through a good orientation process. Taking time now will save you time later, fast track productivity, reduce stress and mistakes and increase the commitment of your team. Visit or order a copy of the DairyNZ QuickStart Recruitment Kit for an easy to follow orientation checklist. To ensure you are compliant, keep timesheets for all employees now so you can monitor the hours people are working. Use the results from these to drive productivity and create good work/life balances for all people on farm including you! Visit or for timesheet templates. Farm Summary Average cover (kg DM/ha) APC (22 May) Rotation length (days) Stocking rate Percentage in milk Milksolids kg/cow Milksolids kg/ha MS/cow (season to date) MS/ha (season to date) N (kg/ha) year to date None None Current N application rate kg N/ha April 10 April 1 April 10 April DM / Pasture ME >12.7 > / Pasture / Pasture CP / Target Intake (kg DM/cow/d) Supplement (kg/cow/day) Soil temperature ( C) Growth Rate (kg DM/day) Rainfall Conditions for farmwalk Rain cold Fine frost Fine frost cold cold Comments NB: pasture quality data are for 1 sample collected from each farm
2 Average monthly growth rate for each region compared with the 6 year average Pasture growth rate (kg/ha/day) Av 0 June Jul Aug Sep Oct Nov Dec Jan Feb Mar Apr May Average monthly soil temperature for each region compared with the 6 year average Soil temperature ( C) Av 0 June Jul Aug Sep Oct Nov Dec Jan Feb Mar Apr May
3 Weekly Pasture Growth Rates 100 Pasture growth rate (kg DM/ha/day) Jun 10 Aug 10 Oct 10 Dec 10 Feb 10 Apr Av Weekly Soil Temperature Soil temperature ( C) Av Jun 10 Aug 10 Oct 10 Dec 10 Feb 10 Apr
4
5 Pasture Quality NOTE: We sample the paddocks immediately in front of the milkers, to height of 3.5cm (7 clicks on the rising plate meter). The RPM data in the table is the pre-grazing clicks recorded on the day of sampling. Description Date RPM DM Prot ADF OMD MJME /kg Pdk 46 2 Nov Pdk 20 1 Dec >85 >12.7 Pdk Jan >85 >12.7 Pdk 27 9 Feb > Pdk 43 6 Mar Pdk Apr >85 >12.7
6 Description Date RPM DM Prot ADF OMD MJME/kg Pdk Reids 3 Nov Pdk West Nolan 2 Dec Pdk White Pine 13 Jan > Pdk Back Payne 10 Feb >85 >12.7 Pdk Hold 6 Mar Pdk Reids 10 Apr >85 >12.7
7 Description Date RPM DM Prot ADF OMD MJME /kg Pdk 40 4 Nov Pdk 27 4 Nov Pdk 31 2 Dec > Pdk 41 2 Dec Pdk 23 5 Mar Pdk 8 5 Mar Pdk 11 1 Apr > Pdk 36 1 Apr
8 Description Date RPM DM Prot ADF OMD MJME/k g Pdk 20 4 Nov Pdk 50 3 Dec > Pdk Jan Pdk Feb Pdk 12 6 Mar Pdk Apr
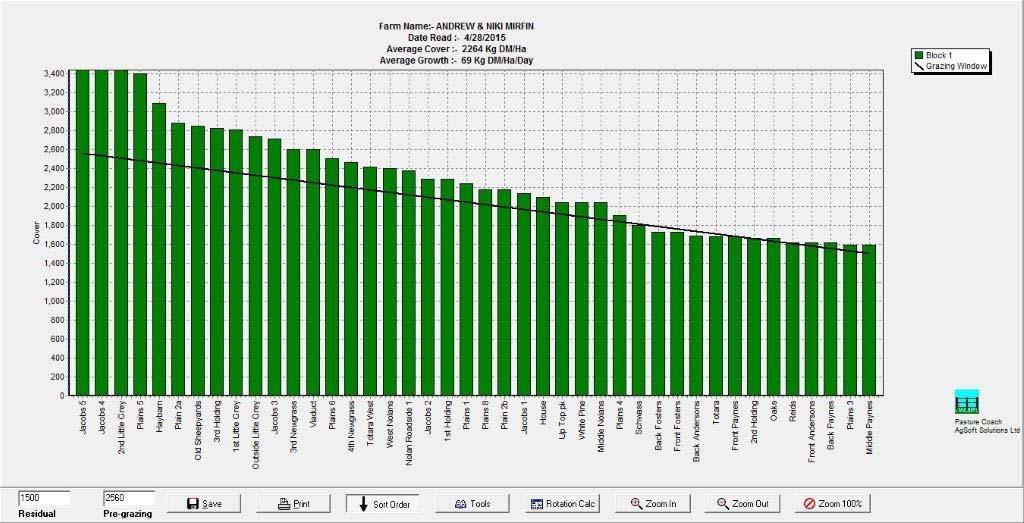
9 Westland Monitor Farm Project Weekly Update 22 May 2015 CO comment If you haven t completed a feed budget for the winter already, it s still not too late! Preparing a winter feed budget is essential if you want to get to spring with cows in the right BCS to calve and sufficient feed on hand to fully feed them through the spring. Have a look at - it s a simple feed budget which includes a cow BCS calculator. It will help ensure that you include all the critical factors when you re putting the feed budget together. Remember to protect next season s pasture production by using stand-off pads, feed pads and on-off grazing to minimise pugging during the wet underfoot grazing conditions. Farm Summary Average cover (kg DM/ha) APC (14 May) Rotation length (days) Stocking rate Percentage in milk Milksolids kg/cow Milksolids kg/ha MS/cow (season to date) MS/ha (season to date) N (kg/ha) year to date Current N application rate kg N/ha None 10 April 10 April 1 April 10 April DM / Pasture ME >12.7 > / Pasture / Pasture CP / Target Intake (kg DM/cow/d) Supplement (kg/cow/day) Soil temperature ( C) Growth Rate (kg DM/day) Rainfall Conditions for farmwalk Dry overcast, warm Dry overcast, warm Comments NB: pasture quality data are for 1 sample collected from each farm Warm
10 Weekly Pasture Growth Rates 100 Pasture growth rate (kg DM/ha/day) Jun 10 Aug 10 Oct 10 Dec 10 Feb 10 Apr Av Weekly Soil Temperature Soil temperature ( C) Av Jun 10 Aug 10 Oct 10 Dec 10 Feb 10 Apr
11
12 Pasture Quality NOTE: We sample the paddocks immediately in front of the milkers, to height of 3.5cm (7 clicks on the rising plate meter). The RPM data in the table is the pre-grazing clicks recorded on the day of sampling. Description Date RPM DM Prot ADF OMD MJME /kg Pdk 46 2 Nov Pdk 20 1 Dec >85 >12.7 Pdk Jan >85 >12.7 Pdk 27 9 Feb > Pdk 43 6 Mar Pdk Apr >85 >12.7
13 Description Date RPM DM Prot ADF OMD MJME/kg Pdk Reids 3 Nov Pdk West Nolan 2 Dec Pdk White Pine 13 Jan > Pdk Back Payne 10 Feb >85 >12.7 Pdk Hold 6 Mar Pdk Reids 10 Apr >85 >12.7
14 Description Date RPM DM Prot ADF OMD MJME /kg Pdk 40 4 Nov Pdk 27 4 Nov Pdk 31 2 Dec > Pdk 41 2 Dec Pdk 23 5 Mar Pdk 8 5 Mar Pdk 11 1 Apr > Pdk 36 1 Apr
15 Description Date RPM DM Prot ADF OMD MJME/k g Pdk 20 4 Nov Pdk 50 3 Dec > Pdk Jan Pdk Feb Pdk 12 6 Mar Pdk Apr
16 Westland Monitor Farm Project Weekly Update 15 May 2015 CO comment May is a month of variable growth rates, so continue to regularly monitor pasture cover. Make sure you have a plan for drying off the herd and have revised your autumn feed budget with figures based on what you actually have been growing. Confirm your dry cow therapy options with your veterinarian. Give priority to drying off earlier calving cows as they will have less time over the dry period to put on the required body condition. It is one thing to have enough supplements in your feed budget but do you have enough time for cows to physically gain weight. Farm Summary Average cover (kg DM/ha) APC (8 May) Rotation length (days) Stocking rate Percentage in milk Milksolids kg/cow Milksolids kg/ha MS/cow (season to date) MS/ha (season to date) N (kg/ha) year to date Current N application rate kg N/ha None None 10 April 10 April 1 April 10 April DM / Pasture ME >12.7 > / Pasture / Pasture CP / Target Intake (kg DM/cow/d) Supplement (kg/cow/day) Soil temperature ( C) Growth Rate (kg DM/day) Rainfall Conditions for farmwalk Rain Rain Heavy rain wind Comments NB: pasture quality data are for 2 samples collected from each farm
17 Weekly Pasture Growth Rates 100 Pasture growth rate (kg DM/ha/day) Jun 10 Aug 10 Oct 10 Dec 10 Feb 10 Apr Av Weekly Soil Temperature Soil temperature ( C) Av Jun 10 Aug 10 Oct 10 Dec 10 Feb 10 Apr
18
19 Pasture Quality NOTE: We sample the paddocks immediately in front of the milkers, to height of 3.5cm (7 clicks on the rising plate meter). The RPM data in the table is the pre-grazing clicks recorded on the day of sampling. Description Date RPM DM Prot ADF OMD MJME /kg Pdk 46 2 Nov Pdk 20 1 Dec >85 >12.7 Pdk Jan >85 >12.7 Pdk 27 9 Feb > Pdk 43 6 Mar Pdk Apr >85 >12.7
20 Description Date RPM DM Prot ADF OMD MJME/kg Pdk Reids 3 Nov Pdk West Nolan 2 Dec Pdk White Pine 13 Jan > Pdk Back Payne 10 Feb >85 >12.7 Pdk Hold 6 Mar Pdk Reids 10 Apr >85 >12.7
21 Description Date RPM DM Prot ADF OMD MJME /kg Pdk 40 4 Nov Pdk 27 4 Nov Pdk 31 2 Dec > Pdk 41 2 Dec Pdk 23 5 Mar Pdk 8 5 Mar Pdk 11 1 Apr > Pdk 36 1 Apr
22 Description Date RPM DM Prot ADF OMD MJME/k g Pdk 20 4 Nov Pdk 50 3 Dec > Pdk Jan Pdk Feb Pdk 12 6 Mar Pdk Apr
23 Westland Monitor Farm Project Weekly Update 8 May 2015 CO comment The recent announcements of further reductions in the expected payout for this season wasn t good news, but not entirely unexpected. What is important to realise that the cash received inside next season is likely to be very similar to that received this season with a significant change the final winter payments will be starting later and are unlikely to be adequate to fund winter and early spring expenditure on their own. What this will mean is that either funds will need to be carried forward from now on, or overdraft levels will increase to ensure that the essential early season expenditure is able to be met. A combination of these two measures will be the likely approach for many, but identification of the level of additional funding needed will be important if the appropriate seasonal facilities are to be put in place. That work needs to start now so that both you and your financier have a good understanding of what is going to be required. The next Tactics for Tight Times fielday, to be held on Monday 18 th May, from 10.30am 1.00pm, will be focussing on providing you with the tools and resources to identify this for your business. You ll receive more information on this soon, but put the time aside to come along. Farm Summary Average cover (kg DM/ha) APC (30 April) Rotation length (days) Stocking rate Percentage in milk Milksolids kg/cow Milksolids kg/ha MS/cow (season to date) MS/ha (season to date) N (kg/ha) year to date Current N application rate kg N/ha None 10 April 10 April 1 April 10 April DM / Pasture ME >12.7 > / Pasture / Pasture CP / Target Intake (kg DM/cow/d) Supplement (kg/cow/day) Soil temperature ( C) Growth Rate (kg DM/day) Rainfall Conditions for farmwalk Fine, cold wind Overcast Heavy rain Comments
24 NB: pasture quality data are for 2 samples collected from each farm Weekly Pasture Growth Rates 100 Pasture growth rate (kg DM/ha/day) Jun 10 Aug 10 Oct 10 Dec 10 Feb 10 Apr Av Weekly Soil Temperature Soil temperature ( C) Av Jun 10 Aug 10 Oct 10 Dec 10 Feb 10 Apr
25
26 Pasture Quality NOTE: We sample the paddocks immediately in front of the milkers, to height of 3.5cm (7 clicks on the rising plate meter). The RPM data in the table is the pre-grazing clicks recorded on the day of sampling. Description Date RPM DM Prot ADF OMD MJME/kg Pdk 46 2 Nov Pdk 20 1 Dec >85 >12.7 Pdk Jan >85 >12.7 Pdk 27 9 Feb > Pdk 43 6 Mar Pdk Apr >85 >12.7
27 Description Date RPM DM Prot ADF OMD MJME/kg Pdk Reids 3 Nov Pdk West Nolan 2 Dec Pdk White Pine 13 Jan > Pdk Back Payne 10 Feb >85 >12.7 Pdk Hold 6 Mar Pdk Reids 10 Apr >85 >12.7
28 Description Date RPM DM Prot ADF OMD MJME/kg Pdk 40 4 Nov Pdk 27 4 Nov Pdk 31 2 Dec > Pdk 41 2 Dec Pdk 23 5 Mar Pdk 8 5 Mar Pdk 11 1 Apr > Pdk 36 1 Apr
29 Description Date RPM DM Prot ADF OMD MJME/kg Pdk 20 4 Nov Pdk 50 3 Dec > Pdk Jan Pdk Feb Pdk 12 6 Mar Pdk Apr
30 Westland Monitor Farm Project Weekly Update 1 May 2015 CO comment Cooler growing conditions will bring a corresponding slowing in pasture growth rates. Carefully consider the urge to capture those last few kilograms of milksolids this season, especially given the short supply of purchased supplement from Canterbury and the more marginal economics of using imported feed to extend lactation this season. Be careful, do your homework and make sure you have the feed on hand to achieve any extra milkings without compromising the farm setup for next season. Current production levels are unlikely to meet the cost of the extra feed if it needs to be purchased to replace feed required for winter and early spring. Stretching your feed supply too thin will be at the cost of cow condition or pasture cover heading into winter. The focus needs to be on setting the farm up adequately for next season check your feed budget to keep you on track, whatever decision you end up making. Farm Summary Average cover (kg DM/ha) APC (24 April) Rotation length (days) Stocking rate Percentage in milk Milksolids kg/cow Milksolids kg/ha MS/cow (season to date) MS/ha (season to date) N (kg/ha) year to date Current N application rate kg N/ha None 10 April 10 April 1 April 10 April DM / Pasture ME >12.7 > / Pasture / Pasture CP / Target Intake (kg DM/cow/d) Supplement (kg/cow/day) Soil temperature ( C) Growth Rate (kg DM/day) Rainfall Conditions for farmwalk Rain windy hot Rain Comments NB: pasture quality data are for 2 samples collected from each farm Rain wet underfoot
31 Average monthly growth rate for each region compared with the 6 year average Pasture growth rate (kg/ha/day) Av 0 June Jul Aug Sep Oct Nov Dec Jan Feb Mar Apr May Average monthly soil temperature for each region compared with the 6 year average Soil temperature ( C) Av 0 June Jul Aug Sep Oct Nov Dec Jan Feb Mar Apr May
32 Weekly Pasture Growth Rates 100 Pasture growth rate (kg DM/ha/day) Jun 10 Aug 10 Oct 10 Dec 10 Feb 10 Apr Av Weekly Soil Temperature Soil temperature ( C) Av Jun 10 Aug 10 Oct 10 Dec 10 Feb 10 Apr
33
34 Pasture Quality NOTE: We sample the paddocks immediately in front of the milkers, to height of 3.5cm (7 clicks on the rising plate meter). The RPM data in the table is the pre-grazing clicks recorded on the day of sampling. Description Date RPM DM Prot ADF OMD MJME /kg Pdk 46 2 Nov Pdk 20 1 Dec >85 >12.7 Pdk Jan >85 >12.7 Pdk 27 9 Feb > Pdk 43 6 Mar Pdk Apr >85 >12.7
35 Description Date RPM DM Prot ADF OMD MJME/kg Pdk Reids 3 Nov Pdk West Nolan 2 Dec Pdk White Pine 13 Jan > Pdk Back Payne 10 Feb >85 >12.7 Pdk Hold 6 Mar Pdk Reids 10 Apr >85 >12.7
36 Description Date RPM DM Prot ADF OMD MJME /kg Pdk 40 4 Nov Pdk 27 4 Nov Pdk 31 2 Dec > Pdk 41 2 Dec Pdk 23 5 Mar Pdk 8 5 Mar Pdk 11 1 Apr > Pdk 36 1 Apr
37 Description Date RPM DM Prot ADF OMD MJME/k g Pdk 20 4 Nov Pdk 50 3 Dec > Pdk Jan Pdk Feb Pdk 12 6 Mar Pdk Apr
Commercial-in-Confidence Ashton Old Baths Financial Model - Detailed Cashflow
 Year 0 1 2 3 4 5 6 7 8 9 10 11 12 13 Oct-16 Nov-16 Dec-16 Jan-17 Feb-17 Mar-17 Apr-17 May-17 Jun-17 Jul-17 Aug-17 Sep-17 Oct-17 2,038 2,922 4,089 4,349 6,256 7,124 8,885 8,885 8,885 8,885 8,885 8,885 9,107
COMPARISON OF FIXED & VARIABLE RATES (25 YEARS) CHARTERED BANK ADMINISTERED INTEREST RATES - PRIME BUSINESS*
 CHARTERED BANK ADMINISTERED INTEREST RATES - PRIME BUSINESS*") COMPARISON OF FIXED & VARIABLE RATES (25 YEARS) 2 Fixed Rates Variable Rates For Internal Use Only. FIXED RATES OF THE PAST 25 YEARS AVERAGE RESIDENTIAL MORTGAGE LENDING RATE - 5 YEAR* (Per cent) Year
COMPARISON OF FIXED & VARIABLE RATES (25 YEARS) 2 Fixed Rates Variable Rates For Internal Use Only. FIXED RATES OF THE PAST 25 YEARS AVERAGE RESIDENTIAL MORTGAGE LENDING RATE - 5 YEAR* (Per cent) Year
COMPARISON OF FIXED & VARIABLE RATES (25 YEARS) CHARTERED BANK ADMINISTERED INTEREST RATES - PRIME BUSINESS*
 CHARTERED BANK ADMINISTERED INTEREST RATES - PRIME BUSINESS*") COMPARISON OF FIXED & VARIABLE RATES (25 YEARS) 2 Fixed Rates Variable Rates FIXED RATES OF THE PAST 25 YEARS AVERAGE RESIDENTIAL MORTGAGE LENDING RATE - 5 YEAR* (Per cent) Year Jan Feb Mar Apr May Jun
COMPARISON OF FIXED & VARIABLE RATES (25 YEARS) 2 Fixed Rates Variable Rates FIXED RATES OF THE PAST 25 YEARS AVERAGE RESIDENTIAL MORTGAGE LENDING RATE - 5 YEAR* (Per cent) Year Jan Feb Mar Apr May Jun
FOR IMMEDIATE RELEASE
 Article No. 7433 Available on www.roymorgan.com Roy Morgan Unemployment Profile Friday, 12 January 2018 2.6m Australians unemployed or under-employed in December The latest data for the Roy Morgan employment
FOR IMMEDIATE RELEASE
 Article No. 7761 Available on www.roymorgan.com Roy Morgan Unemployment Profile Monday, 8 October 2018 Unemployment down to 9.4% in September off two-year high Australian employment has grown solidly over
FOR IMMEDIATE RELEASE
 Article No. 5842 Available on www.roymorgan.com Roy Morgan Unemployment Profile Thursday, 2 October 2014 Unemployment climbs to 9.9% in September as full-time work lowest since October 2011; 2.2 million
FOR IMMEDIATE RELEASE
 Article No. 6928 Available on www.roymorgan.com Roy Morgan Unemployment Profile Wednesday, 17 August 2016 Australian real unemployment jumps to 10.5% (up 0.9%) in July during post-election uncertainty
FOR IMMEDIATE RELEASE
 Article No. 7845 Available on www.roymorgan.com Roy Morgan Unemployment Profile Friday, 18 January 2019 Unemployment in December is 9.7% and under-employment is 8.8% FOR IMMEDIATE RELEASE Australian unemployment
Sound Transit Operations July 2016 Service Performance Report. Ridership
 Ridership Total Boardings by Mode Mode Jul-15 Jul-16 % YTD-15 YTD-16 % ST Express 1,618,779 1,545,852-4.5% 10,803,486 10,774,063-0.3% Sounder 333,000 323,233-2.9% 2,176,914 2,423,058 11.3% Tacoma Link
Past Due. Account Charges. Contract Charges Security Deposit Due - Jun 09, , Customer Service. Jun 19, PAST DUE $1,693.
 11983978 Jun 19, 217 1 124 958 PAST DUE $1,693.97 Meter Reading Information Meter # 55271 May 3 655 Jun 15 6642 17 days 1397 on or about Aug 15 82 Past Due Balance payable includes an amount which is payable
University of Michigan Eco-Driving Index (EDI) Latest data: October 2017
 Latest data: October 2017") University of Michigan Eco-Driving Index () http://www.ecodrivingindex.org Latest data: October 2017 Developed and issued monthly by Michael Sivak and Brandon Schoettle Sustainable Worldwide Transportation
University of Michigan Eco-Driving Index () http://www.ecodrivingindex.org Latest data: October 2017 Developed and issued monthly by Michael Sivak and Brandon Schoettle Sustainable Worldwide Transportation
Balance from your previous bill $0.00 Meter # Basic Charge: 17 $ /day 3.23* Energy charge:¹ 2
 11983979 Jun 19, 217 1 124 962 Jul 11, 217 $24.34 Meter Reading Previous Bill. Balance from your previous bill $. Meter # 552711 May 3 19813 Account Account charge 12.4* Charges 17 days 82 Jun 15 19895
Operational Overview. Operational Forum, 24 th March 2010
 Operational Overview Operational Forum, 24 th March 21 Weather Weather February 21 The cold weather continued throughout February with all but one day being colder than the 17-year seasonal normal CWV.
FOR IMMEDIATE RELEASE
 Article No. 7353 Available on www.roymorgan.com Roy Morgan Unemployment Profile Wednesday, 11 October 2017 2.498 million Australians (18.9%) now unemployed or under-employed In September 1.202 million
Canola Weekly. Index. WCE May/07 Canola Jul 9-Aug 14-Sep 20-Oct 27-Nov 4-Jan 8-Feb 16-Mar
 March 2, 2 Canola Weekly Index ) Canola Steady Despite Weak Soy Complex 2) Slow Crush Improves Canola Oil Basis ) Export Demand Underpins Canola Last week, we mentioned that May canola had key support
FOR IMMEDIATE RELEASE
 Article No. 7137 Available on www.roymorgan.com Roy Morgan Unemployment Profile Wednesday, 8 February 2017 Over 12 million Australians have jobs for the first time including over 8 million full-time jobs,
D G A G R I D A S H B O A R D : A P P L E S
 Sources: Eurostat, MSs notifications, DG Agri, Comext, Comtrade, GTA, ITC, AMI, Expert groups, Freshfel, Wapa. 000 tonnes 39 41 31 22 29 22 32 27 17 18 9 27 15 12 6 6 6 4 5 6 5 4 11 25 15 9 9 93 62 51
Diesel prices finally ease Winter weather and international events could determine your fuel bill for 2018 By Bryce Knorr, senior grain market analyst
 Diesel prices finally ease Winter weather and international events could determine your fuel bill for 2018 By Bryce Knorr, senior grain market analyst After rallying to their highest level in nearly three
D G A G R I D A S H B O A R D : A P P L E S
 75 79 60 56 49 74 65 59 54 42 76 63 58 53 78 55 42 43 79 44 81 63 47 83 64 59 53 48 Sources: Eurostat, MSs notifications, DG Agri, Comext, Comtrade, GTA, ITC, AMI, Expert groups, Freshfel, Wapa. 89 68
ANCR CRU Statistics February 2007 to December 2007
 ANCR CRU Statistics February 2007 to December 2007 o Jan/07 Feb/07* Mar/07 Apr/07 May/07 Jun/07 Jul/07 Aug/07 Sep/07 Oct/07 Nov/07 Dec/07 Total notes data from Perimeter phone system unavailable prior
GROWTH IN TENTH DISTRICT MANUFACTURING ACTIVITY EXPANDED SOLIDLY Federal Reserve Bank of Kansas City Releases May Manufacturing Survey
 FOR RELEASE Thursday, May 22, 2014 EMBARGOED FOR 10 A.M. CENTRAL TIME CONTACT: Pam Campbell 405-270-8617 Pam.Campbell@kc.frb.org GROWTH IN TENTH DISTRICT MANUFACTURING ACTIVITY EXPANDED SOLIDLY Federal
Baoshan Iron & Steel Co., Ltd. August 2010
 Baoshan Iron & Steel Co., Ltd. August 2010 1 Disclaimer: The following presentation distributed herewith includes forwardlooking statements. All statements, other than statements of historical facts, that
MARKET RATES UPDATE Paula Gold-Williams Cory Kuchinsky
 MARKET RATES UPDATE I N T R O D U C T I O N BY: Paula Gold-Williams President & Chief Executive Officer (CEO) P R E S E N T E D BY: Cory Kuchinsky Interim Vice President, Financial Services September 24,
25 TH APRIL 17 WHITLAND COLLECTIVE DAIRY SALE PEDIGREE AND COMMERCIAL DAIRY CATTLE FRESHLY CALVED COWS AND HEIFERS DAIRY DRY AND YOUNGSTOCK
 PEDIGREE AND COMMERCIAL DAIRY CATTLE FRESHLY CALVED COWS AND HEIFERS DAIRY DRY AND YOUNGSTOCK STOCKBULLS OF ALL BREEDS 25 TH APRIL 17 11.15AM WHITLAND COLLECTIVE DAIRY SALE YOUR DAIRY AUCTIONEER HUW EVANS
TENTH DISTRICT MANUFACTURING SURVEY REBOUNDED MODERATELY Federal Reserve Bank of Kansas City Releases January Manufacturing Survey
 FOR RELEASE Thursday, January 23, 2014 EMBARGOED FOR 10 A.M. CENTRAL TIME CONTACT: Bill Medley 816-881-2556 Bill.Medley@kc.frb.org TENTH DISTRICT MANUFACTURING SURVEY REBOUNDED MODERATELY Federal Reserve
Up and Down Months of the Stock Market
 Up and Down Months of the Stock Market 1926-2017 Positive years (66) in the stock market were not good all year long and losing years (24) were not losers throughout the year. Winning years produce losing
Regulation Update. Operating Committee September 12, PJM 2017
 Regulation Update Operating Committee September 12, 2017 Regulation Market Clearing Price *Data up to Aug 22 2 Mileage Ratio Mileage Ratio has increased since the new signal implementation Larger Utilization
GROWTH IN TENTH DISTRICT MANUFACTURING WAS SLIGHTLY POSITIVE Federal Reserve Bank of Kansas City Releases February Manufacturing Survey
 FOR RELEASE Thursday, February 27, 2014 EMBARGOED FOR 10 A.M. CENTRAL TIME CONTACT: Pam Campbell 405-270-8617 Pam.Campbell@kc.frb.org GROWTH IN TENTH DISTRICT MANUFACTURING WAS SLIGHTLY POSITIVE Federal
1. Trends in the current fiscal year and previous fiscal year 3. Business overview 2. Secular trends in first quarter financial results
 FY2/19 (March 2018~May 2018) Fact Book 1. Trends in the current fiscal year and previous fiscal year 3. Business overview (1) Performance overview P. 1 (1) No. of students at the end of month P. 6 (2)
System Status Briefing
 System Status Briefing Phakamani Hadebe Interim Group Chief Executive 3 May 2018 Contents 1 Performance summary 2 Operational highlights 3 Generation performance 4 Distribution overview 5 Transmission
WIM #41 CSAH 14, MP 14.9 CROOKSTON, MINNESOTA APRIL 2014 MONTHLY REPORT
 WIM #41 CSAH 14, MP 14.9 CROOKSTON, MINNESOTA APRIL 2014 MONTHLY REPORT In order to understand the vehicle classes and groupings, the MnDOT Vehicle Classification Scheme and the Vehicle Classification
2014 Meteorological and Oceanographic Summary for the Bocas del Toro Research Station. Prepared by: Steven Paton
 0 2014 Meteorological and Oceanographic Summary for the Bocas del Toro Research Station Prepared by: Steven Paton 1 Introduction This is the second of a series of yearly reports summarising the past year
System Management Principles Statement
 System Management Principles Statement Compliance report for December 213 and January 214 Summary of balancing actions and breaches for December 213 - January 214 Performance compared to last year Summary
Price Category Breakdown - February 2010
 SINGLE FAMILY RESIDENTIAL BREAKDOWN ruary 21 ruary Sales and Average Price Increase Annually TORONTO - Wednesday, March 3, 21 7.3 % 24.6 % 1.8 % 7.3%.2%.1 % Greater Toronto REALTORS reported 7,291 sales
Local Climatological Data Summary Aurora, Illinois
 SWS Miscellaneous Publication 98-15 STATE OF ILLINOIS DEPARTMENT OF NATURAL RESOURCES Local Climatological Data Summary Aurora, Illinois 1901-1996 Herbert Hoffman 1, Audrey A. Bryan 2 and Wayne Wendland
September 2016 Water Production & Consumption Data
 September 2016 Water Production & Consumption Data September 2016 monthly water production (288.48 AF) was lowest in at least 17 years. Monthly water production has increased slightly each month since
Government of Canada Hopper Car Fleet
 Government of Canada Hopper Car Fleet 2010 Annual Report Prairie and Northern Region TP 14995E Her Majesty the Queen in Right of Canada, represented by the Minister of Transport, the Honourable Denis Lebel
Thirty Years of Climatological Data: 1969 to 1998
 Thirty Years of Climatological Data: 1969 to 1998 NMSU's Agricultural Science Center at Farmington, New Mexico Agricultural Experiment Station Research Report 744 College of Agriculture and Home Economics
City of Biddeford Solid Waste Management Commission January 10, :00 PM Public Works
 City of Biddeford Solid Waste Management Commission January 10, 2017 7:00 PM Public Works 1. Call to Order 2. Approval of Minutes - December 13, 3. Discussion / Approval 3.1. Food Waste curbside collection
November 2018 Customer Switching Report for the Electricity and Gas Retail Markets
 An Coimisiún um Rialáil Fóntas Commission for Regulation of Utilities November 2018 Customer Switching Report for the Electricity and Gas Retail Markets Information Paper Reference: CRU18266 Date Published:
ANCR CRU Statistics Februa.. to December 2007
 ANCR CRU Statistics Februa.. to December 2007 Jan/07 Feb/07* Mar/07 Apr/07 May/07 Jun/07 Jul/07 Aug/07 Sep/07 Oct/07 Nov/07 Dec/07 Total notes Answered dato from Perimeter phone system unavailable prior
System Management Principles Statement
 System Management Principles Statement Compliance report for September 214 and October 214 Summary of balancing actions and breaches for September 214 October 214 Performance compared to last year Summary
FY2/18 2Q(March 2017~August 2018)
") FY2/18 2Q(March 2017~August 2018) Fact Book 1. Trends in the current fiscal year and previous fiscal year 3. Business overview (1) Performance overview P.1 (1) No. of students at the end of month P.7 (2)
FY2/18 2Q(March 2017~August 2018) Fact Book 1. Trends in the current fiscal year and previous fiscal year 3. Business overview (1) Performance overview P.1 (1) No. of students at the end of month P.7 (2)
System Management Principles Statement
 System Management Principles Statement Compliance report for June 214 to August 214 Summary of balancing actions and breaches for June 214 to Aug 214 Performance compared to last year Summary Report Jun-14
GAZIFÈRE INC. Prime Rate Forecasting Process 2017 Rate Case
 Overview A consensus forecast is used to estimate the prime rate charged by commercial banks. As the prime rate is subject to competitive pressures faced by individual lenders and is set on an individual
November 2017 Customer Switching Report for the Electricity and Gas Retail Markets
 An Coimisiún um Rialáil Fóntas Commission for Regulation of Utilities November 2017 Customer Switching Report for the Electricity and Gas Retail Markets Information Paper Reference: CRU18011 Date Published:
Central London Congestion Charging Scheme. 17 March 2005 Impacts - 9 th Annual Conference. Michele Dix Director Congestion Charging Division
 Central London Congestion Charging Scheme 17 March 2005 Impacts - 9 th Annual Conference Michele Dix Director Congestion Charging Division Contents 1. The Scheme 2. Impacts 3. Next Steps The Scheme Where
August ATR Monthly Report
 August ATR Monthly Report Minnesota Department of Transportation Office of Transportation Data and Analysis August 2011 Introduction The purpose of this report is to examine monthly traffic trends on
Macroeconomic Outlook. Presented by Dr. Bruce A. Scherr Chairman of the Board Chief Executive Officer Emeritus
 Macroeconomic Outlook Presented by Dr. Bruce A. Scherr Chairman of the Board Chief Executive Officer Emeritus Waterways Symposium Cincinnati, OH November 15-17, 2016 Topics Energy Macro Implications Inflation
THIS REPORT CONTAINS ASSESSMENTS OF COMMODITY AND TRADE ISSUES MADE BY USDA STAFF AND NOT NECESSARILY STATEMENTS OF OFFICIAL U.S.
 THIS REPORT CONTAINS ASSESSMENTS OF COMMODITY AND TRADE ISSUES MADE BY USDA STAFF AND NOT NECESSARILY STATEMENTS OF OFFICIAL U.S. GOVERNMENT POLICY Required Report - public distribution Oilseeds and Products
Operational Forum Meeting. Wednesday 12th December 2012, 10:30AM Radisson Grafton Hotel, 130 Tottenham Court Road, London.
 Operational Forum Meeting Wednesday 12th December 212, 1:3AM Radisson Grafton Hotel, 13 Tottenham Court Road, London. System Management Principles Statement System Management Principles Statement Compliance
P.O BOX 429, NUKU ALOFA, Tel: (676) Fax: (676)
 Fax: (676)") P.O BOX 429, NUKU ALOFA, Tel: (676) 27-390 Fax: (676) 23-047 Email: jvanbrink@tongapower.to 22 October 2012 Lord Dalgety Electricity Commission Tu atakilangi Nuku alofa Dear Lord Dalgety Compliance Reporting
P.O BOX 429, NUKU ALOFA, Tel: (676) 27-390 Fax: (676) 23-047 Email: jvanbrink@tongapower.to 22 October 2012 Lord Dalgety Electricity Commission Tu atakilangi Nuku alofa Dear Lord Dalgety Compliance Reporting
TABLE C-43. Manufacturers' new and unfilled orders, {Amounts in millions of dollars] Nondurable. Capital goods. Total. goods.
![TABLE C-43. Manufacturers' new and unfilled orders, {Amounts in millions of dollars] Nondurable. Capital goods. Total. goods.](/thumbs/93/112603708.jpg "TABLE C-43. Manufacturers' new and unfilled orders, {Amounts in millions of dollars] Nondurable. Capital goods. Total. goods.") TABLE C-43. Manufacturers' new and unfilled orders, -74 {Amounts in millions of dollars] New orders t, I960. 27, 559 26, 903 30,672 30,115 31,086 33,005 35,322 37,952 41, 803 45, 944 46,763 50, 243 53,
TABLE C-43. Manufacturers' new and unfilled orders, -74 {Amounts in millions of dollars] New orders t, I960. 27, 559 26, 903 30,672 30,115 31,086 33,005 35,322 37,952 41, 803 45, 944 46,763 50, 243 53,
May ATR Monthly Report
 May ATR Monthly Report Minnesota Department of Transportation Office of Transportation Data and Analysis May 2011 Introduction The purpose of this report is to examine monthly traffic trends on Minnesota
MONTHLY PERFORMANCE DASHBOARD
 AUSTIN ENERGY MARCH 21 MONTHLY PERFORMANCE DASHBOARD A report highlighting key Austin Energy metrics for uary FY 21 FINANCIAL HEALTH Standard and Poor s Bond Rating Current AA AA Budget Based Revenues
TRANSPACIFIC CUSTOMER ADVISORY Implementation of New BAF Formula Effective January 01, 2019
 December 7, 2018 TRANSPACIFIC CUSTOMER ADVISORY Implementation of New BAF Formula Effective January 01, 2019 Dear Valued Customer, Bunker is one of the important cost components for a container shipping
Scheme of Control Agreement
 23 Apr 2018 2019-2033 Scheme of Control Agreement Energy Efficiency and Conservation Renewable Energy Monthly Fuel Clause Charge Adjustment Principles Higher Priority Disadvantaged Groups & The Needy Lack
MONTHLY PERFORMANCE DASHBOARD
 AUSTIN ENERGY JULY MONTHLY PERFORMANCE DASHBOARD A report highlighting key Austin Energy metrics for e FY FINANCIAL HEALTH Standard and Poor s Bond Rating Austin Energy Rating AA AA Budget Based Revenues
Factory activity accelerated further in our region this month, posting its highest composite reading since 2011, said Wilkerson.
 FOR RELEASE Thursday, October 26, 17 EMBARGOED FOR A.M. CENTRAL TIME CONTACT: Pam Campbell 45-27-8617 Pam.Campbell@kc.frb.org TENTH DISTRICT MANUFACTURING ACTIVITY POSTS STRONG GROWTH Federal Reserve Bank
NJ Solar Market Update As of 6/30/15
 NJ Solar Market Update As of 6/30/ Prepared by Charlie Garrison July 17, 20 SOLAR INSTALLED CAPACITY DATA The preliminary installed solar capacity as of 6/30/ is approximately 1,500.7 MW. Approximately
Economic and Financial Outlook
 Economic and Financial Outlook Euro Area October 2017 Summary 1 2 3 4 Robust GDP growth in Euro Area, but subdued inflation Spanish GDP growth has stabilized at elevated rates Short View of France and
Gas & electricity - at a glance
 $/barrel /tco 2 e p/therm /MWh Gas & electricity - at a glance Week-on-Week Annual Gas Price Changes Short-term gas contracts jump Cold snap forecast for the first half of February, lifting demand Longer-dated
Local Climatological (Data Summary Molim, Illinois
 SWS Miscellaneous Publication 98-13 STATE OF ILLINOIS DEPARTMENT OF ENERGY AND NATURAL RESOURCES Local Climatological (Data Summary Molim, Illinois 1872-1992 by Audrey A. Bryan and Wayne Wendland Climatological
G o v e r n m e n t o f C a n ada Hopper Car Fleet
 G o v e r n m e n t o f C a n ada Hopper Car Fleet Annual Report Prairie and Northern Region TP 14995E Government of Canada Hopper Car Fleet Annual Report 1 Gover nment of Canada Hopper Car Fleet Annual
2017 Meteorological and Oceanographic Summary for the Bocas del Toro Research Station. Prepared by: Steven Paton
 0 2017 Meteorological and Oceanographic Summary for the Bocas del Toro Research Station Prepared by: Steven Paton 1 Introduction This is the 5 th of a series of yearly reports summarising the past year
WIM #41 CSAH 14, MP 14.9 CROOKSTON, MINNESOTA MAY 2013 MONTHLY REPORT
 WIM #41 CSAH 14, MP 14.9 CROOKSTON, MINNESOTA MAY 2013 MONTHLY REPORT In order to understand the vehicle classes and groupings the Mn/DOT Vehicle Classification Scheme and the Vehicle Classification Groupings
MONTHLY PERFORMANCE DASHBOARD
 AUSTIN ENERGY MONTHLY PERFORMANCE DASHBOARD A report highlighting key Austin Energy metrics for uary FY 219 FINANCIAL HEALTH Standard and Poor s Bond Rating Austin Energy Rating AA AA Budget Based Revenues
GROWTH IN TENTH DISTRICT MANUFACTURING ACTIVITY EDGED HIGHER Federal Reserve Bank of Kansas City Releases September Manufacturing Survey
 FOR RELEASE Thursday, September 25, 2014 EMBARGOED FOR 10 A.M. CENTRAL TIME CONTACT: Pam Campbell 405-270-8617 Pam.Campbell@kc.frb.org GROWTH IN TENTH DISTRICT MANUFACTURING ACTIVITY EDGED HIGHER Federal
ELECTRICITY TARIFFS 2013/2014
 ELECTRICITY TARIFFS 2013/2014 Presented by Cobus Kritzinger Leon Swanepoel Deputy Director Finance Head Electro Technical Services CONTENTS BACKROUND ELECTRICITY SALES BULK PURCHASES SALARY INCREASE TARIFF
Wheat Marketing Situation
 Wheat Marketing Situation Prepared by: Darrell L. Hanavan Executive Director Colorado Wheat Administrative Committee If you would like to receive an email when this report is updated, email gmostek@coloradowheat.org
Total Production by Month (Acre Feet)
") Production by Month (acre-feet) 2008 2009 2010 2011 2012 2013 2014 2015 2016 January 25 339.10 228.90 249.50 297.99 243.06 327.14 247.66 212.37 February 234.00 218.80 212.10 241.52 245.82 279.08 234.16
Production by Month (acre-feet) 2008 2009 2010 2011 2012 2013 2014 2015 2016 January 25 339.10 228.90 249.50 297.99 243.06 327.14 247.66 212.37 February 234.00 218.80 212.10 241.52 245.82 279.08 234.16
Canada Meat Market Report
 January 2018 January 18th, 2018 Canada Meat Market Report - Supply and Price Situa on for Domes c and Imported Beef - Prepared for Meat and Livestock Australia Steiner Consul ng Group, Manchester, NH,
2016 Meteorological and Oceanographic Summary for the Bocas del Toro Research Station. Prepared by: Steven Paton
 0 2016 Meteorological and Oceanographic Summary for the Bocas del Toro Research Station Prepared by: Steven Paton 1 Introduction This is the forth of a series of yearly reports summarising the past year
Economics of Integrating Renewables DAN HARMS MANAGER OF RATE, TECHNOLOGY & ENERGY POLICY SEPTEMBER 2017
 Economics of Integrating Renewables DAN HARMS MANAGER OF RATE, TECHNOLOGY & ENERGY POLICY SEPTEMBER 2017 Presentation Outline Understanding LPEA s expenses and what drives them Economics of net metering
increase of over four per cent compared to the average of $409,058 reported in January 2010.
 SINGLE FAMILY RESIDENTIAL BREAKDOWN uary 211 26.8 % 1.7 % 7.%.4%.1 % Good Start to 211 TORONTO - February 4, 211 Greater Toronto REALTORS reported 4,337 transactions through the TorontoMLS system in uary
INTECH AUGUST QHSE PERFORMANCE
 INTECH QHSE PERFORMANCE - MONTHLY QHSE PERFORMANCE Goal Zero Days ( worked days without Lost Time Injury (LTI)) 751 This Month Minor Accidents or Incidents 01 This Month Major Accidents or Incidents 00
LOCAL CLIMATOLOGICAL DATA
 ILLINOIS STATE WATER SURVEY DIVISION URBANA, ILLINOIS ISWS MP-21 Archive SWS0964 Illinois State Water Survey LOCAL CLIMATOLOGICAL DATA FDR HILLSBORO, IL. 1901-1962 LOCAL CLIMATOLOGICAL DATA 1901-1962 HILLSBORO
Oriented Strand Board Sheathing (delivered, Los Angeles) 7/16-inch 2005 to 2009
 7/16-inch 2005 to 2009") Oriented Strand Board Sheathing (delivered, Los Angeles) 7/16-inch 2005 to 2009 OSB Sheathing (del. LA) 7/16" 2005 2006 2007 2008 2009 Average Month Price Change Price Change Price Change Price Change
Oriented Strand Board Sheathing (delivered, Los Angeles) 7/16-inch 2005 to 2009 OSB Sheathing (del. LA) 7/16" 2005 2006 2007 2008 2009 Average Month Price Change Price Change Price Change Price Change
COMPILED BY GLASS S. Auction Report - LCV November 2013
 GLASS S Auction Report - LCV November 2013 Contents Market Commentary Page 3 Whole Market Summary Page 8 Average Sales Price Year on Year Page 9 Sales Price Compared to Number of Entries (all ages) Page
The impact of electric vehicle development on peak demand and the load curve under different scenarios of EV integration and recharging options
 The impact of electric vehicle development on peak demand and the load curve under different scenarios of EV integration and recharging options Electricity demand in France: a paradigm shift Electricity
SELF-STORAGE FOR SALE
 PURCHASE PRICE: $525,000 OCCUPANCY: 62.2% NOI: $50,600 LOT SIZE: 2.0 acres BLDG CLASS: C OVERVIEW 90 unit, multi-building storage facility in a stable region of North Central Texas. This well-maintained,
REED Job Index: January 2012 KEY FINDINGS
 REED Job Index: uary 2012 The Reed Job Index tracks the number of new job opportunities and the salaries on offer compared to the previous month and against a baseline of 100 set in ember 2009. This monthly
Gravity Circuit Project (Apr Jul 2008)
") Gravity Circuit Project (Apr Jul 2008) Summary The recent focus on the gravity circuit has resulted in an increase in gravity recovery and improved circuit availability. The main reasons for these improvements
Gravity Circuit Project (Apr Jul 2008) Summary The recent focus on the gravity circuit has resulted in an increase in gravity recovery and improved circuit availability. The main reasons for these improvements
CREDIT UNION ESTIMATES
 MONTHLY CREDIT UNION ESTIMATES Prepared June 1, 2018 by Credit Union National Association Economics and Statistics Department cuna.org/mcue Loans Credit union loans outstanding grew 1.1% in, matching the
2017 Adjusted Count Report February 12, 2018
 A statewide multi-use trail user study and volunteer data collection program 2017 Adjusted Count Report February 12, 2018 The following report includes the final adjusted infrared (IR) counter data at
NEWS Release. U.S. Manufacturing Technology Orders. Year-to-date U.S. manufacturing technology orders up 4.1% over 2011
 U.S. Manufacturing Technology Orders A statistical program of AMT NEWS Release FOR RELEASE: October 8, 2012 Contact: Pat McGibbon, AMT, 703-827-5255 Year-to-date U.S. manufacturing technology orders up
January Manufacturing Technology Orders Off After a Strong December
 Contact: Bonnie Gurney, AMT, 703-827-5277 bgurney@amtonline.org For Release: March 9, 2015 January Manufacturing Technology Orders Off After a Strong December January U.S. manufacturing technology orders
CREDIT UNION ESTIMATES
 MONTHLY CREDIT UNION ESTIMATES Prepared July 2, 2018 by Credit Union National Association Economics and Statistics Department cuna.org/mcue Loans Credit union loans outstanding grew 1.3% in, compared to
Graph #1. Micro-Generation Generating Units in Alberta 20
 2, Graph #1. Micro-Generation Generating Units in Alberta 2 Cumulative # of Generating Units 1,9 1,8 1,7 1,6 1,5 1,4 1,3 1,2 1,1 1, 9 8 7 6 5 4 3 2 Number of MGG Units as of 216 Mar 31 Number of Solar
2016 Meteorological Summary for the Galeta Marine Island Laboratory. Prepared by: Steven Paton
 0 2016 Meteorological Summary for the Galeta Marine Island Laboratory Prepared by: Steven Paton 1 Introduction This is the fourth in a series of yearly reports summarising the past year s Smithsonian Tropical
2017 Meteorological Summary for the Galeta Marine Island Laboratory. Prepared by: Steven Paton
 0 2017 Meteorological Summary for the Galeta Marine Island Laboratory Prepared by: Steven Paton 1 Introduction This is the 5 th in a series of yearly reports summarising the past year s Smithsonian Tropical
MONTHLY PERFORMANCE DASHBOARD
 AUSTIN ENERGY MONTHLY PERFORMANCE DASHBOARD A report highlighting key Austin Energy metrics for ember FY 219 FINANCIAL HEALTH Standard and Poor s Bond Rating Austin Energy Rating AA AA Budget Based Revenues
CREDIT UNION ESTIMATES
 MONTHLY CREDIT UNION ESTIMATES Prepared May 1, 2018 by Credit Union National Association Economics and Statistics Department cuna.org/mcue Loans Credit union loans outstanding grew 1.1% in, compared to
Digitized for FRASER Federal Reserve Bank of St. Louis. Per cent. P Total reported (000) ^D-)>oCL
 ^D-)>oCL") statistical FEDERAL release RESERVE ^D-)>oCL For immedia < t4 6 relea I s February 13, 1968 AUTOM3BILE LOANS BY MAJOR SALES FINANCE COMPANIES IN THE FOURTH QlJARTP^HE PROPORTION OF 3 YEAR NEW CAR CONTRACTS
statistical FEDERAL release RESERVE ^D-)>oCL For immedia < t4 6 relea I s February 13, 1968 AUTOM3BILE LOANS BY MAJOR SALES FINANCE COMPANIES IN THE FOURTH QlJARTP^HE PROPORTION OF 3 YEAR NEW CAR CONTRACTS
STAFF REPORT INFORMATION ONLY
 Insert TTC logo here STAFF REPORT INFORMATION ONLY Presentation: Subway Closures - 2016 Year In Review and 2017 Forecast Date: January 18, 2017 To: From: TTC Board Chief Executive Officer Summary The purpose
Quarterly Hogs and Pigs
 Washington, D.C. Quarterly Hogs and Pigs Released March 26, 2010, by the National Agricultural Statistics Service (NASS),, U.S. Department of Agriculture. For information on call Nick Streff at 202-720-3,
ENERGY SLIDESHOW. Federal Reserve Bank of Dallas
 ENERGY SLIDESHOW Updated: March 13, 2018 ENERGY PRICES www.dallasfed.org/research/energy Brent & WTI & Crude Brent Oil Crude Oil Dollars per barrel 140 Brent (Mar 9 = $65.12) WTI (Mar 9 = $61.65) 120 100
STATISTICS BOTSWANA ELECTRICITY GENERATION & DISTRIBUTION 2016/2 STATS BRIEF, FIRST QUARTER Copyrights Statistics Botswana 2016
 2016/2 ELECTRICITY GENERATION & DISTRIBUTION STATS BRIEF, FIRST QUARTER 2016 Copyrights Statistics Botswana 2016 Statistics Botswana. Private Bag 0024 Botswana Tel: (267) 367 1300. Fax: (267) 395 2201.
BOARD OF COUNTY COMMISSIONERS AGENDA ITEM SUMMARY. Consent Workshop [ ]
![BOARD OF COUNTY COMMISSIONERS AGENDA ITEM SUMMARY. Consent Workshop [ ]](/thumbs/82/86800449.jpg "BOARD OF COUNTY COMMISSIONERS AGENDA ITEM SUMMARY. Consent Workshop [ ]") - _j POSTPONED FROM THE JANUARY 14 BCC MEETING Agenda Item #5,::.. I BOARD OF COUNTY COMMISSIONERS AGENDA ITEM SUMMARY Meeting Date: February 4, 2014 [ ] [ ] Department: Submitted By: Engineering & Public
- _j POSTPONED FROM THE JANUARY 14 BCC MEETING Agenda Item #5,::.. I BOARD OF COUNTY COMMISSIONERS AGENDA ITEM SUMMARY Meeting Date: February 4, 2014 [ ] [ ] Department: Submitted By: Engineering & Public
Electrical Power Analysis of the Cal Poly Organic Farm for the Cal Poly SuPER Project
 Electrical Power Analysis of the Cal Poly Organic Farm for the Cal Poly SuPER Project Presentation For SARC March 21, 2008 Senior Project By Alex Liang Agenda Terminology Introduction to SuPER and This