SELF-STORAGE FOR SALE
|
|
|
- Domenic Baldwin
- 5 years ago
- Views:
Transcription


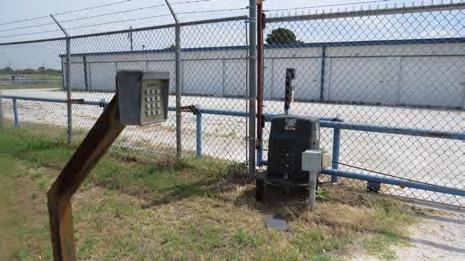
1 PURCHASE PRICE: $525,000 OCCUPANCY: 62.2% NOI: $50,600 LOT SIZE: 2.0 acres BLDG CLASS: C OVERVIEW 90 unit, multi-building storage facility in a stable region of North Central Texas. This well-maintained, gated property offers excellent upside on rents and occupancy. Managed remotely, this is a perfect property for an owner with an expanding portfolio, or a first time owner!
2 Management Summary Report Management Summary Report for 8/22/2018 Payments Day August 22 Week August Month August 2018 Year Jan Aug 2018 One Time Credit Card $0.00 $ $ $11, Credit Card $0.00 $55.19 $1, $17, Ach $0.00 $0.00 $69.00 $ One Time ACH $0.00 $0.00 $0.00 $ Check $0.00 $0.00 $0.00 $ Total $0.00 $ $2, $30, Activity Day August 22 Week August Month August 2018 Year Jan Aug 2018 Move Ins Move Outs Sales Day August 22 Week August Month August 2018 Year Jan Aug 2018 Rent $0.00 $ $2, $28, Deposit $0.00 $50.00 $75.00 $ Prorated Insurance Premium $0.00 $3.48 $9.29 $ Insurance Premium $0.00 $0.00 $9.00 $ Late Fee $0.00 $0.00 $0.00 $ Total $0.00 $ $2, $30, Occupancy As of 8/22/ :59PM Occupancy Units Percentage Rented % Available % Unavailable 1 1.1% Total % Download CSV TEX Storage Rainbow
3 2018 Yearly Report Jan Feb Mar Apr May Jun Jul Aug Sep Oct Nov Dec Total Units Rented Units Customer Rented Manager Rented Due $4,944 $4,338 $4,181 $4,493 $4,094 $3,864 $3,686 $3,120 $0 $0 $0 $0 Collected $4,434 $3,712 $4,472 $3,980 $3,764 $3,560 $3,819 $1,818 $0 $0 $0 $0 Tax $0.00 $0.00 $0.00 $0.00 $0.00 $0.00 $0.00 $0.00 $0.00 $0.00 $0.00 $0.00 Difference $510 $626 $291 $513 $330 $304 $133 $1,302 $0 $0 $0 $0 Total Units This is the cumulative total of units with a creation date before the end of the given month. Rented Units This is the cumulative total of rented units with a creation date before the end of the given month. Customer Rentals This is the number of new self rentals by customers during the given month. Manager Rentals This is the number of new rentals created by managers during the given month. Due This is the sum of all the line items with a due date in the given month. (The created date is used if the line item does not have a due date, like with custom fees.) Collected This is the sum of all the successful transactions created in the given month. TEX Storage Rainbow


4 US 67 HIGHLIGHTS 334 FRONTAGE ON US 67 FULLY FENCED W/ BARBED WIRE 24/7 GATED ACCESS W/ NIGHT LIGHTING DRIVE UP ACCESS


5 2 MI. 4 MI. HIGHLIGHTS LOCATED WITHIN 2 MILES OF SQUAW VALLEY GOLF COURSE AND COMMUNITY LESS THAN 5 MI FROM SQUAW CREEK RESERVOIR AND POWER PLANT

6 20 MI. 12 MI. 5 MI. HIGHLIGHTS 5mi from Squaw Creek Reservoir 10mi from Lake Granbury 20mi from Cleburne, TX Within 30 minute drive to Stephenville, TX


7

8
Commercial-in-Confidence Ashton Old Baths Financial Model - Detailed Cashflow
 Year 0 1 2 3 4 5 6 7 8 9 10 11 12 13 Oct-16 Nov-16 Dec-16 Jan-17 Feb-17 Mar-17 Apr-17 May-17 Jun-17 Jul-17 Aug-17 Sep-17 Oct-17 2,038 2,922 4,089 4,349 6,256 7,124 8,885 8,885 8,885 8,885 8,885 8,885 9,107
Past Due. Account Charges. Contract Charges Security Deposit Due - Jun 09, , Customer Service. Jun 19, PAST DUE $1,693.
 11983978 Jun 19, 217 1 124 958 PAST DUE $1,693.97 Meter Reading Information Meter # 55271 May 3 655 Jun 15 6642 17 days 1397 on or about Aug 15 82 Past Due Balance payable includes an amount which is payable
COMPARISON OF FIXED & VARIABLE RATES (25 YEARS) CHARTERED BANK ADMINISTERED INTEREST RATES - PRIME BUSINESS*
 CHARTERED BANK ADMINISTERED INTEREST RATES - PRIME BUSINESS*") COMPARISON OF FIXED & VARIABLE RATES (25 YEARS) 2 Fixed Rates Variable Rates For Internal Use Only. FIXED RATES OF THE PAST 25 YEARS AVERAGE RESIDENTIAL MORTGAGE LENDING RATE - 5 YEAR* (Per cent) Year
COMPARISON OF FIXED & VARIABLE RATES (25 YEARS) 2 Fixed Rates Variable Rates For Internal Use Only. FIXED RATES OF THE PAST 25 YEARS AVERAGE RESIDENTIAL MORTGAGE LENDING RATE - 5 YEAR* (Per cent) Year
COMPARISON OF FIXED & VARIABLE RATES (25 YEARS) CHARTERED BANK ADMINISTERED INTEREST RATES - PRIME BUSINESS*
 CHARTERED BANK ADMINISTERED INTEREST RATES - PRIME BUSINESS*") COMPARISON OF FIXED & VARIABLE RATES (25 YEARS) 2 Fixed Rates Variable Rates FIXED RATES OF THE PAST 25 YEARS AVERAGE RESIDENTIAL MORTGAGE LENDING RATE - 5 YEAR* (Per cent) Year Jan Feb Mar Apr May Jun
COMPARISON OF FIXED & VARIABLE RATES (25 YEARS) 2 Fixed Rates Variable Rates FIXED RATES OF THE PAST 25 YEARS AVERAGE RESIDENTIAL MORTGAGE LENDING RATE - 5 YEAR* (Per cent) Year Jan Feb Mar Apr May Jun
Balance from your previous bill $0.00 Meter # Basic Charge: 17 $ /day 3.23* Energy charge:¹ 2
 11983979 Jun 19, 217 1 124 962 Jul 11, 217 $24.34 Meter Reading Previous Bill. Balance from your previous bill $. Meter # 552711 May 3 19813 Account Account charge 12.4* Charges 17 days 82 Jun 15 19895
Your electricity bill
 Your electricity bill Bill date: February 22, 2017 Summary of what you owe Amount due on your last bill $1,271.36 Payment made on Jan 30, thank you -$1,271.36 Your balance forward $0.00 Your new charges
ANCR CRU Statistics February 2007 to December 2007
 ANCR CRU Statistics February 2007 to December 2007 o Jan/07 Feb/07* Mar/07 Apr/07 May/07 Jun/07 Jul/07 Aug/07 Sep/07 Oct/07 Nov/07 Dec/07 Total notes data from Perimeter phone system unavailable prior
METROPOLITAN COAL ENVIRONMENTAL PROTECTION LICENCE MONITORING SUMMARY
 Introduction The Protection of the Environment Operations Act 1997 (POEO Act) requires that holders of an environment protection licence make their pollution monitoring data publicly available in a timely
Total Production by Month (Acre Feet)
") Production by Month (acre-feet) 2008 2009 2010 2011 2012 2013 2014 2015 2016 January 25 339.10 228.90 249.50 297.99 243.06 327.14 247.66 212.37 February 234.00 218.80 212.10 241.52 245.82 279.08 234.16
Production by Month (acre-feet) 2008 2009 2010 2011 2012 2013 2014 2015 2016 January 25 339.10 228.90 249.50 297.99 243.06 327.14 247.66 212.37 February 234.00 218.80 212.10 241.52 245.82 279.08 234.16
Presentation to the Customer Service, Operations and Safety Committee OPERATIONS PERFORMANCE INDICATORS
 Presentation to the Customer Service, Operations and Safety Committee OPERATIONS PERFORMANCE INDICATORS May 19, 2005 Department of Operations 100 95 90 85 80 75 70 65 A B C D RAIL PERFORMANCE INDEX FY
Up and Down Months of the Stock Market
 Up and Down Months of the Stock Market 1926-2017 Positive years (66) in the stock market were not good all year long and losing years (24) were not losers throughout the year. Winning years produce losing
KCB GROUP PLC INVESTOR PRESENTATION. Q FINANCIAL RESULTS
 KCB GROUP PLC INVESTOR PRESENTATION. Q3 2018 FINANCIAL RESULTS MACRO-ECONOMIC HIGHLIGHTS Macro-Economic Highlights: Kenya KENYA 4.9% 5.3% GDP Growth Rate (%) 5.6% 5.8% 4.9% 6.3% 6.2% KENYA 2013 2014 2015
NJ Solar Market Update As of 6/30/15
 NJ Solar Market Update As of 6/30/ Prepared by Charlie Garrison July 17, 20 SOLAR INSTALLED CAPACITY DATA The preliminary installed solar capacity as of 6/30/ is approximately 1,500.7 MW. Approximately
ANCR CRU Statistics Februa.. to December 2007
 ANCR CRU Statistics Februa.. to December 2007 Jan/07 Feb/07* Mar/07 Apr/07 May/07 Jun/07 Jul/07 Aug/07 Sep/07 Oct/07 Nov/07 Dec/07 Total notes Answered dato from Perimeter phone system unavailable prior
FY2/18 2Q(March 2017~August 2018)
") FY2/18 2Q(March 2017~August 2018) Fact Book 1. Trends in the current fiscal year and previous fiscal year 3. Business overview (1) Performance overview P.1 (1) No. of students at the end of month P.7 (2)
FY2/18 2Q(March 2017~August 2018) Fact Book 1. Trends in the current fiscal year and previous fiscal year 3. Business overview (1) Performance overview P.1 (1) No. of students at the end of month P.7 (2)
GAZIFÈRE INC. Prime Rate Forecasting Process 2017 Rate Case
 Overview A consensus forecast is used to estimate the prime rate charged by commercial banks. As the prime rate is subject to competitive pressures faced by individual lenders and is set on an individual
FY2/17 3Q(March 2016~November2016)
") FY2/17 (March 2016~November2016) Fact Book 1. Trends in the current fiscal year and previous fiscal year 3. Business overview (1) Performance overview P. 1 (1) No. of students at the end of month P. 7
FY2/17 (March 2016~November2016) Fact Book 1. Trends in the current fiscal year and previous fiscal year 3. Business overview (1) Performance overview P. 1 (1) No. of students at the end of month P. 7
DRAFT. Total Month Average Point (MAP) A Massage 4/30/2014 8/1/2015 A CENTER E
 A Massage 4/30/2014 8/1/2015 A CENTER E") Total Month Average Point (MAP) A Massage 4/30/2014 8/1/2015 A CENTER E 2.25 2.00 2.00 2.25 2.00 2.00 1.00 2.25 2.00 2.25 2.00 A Massage 10/31/2017 9/1/2015 B MEZZANINE 2.25 2.00 2.00 2.25 2.25 2.25 2.25
Total Month Average Point (MAP) A Massage 4/30/2014 8/1/2015 A CENTER E 2.25 2.00 2.00 2.25 2.00 2.00 1.00 2.25 2.00 2.25 2.00 A Massage 10/31/2017 9/1/2015 B MEZZANINE 2.25 2.00 2.00 2.25 2.25 2.25 2.25
INTECH AUGUST QHSE PERFORMANCE
 INTECH QHSE PERFORMANCE - MONTHLY QHSE PERFORMANCE Goal Zero Days ( worked days without Lost Time Injury (LTI)) 751 This Month Minor Accidents or Incidents 01 This Month Major Accidents or Incidents 00
1. Trends in the current fiscal year and previous fiscal year 3. Business overview 2. Secular trends in first quarter financial results
 FY2/19 (March 2018~May 2018) Fact Book 1. Trends in the current fiscal year and previous fiscal year 3. Business overview (1) Performance overview P. 1 (1) No. of students at the end of month P. 6 (2)
Monthly Operating Report. September 2016
 Monthly Operating Report September 20 September overview» For the month of September 20 Contact recorded: Electricity, gas and steam sales of 819 GWh (September 2015: 821 GWh) Netback of $79.50/MWh (September
NE (SE) Beam
 Beam") Predicted clear day beam and diffuse irradiances (/ W m 2 ) on vertical and horizontal surfaces on specified days in northern (N) and southern (S) hemispheres (see notes at foot of table): LATITUDE 60
Predicted clear day beam and diffuse irradiances (/ W m 2 ) on vertical and horizontal surfaces on specified days in northern (N) and southern (S) hemispheres (see notes at foot of table): LATITUDE 60
Sunrise: 05:48 N (S) Beam
 Beam") Predicted clear day beam and diffuse irradiances (/ W m 2 ) on vertical and horizontal surfaces on specified days in northern (N) and southern (S) hemispheres (see notes at foot of table): LATITUDE 40
Predicted clear day beam and diffuse irradiances (/ W m 2 ) on vertical and horizontal surfaces on specified days in northern (N) and southern (S) hemispheres (see notes at foot of table): LATITUDE 40
TRAFFIC VOLUME TRENDS July 2002
 TRAFFIC VOLUME TRENDS July 2002 Travel on all roads and streets changed by +2.3 percent for July 2002 as compared to July 2001. Estimated Vehicle-Miles of Travel by Region - July 2002 - (in Billions) West
September 2016 Water Production & Consumption Data
 September 2016 Water Production & Consumption Data September 2016 monthly water production (288.48 AF) was lowest in at least 17 years. Monthly water production has increased slightly each month since
Monthly Operating Report. January 2019
 Monthly Operating Report January 2019 January overview For the month of January 2019» The Customer business recorded: Mass market electricity and gas sales of 281 GWh (January 20: 282 GWh) Mass market
Missouri River Mainstem Reservoirs Runoff Volumes for Annual Operating Plan Studies RCC Technical Report Jy-08
 Missouri River Region Since 1953 US Army Corps of Engineers Reservoir Control Center Missouri River Region Northwestern Division Reservoir Control Center July 2008 Missouri River Basin Fort Peck Montana
2013 / 2014 Revenue Comparison: OCTOBER
 CAR RENTAL GROSS REVENUES 2013 / Revenue Comparison: OCTOBER COMPANY 2013 incr./decr. % change Advantage 1,049,117.25 1,679,547.68 630,430.43 60.1% Alamo/National 5,448,360.80 8,262,318.28 2,813,957.48
Automated Occupancy Detection October 2015 (Phase I) Demonstration Results Presented by Kathy McCune
 Demonstration Results Presented by Kathy McCune") Automated Occupancy Detection October 2015 (Phase I) Demonstration Results Presented by Kathy McCune 2016 TRB Managed Lanes Conference May 5th, Session 6 Presentation Background Outline Metro ExpressLanes
Automated Occupancy Detection October 2015 (Phase I) Demonstration Results Presented by Kathy McCune 2016 TRB Managed Lanes Conference May 5th, Session 6 Presentation Background Outline Metro ExpressLanes
Preston s Edmond Market Report
 Preston s Edmond arket Report April 2 Prepared By Brian Preston RE/AX Associates obile: 45-826-5725 Office: 45-359-87 bpreston88@sbcglobal.net www.edmond4sale.com Realtor of the Year 1995 & 22 Lifetime
Monthly Statement. 374 kwh 2.8% from last year $ HOW WE CALCULATED YOUR BILL See reverse side for detailed description of charges Taxes
 JONATHAN SAMPLE 1234 MAIN STREET ANYWHERE, ST 00000-0000 Rate Plan: 12 Month CNE Account ID: 1-1222333456 Utility Number: 1001010202033334111555 Service Period: 08/17/17 to 09/16/17 HOW WE CALCULATED YOUR
TRAFFIC VOLUME TRENDS
 Page 1 U. S. Department Transportation Federal Highway Administration Office Highway Policy Information TRAFFIC VOLUME TRENDS September Travel on all roads and streets changed by +2.5 (5.8 billion vehicle
Irish History & Finance Check
 Irish History & Finance Check Date Of Report - vember 15th, 2017 Summary Report Registration Number Report Type 08D20364 Irish History & Finance Check apparent cause for concern Vehicle Details Make Model
NEWS Release. U.S. Manufacturing Technology Orders. Year-to-date U.S. manufacturing technology orders up 4.1% over 2011
 U.S. Manufacturing Technology Orders A statistical program of AMT NEWS Release FOR RELEASE: October 8, 2012 Contact: Pat McGibbon, AMT, 703-827-5255 Year-to-date U.S. manufacturing technology orders up
COMPILED BY GLASS S. Auction Report - LCV November 2013
 GLASS S Auction Report - LCV November 2013 Contents Market Commentary Page 3 Whole Market Summary Page 8 Average Sales Price Year on Year Page 9 Sales Price Compared to Number of Entries (all ages) Page
FY2/16(March 2015~February 2016)
") FY2/16(March 2015~February 2016) 1. Trends in the current fiscal year and the previous fiscal year 3. Business overview (1) Peformance overview P.1 (1) No. of students at the end of month P.7 (2) Cost
FY2/16(March 2015~February 2016) 1. Trends in the current fiscal year and the previous fiscal year 3. Business overview (1) Peformance overview P.1 (1) No. of students at the end of month P.7 (2) Cost
NEU Electric and Natural Gas Price Update
 $ / MWH Jan-11 May-11 Sep-11 Sep-12 Jan-13 Electric: Short-Term Outlook The NYMEX Northern Illinois Hub 12-month forward price at the end of August 2016 for the September 2016 to August 2017 period was
Turbine Lubricant Varnish Removal Case Studies using SVR
 Turbine Lubricant Varnish Removal Case Studies using SVR 5/14 As of May 14 there are over 4 SVR installations on turbine lubricant reservoirs operating throughout the world. These systems have gained an
FY2/17 (March 2016~February 2017)
") FY2/17 (March 2016~February 2017) Fact Book 1. Trends in the current fiscal year and previous fiscal year 3. Business overview (1) Performance overview P. 1 (1) No. of students at the end of month P. 7
FY2/17 (March 2016~February 2017) Fact Book 1. Trends in the current fiscal year and previous fiscal year 3. Business overview (1) Performance overview P. 1 (1) No. of students at the end of month P. 7
CEO PROGRAM September 2018
 CEO PROGRAM September 2018 1 Sept 17th: ALL! CEO High Orientation (Kiva 6pm 7:30pm) 2 3 4 5 6 7 8 Sept 18th: ALL! CEO Orientation (Kiva 6pm 7:30pm) 9 10 11 12 13 14 15 *Parents please drop off/pick up
NJ Solar Market Update
 NJ Solar Market Update April 16, 20 Renewable Energy Committee Meeting Trenton, NJ Prepared by Charlie Garrison Solar Installed Capacity Data The preliminary installed solar capacity as of 3/31/ is approximately
University of Michigan Eco-Driving Index (EDI) Latest data: October 2017
 Latest data: October 2017") University of Michigan Eco-Driving Index () http://www.ecodrivingindex.org Latest data: October 2017 Developed and issued monthly by Michael Sivak and Brandon Schoettle Sustainable Worldwide Transportation
University of Michigan Eco-Driving Index () http://www.ecodrivingindex.org Latest data: October 2017 Developed and issued monthly by Michael Sivak and Brandon Schoettle Sustainable Worldwide Transportation
3rd Quarter Market Report 2018
 3rd Quarter Market Report Lake Tahoe Basin Single Family (Excluding lakefront) Lake Tahoe Basin Condo/Townhome (Excluding lakefront & lakefront condo project) Total Units Sold 234 224 4% Total Units Sold
Data Current Through: January, Seattle (All Areas) RESIDENTIAL & CONDOMINIUM. Active, Pending, & Months Supply of Inventory. 4 mo.
 RESIDENTIAL & CONDOMINIUM. Active, Pending, & Months Supply of Inventory. 4 mo.") January, 2017 MTD MARKET UPDATE Data Current Through: January, 2017 Active, Pending, & Months Supply of Inventory 4,000 3,500 3,000 3,426 5.9 6.6 3,220 2,973 2,711 Active Listings MTD Pending Sales MTD
January, 2017 MTD MARKET UPDATE Data Current Through: January, 2017 Active, Pending, & Months Supply of Inventory 4,000 3,500 3,000 3,426 5.9 6.6 3,220 2,973 2,711 Active Listings MTD Pending Sales MTD
INTECH JUNE QHSE PERFORMANCE
 INTECH QHSE PERFORMANCE - MONTHLY QHSE PERFORMANCE Goal Zero Days ( worked days without Lost Time Injury (LTI)) 689 This Month Minor Accidents or Incidents This Month Major Accidents or Incidents Last
November 2017 Customer Switching Report for the Electricity and Gas Retail Markets
 An Coimisiún um Rialáil Fóntas Commission for Regulation of Utilities November 2017 Customer Switching Report for the Electricity and Gas Retail Markets Information Paper Reference: CRU18011 Date Published:
End-use petroleum product prices and average crude oil import costs January 2010
 January 21 International Energy Agency L'Agence internationale de l'énergie 9, rue de la Fédération, 75739 PARIS CEDEX 15 FRANCE prices@iea.org 18 e-mail: prices@iea.org 14 Petroleum products (USD/unit)
Memorandum City of Lawrence Planning & Development Services
 Memorandum City of Lawrence Planning & Development Services TO: Diane Stoddard, Interim City Manager FROM: Scott McCullough, Director CC: Casey Toomay, Assistant City Manager Date: August 9, 2015 RE: Rental
ELECTRIC VEHICLE MARKET UPDATE
 16TH ANNUAL ENERGY FORECASTING MEETING / EFG AUSTIN, TX APRIL 26-28, 2018 ELECTRIC VEHICLE MARKET UPDATE MIKE RUSSO, ITRON, INC. MONTHLY U.S. EV SALES Source: Monthly Plug-in Sales Scorecard, Inside EVs.
Year to Date Summary. Average and Median Sale Prices
 A Publication of RMLS, The Source for Real Estate Statistics in Your Community Residential Review: Southwest Washington September 2018 Reporting Period September Residential Highlights Southwest Washington
VEHICLE / PEDESTRIAN COLLISIONS
 Info item No. 1 Crosswalk Safety Advisory Committee March 31, 2016 VEHICLE / PEDESTRIAN COLLISIONS HRM: January December 20 DISCLAIMER: All figures presented in this report reflect the information held
OPERATIONS TOTALS ,135 7,511 8,823 8,056 8,021 8,319 8,039 8,283 8,001 8,738 8,219 8,094 98,239
 2007 OPERATIONS AIRCRAFT OPS-2006 JAN FEB MAR APR MAY JUN JUL AUG SEP OCT NOV DEC TOTAL AIR CARRIER - ITINERANT 748 725 907 804 930 969 832 996 841 899 990 1,249 10,890 AIR TAXI - ITINERANT 3,744 3,638
BARLOWORLD MOTOR BARLOWORLD MOTOR ANALYSTS VISIT
 BARLOWORLD MOTOR ANALYSTS VISIT 21 st SEPTEMBER 2006 32 Brands Strategy It remains.. To provide a range of motor vehicle usage solutions that address the needs of our Customers. Value Based Management
WIM #37 was operational for the entire month of September Volume was computed using all monthly data.
 SEPTEMBER 2016 WIM Site Location WIM #37 is located on I-94 near Otsego in Wright county. The WIM is located only on the westbound (WB) side of I-94, meaning that all data mentioned in this report pertains
PDR Energy Baseline Alternative. Proposal for Discussion October 27, 2015
 PDR Energy Baseline Alternative Proposal for Discussion October 27, 2015 Update Since Last Meeting Since the October 12 th Working Group Meeting Stem, Solar City, AMS and CESA have had over a half-dozen
Eastside (All Areas)
") November, 2018 MTD MARKET UPDATE Data Current Through: November, 2018 Active, Pending, & Months Supply of Inventory 4,500 4,000 4,156 6.5 3,926 Active Listings at End of Month Pending Sales MTD 7 mo. 6
November, 2018 MTD MARKET UPDATE Data Current Through: November, 2018 Active, Pending, & Months Supply of Inventory 4,500 4,000 4,156 6.5 3,926 Active Listings at End of Month Pending Sales MTD 7 mo. 6
Data Current Through: April, Seattle (All Areas) RESIDENTIAL & CONDOMINIUM. Active, Pending, & Months Supply of Inventory 1,
 RESIDENTIAL & CONDOMINIUM. Active, Pending, & Months Supply of Inventory 1,") April, 2017 MTD MARKET UPDATE Data Current Through: April, 2017 Active, Pending, & Months Supply of Inventory 5,000 4,500 4,000 3,500 3,000 2,500 4,321 5.3 3,670 4.1 3,960 3.2 2,954 3.3 Active Listings
April, 2017 MTD MARKET UPDATE Data Current Through: April, 2017 Active, Pending, & Months Supply of Inventory 5,000 4,500 4,000 3,500 3,000 2,500 4,321 5.3 3,670 4.1 3,960 3.2 2,954 3.3 Active Listings
Data Current Through: February, Seattle (All Areas) RESIDENTIAL & CONDOMINIUM. Active, Pending, & Months Supply of Inventory 1,
 RESIDENTIAL & CONDOMINIUM. Active, Pending, & Months Supply of Inventory 1,") February, 2017 MTD MARKET UPDATE Data Current Through: February, 2017 Active, Pending, & Months Supply of Inventory 4,000 3,500 3,650 3,555 6.9 3,297 Active Listings at End of Month Pending Sales MTD 8
February, 2017 MTD MARKET UPDATE Data Current Through: February, 2017 Active, Pending, & Months Supply of Inventory 4,000 3,500 3,650 3,555 6.9 3,297 Active Listings at End of Month Pending Sales MTD 8
Presented by. OSHA Training Program Information and Application
 Presented by OSHA Training Program Information and Application OSHA OSHA TRAINING PROGRAM INFORMATION OSHA CLASSES In addition to our many other training programs, we now offer OSHA 10 Hour and OSHA 30
Data Current Through: November, Seattle (All Areas) RESIDENTIAL & CONDOMINIUM. Active, Pending, & Months Supply of Inventory
 RESIDENTIAL & CONDOMINIUM. Active, Pending, & Months Supply of Inventory") November, 2017 MTD MARKET UPDATE Data Current Through: November, 2017 4,000 3,500 3,000 2,500 2,000 1,500 1,000 500 0 3,777 7.9 477 3,169 5.0 3,321 5.6 633 596 2,256 Active, Pending, & Months Supply of
November, 2017 MTD MARKET UPDATE Data Current Through: November, 2017 4,000 3,500 3,000 2,500 2,000 1,500 1,000 500 0 3,777 7.9 477 3,169 5.0 3,321 5.6 633 596 2,256 Active, Pending, & Months Supply of
End-use petroleum product prices and average crude oil import costs March 2011
 March 211 International Energy Agency L'Agence internationale de l'énergie 9, rue de la Fédération, 75739 PARIS CEDEX 15 FRANCE prices@iea.org 18 e-mail: prices@iea.org 14 Petroleum products (USD/unit)
Greater Las Vegas Snapshot by Sale Type Last Month's Sold
 Available Units Pending Units Greater Las Vegas Snapshot by Sale Type Last Month's Sold Units Median List Price Average List Price Median Sold Price Average Sold Price Months of Inventory 30 Day Absorption
The Changing Relationship Between the Price of Crude Oil and the Price At the Pump
 In 2007, what goes up, does not necessarily come down... May 3, 2007 The Changing Relationship Between the Price of Crude Oil and the Price At the Pump Prepared by: Tim Hamilton Petroleum Industry Consultant
NEU Electric and Natural Gas Price Update
 Exelon s $24 Billion Energy Bill Senate Bill 2814 Short-Term Energy Price Outlook On November 15, 2016, Exelon, through its legislative supporters, introduced Senate Bill 2814, a massive 446 page document
First half (2014/3/1~2014/8/31)
") FY2/15 (March 2014~November 201 4) 1.Trends in current fiscal year and previouse fiscal year 3.Business overview (1)Peformance overview P.1 (1)No. of students at the end of month P.7 (2)Cost of sales breakdown
FY2/15 (March 2014~November 201 4) 1.Trends in current fiscal year and previouse fiscal year 3.Business overview (1)Peformance overview P.1 (1)No. of students at the end of month P.7 (2)Cost of sales breakdown
Price Category Breakdown - February 2010
 SINGLE FAMILY RESIDENTIAL BREAKDOWN ruary 21 ruary Sales and Average Price Increase Annually TORONTO - Wednesday, March 3, 21 7.3 % 24.6 % 1.8 % 7.3%.2%.1 % Greater Toronto REALTORS reported 7,291 sales
FOR IMMEDIATE RELEASE
 Article No. 7761 Available on www.roymorgan.com Roy Morgan Unemployment Profile Monday, 8 October 2018 Unemployment down to 9.4% in September off two-year high Australian employment has grown solidly over
Greater Las Vegas Snapshot by Sale Type Last Month's Sold
 Available Units Pending Units Las Vegas Market Update - November 2017 Greater Las Vegas Snapshot by Sale Type Last Month's Sold Units Median List Price Average List Price Median Sold Price Average Sold
Data Current Through: March, Seattle (All Areas) RESIDENTIAL & CONDOMINIUM. Active, Pending, & Months Supply of Inventory 1,709 1,069 1,111 1.
 RESIDENTIAL & CONDOMINIUM. Active, Pending, & Months Supply of Inventory 1,709 1,069 1,111 1.") March, 2017 MTD MARKET UPDATE Data Current Through: March, 2017 Active, Pending, & Months Supply of Inventory 4,500 4,000 3,500 3,000 3,935 4.8 3,641 5.2 3,659 2,775 Active Listings at End of Month Pending
March, 2017 MTD MARKET UPDATE Data Current Through: March, 2017 Active, Pending, & Months Supply of Inventory 4,500 4,000 3,500 3,000 3,935 4.8 3,641 5.2 3,659 2,775 Active Listings at End of Month Pending
CHOPTANK ELECTRIC COOPERATIVE, INC. P.S.C. Md. No. 3 Sixteenth Revised Page No A LIGHTING SERVICE Rate Schedule L - S AVAILABILITY
 Sixteenth Revised Page No. 57 907A LIGHTING SERVICE Rate Schedule L - S AVAILABILITY Available to municipal organizations for controlled street, highway and area lighting from dusk to dawn. Also available
Greater Las Vegas Snapshot by Sale Type Last Month's Sold
 Available Units Pending Units Greater Las Vegas Snapshot by Sale Type Last Month's Sold Units Median List Price Average List Price Median Sold Price Average Sold Price Months of Inventory 30 Day Absorption
MONTHLY PERFORMANCE DASHBOARD
 AUSTIN ENERGY MARCH 21 MONTHLY PERFORMANCE DASHBOARD A report highlighting key Austin Energy metrics for uary FY 21 FINANCIAL HEALTH Standard and Poor s Bond Rating Current AA AA Budget Based Revenues
Hospitality & Tourism Management January 2015 Calendar Sunday Monday Tuesday Wednesday Thursday Friday Saturday 1 2 3
 Jan-14 Week 1 Week 2 January 2015 Calendar 1 2 3 New Year's Day - 4 5 6 7 8 9 10 New Intake-L4 (EFTH) Assign-Presentation L4 Assign-Presentation L5 Last Exam Reg- CTH Assign Marking Assign Marking Module-
Greater Las Vegas Snapshot by Sale Type Last Month's Sold
 Available Units Pending Units Greater Las Vegas Snapshot by Sale Type Last Month's Sold Units Median List Price Average List Price Median Sold Price Average Sold Price Months of Inventory 30 Day Absorption
Greater Las Vegas Snapshot by Sale Type Last Month's Sold
 Available Units Pending Units Greater Las Vegas Snapshot by Sale Type Last Month's Sold Units Median List Price Average List Price Median Sold Price Average Sold Price Months of Inventory 30 Day Absorption
August 2018 MLS Statistical Report
 January February March April May June July August Septem October Novem Decem August 218 MLS Statistical Report Total Sales Overall, sales are down 3%; however, total volume sold is up 7% and Median Sale
Greater Las Vegas Snapshot by Sale Type Last Month's Sold
 Available Units Pending Units Las Vegas Market Update - August 2018 Greater Las Vegas Snapshot by Sale Type Last Month's Sold Units Median List Price Average List Price Median Sold Price Average Sold Price
Damian HERD Nissan North America, Inc EV Business Development Manager August 2014
 Damian HERD Nissan North America, Inc EV Business Development Manager August 2014 1 Nissan s 100% Committed to: Zero Emission Mobility Global Leadership RJC Car of the year (2011, JPN) JPN Car of the
Utah Fatal Crash Summary 2014
 Utah Fatal Crash Summary 1 State of Utah Department of Public Safety Highway Safety Office W Amelia Earhart Dr # Salt Lake City, UT 8116 81-366-6 www.highwaysafety.utah.gov Preliminary Totals as of 1/29/
W (W) Beam
 Beam") Predicted clear day beam and diffuse irradiances (/ W m 2 ) on vertical and horizontal surfaces on specified days in northern (N) and southern (S) hemispheres (see notes at foot of table): LATITUDE 0 N/S
Predicted clear day beam and diffuse irradiances (/ W m 2 ) on vertical and horizontal surfaces on specified days in northern (N) and southern (S) hemispheres (see notes at foot of table): LATITUDE 0 N/S
FY2/18 (March 2017~February 2018)
") FY2/18 (March 2017~February 2018) Fact Book 1. Trends in the current fiscal year and previous fiscal year 3. Business overview (1) Performance overview P. 1 (1) No. of students at the end of month P. 6
FY2/18 (March 2017~February 2018) Fact Book 1. Trends in the current fiscal year and previous fiscal year 3. Business overview (1) Performance overview P. 1 (1) No. of students at the end of month P. 6
US Lodging Industry Overview. Amanda W. Hite President STR
 US Lodging Industry Overview Amanda W. Hite President STR Agenda Total US Review Scales Segmentation Pipeline 2012 / 2013 Forecast Total US Review Supply / Demand Drive Results. Pricing Power Is Back (?)
MONTHLY PERFORMANCE DASHBOARD
 AUSTIN ENERGY JULY MONTHLY PERFORMANCE DASHBOARD A report highlighting key Austin Energy metrics for e FY FINANCIAL HEALTH Standard and Poor s Bond Rating Austin Energy Rating AA AA Budget Based Revenues
Local Market Update February 2013
 Local Market Update February 213 February sales of single-family homes reported in Lucas and Upper Wood County by the Toledo Board of REALTORS totaled 315. This was unchanged compared to February of 212.
Greater Las Vegas Snapshot by Sale Type Last Month's Sold
 Available Units Pending Units Las Vegas Market Update - January 2019 Greater Las Vegas Snapshot by Sale Type Last Month's Sold Units Median List Price Average List Price Median Sold Price Average Sold
WIM #29 was operational for the entire month of October Volume was computed using all monthly data.
 OCTOBER 2015 WIM Site Location WIM #29 is located on US 53 near Cotton in St Louis county. System Operation WIM #29 was operational for the entire month of October 2015. Volume was computed using all monthly
PERMITS ISSUED BY TYPE AND AREA
 PERMITS ISSUED BY TYPE AND AREA NORTH CENTRAL SOUTH METHOW RESERVATION TOTALS FEBRUARY 2018 APPLIED ISSUED APPLIED ISSUED APPLIED ISSUED APPLIED ISSUED APPLIED ISSUED APPLIED ISSUED SINGLE FAM DWELLING
November 2018 Customer Switching Report for the Electricity and Gas Retail Markets
 An Coimisiún um Rialáil Fóntas Commission for Regulation of Utilities November 2018 Customer Switching Report for the Electricity and Gas Retail Markets Information Paper Reference: CRU18266 Date Published:
Alberta. Collision Facts. 330 people killed. 17,907 people injured. 140,705 collisions.
 Collision Facts 330 people killed 17,907 people injured 140,705 collisions May 2017 www.transportation.alberta.ca/statistics Collision Facts 330 people killed 17,907 people injured 140,705 collisions Monday
Daily Spot Cotton Quotations
 Volume 1, No. 111 Cotton and Tobacco Program 3275 Appling Road, Memphis, TN 38133 (91) 384-316 Daily Spot Cotton Quotations Spot quotations and differences are for cotton equal to the official standards,
All Annual Operating Plan Recipients
 To: All Annual Operating Plan Recipients From: Lower Colorado Region Boulder Canyon Operations Office River Operations Group Daniel Bunk P.O. Box 647 Boulder City, NV 896-47 Phone: 72-293-83 The operation
M onthly arket. Jan Table of Contents. Monthly Highlights
 Table of Contents Market Inventory...2 www.gaar.com Monthly Highlights January 2014 had a 12.29% increase in the number of homes sales when compared to same time last year. The average sale price of single-family
2017 SC Producers Whole Farm Revenue Protection Expected Price Justification
 2017 SC Producers Whole Farm Revenue Protection Expected Price Justification RMA Projected Expected As of Average Futures Price Close As of RMA Projected Prices 4 Feb 2011 2015 % Differ 4 Feb Crop Contract
Graph #1. Micro-Generation Generating Units in Alberta 20
 2, Graph #1. Micro-Generation Generating Units in Alberta 2 Cumulative # of Generating Units 1,9 1,8 1,7 1,6 1,5 1,4 1,3 1,2 1,1 1, 9 8 7 6 5 4 3 2 Number of MGG Units as of 216 Mar 31 Number of Solar
Oriented Strand Board Sheathing (delivered, Los Angeles) 7/16-inch 2005 to 2009
 7/16-inch 2005 to 2009") Oriented Strand Board Sheathing (delivered, Los Angeles) 7/16-inch 2005 to 2009 OSB Sheathing (del. LA) 7/16" 2005 2006 2007 2008 2009 Average Month Price Change Price Change Price Change Price Change
Oriented Strand Board Sheathing (delivered, Los Angeles) 7/16-inch 2005 to 2009 OSB Sheathing (del. LA) 7/16" 2005 2006 2007 2008 2009 Average Month Price Change Price Change Price Change Price Change
The Central London Congestion Charge
 The Central London Congestion Charge Mike Keegan, Transport Planning & Policy Transport for London The charge for having a vehicle* in the zone is 8 per day, weekdays, 7a.m. to 6.30 p.m. * Some vehicles
The Peoples Gas Light and Coke Company
 History of Gas Charges Due to the Operation of Rider 2 (Cents per Therm) Factors for Transportation Customers (Riders FST, SST, P, CFY and AGG) Non- Total Standby Standby Aggregation Commodity Commodity
Industry Overview. Powersports Market Update
 2017 Q1 Industry Overview Powersports Market Update Sport side-by-sides continue to lead led the powersports industry, with that segment s pricing once again averaging higher than any of the previous three
Meter Insights for Downtown Store
 Meter Insights for Downtown Store Commodity: Analysis Period: Prepared for: Report Date: Electricity 1 December 2013-31 December 2014 Arlington Mills 12 February 2015 Electricity use over the analysis
ANNUAL SUMMARY REPORT FY 2005 PERFORMANCE REPORT SUMMARY COMPARATIVE ANALYSIS
 ANNUAL SUMMARY REPORT FY 2005 PERFORMANCE REPORT SUMMARY COMPARATIVE ANALYSIS RAIL OPERATIONS: Rail Passenger injuries increased from 34 in FY04 to 41 in FY05. The Woodley Park collision accounted for