Dublin Unified School District Dublin, CA
|
|
|
- Chrystal Reeves
- 5 years ago
- Views:
Transcription


-337-4471 Fax: (951) 270-5212 www.")
1 Dublin, CA 7-Year Student Population Projections By Residence Fall (Based on Fall 2016 Data) Prepared by Pierce Street, Suite 200 Riverside, California Phone: (888) Fax: (951)
2 TABLE OF CONTENTS Introduction and District Background Executive Summary Section One: Section Two: Section Three: Section Four: Section Five: Appendix A : Methodology Sources of Data 1 Seven Year Projection Methodology 4 Projection Variables 5 Applying Variables to Generate Projections 11 Planned Residential Development Planned Development Summary by Study Area 14 Planned Development List 15 Map: Future Development in District 16 Attendance Matrices Attendance Matrices 17 Elementary School Attendance Matrix 18 Middle School Attendance Matrix 19 High School Attendance Matrix 20 District Wide Student Projections District Student Projection Summary 22 School Year 2016/17- School Year 2023/24 District Wide Student Projection Trends 24 Attendance Area Projections by Residence Elementary School Attendance Area Projections Map: Elem. Attendance Areas 25 Map: Elem. Projected Changes 26 Elementary School Projections by Residence 27 Elementary School Student Projection Trends 30 Middle School Attendance Area Projections Map: Middle School Attendance Areas 33 Map: Middle School Projected Changes 34 Middle School Projections by Residence 35 Middle School Student Projection Trends 36 High School Attendance Area Projections Map: High School Attendance Areas 37 Map: High School Projected Changes 38 High School Projections by Residence 39 High School Student Projection Trends 40 Study Area Projections by Residence TOC
3 INTRODUCTION AND DISTRICT BACKGROUND The Dublin Unified School District has contracted with Davis Demographics, Inc. (Davis Demographics) to analyze demographic data relevant to the district s facility planning efforts. The scope of contracted work includes: mapping the district, geocoding a student file that is usually representative of October's official head count, developing and researching pertinent demographic data, identifying future residential development plans, if any, and developing a seven year student population projection. Davis Demographics will then assist the district in developing solutions for housing its future student population. This study was prepared to assist the district s efforts in evaluating future site requirements and attendance area changes. The purpose of this report is to identify and inform the district of the trends occurring in the community; how these trends may affect future student population; and to assist in illustrating facility adjustments that may be necessary to accommodate the potential student population shifts. The district can then use this information to better plan for the need, location and timing of facility or boundary adjustments. Dublin Unified School District (DUSD) is scheduled to see substantial increases in its student population according to the seven year projection methodology. This is brought on by large amounts of new planned residential development as well as mobility factors that are showing high resale counts which help account for the substantial increases in enrollment in most grades over the projection timeframe. The Sources of Data section details where the two sources of data, geographic and nongeographic, are collected and how each data item is used in the seven year student population projection model. The Seven Year Projection Methodology section discusses, in detail, how the factors used in the study were calculated and why they were used. These factors include: the calculation of incoming kindergarten classes, additional students from new housing (referred to as student yield), the effects of student mobility, and a detailed review of planned residential development within the district. The Student Resident Projection Summary sections are a review of SY 2016/17's student resident projection results. Included in these sections are a district wide student population projection summary and a projected resident student population summary for each existing attendance area and study area. While reading this report, it is important to remember that this is a snapshot of current and potential student population based upon data gathered in Fall Population demographics change, development plans change, funding opportunities can change, district priorities can change, and therefore, new projections and adjustments to the overall Facilities Master Plan will continue to be necessary in the future. INTRODUCTION
4 EXECUTIVE SUMMARY Davis Demographics, Inc. is assisting the Dublin Unified School District (DUSD) to plan for future student population changes. By factoring current and historical student data with demographic data and planned residential development, Davis Demographics calculated a sevenyear student population projection. This projection is based upon residence of the students and is designed to alert the district as to when and where student population shifts will occur. Historical Perspective of the Dublin Unified School District Over the Past Ten Years Nearly every school district in California was experiencing some sort of growth in the early to mid-2000 s. Housing construction was reaching extremely high levels and new students were entering the school districts. By late 2007/early 2008 the California economy took a large hit and nothing felt that more than the state s housing market. Foreclosures swept over these regions and new housing construction came to a virtual standstill. The flow of students and money quickly reversed and most districts in the state saw their student populations begin a long and steady decline. The Dublin Unified School District (DUSD) experienced a much different pattern than most California school districts from ; the growth in student population continued. The new housing that was being built in the district did slow down, but the number of new students entering the DUSD kept climbing. When most school districts in California were in sharp decline and were contemplating closing schools, the DUSD had opposite issues to contend with: finding enough seats to house the continuous flow of new students. While most districts in the state of California have experienced a decline in overall enrollment from , DUSD has sustained continued growth during this period. There were a number of factors that contributed to this continuous growth during this timeframe; the desire to locate in an area of excellent schools, continued growth from new developments, reasonable housing prices (in comparison to San Francisco and the Silicon Valley) and historically low interest rates. The growth occurred at all grade levels, and for a brief time provided very large kindergarten class sizes. All signs point towards the continued student population growth within the District over the next seven years within all of the grade levels. The significant amount of residential development that is expected to be built within the District over the next seven years is a major contributing factor to this projected growth. Additionally, there is a major bubble of higher elementary grade classes that will eventually graduate on through and significantly increase the middle school and high school grades over the next seven years. The most challenging problem the District will face is how it plans to address the growth at the high school level where its resident student population is expected to grow by nearly students by Fall of EXECUTIVE SUMMARY
5 Over the next few paragraphs, the report will go over some generalities regarding DUSD projection variable information used to create the projections by residence. More specifics on these variables will be available in the noted sections of this report. Brief Overview of Projection Variables & Residential Development The birth rate numbers in Dublin USD seemed to reach a peak around and started to decline a bit through Birthrates seemed to stabilize after the year 2012 all the way through This indicates that there could be stable incoming kindergarten sizes within the next couple of years with some slight gradual growth s K class is projected to be slightly higher than the 2016 class. This kindergarten growth trend could continue through Fall of The s classes have no birth data to extrapolate from (data not available or they are not yet born). An average of the birth rates for the last few years was used to help project those future year s kindergarten classes. A slight drop in incoming Kindergarten classes is expected from Fall 2019 to Fall However, gradual slight increase of kindergarten enrollment for the years may occur. Any projected increase in kindergarten enrollment is largely due to the new residential development that is scheduled to be completed over the next seven years rather than the trend in birthrates that have occurred over the past years. (For more specifics on Birth Rates see Section One p. 5) Davis Demographics typically calculates mobility factors as an average of the in/out migration of all established areas of the District over the last four years for each grade level ( ), resulting in three years of change. This excludes any students that move into newly constructed residential development. From 2008 through 2012 it was found that the DUSD experienced unprecedented growth within its boundaries, not only from new development, but due also to a large amount of resales which resulted in a flood of new additional students continuously entering the District. It seems that the in/out student migration pattern has started to stabilize. The District for the most part has been able to retain its students as they have graduated from grade to grade within the last four years. In many cases there have been population gains from one grade to the other. (For more specifics on Mobility Factors see Section One, page 7) Over the last several years the DUSD has seen new housing construction continue to rise dramatically. This will continue to be the case over the projection timeframe with about 4,248 homes scheduled to be built over the next seven years. (For more specifics on Residential Development see Section Two) Brief Overview of Elementary School (TK-5) Impacts The Dublin Unified School District is composed of seven elementary schools, all currently serving TK-5 grade levels. As of Fall 2016, there were 5,707 TK-5 students enrolled in the District. There was a net increase of 331 TK-5 students when comparing it to the Fall 2015 total enrollment of 5,376 TK-5 students and a similar trend is expected to occur within the elementary grade levels over the next four years. A total of about 8,462 elementary grade students could be enrolled in the District by 2023, which is a projected increase of about 2,755 students (a net increase of 48.3% of the TK-5 population). Much of this growth is due to the fact that the District continues to experience higher than normal elementary grade mobility rates (this accounts for high housing resale rates bringing in many new families). Additionally, there is a significant amount of development that is due to be constructed within the next seven years. This fall s kindergarten population experienced a growth of 66 regular resident students which is about 7% growth when EXECUTIVE SUMMARY
6 compared to the Fall 2015 s figure. This growth in kindergarten class sizes is expected to continue through Fall 2019 as a result of the higher birth rates for that time period. The easternmost elementary attendance areas of the District are expected to grow more significantly in TK-5 resident student population than those in the west. The projected growth in these areas is largely due to the new residential development that is scheduled to occur within the projection time frame. With a total projected elementary student population of 8,462 by the Fall 2023 and a net growth of 2,755 TK-5 students, some of the existing elementary schools within the District will not be able to absorb the projected student growth. This shows the potential need of maybe three flexible K-8 sites within the District over the next seven years. It is recommended that these sites be built within the eastern or central portion of the District where most of the resident student growth is expected to occur. There is already a K-8 site planned to open in the Jordan Ranch area next year. Therefore, the District should start to explore their options on a second K-5 site and third flexible site that could help house the projected elementary students and temporarily help out the future middle school growth as well. Brief Overview of Middle School (6-8) Impacts There are currently two middle schools in the Dublin Unified School District, housing 2, students. The seven year projections indicate that the middle school enrollment could experience annual growth. An overall net increase of about 1,693 in the 6-8 student population is expected by 2023 (bringing the 6-8 total to 4,079 students). Both the Fallon and Wells Middle School areas could experience growth in resident student population over the next seven years. Over the next seven years, the District s 6-8 student population is expected to continue to grow. Currently (Fall 2016), the DUSD houses 2, students and that figure could reach 4, students by The Wells MS area shows a net growth of about students through 2023, while the Fallon MS area shows a net growth of students during that same time frame. The addition of the Jordan Ranch K-8 site next year should help address the middle school growth. This new K-8 site may eventually need to be transformed into a permanent middle school (in just the same manner as Fallon MS was converted in 2011/12 school year). Brief Overview of High School (9-12) Impacts The Dublin USD currently operates one comprehensive high school. As of Fall 2016, there were 2, high school students enrolled in the District (Dublin HS housing 2,455 of them while Valley Continuation High housed the other students). It is projected that the District could have 4, students enrolled by the year This is a projected growth of about 2, students over the next seven years. Most of this growth is expected to occur within the eastern and central portion of the District. With the District s resident high school student population nearly doubling by Fall 2023, it is clear that there will be a need for an additional high school to be built within this time frame. This additional recommended high school will need to be built to address the high school student population growth on the eastern and central portion of the District. In the case where this high school is not built, then Dublin High School could be faced with enrollments over 4,000 students as soon as 2022; By 2023, the 9-12 student population could reach 4,370. All of these figures are well beyond the Dublin HS s ideal capacity. EXECUTIVE SUMMARY
7 SECTION ONE METHODOLOGY SOURCES OF DATA Geographic Map Data Five (5) geographic data layers were updated for use in the seven year student population projections: 1. Street Centerline Database 2. Study Areas 3. Schools 4. Students Historical and Current 5. Planned Residential Development 1) Street Centerline Data Davis Demographics has licensed a digital street centerline map of the school district from the City of Dublin, CA. The street database has associated attributes that contain, but are not limited to, the following fields: full street name, address range and street classification. The main function of the streets is in the geocoding process of the student data. Each student is geocoded to the streets by their given residence address. The geocoding process places a point on the map for every student in the exact location that student resides. This enables Davis Demographics to analyze the student data in a geographic manner. Another vital utilization of the digital street database is in the construction of study areas. Freeways, major streets and neighborhood streets are generally used as boundaries for the study areas. 2) Study Areas Study areas are small geographic areas, similar to neighborhoods, and the building blocks of a school district. Study areas are geographically defined following logical boundaries of the neighborhood such as freeways, streets, railroad tracks, or rivers. Each study area is then coded with an elementary, middle and high school that the area is assigned to attend. By gathering information about the district at the study area level, Davis Demographics and the district can closely monitor growth and demographic trends in particular regions and identify potential need for boundary adjustments or new facilities. 3) Schools The District provided school facility location information to Davis Demographics for the purpose of mapping the District facilities. The school information includes school name, address, unique code and capacity. 4) Student Data a. Historical Student Data - Historical enrollment is used to compare past student population growth and trends as well as the effects of mobility (move in, move out from existing housing) throughout the district. Davis Demographics utilized the three (3) previous year's (13/14, 14/15 and 15/16) geocoded students as historical data. b. Current Student Data - A student data file for October 5, 2016 (received by computer data file from the school district) summarized by grade level and by study area is used as a base for student population projections. Existing students were categorized by study area through the geocoding process that locates each student within a particular area based upon their given address. The projections run each of the next seven years from school year 2016/17 through school year 2023/24. Page 1
8 c. Student Accounting The Student Accounting Summary (Table 1) indicates the total student enrollment as of October 2016 and the number of students used in the seven year student population projections. The projection model is based upon student residence and excludes students residing outside of the district s boundaries, students unable to be address matched and special education students (special education students usually attend a school that services their particular need). Table 1 Student Accounting Summary Student Accounting Summary School Year 2016/17 Actual Enrollment (10/5/2016) Total Students Provided by District File (October 2016) 10,678 Students Living out of District -246 Special Education Student (Special Day Class) -241 Pre-Kindergarten -4 Transitional Kindergarten Class -180 Unmatched (due to incomplete address information) -7 RESIDENT K-12 STUDENTS USED IN PROJECTIONS 10,000 5) Planned Residential Development This data was obtained through discussions with the district, city agencies, county agencies and major developers within the district boundaries. Data includes development name, location, housing type, total number of units and projected move in dates (phasing). Phasing for planned housing is factored into the seven projections. (See SECTION 2 for a detailed listing of the planned residential development). In the student population projection, Davis Demographics includes all Approved and Tentative tract maps in addition to any planned or proposed development that possibly will occur within the projection timeframe. The planned residential development information and phasing estimates is a snapshot of the district at the time of this study. All of the information may change and should be updated annually. Page 2
9 Data Used for Variables Three sets of data were compiled and reviewed for use in the seven year student population projections by residence: 1. Births by Zip Code 2. Mobility Factors 3. Student Yield Factors 1) Births by Zip Code Data Birth data by postal zip code was obtained from the California State Department of Health for the years and roughly correlated to the Dublin Unified School District. Past changes in historical birthrates are used to estimate future incoming kindergarten student population from existing housing. 2) Mobility Factors Mobility refers to the increase/decrease in the migration of students within the District boundary (move-in/move-out of students from existing housing). Mobility, which is essentially a modified cohort, is applied as a percentage of increase/decrease among each grade for every year of the projections. 3) Student Yield Factors (SYFs) Student Yield Factors were calculated by Davis Demographics from a housing count of existing dwelling units throughout the District built within the last five years. This survey includes three main housing types: single-family detached (SFD), multi-family attached (MFA) [town- homes, condominiums, duplexes, triplexes, quads] and apartments (APT). The student yield factors, combined with planned residential development units are used to determine the number of students generated from new residential housing development projects. Student Yield Factor calculations will be discussed again in the Seven Year Projection Methodology section. Page 3
10 SEVEN YEAR PROJECTION METHODOLOGY The projection methodology used in this study combines historical student population counts, past and present demographic characteristics, and planned residential development to forecast future student population at the study area level. District-wide projections are summarized from the individual study area projections. These projections are based on where the students reside and where they should be attending school. We use the actual location of where the students reside, as opposed to their school of enrollment, in order to provide the most accurate estimate of where future school facilities should be located. The best way to plan for future student population shifts is to know where the next group of students will be residing. The following details the methodology used in preparing the student population projections by residence. Seven Year Projections Projections are calculated out seven years from the date of projection for several reasons. The planning horizon for any type of facility is typically no less than five years, often longer. Seven years are usually sufficient to adequately plan for a new facility. It is a short to mid-term solution for planning needs. Projections beyond seven years are based on speculation due to the lack of reliable information on birthrates, new home construction and economic conditions. Why Projections are Calculated by Residence Typically, school district projections are based on enrollment by school. However, this method is inadequate when used to locate future school facility needs, because the location of the students is not taken into consideration. A school s enrollment can fluctuate due to variables in the curriculum, program changes, school administration and open enrollment policies. These variables can skew the apparent need for new or additional facilities in an area. The method used by Davis Demographics is unique because it modifies a standard cohort projection with demographic factors and actual student location. Davis Demographics bases its projections on the belief that school facility planning is more accurate when facilities are located where the greatest number of students reside. The best way to plan for facility requirements is to know where the next group of students will be residing. The following details the methodology used in preparing the student population projections. Page 4
 Incoming Kindergarten Live birth data is reported to the California State Department of Health by the resident postal zip")
11 PROJECTION VARIABLES Each year of the projections, 12 th grade students graduate and continuing students progress through to the next grade level. This normal progression of students is modified by the following factors: 1) Incoming Kindergarten Live birth data is reported to the California State Department of Health by the resident postal zip code of the mother. Davis Demographics uses the birth data by zip code roughly correlating to the district boundary and applies the data accordingly. If need be, a different birth factor can be applied to various areas of the district. Incoming kindergarten classes, for existing homes, are estimated by comparing changes in past births in the area. Table 2 illustrates the total births for each zip code in the Dublin Unified School District from 1999 to Incoming kindergarten classes are determined by multiplying the existing kindergarten class (2016/17) by the percent increase/decrease in the birthrate for the year the kindergarten class was born (2011). Assuming that the 2016/17 school year kindergarten class was born in 2011; Davis Demographics compared the total births in 2011 to the total births in 2012, to determine a factor for next year's kindergarten class (2017/18). The 2011 births were compared to 2013 (2018/19 s K class), 2011 to 2014 (2019/20 s K class) birth data for 2015 was still not available at the time of this report. Table 2 Births vs. K Class Page 5
12 Zip Codes Map Prepared by ± District Boundary Zip Codes February 23, Miles
13 2) Student Mobility Factors Student Mobility Factors further refine the seven-year student population projections. Davis Demographics is referring to mobility as the increase or decrease in the movement of students within the district boundary on an annual basis. Samplings of students living in established neighborhoods within a certain period are averaged and the resulting figures are applied to the projections as the students matriculate through the grades. High school drop-out rates, apartment movement, housing resales as well as foreclosure rates within the district are inherently built into the Mobility Factors that Davis Demographics calculates. Mobility, similar to a cohort, is applied as a percentage of increase/decrease to each grade for every year of the projections. A sample of 86 of the total 128 study areas was selected throughout the District s area that contains no new housing construction over the past five years. An analysis was made comparing enrollment figures from year-to-year to determine if there was a net increase or decrease of students from grade level to grade level. The sampling used, was taken over a four-year period (student data from 2013 through 2016) and three groupings were averaged. For example, a comparison was made for the Fall 2013 kindergarten student population to the Fall st grade students within a specific study area. This comparison was also conducted for Fall 2014 & Fall 2015 and the Fall 2015 & Fall 2016 groupings. The calculations for these three paired-year comparisons were averaged and a Mobility Factor was applied for each grade transition. A net increase or decrease of zero students over time is represented by a factor of A net student loss is represented by a factor less than and a net gain by a factor greater than (see Table 2 below). The 86 study areas sampled were separated into the appropriate elementary attendance areas; the DUSD has 7 distinct elementary school boundaries. For all study areas that make up each of the District s current elementary attendance areas, we applied the appropriate mobility factor that is listed on Table 3. Please see the list of all 86 study areas excluded in the mobility study following Table 3. Example: 100 Kindergarten students in Fall 16/17 x 1.14 (Dougherty ES K to 1st grade mobility) = 114 1st grade students in Fall 17/18 Having historical student data categorized by Study area is extremely helpful in calculating accurate Student Mobility Factors. Davis Demographics was able to utilize the last four year s (school years 2013/14, 2014/15, 2015/16, 2016/2017) student data. The 2013/14 student data was compared to 2014/15, 2014/15 to 2015/2016 and 2015/2016 to this year s student data at the Study area level. Grades 1-12 Mobility were all calculated to correspond with the elementary school attendance areas. Page 7


14 Page 8
 Two sets of data are required to calculate Student Yield Factors: a current student file (provided by the District) and")

![For the District, three general categories of housing units were analyzed; Single-Family Detached (SFD), Multi-Family Attached (MFA) {condominiums, townhomes, duplexes] and Apartments (APT).](/docs-images/90/101785962/images/15-2.jpg "Before the SYF s can be calculated from the current housing stock, the year of construction for each housing type must be determined.")
15 4) Student Yield Factors The Student Yield Factors, when applied to planned residential development units, determine how many additional students will be generated from new construction within the district (see Section Two for details on planned residential development) Two sets of data are required to calculate Student Yield Factors: a current student file (provided by the District) and current housing unit data (taken from the City of Dublin s Tax Assessor files. Each student record and tax assessor record is geocoded by their given address. The two database sets are then linked by common address. This allows Davis Demographics to associate each student with a specific housing unit. For the District, three general categories of housing units were analyzed; Single-Family Detached (SFD), Multi-Family Attached (MFA) {condominiums, townhomes, duplexes] and Apartments (APT). Before the SYF s can be calculated from the current housing stock, the year of construction for each housing type must be determined. In general, new housing attracts young families with elementary school aged children. Over the next 12 to 15 years, the children grow older and pass through the grades. This cycle is then repeated throughout the life of the home. Identifying the year of construction and number of current resident students in recently built housing units assists in estimating the number of new students generated from future residential development. Davis Demographics used housing units built within the last four years to determine the SYF s. In addition, other elements apart from the year of construction can be assessed. These elements include, but are not limited to, housing type, number of bedrooms, geographic location (study area), value of home, etc. Once a determining element is decided upon, simple calculations are performed to produce a Student Yield Factor. The total number of units for that housing type then divides the number of current students residing in each housing type. Davis Demographics calculated four different Student Yield Factors in April 2016 from all units built within the last four years ( ). The Student Yield Factors were all calculated to correspond with the district boundary. Upon examining the results, the District determined that the Student Yield Factors for units built between 2011 through 2015 would most accurately estimate the number of students new housing would yield. These units are similar in size a location to the planned residential development. It was decided to apply that SYF to the planned residential development within the District over the next seven years. This sampling should reflect a reasonable number of students expected from planned residential developments. Table 4 Student Yield Factors Page 9
16 5) Planned Residential Development Closely related to the Student Yield Factors are planned residential development units. Planned residential development data is collected to determine the number of new residential units that will be built over the time frame of the student population projections. The units built within the next seven years will have the appropriate SYF applied to it to determine the number of new students the planned residential development will yield. This data was obtained through discussions with the City of Dublin Planning Department, developers, on-site new home sales associates and District staff. In the student population projection by residence, Davis Demographics includes all Approved and Tentative tract maps in addition to any planned or proposed development that will possibly occur within the projection timeframe. The planned residential development information and phasing estimates is a snapshot of the district at the time of this study. All of the information may change and should be updated annually. Page 10
17 APPLYING THE VARIABLES TO GENERATE THE PROJECTIONS The following paragraphs summarize how Davis Demographics uses the factors to determine the student population projections. Remember that these projections are based on residence. Dublin Unified School District has been divided into 128 study areas. Every study area is coded with the school code of the elementary, middle and high schools attendance area it falls within. The residential projections are calculated at the study area level. This means that Davis Demographics conducts 128 individual projections that are based upon the number of students residing in each study area. The first step in calculating the projections is to tally the number of students that live in each study area by each grade (kindergarten through 12 th grade). The current student base (school year 2016/17) is then passed onto the next year's grade (2016/17 s K become 2017/18's 1 st graders, 2017/18's 1 st graders become 2018/19's 2 nd graders, and so on). After the natural progression of students through the grades, then Birth Factors are multiplied to the current kindergarten class to generate a base for the following year's kindergarten class and are applied at the zip code level. Next, a Mobility Factor is applied to all grades. Again, these factors take into account the natural in/out migration of students throughout the district. The mobility factor is applied to each student in every grade (K-12) at the study area level. A unique mobility factor is applied to each elementary school attendance area (and its individual study areas) determined by the mobility factor study. The last essential layer applied to the projections deals with additional students from planned residential development. This is a simple calculation, again conducted at the study area level, where the estimated number of new housing units for a particular year is multiplied by the appropriate Student Yield Factor. For example, if 100 single family detached (SFD) units are to be built in a specific study area in a given year, then you would multiply this number (100) by the SFD K-5 student yield factor (.452) and the resulting number (45.2) is divided evenly among the six grades. To finish generating the projections by residence, the same process is conducted for each of the 128 study areas. Once the projections have been run at the study area level, then simple addition is used to determine projections for each of the district's attendance areas or district-wide summary. For example, the residential projections for the Fallon Middle School attendance area are simply the summary of all of the study areas that make up this specific attendance area (see Section Five, Six and Seven for the projections of each elementary, middle and high school attendance areas). The District Summary for the projections (Section Four) is a total summary of all 128 study areas. The projections exclude all of the students that attend a district school but live completely outside of the district's boundaries, and full-time special education (SDC) students. These students are factored back into the projections by calculating their current overall percentage of student population, applying the percentage to future years and adding it to the resident projections (please see the Attendance Matrices in Section Three for a breakdown of the out-of-district and SDC students school). Davis Demographics adds the current total out-of-district and SDC students to each year of the projections because there is no way to accurately forecast these students in the future. Current and historical students, geographic data and non-geographic data are used to calculate the factors used in the student population projections by residence. These factors are applied using SchoolSite and projections are calculated for each study area for each grade. Page 11

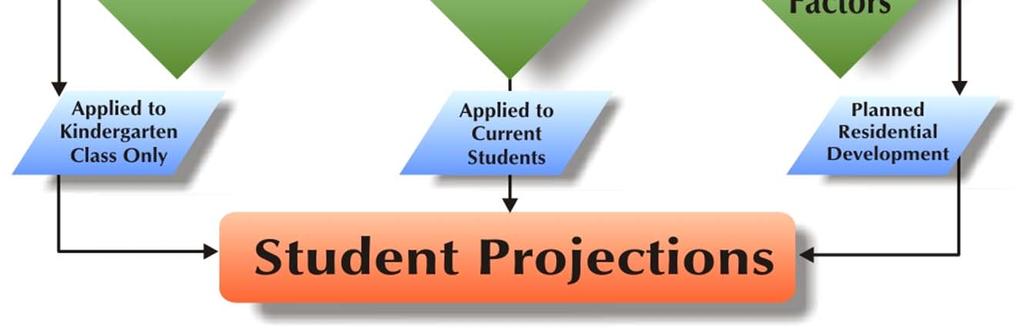
18 Projections by Residence Flowchart Page 12
19 SECTION TWO PLANNED RESIDENTIAL DEVELOPMENT The residential development data was obtained by Davis Demographics through individual site visits at each active residential project sales office, meetings with city planners, contacting owners/developers of inactive sites and discussions with District staff. A database and map of the planned residential development was created, including, when available, project name, location, housing type, total number of units and estimated move in dates (phasing schedule). Projected phasing is based upon occupancy of the unit and is used to help time the arrival of students from these new developments. In the student population projections by residence, Davis Demographics includes all Approved and Tentative tract maps in addition to any planned or proposed development that possibly will occur within the seven year projection timeframe. The planned residential development information and phasing estimates is a snapshot of the district at the time of this study. All of the information may change and should be updated annually. Page 13

20 Page 14
21 Fall 2016 Projections Report Active Projects Over the Next Seven Years Study Total Unit Type Units Left Area Units PROJECT DEVELOPER LOCATION to Build Comments Boulevard Single-Family Attached Brookfield Residential On Army Base right now SFD ALL Grading Underway Boulevard Multi Family Attached Brookfield Residential On Army Base right now MFA ALL Grading Underway Grafton Plaza Taylor Morrison Grafton Plaza MFA ALL Approved April Could start as early as Westport at Irongate Lennar Homes Dublin Blvd. between Locakhart & Fallon MFA Occupied: Full Occupancy by March/April 2017 Hillcrest at Irongate Lennar Homes Dublin Blvd. between Locakhart & Fallon SFD Units Occupied as of November 2016 Wexford at Irongate Lennar Homes Dublin Blvd. between Locakhart & Fallon SFD Occupied; 1 1/2 years until buildout as of Nov 2016 Irongate Lennar Homes Northeast Corner of Lockhart St & Dublin Blvd MFA ALL First Closings should start in August /2 to full occupany after August. Full Occupancy by End of 2018 Hillcrest Irongate Lennar Homes Southeast Corner of Central Parkway and Lockhart St SFD ALL New Models Open February 2017 Irongate Lennar Homes Dublin Blvd betweenlockhart St & Fallon Rd SFD ALL Model/Sales open December 2016 Wexford Irongate Lennar Homes Dublin Blvd btwn Lockhart St & Fallon Rd SFD ALL Models to be built in January Production 4 a month. Full Occupancy Fall Kingswood at Jordan Ranch Landsea Housing Corp. Central Parkway MFA Units Occupied; To be completed spring Trio at Jordan Ranch Brookfield Residential Sunset View Dr. & Central Pwky MFA Units Closing as of Nobember 2016 Capri at Jordan Ranch Brookfield Residential Sunset View Dr SFD Occupied as of November 2016 Jordan Ranch (Parcel H) Mission Valley Homes Northeast Corner of Central Pkwy & Fallon Road MFA ALL Under Construction, Now Grading Jordan Ranch - Slate (Neighborhood 7) Tri Pointe Homes Southeast side of Panorama Drive SFD ALL Model Sales Office Under Construction Jordan Ranch - Onyx Tri Pointe Homes Southeast side of Panorama Drive SFD ALL Under Construction and Grading; Models under Construction. Tribeca Pulte Homes Dublin Blvd. & Campbell Ln MFA 10 Last cluster under construction as of November 2016 Dublin Apartments Baywest Development 6775 Golden Gate Drive APT ALL First half will be available summer Full completion date: end of Eden - Veteran's Project Eden Housing 7500 Saint Patrick Way APT ALL Priority to Military Veterans. Units will be avaliable next Feb The Perch Trumark Homes, LLC 7144 Regional Street MFA ALL Trying to pull Permits as of December 2016 Heritage Park Pulte Homes Fraser Way SFD Occupied. To be completed by June Schaefer Ranch - Unit 2 Toll Brothers Dublin Blvd & Schaefer Ranch Rd SFD 5 5 left to occupy. To be all done by December Schaefer Ranch - Unit 3 Discovery Builders West end of Dublin Blvd SFD ALL Approved in June 2016 Tassajara Road Wanmei Properties 6237 Tassajara Road SFD ALL To city council in Spring Earliest units 2018 Tassajara Hills Toll Brothers East of Tassajara Rd, North of mission Peak Property to Contra Costa boundary SFD ALL Major Grading happening as of November Approved 8/9/16. Tassajara Highlands STL Co. LLC 7020 Tassajara Rd SFD ALL Preparing docs. Close to getting grading permits. Bridgecroft at Wallis Ranch Citron at Wallis Ranch Ivy Oak at Wallis Ranch Driftsong at Wallis Ranch Fielding at Wallis Ranch Riverton at Wallis Ranch Trestle at Wallis Ranch Barnwell at Wallis Ranch DR Horton Pulte Homes Taylor Morrison Warmington Residential Trumark Homes KB Homes Warmington Residential DR Horton Source: The city of Dublin Planning Department Davis Demographics and Planning. Dublin Ranch West: Tassajara Road, 1.5 miles north of I-580 Dublin Ranch West: Tassajara Road, 1.5 miles north of I-580 Dublin Ranch West: Tassajara Road, 1.5 miles north of I-580 Dublin Ranch West: Tassajara Road, 1.5 miles north of I-580 Dublin Ranch West: Tassajara Road, 1.5 miles north of I-580 Dublin Ranch West: Tassajara Road, 1.5 miles north of I-580 Dublin Ranch West: Tassajara Road, 1.5 miles north of I-580 Dublin Ranch West: Tassajara Road, 1.5 miles north of I B 92 SFD ALL Sales office opens in November Models to open February/ March SFD 137 1st move ins by end of this year. 2 1/2-3 years until buildout SFD ALL Sale Office opened November SFD 62 Sales Started May 2016; 2 1/2 years until full occupancy SFD 127 Sales Started August 2016; First Move ins Nov 2016; 2 1/2-3 years until buildout MFA 113 First Move Ins Dec/Jan started selling in September MFA ALL Models and sales open this year 56B 101 SFD ALL 3 Occupied and 2 year buildout as of November Prepared by Davis Demographics February 23, 2017

22 HILLTOP RIDGE RD Bridgecroft at Wallis Ranch 92 SFD Units RD UNNAMED Ivy Oak at Wallis Ranch 74 SFD Units Citron at Wallis Ranch 147 SFD Units Barnwell at Wallis Ranch 101 SFD Units TROLAN LN 57 Trestle at Wallis Ranch 60 MFA Units Fielding at Wallis Ranch 139 SFD Units Driftsong at Wallis Ranch 68 SFD Units Riverton at Wallis Ranch 125 MFA Units 76 UNNAMED Tassajara Highlands 44 SFD Units 75 FALLON RD Dublin Unified School District Planned Residential Development Over the Next Seven Years Moller Ranch 370 SFD Units 48 56A EA GLE RD TASSAJARA RD Tassajara Highlands 44 SFD Units Tassajara Road 19 SFD Units Schaefer Ranch - Unit 3 18 SFD Units Schaefer Ranch - Unit SFD Units Trumark-Regional Street 60 MFA Units Heritage Park 54 SFD Units Dublin Apartments 313 APT Units Eden - Veteran's Project 66 APT Units Dublin Crossing SFD 692 SFD Units Dublin Crossing MFA 979 MFA Units Tribeca 52 MFA Units Grafton Plaza 115 MFA Units Wexford at Irongate 112 SFD Units Hillcrest at Irongate 63 SFD Units Hillcrest Irongate 33 SFD Units Westport at Irongate 122 MFA Units Jordan Ranch (Parcel H) 45 MFA Units 113 Capri at Jordan Ranch 94 SFD Units Irongate 69 SFD Units Wexford Irongate 53 SFD Units Irongate 107 MFA Units Jordan Ranch Onyx 105 SFD Units Jordan Ranch (Slate) - Neighborhood 7 56 SFD Units Kingswood at Jordan Ranch 109 MFA Units Trio at Jordan Ranch 126 MFA Units Map Prepared by February 23, 2017 ± Streets StudyAreas Planned Residential Development Miles
23 SECTION THREE ATTENDANCE MATRICES Three Attendance Matrices have been included to provide a better understanding of where students reside and where they attend school. Remember, Davis Demographics projections are based upon where the students reside, not the student s school of enrollment. This method allows Davis Demographics to provide the most accurate forecast of where shifts in student population may occur and where changes to future facilities (if necessary) should be located. Therefore, since the projections are based upon where the students reside, the figures we use as a base for each school's resident projection may be slightly higher or lower than the actual reported enrollment for each school. The best way to plan for future facilities is to know where the next group of students will be coming from, not necessarily which school they are currently attending. Attendance matrices act as a check and balance for student accounting. They illustrate where the students reside (in what School of Residence) based upon their geocoded address and which school they attend (School of Attendance) based upon district provided student data. It is essential to show how the students used in the projections match up to the district s records of enrollment for each school. Furthermore, intra-district transferring patterns can be determined by comparing School of Residence data to the School of Attendance data. READING THE MATRIX Starting with the TK-5 Elementary School Attendance Matrix, let's begin with Amador as an example. Following down the first column with the Amador ES heading, there are 808 K-5 grade students attending Amador ES and reside in the Amador ES attendance area. Continuing downward, 6 students attend Amador ES and reside in the Dougherty ES attendance area. Next it shows that no students attend Amador ES and reside in the Dublin ES attendance area, and so on. The row entitled, Special Education refers to special education/sdc students attending the District s schools. There are 33 Special Education students attending Amador ES. The row Out of District refers to students living completely outside of the Dublin Unified School District boundary, but attending one of the District's schools. There are three out-of-district students attending Amador ES. Transitional Kindergarten lists the TK students attending each of the District s elementary schools. Unmatched refers to the students that could not have their addresses mapped/located due to incomplete address information. The TK-5 Totals is the total number of students attending a school regardless of where they reside, and reflects the District s enrollment counts for each school as of early October There were 873 TK-5 students attending Amador ES as of October The next step is to read across the matrix, beginning with the Amador ES attendance area row. We know 808 represents the total number of K-5 grade students residing and attending Amador ES. The next column, Dougherty refers to the number of K-5 grade students residing in the Amador attendance area, but attending Dougherty ES; there are 20 such students. The TK-5 Totals column to the far right of the matrix is the total number of students living in that particular attendance area. There are 874 TK-5 students residing in the Amador ES attendance area as of CBEDS date (early October) The 6-8 (Middle School) and 9-12 (High School) attendance matrices on the following pages can be read in the same manner as described above. Page 17

24 Page 18
25 Page 19
26 Page 20
27 SECTION FOUR DISTRICT WIDE STUDENT POPULATION PROJECTION The student population is projected out seven years for each of the study areas, attendance areas and for the entire Dublin Unified School District. The District Wide Summary enables the district to see a broad overview of future population shifts and what impact these shifts may have on existing and future facilities. Each attendance area is summarized to give a more local view of population changes and identify variances in the district. The study area listings enable the district to monitor student population growth or decline in neighborhood areas within the district. Together, these projection summaries, present the means for identifying the timing of future population shifts and overall facility adjustments needed to accommodate these shifts. At any time, study areas and their projected resident students can be shifted between schools to assist in balancing enrollment, analyzing school consolidation issues as well as understanding various other planning issues. Page 21
28 Dublin Unfied School District Sub Total of Resident Students: Special Education Students: Out-of-District Students: Unmatched Students: District-Wide 7-Year Forecast Projection Date 10/5/2016 Actual Actual Actual "Current" Projected Resident Student Counts Fall 2013 Fall 2014 Fall 2015 Fall 2016 Fall 2017 Fall 2018 Fall 2019 Fall 2020 Fall 2021 Fall 2022 Fall 2023 TK K , , , , , , , , , , , , , , , , , , , , , , , , , , , , , , , , , , , , , , , , , , , , , , , , , , , , , , , , , , , , , , , , , ,001.9 Fall 2013 Fall 2014 Fall 2015 Fall 2016 Fall 2017 Fall 2018 Fall 2019 Fall 2020 Fall 2021 Fall 2022 Fall 2023 TK-5 4,286 4,704 5,136 5,500 6, , , , , , , ,768 2,011 2,165 2,289 2, , , , , , , ,867 1,997 2,166 2,391 2, , , , , , ,370.1 TK-12 7,921 8,712 9,467 10,180 11, , , , , , ,528.9 Fall 2013 Fall 2014 Fall 2015 Fall 2016 Fall 2017 Fall 2018 Fall 2019 Fall 2020 Fall 2021 Fall 2022 Fall 2023 K K Fall 2013 Fall 2014 Fall 2015 Fall 2016 Fall 2017 Fall 2018 Fall 2019 Fall 2020 Fall 2021 Fall 2022 Fall 2023 K K Fall 2013 Fall 2014 Fall 2015 Fall 2016 Fall 2017 Fall 2018 Fall 2019 Fall 2020 Fall 2021 Fall 2022 Fall 2023 K K Change from Fall 2013 Fall 2014 Fall 2015 Fall 2016 Fall 2017 Fall 2018 Fall 2019 Fall 2020 Fall 2021 Fall 2022 Fall 2023 # % Totals: TK-5 4,486 4,928 5,376 5,707 6, , , , , , , , % 6-8 1,840 2,091 2,260 2,386 2, , , , , , , , % ,983 2,117 2,309 2,522 2, , , , , , , , % TK-12 8,309 9,136 9,945 10,615 11, , , , , , , , % SY 2016/17 Projection From '13 to '14 From '14 to '15 From '15 to '16 From '16 to '17 From '17 to '18 From '18 to '19 From '19 to '20 From '20 to '21 From '21 to '22 From '22 to '23 % Change: TK-5 Annual Change: 9.0% 8.3% 5.8% 10.1% 10.6% 6.0% 4.3% 3.7% 2.9% 0.3% 6-8 Annual Change: 12.0% 7.5% 5.3% 12.1% 10.3% 9.4% 3.8% 5.6% 3.8% 6.3% 9-12 Annual Change: 6.3% 8.3% 8.4% 11.7% 10.3% 6.3% 7.8% 6.5% 8.3% 5.3% TK-12 Annual Change: 9.1% 8.1% 6.3% 10.9% 10.4% 6.9% 5.1% 4.8% 4.5% 3.1% The above projections are based upon a student data files provided to DDP by the Dublin Unified School District representing early October From '13 to '14 From '14 to '15 From '15 to '16 From '16 to '17 From '17 to '18 From '18 to '19 From '19 to '20 From '20 to '21 From '21 to '22 From '22to '223 TK-5 Annual Change: Annual Change: Annual Change: TK-12 Annual Change: , , February 10, 2017 Page 22 Prepared by Davis Demographics and Planning, Inc.


29 Page 23
30 District Wide Projection Trends As of Fall 2016, the total student enrollment stood at 10,615 TK-12 students. This includes special education and out-of-district students. The overall district-wide projections indicate that the District s student enrollment could significantly increase within the next seven years by a total of about 6,463 TK-12 students (a 60.9% increase) and lead to a total enrollment of 17,078 students by The largest increase in TK-12 student population could be seen by Fall of 2017 when it is expected for the District to grow by 1,303 TK-12 students. The driving factor behind the significant growth for Fall 2017 is the amount of planned residential units that are scheduled to be built within that time frame. A total of 1,232 residential units are scheduled during the 2017/2018 school year. This represents one of the largest amount to residential development that is scheduled to be built for any given school year within the next seven years. The large projected overall TK-12 increase over the next seven year time frame is due to the steady birthrates for each projected year, the high number of housing re-sales represented through the mobility factors and the significant amount of residential units that are scheduled to be built within the next seven years. The TK-12 projections indicate an overall increase in enrollment over the next seven years within the elementary, middle and high school grade levels. The anticipated construction of an average of 607 new residential units a year through 2023 is a good indicator of why this increase in enrollment might occur. Aside from the new residential development that is expected, the mobility factors indicate that the District is maintaining its excellent retention rates as student classes graduate through from grade to grade and parents are choosing to move into the District through housing resales because they want to have their children attend Dublin USD schools, especially at the District s elementary and middle schools. The mobility factors are showing that the District is gaining many students as each class graduates from one grade to another, especially at the K-8 level. At the elementary grade levels (TK-5), there is an expected overall increase in enrollment of about 2,755 students by Fall of 2023 (a 48.3% increase). The middle school grade levels are expected to experience the second largest amount of growth when comparing it to the elementary and high school levels with a net increase of about 70.9% over the projection time frame which represents a total of 1, students over the next seven years. The resident high school population is expected to have the highest net increase over the next seven years. In Fall 2016, there were 2,522 high school students and there could be as many as 4,537 potential 9-12 students by the end of the projected time frame (SY ). This is an increase of around 2,015 more 9-12 students which amounts to a 79.9% net growth over the next seven years. This potential increase in high school enrollment is due to the significantly larger class size bubble that currently exists within the higher elementary grades. These larger class sizes will continue on through from grade to grade until they start to reach the high school grades in about 3-4 years. Page 24
31 Elementary Attendance Areas with Resident K-5 Projections Dublin ES Area Current Resident K-5 Fall Projected K-5 Fall ,053 Projected K-5 Fall ,126 Projected K-5 Fall ,163 Projected K-5 Murray ES Area Current Resident K-5 Fall Projected K-5 Fall Projected K-5 Fall Projected K-5 Fall Projected K-5 Frederiksen ES Area Current Resident K-5 Fall ,001 Projected K-5 Fall ,356 Projected K-5 Fall ,661 Projected K-5 Fall ,759 Projected K-5 Dougherty ES Area Current Resident K-5 Fall Projected K-5 Fall Projected K-5 Fall Projected K-5 Fall Projected K-5 Green ES Area Current Resident K-5 Fall Projected K-5 Fall Projected K-5 Fall Projected K-5 Fall Projected K-5 Amador ES Area Current Resident K-5 Fall ,096 Projected K-5 Fall ,464 Projected K-5 Fall ,513 Projected K-5 Kolb ES Area Fall ,515 Projected K-5 Current Resident K-5 Fall ,073 Projected K-5 Fall ,315 Projected K-5 Fall ,441 Projected K-5 Fall ,474 Projected K-5 Map Prepared by ± Elementary Schools Amador ES Dougherty ES Dublin ES Frederiksen ES Green ES Kolb ES Murray ES February 23, Miles Page 25
32 Projected Grade K-5 Student Population Changes from Fall 2016 to Fall Map Prepared by February 23, 2017 ± Residential K-5 Student Change ( ) No Change Miles
33 SECTION FIVE ELEMENTARY ATTENDANCE AREA PROJECTIONS BY RESIDENCE Attendance Area Amador ES Projection Date 10/5/2016 K K TK 0.0 Attending (19 Residing TK students) SpEd 33.0 Attending OD 3.0 Attending Attendance Area Dougherty ES Projection Date 10/5/2016 K K TK 53.0 Attending (28 Residing TK students) SpEd 0.0 Attending OD 9.0 Attending Attendance Area Dublin ES Projection Date 10/5/2016 K K TK 48.0 Attending (38 Residing TK students) SpEd 6.0 Attending OD 14.0 Attending The above projections exclude all TK /Transitional Kindergarten (TK), Special Education (SpEd) and Out-of-District (OD)students. The TK, SpEd and OD students that attended the school in Fall is listed below the Current 2016 column for each school. Please see the Elementary School Attendance Matrix for a breakdown of the Open Enrollment patterns for each school. Page 27
34 SECTION FIVE ELEMENTARY ATTENDANCE AREA PROJECTIONS BY RESIDENCE Attendance Area Frederiksen ES Projection Date 10/5/2016 K K TK 26.0 Attending (38 Residing TK students) SpEd 0.0 Attending OD 13.0 Attending Attendance Area Green ES Projection Date 10/5/2016 K K TK 0.0 Attending (17 Residing TK students) SpEd 21.0 Attending OD 19.0 Attending Attendance Area Kolb ES Projection Date 10/5/2016 K K TK 0.0 Attending (22 Residing TK students) SpEd 0.0 Attending OD 9.0 Attending The above projections exclude all TK /Transitional Kindergarten (TK), Special Education (SpEd) and Out-of-District (OD)students. The TK, SpEd and OD students that attended the school in Fall is listed below the Current 2016 column for each school. Please see the Elementary School Attendance Matrix for a breakdown of the Open Enrollment patterns for each school. Page 28
35 SECTION FIVE ELEMENTARY ATTENDANCE AREA PROJECTIONS BY RESIDENCE Attendance Area Murray ES Projection Date 10/5/2016 K K TK 53.0 Attending (17 Residing TK students) SpEd 40.0 Attending OD 39.0 Attending The above projections exclude all TK /Transitional Kindergarten (TK), Special Education (SpEd) and Out-of-District (OD)students. The TK, SpEd and OD students that attended the school in Fall is listed below the Current 2016 column for each school. Please see the Elementary School Attendance Matrix for a breakdown of the Open Enrollment patterns for each school. Page 29
36 Elementary Attendance Area Student Population Projections The Dublin Unified School District is composed of seven elementary schools, all currently serving TK-5 grade levels. As of Fall 2016, there were 5,707 TK-5 students enrolled in the District. There was a net increase of 331 TK-5 students when comparing it to the Fall 2015 total enrollment of 5,376 TK-5 students and a similar trend is expected to occur within the elementary grade levels over the next four years. A total of about 8,462 elementary grade students could be enrolled in the District by 2023, which is a projected increase of about 2,755 students (a net increase of 48.3% of the TK-5 population). Much of this growth is due to the fact that the District continues to experience higher than normal elementary grade mobility rates (this accounts for high housing resale rates bringing in many new families). Additionally, there is a significant amount of development that is due to be constructed within the next seven years. This fall s kindergarten population experienced a growth of 66 regular resident students which is about 7% growth when compared to the Fall 2015 s figure. This growth in kindergarten class sizes is expected to continue through Fall 2019 as a result of the higher birth rates for that time period. The easternmost elementary attendance areas of the District are expected to grow more significantly in TK-5 resident student population than those in the west. The projected growth in these areas is largely due to the new residential development that is scheduled to occur within the projection time frame. Frederiksen is the elementary attendance area which is projected to have the largest growth in TK-5 student population within the next seven years. There were 876 TK-5 students living within its boundary as of Fall It is projected that the school s resident TK-5 student population will double by Fall of 2023 with a student population of 1,759 students. This represents a net growth of 883 TK-5 students or a 100.8% net growth over the next seven years. Much of this growth can be attributed to the significant amount of residential development that is scheduled to be built within the projected time frame. A total of 1,681 residential units are scheduled to be built within the next seven years. Most of these scheduled residential units are part of the Boulevard which is the single largest planned unit development project within the District. This represents the largest amount of units projected to be built within a single attendance area. With a current enrollment of 844 students and an actual facility capacity of 800 students, the District will need to address how it is going to house Frederiksen s projected resident student population. This may be addressed by the opening of a new K-5 or K-8 school near or within Frederiksen s attendance area boundary. Over the next seven years, this new ES site is absolutely needed if and when the Boulevard project is fully built-out. The District will need to closely monitor the progress of the Boulevard units and needs to determine exactly the right time to plan for when this new site should open. The Amador attendance area is projected to have the second largest population growth over the next seven years. Most of the existing housing stock within the Amador ES attendance area was built within the last five years. As of Fall 2016, there were a total of 874 TK-5 students living within this attendance area. A net growth of 641 TK-5 students (73.3% net growth) is projected over the next seven years resulting in a total of 1,515 TK-5 students by Fall In Amador s current area, there is still a significant amount of residential development units that have yet to get built and some vacant land that could be constructed beyond Most of this potential residential development is scheduled to be built within the next seven years. A total of 1,536 residential units are scheduled to get built by With an actual enrollment of 873 TK-5 students and school capacity of 974, Amador Elementary still has some room to absorb some of the potential elementary resident population growth. A new K-8 school site in the Jordan Ranch area is scheduled to open in time for the school year and should help absorb the majority of the projected resident population growth within the current Amador attendance area; boundary adjustments will be necessary. Page 30
37 With a projected net of growth of about 67.1%, the Kolb ES attendance area is expected to have the third largest growth at the TK-5 level by Fall In Fall 2016, Kolb ES had 882 TK-5 students living within its attendance area. Kolb ES is projected to grow by 592 TK-5 students resulting with a total student population of 1,474 by Fall of Like the previously mentioned elementary areas, most of the projected growth with the Kolb attendance area is due to the residential development that is scheduled to be constructed within the next seven years. A total of 523 residential units are scheduled to be built in its area through Fall of There were a total of 872 enrolled at Kolb Elementary as of Fall An actual school capacity of 891 does not leave much room for Kolb Elementary to absorb the projected TK-5 student growth within this attendance area. The District will need to address how it plans to house the additional incoming TK-5 resident students over the next seven years. Most likely, a portion of the Kolb area should be assigned to the new K-8 site scheduled to open in the Jordan Ranch area in As of Fall 2016, Dublin ES had a total resident TK-5 student population of 811. It is projected that this attendance area could have a total of 1,163 TK-5 students by Fall This represents a potential net growth of 352 TK-5 students over the next seven years. A total of 489 residential units are scheduled to get built over the next seven years (mostly multi-family residences) which will help spur this resident student growth. For the most part, the Dublin ES attendance area is composed of well-established older neighborhoods. With a capacity of 1,102, Dublin Elementary should have very little issues housing the projected resident peak population within the next seven years. The addition of a few portables could help address the peak growth or re-directing some students to neighboring Murray ES should help house these additional Dublin ES students over the next seven years. The Murray ES attendance area is essentially built out and is mostly composed of older well established neighborhoods. The resident TK-5 student population is expected to remain stable with a slight projected net growth of about 29 TK-5 students over the next seven years which could result with a total student population around 328 TK-5 students by Fall There is no residential development scheduled to be constructed within this attendance area over the projection time frame. With a school capacity of 516, Murray Elementary should have no issues housing its projected student population and may be able to help out neighboring Dublin ES. Dougherty ES had 803 TK-5 students living within its attendance area as of Fall The projections indicate that the resident student population could experience a net growth of about 167 TK-5 students (20% growth) over the next seven years. This could result with a projected resident student population of about 970 TK-5 students by Fall With a school capacity of 912, Dougherty elementary is projected to be slightly over capacity (by about the size of two classrooms). The District may want to consider adding portables to the Dougherty ES site in order to address the projected growth when that time comes. Green elementary could also have some room to absorb the project growth within the Dougherty ES attendance area boundary. Green ES is the only attendance area that is projected to experience net decline over the next seven years. However, it is not a decline that is expected to have any significant impact on its resident student population. As of Fall 2016, there were 776 TK-5 students living within Green s attendance area. The TK-5 resident student population is projected to remain stable over the next seven years with a small decline of about 18 TK-5 students which could result with 758 TK-5 resident students by Fall Page 31
38 ELEMENTARY SCHOOL (TK-5) CONCLUSIONS With a total projected elementary student population of 8,462 by the Fall 2023 and a net growth of 2,755 TK-5 students, some of the existing elementary schools within the District will not be able to absorb the projected student growth. This shows the potential need of maybe three flexible K-8 sites within the District over the next seven years. It is recommended that these sites be built within the eastern or central portion of the District where most of the resident student growth is expected to occur. There is already a K-8 site planned to open in the Jordan Ranch area next year. Therefore, the District should start to explore their options on a second and third flexible site that could help house the projected elementary students and temporarily help out the future middle school growth as well. Page 32

39 Middle School Attendance Areas with Resident 6-8 Projections Fallon MS Area Wells MS Area Current Resident 6-8 Fall Projected 6-8 Fall ,175 Projected 6-8 Fall ,397 Projected 6-8 Fall ,633 Projected 6-8 Current - 1,438 Resident 6-8 Fall ,668 Projected 6-8 Fall ,049 Projected 6-8 Fall ,159 Projected 6-8 Fall ,318 Projected 6-8 Map Prepared by ± Middle Schools Fallon MS Wells MS February 23, Miles Page 33
Mead School District 354 Mead, WA
 Mead, WA 10-Year Student Population Projections By Residence Fall 2017-2026 (Based on Fall 2016 Data) Prepared by 11850 Pierce Street, Suite 200 Riverside, California 92505 Phone: (888)-337-4471 Fax: (951)
WORTHINGTON SCHOOLS ENROLLMENT PROJECTIONS REPORT FEBRUARY 14, 2018
 FEBRUARY 14, 2018 PREPARED FOR: Worthington Schools 200 E. Wilson Bridge Rd. Worthington, OH 43085 T 614.450.6000 PREPARED BY: Cooperative Strategies 3325 Hilliard Rome Road Hilliard, OH 43026 T 614.798.8828
WORTHINGTON SCHOOLS ENROLLMENT PROJECTIONS REPORT JANUARY 25, 2019
 JANUARY 25, 2019 PREPARED FOR: Worthington Schools 200 E. Wilson Bridge Rd. Worthington, OH 43085 T 614.450.6000 PREPARED BY: Cooperative Strategies 3325 Hilliard Rome Road Hilliard, OH 43026 T 614.798.8828
GREENE COUNTY SCHOOLS ENROLLMENT PROJECTIONS REPORT APRIL 12, 2017
 APRIL 12, 2017 PREPARED FOR: Greene County Schools 910 West Summer Street Greeneville, TN 37743 T 423-639-4194 PREPARED BY: Cooperative Strategies 3325 Hilliard Rome Road Hilliard, OH 43026 T 614.798.8828
DRAFT. Enrollment Projections Report. November 25, 2015
 November 25, 2015 3325 Hilliard Rome Road Hilliard, Ohio 43026 P: 614.798.8828 f: 614.798.8839 www.dejongrichter.com Table of Contents Acknowledgements... 1 Executive Summary... 3 Enrollment Projection
MAY 2014 ROCHESTER PUBLIC SCHOOLS ENROLLMENT ANALYSIS ROCHESTER PUBLIC SCHOOLS TEAMWORKS INTERNATIONAL
 ROCHESTER PUBLIC SCHOOLS ENROLLMENT ANALYSIS MAY 2014 ROCHESTER PUBLIC SCHOOLS TEAMWORKS INTERNATIONAL ROCHESTER PUBLIC SCHOOLS ROCHESTER, MN ENROLLMENT ANALYSIS 1 INTRODUCTION, METHODOLOGY & SUMMARY 7
Downtown Lee s Summit Parking Study
 Downtown Lee s Summit Parking Study As part of the Downtown Lee s Summit Master Plan, a downtown parking and traffic study was completed by TranSystems Corporation in November 2003. The parking analysis
School Districts of Randolph County, IN Demographic Study
 School Districts of Randolph County, IN Demographic Study November 15, 2017 McKibben Demographic Research Jerome McKibben, Ph.D. Rock Hill, SC j.mckibben@mckibbendemographics.com 978-501-7069 Assumptions
Denver Car Share Program 2017 Program Summary
 Denver Car Share Program 2017 Program Summary Prepared for: Prepared by: Project Manager: Malinda Reese, PE Apex Design Reference No. P170271, Task Order #3 January 2018 Table of Contents 1. Introduction...
May ATR Monthly Report
 May ATR Monthly Report Minnesota Department of Transportation Office of Transportation Data and Analysis May 2011 Introduction The purpose of this report is to examine monthly traffic trends on Minnesota
Demographic Study. Boyd Independent School District. Fall Learn from Yesterday Understand Today Plan for Tomorrow
 Boyd Independent School District Demographic Study Fall 2017 Learn from Yesterday Understand Today Plan for Tomorrow Economic Conditions DFW Area (September 2017) 2.8% 99,800 new jobs National rate 1.2%
SOCIO-ECONOMIC and LAND USE DATA
 SOCIO-ECONOMIC and LAND USE DATA FUTURE CONDITIONS January CHATHAM URBAN TRANSPORTATION STUDY - 1 - Table of Contents Introduction 3 TAZ - Municipality - Map Index...8 2005 Socio-economic and Land Use
Table of Contents INTRODUCTION... 3 PROJECT STUDY AREA Figure 1 Vicinity Map Study Area... 4 EXISTING CONDITIONS... 5 TRAFFIC OPERATIONS...
 Crosshaven Drive Corridor Study City of Vestavia Hills, Alabama Table of Contents INTRODUCTION... 3 PROJECT STUDY AREA... 3 Figure 1 Vicinity Map Study Area... 4 EXISTING CONDITIONS... 5 TRAFFIC OPERATIONS...
2010 Motorcycle Risk Study Update
 2010 Motorcycle Risk Study Update Introduction This report provides an update to the Motorcycle Risk Study from AI.16 of the 2005 Rate Application. The original study was in response to Public Utilities
August ATR Monthly Report
 August ATR Monthly Report Minnesota Department of Transportation Office of Transportation Data and Analysis August 2011 Introduction The purpose of this report is to examine monthly traffic trends on
Greenwich Public Schools Enrollment Projections. Enrollment Information
 Greenwich Public Schools Enrollment Projections RISE Committee Presentation March 13, 2007 Enrollment Information Ten Year District Enrollment Projection Five Year Enrollment Projection by School Migration
DRAFT. Enrollment Projections Report. February 12, 2016
 February 12, 2016 3325 Hilliard Rome Road Hilliard, Ohio 43026 P: 614.798.8828 f: 614.798.8839 www.dejongrichter.com Table of Contents Acknowledgements... 2 Executive Summary... 3 Enrollment Projection
increase of over four per cent compared to the average of $409,058 reported in January 2010.
 SINGLE FAMILY RESIDENTIAL BREAKDOWN uary 211 26.8 % 1.7 % 7.%.4%.1 % Good Start to 211 TORONTO - February 4, 211 Greater Toronto REALTORS reported 4,337 transactions through the TorontoMLS system in uary
Price Category Breakdown - February 2010
 SINGLE FAMILY RESIDENTIAL BREAKDOWN ruary 21 ruary Sales and Average Price Increase Annually TORONTO - Wednesday, March 3, 21 7.3 % 24.6 % 1.8 % 7.3%.2%.1 % Greater Toronto REALTORS reported 7,291 sales
National Household Travel Survey Add-On Use in the Des Moines, Iowa, Metropolitan Area
 National Household Travel Survey Add-On Use in the Des Moines, Iowa, Metropolitan Area Presentation to the Transportation Research Board s National Household Travel Survey Conference: Data for Understanding
Transportation Statistical Data Development Report BAY COUNTY 2035 LONG RANGE TRANSPORTATION PLAN
 Transportation Statistical Data Development Report BAY COUNTY 2035 LONG RANGE TRANSPORTATION PLAN Prepared for Bay County Transportation Planning Organization and The Florida Department of Transportation,
Merger of the generator interconnection processes of Valley Electric and the ISO;
 California Independent System Operator Corporation Memorandum To: ISO Board of Governors From: Karen Edson Vice President, Policy & Client Services Date: August 18, 2011 Re: Decision on Valley Electric
Executive Summary. Light-Duty Automotive Technology and Fuel Economy Trends: 1975 through EPA420-S and Air Quality July 2006
 Office of Transportation EPA420-S-06-003 and Air Quality July 2006 Light-Duty Automotive Technology and Fuel Economy Trends: 1975 through 2006 Executive Summary EPA420-S-06-003 July 2006 Light-Duty Automotive
Prepared: November 2010
 Page Introduction 3 Graph: Enrollment Summary 4 Classroom Capacities and Enrollments 5 Enrollment History and Forecast Summary 6 Graph: Five Year Enrollment Forecast 7 Graph: Census vs. Enrollment 8 Summary
Benefits of greener trucks and buses
 Rolling Smokestacks: Cleaning Up America s Trucks and Buses 31 C H A P T E R 4 Benefits of greener trucks and buses The truck market today is extremely diverse, ranging from garbage trucks that may travel
WHITE PAPER. Preventing Collisions and Reducing Fleet Costs While Using the Zendrive Dashboard
 WHITE PAPER Preventing Collisions and Reducing Fleet Costs While Using the Zendrive Dashboard August 2017 Introduction The term accident, even in a collision sense, often has the connotation of being an
A Guide to the medium General Service. BC Hydro Last Updated: February 24, 2012
 A Guide to the medium General Service Conservation Rate BC Hydro Last Updated: February 24, 2012 Executive summary The way Medium General Service (MGS) accounts pay for electricity is changing. MGS is
Jarrell Independent School District
 Jarrell Independent School District Demographic Study January 22 nd, 2014 Learn from Yesterday Understand Today Plan for Tomorrow Economic Conditions From 2000 to 2013, Texas outperformed the U.S. job
TABLE OF CONTENTS EXECUTIVE SUMMARY...1 INTRODUCTION...3 PROJECTED FUTURE GROWTH...3 ROADWAY IMPROVEMENT PROJECTS...4 POTENTIAL FUNDING SOURCES...
 Transportation Impact Fee Study September 2014 TABLE OF CONTENTS EXECUTIVE SUMMARY...1 INTRODUCTION...3 PROJECTED FUTURE GROWTH...3 ROADWAY IMPROVEMENT PROJECTS......4 POTENTIAL FUNDING SOURCES...7 PROPOSED
Portland Public Schools Enrollment Forecasts, to : Based on October 2016 Enrollments
 Portland State University PDXScholar School District Enrollment Forecast Reports Population Research Center 11-2017 Portland Public Schools Enrollment Forecasts, 2017-18 to 2031-32: Based on October 2016
The proposed Escondido Village Graduate Student Housing project would include the following features:
 LAND BUILDINGS & REAL ESTATE Parking & Transportation Services TITLE: Proposed Escondido Village Graduate Residences Parking Analysis (Revised 2/23/16) FROM: Brian D. Shaw, Director, Parking & Transportation
APPENDIX B Traffic Analysis
 APPENDIX B Traffic Analysis Rim of the World Unified School District Reconfiguration Prepared for: Rim of the World School District 27315 North Bay Road, Blue Jay, CA 92317 Prepared by: 400 Oceangate,
Missouri Seat Belt Usage Survey for 2017
 Missouri Seat Belt Usage Survey for 2017 Conducted for the Highway Safety & Traffic Division of the Missouri Department of Transportation by The Missouri Safety Center University of Central Missouri Final
Demographic Report. Jarrell Independent School District. Spring Learn from Yesterday Understand Today Plan for Tomorrow
 Jarrell Independent School District Demographic Report Spring 2018 Learn from Yesterday Understand Today Plan for Tomorrow Economic Conditions Austin Area (December 2017) 3.2% 34,950 new jobs National
2018 AER Social Research Report
 2018 AER Social Research Report Executive Summary June 2018 2018 AER Social Research Report Executive Summary June 2018 Published by Alberta Energy Regulator Suite 1000, 250 5 Street SW Calgary, Alberta
Prepared: November 2011 (revised)
") Page Introduction 3 Graph: Enrollment Summary 4 Classroom Capacities and Enrollments 5 Enrollment History and Forecast Summary 6 Graph: Five Year Enrollment Forecast 7 Graph: Census vs. Enrollment 8 Summary
Page Introduction 3 Graph: Enrollment Summary 4 Classroom Capacities and Enrollments 5 Enrollment History and Forecast Summary 6 Graph: Five Year Enrollment Forecast 7 Graph: Census vs. Enrollment 8 Summary
Rates of Motor Vehicle Crashes, Injuries, and Deaths in Relation to Driver Age, United States,
 RESEARCH BRIEF This Research Brief provides updated statistics on rates of crashes, injuries and death per mile driven in relation to driver age based on the most recent data available, from 2014-2015.
Parks and Transportation System Development Charge Methodology
 City of Sandy Parks and Transportation System Development Charge Methodology March, 2016 Background In order to implement a City Council goal the City of Sandy engaged FCS Group in January of 2015 to update
American Driving Survey,
 RESEARCH BRIEF American Driving Survey, 2015 2016 This Research Brief provides highlights from the AAA Foundation for Traffic Safety s 2016 American Driving Survey, which quantifies the daily driving patterns
Open House. Highway212. Meetings. Corridor Access Management, Safety & Phasing Plan. 5:30 to 6:30 p.m. - Southwest Corridor Transportation Coalition
 Welcome Meetings 5:30 to 6:30 p.m. - Southwest Corridor Transportation Coalition 6:30 to 8:00 p.m. - Open House Why is Highway 212 Project Important? Important Arterial Route Local Support Highway 212
Major Widening/New Roadway
 Revised Evaluation s Major Widening/New Roadway This page provides a summary of any revisions made to the draft scores presented at the October th Attributable Funds Committee meeting. The information
6/6/2018. June 7, Item #1 CITIZENS PARTICIPATION
 June 7, 2018 Item #1 CITIZENS PARTICIPATION 1 Item #2 APPROVAL OF MINUTES Item #3 TRAC GOALS, FRAMEWORK & AGENDA REVIEW 2 COMMITTEE GOALS Learn about Southern Nevada s mobility challenges, new developments
Office of Transportation Bureau of Traffic Management Downtown Parking Meter District Rate Report
 Office of Transportation Bureau of Traffic Management 1997 Downtown Parking Meter District Rate Report Introduction The City operates approximately 5,600 parking meters in the core area of downtown. 1
Liberty Hill ISD. District Housing Activity Report 3rd Quarter, 2012
 Liberty Hill ISD District Housing Activity Report 3rd Quarter, 2012 GREATER AUSTIN NEW HOME CONSTRUCTION STARTS, CLOSINGS, & LOT DELIVERIES 19000 18000 17000 16000 Year-Over-Year Change Annual Starts +28%
MINERVA PARK SITE TRAFFIC IMPACT STUDY M/I HOMES. September 2, 2015
 5500 New Albany Road Columbus, Ohio 43054 Phone: 614.775.4500 Fax: 614.775.4800 Toll Free: 1-888-775-EMHT emht.com 2015-1008 MINERVA PARK SITE TRAFFIC IMPACT STUDY M/I HOMES September 2, 2015 Engineers
ENVIRONMENTAL SETTING
 II. ENVIRONMENTAL SETTING A. OVERVIEW OF ENVIRONMENTAL SETTING This section provides a brief overview of the project site s regional and local setting. Additional descriptions of the environmental setting
ITSMR Research Note. Recidivism in New York State: A Status Report ABSTRACT INTRODUCTION KEY FINDINGS RECIDIVISM RATES
 January 2017 KEY FINDINGS RECIDIVISM RATES The recidivism rate was 20% in down from 21% in, 22% in and down substantially from 29% in. In, the highest rate of recidivism occurred among drivers convicted
Parking Management Element
 Parking Management Element The State Transportation Planning Rule, adopted in 1991, requires that the Metropolitan Planning Organization (MPO) area implement, through its member jurisdictions, a parking
Caution and Disclaimer The contents of these materials are for information purposes and are provided as is without representation or warranty of any
 Draft Version 1 Caution and Disclaimer The contents of these materials are for information purposes and are provided as is without representation or warranty of any kind, including without limitation,
Project Scoping Report Appendix B Project Web Site. APPENDIX B Project Web Site
 Project Scoping Report Appendix B Project Web Site APPENDIX B Project Web Site WESTSIDE EXTENSION TRANSIT CORRIDOR STUDY February 4, 2008 News and Info of 1 http://metro.net/projects_programs/westside/news_info.htm#topofpage
UC Santa Cruz TAPS 3-Year Fee & Fare Proposal, through
 UC Santa Cruz TAPS 3-Year Fee & Fare Proposal, 2016-17 through 2018-19 Introduction Transportation and Parking Services (TAPS) proposes a three-year series of annual increases to most Parking fees and
Recommended Vision for the Downtown Rapid Transit Network
 Recommended Vision for the Downtown Rapid Transit Network April 2008 Presentation Overview Context Transit options Assessment of options Recommended network Building the network 2 1 Rapid Our Vision Reliable
Green Line LRT: Beltline Segment Update April 19, 2017
 Green Line LRT: Beltline Segment Update April 19, 2017 Quick Facts On April 11, 2017, City Council approved Administration s recommendation for the Green Line to be underground in the Beltline from 2 Street
LONG RANGE PERFORMANCE REPORT. Study Objectives: 1. To determine annually an index of statewide turkey populations and production success in Georgia.
 State: Georgia Grant Number: 08-953 Study Number: 6 LONG RANGE PERFORMANCE REPORT Grant Title: State Funded Wildlife Survey Period Covered: July 1, 2010 - June 30, 2011 Study Title: Wild Turkey Production
Decision on Merced Irrigation District Transition Agreement
 California Independent System Operator Corporation Memorandum To: ISO Board of Governors From: Karen Edson, Vice President Policy & Client Services Date: March 13, 2013 Re: Decision on Merced Irrigation
REPORT CARD FOR CALIFORNIA S INFRASTRUCTURE WHAT YOU SHOULD KNOW ABOUT CALIFORNIA S TRANSIT FACILITIES
 TRANSIT GRADE: C- WHAT YOU SHOULD KNOW ABOUT TRANSIT FACILITIES California needs robust, flexible and reliable transit systems to reduce peak congestion on our highways, provide options for citizens who
MONTHLY NEW RESIDENTIAL CONSTRUCTION, FEBRUARY 2017
 FOR RELEASE AT 8:30 AM EDT, THURSDAY, MARCH 16, MONTHLY NEW RESIDENTIAL CONSTRUCTION, FEBRUARY Release Number: CB17-38 March 16, - The U.S. Census Bureau and the U.S. Department of Housing and Urban Development
Taxis and Accessible Services Division Medallion Reform Background May 1, 2018
 Introduction: Taxis and Accessible Services Division Medallion Reform Background May 1, 2018 SFMTA s Taxis and Accessible Services Division is responsible for the regulation of the private businesses that
The Funding of Pupil Transportation In North Carolina March, 2001
 The Funding of Pupil Transportation In North Carolina March, 2001 North Carolina Department of Public Instruction Division of School Support, Transportation Services Three main components of pupil transportation
HAS MOTORIZATION IN THE U.S. PEAKED? PART 2: USE OF LIGHT-DUTY VEHICLES
 UMTRI-2013-20 JULY 2013 HAS MOTORIZATION IN THE U.S. PEAKED? PART 2: USE OF LIGHT-DUTY VEHICLES MICHAEL SIVAK HAS MOTORIZATION IN THE U.S. PEAKED? PART 2: USE OF LIGHT-DUTY VEHICLES Michael Sivak The University
Appendix J Traffic Impact Study
 MRI May 2012 Appendix J Traffic Impact Study Level 2 Traffic Assessment Limited Impact Review Appendix J [This page was left blank intentionally.] www.sgm-inc.com Figure 1. Site Driveway and Trail Crossing
Sound Transit Operations July 2016 Service Performance Report. Ridership
 Ridership Total Boardings by Mode Mode Jul-15 Jul-16 % YTD-15 YTD-16 % ST Express 1,618,779 1,545,852-4.5% 10,803,486 10,774,063-0.3% Sounder 333,000 323,233-2.9% 2,176,914 2,423,058 11.3% Tacoma Link
4 COSTS AND OPERATIONS
 4 COSTS AND OPERATIONS 4.1 INTRODUCTION This chapter summarizes the estimated capital and operations and maintenance (O&M) costs for the Modal and High-Speed Train (HST) Alternatives evaluated in this
CITY OF VANCOUVER ADMINISTRATIVE REPORT
 Supports Item No. 1 T&T Committee Agenda May 13, 2008 CITY OF VANCOUVER ADMINISTRATIVE REPORT Report Date: April 29, 2008 Author: Don Klimchuk Phone No.: 604.873.7345 RTS No.: 07283 VanRIMS No.: 13-1400-10
Figure 1 Unleaded Gasoline Prices
 Policy Issues Just How Costly Is Gas? Summer 26 Introduction. Across the nation, the price at the pump has reached record highs. From unleaded to premium grade, prices have broken three dollars per gallon
Forecast Allocation Methodology. Kitsap 10-Year Update Kitsap County August 2006; Updated November 2006
 Appendix D Methods Forecast Allocation Methodology Kitsap 10-Year Update Kitsap County August 2006; Updated November 2006 Employment and Population Forecast Allocation Methodology Prepared for: Kitsap
Residential Electric Customer Usage Analysis: City of Gastonia, NC. Jennifer Weiss Yijing Cheng
 Residential Electric Customer Usage Analysis: City of Gastonia, NC Jennifer Weiss Yijing Cheng July 2014 Residential Electric Customer Usage and Expenditure Analysis About the Environmental Finance Center
Copyright Australian Hearing Demographic Details
 1 Demographic Details Of young Australians aged less than 26 years with a hearing loss, who have been fitted with a hearing aid or cochlear implant at 31 December 2016 2 Summary: This circular contains
Energy Technical Memorandum
 Southeast Extension Project Lincoln Station to RidgeGate Parkway Prepared for: Federal Transit Administration Prepared by: Denver Regional Transportation District May 2014 Table of Contents Page No. Chapter
IRSCH REEN Hirsch/Green Transportation Consulting, Inc.
 IRSCH REEN Hirsch/Green Transportation Consulting, Inc. February 6, 2013 Mr. David Weil Director of Finance St. Matthew s Parish School 1031 Bienveneda Avenue Pacific Palisades, California 90272 RE: Trip
2015 Carbon footprint JTP. Date of issue: 14 th March 2016
 2015 Carbon footprint JTP Prepared by: Helen Troup Reviewed by: Sarah McCusker Date of issue: 14 th March 2016 Executive summary Carbon Smart 2 Executive summary JTP have seen significant reduction in
Expansion Projects Description
 Expansion Projects Description The Turnpike expansion program was authorized by the Florida Legislature in 1990 to meet the State s backlog of needed highway facilities. The Legislature set environmental
Bedford/Franklin Regional Rail Initiative (BFRRI) Rationale for a Bedford Amtrak Station June 30, 2015
 Rationale for a Bedford Amtrak Station June 30, 2015") Bedford/Franklin Regional Rail Initiative (BFRRI) Rationale for a Bedford Amtrak Station June 30, 2015 SUBJECT: Bedford Amtrak Station Why an Amtrak station in Bedford makes sense. I. BACKGROUND: In January
Bedford/Franklin Regional Rail Initiative (BFRRI) Rationale for a Bedford Amtrak Station June 30, 2015 SUBJECT: Bedford Amtrak Station Why an Amtrak station in Bedford makes sense. I. BACKGROUND: In January
Key Findings. February 2009 Caltrain Annual Passenger Counts
 Key Findings February 2009 Caltrain Annual Passenger Counts The 2009 annual Caltrain passenger counts, which were conducted starting in late-january and were complete by mid-february, followed the same
TORONTO TRANSIT COMMISSION REPORT NO.
 Form Revised: February 2005 TORONTO TRANSIT COMMISSION REPORT NO. MEETING DATE: September 27, 2012 SUBJECT: NOTICE OF AWARD PROCUREMENT AUTHORIZATION - ARTICULATED BUSES INFORMATION ITEM RECOMMENDATION
DRP DER Growth Scenarios Workshop. DER Forecasts for Distribution Planning- Electric Vehicles. May 3, 2017
 DRP DER Growth Scenarios Workshop DER Forecasts for Distribution Planning- Electric Vehicles May 3, 2017 Presentation Outline Each IOU: 1. System Level (Service Area) Forecast 2. Disaggregation Approach
Green Line Long-Term Investments
 Enhancements Short-term improvements to keep Austin moving. Investments Long-term projects to support our future. Mobility Hubs MetroRapid MetroRail MetroExpress Connectors Circulators Project Connect
Passenger seat belt use in Durham Region
 Facts on Passenger seat belt use in Durham Region June 2017 Highlights In 2013/2014, 85 per cent of Durham Region residents 12 and older always wore their seat belt when riding as a passenger in a car,
FasTracks News. RTD s Eagle P3 Transit Project Nears Halfway Mark to Opening Day EP3 will add three commuter rail lines to metro area in 2016
 July 29, 2013 Welcome to Inside RTD FasTracks a monthly e- update to keep you informed about the progress of the Regional Transportation District's FasTracks program. FasTracks News RTD s Eagle P3 Transit
Table of Contents. 1.0 Introduction Demographic Characteristics Travel Behaviour Aggregate Trips 28
 Table of Contents 1.0 Introduction 1 1.1 Overview of the Household Travel Survey 1 1.2 Study Area 2 1.3 Scaling 5 1.4 Sample Accuracy 6 2.0 Demographic Characteristics 8 2.1 Population, Employment and
US 81 Bypass of Chickasha Environmental Assessment Public Meeting
 US 81 Bypass of Chickasha Environmental Assessment Public Meeting March 14, 2013 Introductions ODOT FHWA SAIC Meeting Purpose Present need for bypass Provide responses to 10/04/11 public meeting comments
Central City Line Locally Preferred Alternative (LPA) Amendment Public Hearing. July 24, 2014
 Amendment Public Hearing. July 24, 2014") Central City Line Locally Preferred Alternative (LPA) Amendment Public Hearing July 24, 2014 Project Description The Central City Line is a High Performance Transit project that will extend from Browne
Central City Line Locally Preferred Alternative (LPA) Amendment Public Hearing July 24, 2014 Project Description The Central City Line is a High Performance Transit project that will extend from Browne
MEETING GOVERNMENT MANDATES TO REDUCE FLEET SIZE
 H O W W I R E L E S S F L E E T M A N A G E M E N T C A N H E L P E X C E E D F L E E T O P T I M I Z AT I O N G O A L S Table of Contents 3 4 4 5 5 6 6 6 8 8 Overview Using Wireless Fleet Management to
D G A G R I D A S H B O A R D : A P P L E S
 75 79 60 56 49 74 65 59 54 42 76 63 58 53 78 55 42 43 79 44 81 63 47 83 64 59 53 48 Sources: Eurostat, MSs notifications, DG Agri, Comext, Comtrade, GTA, ITC, AMI, Expert groups, Freshfel, Wapa. 89 68
Future Funding The sustainability of current transport revenue tools model and report November 2014
 Future Funding The sustainability of current transport revenue tools model and report November 214 Ensuring our transport system helps New Zealand thrive Future Funding: The sustainability of current transport
SOUTHERN GATEWAY. Transportation and Trinity River Project Committee 11 May 2015
 SOUTHERN GATEWAY Transportation and Trinity River Project Committee 11 May 2015 Southern Gateway Project History Began in 2001 as a Major Investment Study [ MIS ], Schematic, and Environmental Assessment
State of the Industry: U.S. Classes 3-8 Used Trucks
 Americas Commercial Transportation Research Co., LLC www.actresearch.net State of the Industry: U.S. Classes 3-8 Used Trucks November 212 Data Published December 24, 212 State of the Industry: U.S. Classes
MONTHLY NEW RESIDENTIAL CONSTRUCTION, NOVEMBER 2017
 FOR RELEASE AT 8:30 AM EST, TUESDAY, DECEMBER 19, MONTHLY NEW RESIDENTIAL CONSTRUCTION, NOVEMBER Release Number: CB17-206 December 19, - The U.S. Census Bureau and the U.S. Department of Housing and Urban
MONTHLY NEW RESIDENTIAL CONSTRUCTION, JULY 2017
 FOR RELEASE AT 8:30 AM EDT, WEDNESDAY, AUGUST 16, MONTHLY NEW RESIDENTIAL CONSTRUCTION, JULY Release Number: CB17-133 August 16, - The U.S. Census Bureau and the U.S. Department of Housing and Urban Development
January Manufacturing Technology Orders Off After a Strong December
 Contact: Bonnie Gurney, AMT, 703-827-5277 bgurney@amtonline.org For Release: March 9, 2015 January Manufacturing Technology Orders Off After a Strong December January U.S. manufacturing technology orders
Prior Lake - Savage Area Schools Prior Lake, MN
 Prior Lake - Savage Area Schools Prior Lake, MN Elementary Boundary Change Options A-1 and B-1: March 12 th, 2019 Report created by TeamWorks International, Inc 7037 20th Avenue S. Centerville, MN 55038
Executive Summary. Draft Environmental Impact Statement/Environmental Impact Report ES-1
 Executive Summary Introduction The Eastside Transit Corridor Phase 2 Project is a vital public transit infrastructure investment that would provide a transit connection to the existing Metro Gold Line
Appendix B CTA Transit Data Supporting Documentation
 RED ED-PURPLE BYPASS PROJECT ENVIRONMENTAL ASSESSMENT AND SECTION 4(F) EVALUATION Appendix B CTA Transit Data Supporting Documentation 4( Memorandum Date: May 14, 2015 Subject: Chicago Transit Authority
NPCC Natural Gas Disruption Risk Assessment Background. Summer 2017
 Background Reliance on natural gas to produce electricity in Northeast Power Coordinating Council (NPCC) Region has been increasing since 2000. The disruption of natural gas pipeline transportation capability
Abstract. Executive Summary. Emily Rogers Jean Wang ORF 467 Final Report-Middlesex County
 Emily Rogers Jean Wang ORF 467 Final Report-Middlesex County Abstract The purpose of this investigation is to model the demand for an ataxi system in Middlesex County. Given transportation statistics for
MONTHLY NEW RESIDENTIAL CONSTRUCTION, APRIL 2017
 FOR RELEASE AT 8:30 AM EDT, TUESDAY, MAY 16, MONTHLY NEW RESIDENTIAL CONSTRUCTION, APRIL Release Number: CB17-75 May 16, - The U.S. Census Bureau and the U.S. Department of Housing and Urban Development
Modernising the Great Western railway
 Report by the Comptroller and Auditor General Department for Transport and Network Rail Modernising the Great Western railway HC 781 SESSION 2016-17 9 NOVEMBER 2016 4 Key facts Modernising the Great Western
MAP OR PHOTO. Public Meeting & Open House July 23, Project Roadway Limits From: FM 1957 To: FM 471. Counties Bexar & Medina
 Public Meeting & Open House July 23, 2013 Project Roadway Limits From: FM 1957 To: FM 471 MAP OR PHOTO Counties Bexar & Medina 1 I. Project History II. III. IV. Project Overview Project Alternatives Response
February 2012 Caltrain Annual Passenger Counts Key Findings
 February 2012 Caltrain Annual Passenger Counts Key Findings Key Findings February 2012 Caltrain Annual Passenger Counts The 2012 annual Caltrain passenger counts, which were conducted in February 2012,
DECEMBER 12, Parking Meter and Time Limit Preliminary Evaluation
 Parking Meter and Time Limit Preliminary Evaluation / PAGE 2 Executive Summary The following report evaluates the effects of new SFpark parking meters and extended time limits on meter revenue and parking