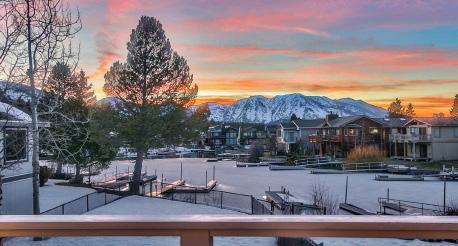
MICRO MARKET REPORT SOUTH LAKE TAHOE QUARTER TAHOEMICROREPORTS.COM
|
|
|
- Philomena Morris
- 5 years ago
- Views:
Transcription

1 MICRO MARKET REPORT SOUTH LAKE TAHOE QUARTER

2 SOUTH LAKE TAHOE NEIGHBORHOODS Tahoe Keys 2 Montgomery Estates 3 Cascade Properties 4 Pioneer Trail 5 Meyers 6 Y Area 7 Heavenly Valley 8 Stateline 9 Fallen Leaf Lake 10 Country Club Estates

3 Median Price $405,500 $479,500 18% SOUTH LAKE TAHOE overall sales Average List Price $490,775 $573,308 17% Average Sold Price $479,612 $556,914 16% Average Days on Market % Highest Sold Price $1,560,000 $1,595,000 2% Lowest Sold Price $212,000 $127,000-40% Properties Sold % % Sold Price to Average List Price 98% 97% -1% Total Dollar Volume Sold $72,901,025 $76,854,175 5% Properties Sold Over $1M % Properties Sold Under $1M %

4 Median Price $0 $975,000 $0 ALL LAKEFRONT single family Average Sold Price $0 $975,000 $0 Average Days on Market Highest Sold Price $0 $975,000 $0 Lowest Sold Price $0 $975,000 $0 Properties Sold % Sold Price to Average List Price 0% 98% 0% Total Dollar Volume Sold $0 $975,000 $0 ALL NON-LAKEFRONT single family Median Price $412,750 $475,000 15% Average Sold Price $496,623 $542,474 9% Average Days on Market % Highest Sold Price $1,560,000 $1,595,000 2% Lowest Sold Price $224,900 $187,000-17% Properties Sold % % Sold Price to Average List Price 98% 97% -1% Total Dollar Volume Sold $68,534,025 $69,979,175 2%

5 Median Price $300,000 $467,500 56% LAKEFRONT condos Average Sold Price $335,200 $456,750 36% Average Days on Market % Highest Sold Price $559,000 $567,000 1% Lowest Sold Price $230,000 $325,000 41% Properties Sold % % Sold Price to Average List Price 96% 96% 0% Total Dollar Volume Sold $1,676,000 $1,827,000 9% Median Price $360,000 $395,000 10% Average Sold Price $342,568 $573,324 67% NON-LAKEFRONT condos Average Days on Market % Highest Sold Price $840,000 $1,530,000 82% Lowest Sold Price $100,000 $127,000 27% Properties Sold % % Sold Price to Average List Price 96% 98% 3% Total Dollar Volume Sold $7,536,500 $9,746,500 29%

6 Median Price $691,000 $672,000-3% TAHOE KEYS single family Average Sold Price $774,222 $780,027 1% Average Days on Market % Highest Sold Price $1,500,000 $1,360,000-9% Lowest Sold Price $400,000 $450,000 13% Properties Sold % % Sold Price to Average List Price 98% 95% -3% Total Dollar Volume Sold $6,968,000 $10,920,375 57% Median Price $363,500 $453,000 25% Average Sold Price $371,500 $421,500 13% TAHOE KEYS condos Average Days on Market % Highest Sold Price $499,000 $530,000 6% Lowest Sold Price $260,000 $312,500 20% Properties Sold % % Sold Price to Average List Price 98% 97% 0% Total Dollar Volume Sold $1,486,000 $2,107,500 42%

7 SOUTH LAKE TAHOE CITY single family Median Price $389,500 $471,500 21% Average Sold Price $448,906 $535,544 19% Average Days on Market % Highest Sold Price $1,560,000 $1,360,000-13% Lowest Sold Price $224,900 $202,500-10% Properties Sold % % Sold Price to Average List Price 98% 96% -1% Total Dollar Volume Sold $32,321,225 $35,881,475 11% SOUTH LAKE TAHOE COUNTY single family Median Price $475,000 $533,000 12% Average Sold Price $550,997 $574,773 4% Average Days on Market % Highest Sold Price $1,349,000 $1,595,000 18% Lowest Sold Price $315,000 $206,000-35% Properties Sold % % Sold Price to Average List Price 98% 98% 0% Total Dollar Volume Sold $34,712,800 $29,888,200-14% SOUTH LAKE TAHOE CITY & COUNTY condo Median Price $384,500 $377,500-2% Average Sold Price $363,481 $522,114 44% Average Days on Market % Highest Sold Price $840,000 $1,530,000 82% Lowest Sold Price $100,000 $127,000 27% Properties Sold % % Sold Price to Average List Price 96% 98% 2% Total Dollar Volume Sold $9,450,500 $11,486,500 22%
8
9 W E A R E LOCAL EXPERTS Over 120 local real estate experts at 10 Sierra Sotheby s International Realty locations throughout the Lake Tahoe area. VILLAGE AT NORTHSTAR 4001 Northstar Drive #4105 Truckee, CA SQUAW VALLEY 1750 Village East Road #63B Olympic Valley, CA HEAVENLY / STATELINE 1001 Heavenly Village Way #36A South Lake Tahoe, CA INCLINE VILLAGE 570 Lakeshore Boulevard Incline Village, NV TAHOE DONNER Northwoods Boulevard Truckee, CA DOWNTOWN TRUCKEE Donner Pass Road Truckee, CA TAHOE CITY - GALLERY 695 North Lake Boulevard Tahoe City, CA TAHOE CITY - LAKESIDE 950 North Lake Boulevard Tahoe City, CA SOUTH LAKE TAHOE 2247 Lake Tahoe Boulevard South Lake Tahoe, CA THE SUMMIT AT RENO S. Virginia Street #606 Reno, NV 89511
10 WE ARE. THE VOICE OF TAHOE REAL ESTATE tahoemicroreports.com sierrasothebysrealty.com #tahoegoodlife INCLINE VILLAGE SOUTH LAKE TAHOE SQUAW VALLEY TAHOE CITY TAHOE DONNER DOWNTOWN TRUCKEE HEAVENLY VILLAGE/STATELINE NORTHSTAR THE SUMMIT, RENO CA BRE#
MICRO MARKET REPORT NORTH & WEST SHORE LAKE TAHOE QUARTER TAHOEMICROREPORTS.COM
 MICRO MARKET REPORT NORTH & WEST SHORE LAKE TAHOE QUARTER 2 2018 NORTH & WEST SHORE LAKE TAHOE NEIGHBORHOODS 1 3 4 2 1 North Shore - Lake Tahoe 2 West Shore - Lake Tahoe 3 Squaw Valley 4 Alpine Meadows
MICRO MARKET REPORT Q UA RT E R
 MICRO MARKET REPORT E AST S H O R E L A K E TA H O E Q UA RT E R 1 20 1 8 TA H O E M I C RO R E P O RTS.CO M EAST SHORE LAKE TAHOE NEIGHBORHOODS 5 4 3 2 6 1 1 Stateline 3 Skyland 5 Glenbrook 2 Zephyr Cove/Round
5. Meyers 6. Y Area 7. Heavenly Valley 8. Stateline
 MICROMARKET REPORT SOUTH LAKE TAHOE Year-End 2013 www.tahoemicroreports.com SOUTH LAKE TAHOE NEIGHBORHOODS 3 1 8 7 9 6 4 2 10 5 1. Tahoe Keys 2. Montgomery Estates 3. Cascade Properties 4. Pioneer Trail
MICROMARKET REPORT TRUCKEE. 6. Gray s Crossing 7. Old Greenwood 8. Lahontan 9. Martis Valley 10. Northstar
 MICROMARKET REPORT TRUCKEE Quarter 3 2013 www.tahoemicroreports.com TRUCKEE NEIGHBORHOODS 1 2 4 3 5 6 7 8 9 10 1. Sierra County 2. Donner Summit 3. Donner Lake 4. Tahoe Donner 5. Truckee 6. Gray s Crossing
MICROMARKET REPORT TRUCKEE. 6. Gray s Crossing 7. Old Greenwood 8. Lahontan 9. Martis Valley 10. Northstar
 MICROMARKET REPORT TRUCKEE Quarter 1 2013 www.tahoemicroreports.com TRUCKEE NEIGHBORHOODS 1 2 4 3 5 6 7 8 9 10 1. Sierra County 2. Donner Summit 3. Donner Lake 4. Tahoe Donner 5. Truckee 6. Gray s Crossing
MICROMARKET REPORT NORTH LAKE TAHOE
 year end 2011 www.tahoemicroreports.com NEIGHBORHOODS 4 6 3 2 1 5 1. 2. 3. 4. 5. 6. Alpine Meadows Resort at Squaw Creek Squaw Valley Tahoe Donner Houses Tahoe Lakefront Houses Village at Squaw Valley
NORTH & WEST SHORE LAKE TAHOE
 MICROMARKET REPORT Quarter 3 2013 www.tahoemicroreports.com NORTH AND WEST SHORE LAKE TAHOE NEIGHBORHOODS 1 2 3 4 1. Lake Tahoe - North Shore 2. Squaw Valley 3. Alpine Meadows 4. Lake Tahoe - West Shore
MICROMARKET REPORT NORTH & WEST SHORE LAKE TAHOE YEAR END 2015 WWW.
 MICROMARKET REPORT WWW. NORTH AND WEST SHORE LAKE TAHOE NEIGHBORHOODS 1. Lake Tahoe - North Shore 2. Squaw Valley 3. Alpine Meadows 4. Lake Tahoe - West Shore MARKET MARKETS BY AREA NORTH SHORE SINGLE
3rd Quarter Market Report 2018
 3rd Quarter Market Report Lake Tahoe Basin Single Family (Excluding lakefront) Lake Tahoe Basin Condo/Townhome (Excluding lakefront & lakefront condo project) Total Units Sold 234 224 4% Total Units Sold
Year End Market Report Yearly % Difference
 Market Report Lake Tahoe Basin Single Family (Excluding lakefront) Lake Tahoe Basin Condo/Townhome (Excluding lakefront & lakefront condo project) Total Units Sold 318 309 3% Total Units Sold 84 57 47%
Lake Tahoe Real Estate Report Quarter Two, 2013
 Lake Tahoe Real Estate Report Quarter Two, 2013 Quarter-two 2013 compared to Quarter-one, 2013 Y-O-Y comparison between quarter-two 2013 and quarter-two 2012 Notes and analysis for each region median sales
North Lake Tahoe - Truckee Region Real Estate Market Report 2018 Vs st Quarter YTD TOTAL SALES (January - March)
") TOTAL MARKET SUMMARY North Lake Tahoe and Truckee (Areas 1-9) Units Sold Sales Volume Median Sales Price Average Sales Price Units Sold Under $500,000 Units Sold - $500,000-$999,999 Units Sold Over $1,000,000
TOTAL MARKET SUMMARY North Lake Tahoe and Truckee (Areas 1-9) Units Sold Sales Volume Median Sales Price Average Sales Price Units Sold Under $500,000 Units Sold - $500,000-$999,999 Units Sold Over $1,000,000
MICROMARKET REPORT VAIL VALLEY
 year end 2011 www.coloradomicroreports.com NEIGHBORHOODS Beaver Creek & Vail 7 5 9 8 10 15 12 1 2 3 4 6 11 14 13 1. 2. 3. 4. 5. 6. 7. Arrowhead Avon Bachelor Gulch Beaver Creek CVC Timber Red Canyon, Cordillera,
PRESS RELEASE Tahoe Fire and Fuels Team
 PRESS RELEASE Tahoe Fire and Fuels Team For Immediate Release November 24, 2015 Prescribed fire operations to continue next week Contacts: U.S. Forest Service, Lisa Herron 530-543-2815 Nevada Division
MICROMARKET REPORT EVERGREEN
 quarter one 2012 www.coloradomicroreports.com EVERGREEN NEIGHBORHOODS 10 13 8 11 14 9 15 1 7 16 4 2 5 12 6 3 1. 2. 3. 4. Bear Mountain Brook Forest Conifer Mountain Evergreen Highlands 7. Hangen Ranch
NOTICE OF PROPOSED TRANSIT SERVICE CHANGES PUBLIC COMMENT PERIOD
 NOTICE OF PROPOSED TRANSIT SERVICE CHANGES PUBLIC COMMENT PERIOD Pursuant to TTD Transit Policy, this notice solicits public comment before approving any fare increase or major service reduction. The public
PRESS RELEASE Tahoe Fire and Fuels Team
 PRESS RELEASE Tahoe Fire and Fuels Team For Immediate Release November 13, 2015 Widespread prescribed fire operation to continue Contacts: North Lake Tahoe Fire Protection District, Isaac Powning 775-
MICROMARKET REPORT BOULDER
 Year-End 2013 www.coloradomicroreports.com BOULDER NEIGHBORHOODS 7 10 4 3 13 9 8 6 5 1 2 14 11 12 1. Central Boulder 2. East Boulder 3. Gunbarrel 4. Legend Ridge 5. Mapleton Hill 6. Newlands 7. Niwot 8.
MICROMARKET REPORT DENVER METRO
 year end 2011 www.coloradomicroreports.com NEIGHBORHOODS 1. Denver (City) 2. Belmar 3 3. Berkeley 39 4. Bonnie Brae / Belcaro 34 5. Bow Mar/Bow Mar South 25 6. Castle Pines North 7. Castle Pines Village
Information as of August 25, SUMMER 2006 GPCA PLENARY September 9-10, South Lake Tahoe, CA. Hosted by Green Party of El Dorado County.
 Information as of August 25, 2006 SUMMER 2006 GPCA PLENARY September 9-10, South Lake Tahoe, CA. Hosted by Green Party of El Dorado County. Day 1 Lake Tahoe Community College One College Drive South Lake
Transportation & Transit Activities
 Transportation & Transit Activities IN THE TAHOE REGION Tahoe Basin AND SURROUNDING REGION Attractive to outdoor enthusiasts with over 85% of Basin land publicly owned, over 75% by the USFS The Basin is
3 rd QTR Jon Schnoor 2016 GAAR President QUARTERLY MARKET REPORT CONTACT QUARTERLY HIGHLIGHTS. New Listings Closed Sales Average Sale Price
 QUARTERLY MARKET REPORT 3 rd QTR 2016 New Listings Closed Sales Average Sale Price 2016 2015 2016 2015 2016 2015 Detached 4,396 4,354 Detached 3,069 2,886 Detached $228,271 $220,928 Attached 427 417 Attached
Caltrans Shopp Lump Sum Projects and Backup List
 appendix d Caltrans Shopp Lump Sum Projects and Backup List 46 Tahoe Regional Planning Agency - Federal Transportation Improvement Program (Dollars in Whole) State Highway System DIST: PPNO: 03 COUNTY:
2nd QTR % +1.24% +0.36% Danny Wm. Vigil 2018 GAAR President QUARTERLY MARKET REPORT CONTACT QUARTERLY HIGHLIGHTS
 QUARTERLY MARKET REPORT 2018 New Listings Closed Sales Average Sale Price 2018 2017 2018 2017 2018 2017 Detached 5,345 5,326 Detached 3,484 3,380 Detached $242,906 $239,934 Attached 477 501 Attached 368
NORTHWEST OHIO HOUSING MARKET 2nd Quarter Contact Your Realtor To Find Out What s Happening In Your Neighborhood.
 Local Market Update NORTHWEST OHIO HOUSING MARKET 1,627 Unchanged $244k Total Volume +8 Increase $124,100k Median Sales Price +8 Increase 3.48 Average Interest Rate Buying Power Contact Your Realtor To
market Quarterly Highlights Single-family detached home sales increased 1.7% from 4th Quarter 2017 to 2,716. Closed Sales
 Q uarterly market R E P O R T Quarterly Highlights 4 th QTR 2018 The average sale price of single-family detached homes in 4th Quarter 2018 was $241,900, a 2.3% increase from 4th Quarter 2017. Single-family
Washington D.C. Metropolitan Area November 2017 longandfoster.com
 Washington D.C. Metropolitan Area November 217 longandfoster.com 6 $365, $357,925 $348,75 $349, $36, $375, $364,255 $365, $387, $395, $385, $379, $37, $36, $36, $375, $375, $37, $375, $394,5 $45, $49,99
PRESS RELEASE Tahoe Fire and Fuels Team
 PRESS RELEASE Tahoe Fire and Fuels Team For Immediate Release November 6, 2015 Multiple agencies to conduct prescribed fire operations Contacts: North Lake Tahoe Fire Protection District, Isaac Powning
New Franchise Agreement: Recyclables, Organics, and Waste. Town of Truckee Town Council Meeting July 25, 2017
 New Franchise Agreement: Recyclables, Organics, and Waste Town of Truckee Town Council Meeting July 25, 2017 Agenda Overview of Process, Context Review Regulatory Drivers Review of Current Services Potential
Preserving Railroad History along the Donner Pass Route. A Tale of Two Locomotives (and Their Donner Route Connections)
") DONNER CROSSINGS www.psrhs.org A Publication of Placer-Sierra Railroad Heritage Society Issue No. 12, Spring 2017 Preserving Railroad History along the Donner Pass Route A Tale of Two Locomotives (and
DONNER CROSSINGS www.psrhs.org A Publication of Placer-Sierra Railroad Heritage Society Issue No. 12, Spring 2017 Preserving Railroad History along the Donner Pass Route A Tale of Two Locomotives (and
Lake Tahoe Basin Wildfire Awareness Week 2011 Summary Report January 2012
 Lake Tahoe Basin Wildfire Awareness Week 2011 Summary Report January 2012 The Lake Tahoe Basin Wildfire Awareness Week is funded by a grant from the Nevada Division of Forestry and USDA Forest Service
Richmond Metropolitan Area November 2017 longandfoster.com
 Metropolitan Area November 217 longandfoster.com 24 % 2% 2% 4% 4% -1% 4% 7% 9% 1% 1 1% % - Median Sale Price Percent Change Year/Year $215,5 $218, $199,9 $2, $213, $217,25 $225,825 $235, $232, $227, $219,
May 2018 longandfoster.com
 May 218 longandfoster.com 33 Metropolitan Area - May 218 Median Sales Price $3, $25, $2, $15, $1, $5, $227,5 $241,5 $24, $235, $222, $219, $22, $217, $25, $196, $21, $225, $235, $25, $246, $237, $223,
THE MARKET TALKS. October a monthly report on single family residential real estate activity windermeremercerisland.
 THE MARKET TALKS a on single family residential real estate activity T H E M A R K E T TA L K S.C O M 206.232.0446 windermeremercerisland.com WEST SEATTLE $599,000 127 $610,000 131 $491,000 61 $601,333
CONNECTICUT SINGLE-FAMILY SALES REPORT FIRST QUARTER
 2017 CONNECTICUT SINGLE-FAMILY SALES REPORT FIRST QUARTER Darien A decline in high-end sales brought the average price lower compared to a year ago in Darien. The median price of $1,440,000 was 5% higher
SUMMIT COUNTY REAL ESTATE 2015 ANNUAL MARKET REVIEW TABLE OF CONTENTS
 THE SLIFER REPORT SUMMIT COUNTY REAL ESTATE 215 ANNUAL MARKET REVIEW TABLE OF CONTENTS Introduction... 2 Summit County Overview...3-4 Breckenridge...5-6 Copper Mountain... 7-8 Dillon... 9-1 Frisco... 11-12
Connecticut Single-Family
 2016 FIRST Connecticut Single-Family SALES REPORT quarter Darien The average price rose 17% over the past year in Darien, helped by an increase in high-end sales. The median price, which measures the middle
January 2018 longandfoster.com
 January 218 longandfoster.com 69 7% - % - % - - - - % 1 % - Median Sale Price Percent Change Year/Year $198, $194, $196, $195, $2, $28,831 $21, $26, $215, $212, $27,75 $27, $22,9 $25,5 $25, $22, $212,95
Baltimore Metropolitan Area January 2018 longandfoster.com
 Metropolitan Area January 218 longandfoster.com 15 1% 7% 7% 8% 1% 1% 2% 2% 6% 6% 9% $215, $224,95 $117, $119,78 $36,5 $324,995 $37, $362,5 $234, $226, 1% % - Median Sale Price $8, $6, $4, $2, $ Median
2018 Federal Priorities One Region One Voice
 2018 Federal Priorities One Region One Voice Overview of the Regional Transportation Commission of Washoe County, Nevada The Region The RTC is a multi-purpose transportation agency that serves the Reno-Sparks
Charlottesville, VA Area October 2017 longandfoster.com
 , VA Area October 217 longandfoster.com 51 -3% 2% 4% 4% % -3% 17% 6% -2% -2% % 1% 2% 4% 7% 6% 7% 7% 1% 14% 18% 21% 2 2% 1 1% % - Median Sale Price Percent Change Year/Year 52 $256,65 $258, $245, $286,5
2042 LAKE TAHOE BOULEVARD SOUTH LAKE TAHOE, CA
 2042 LAKE TAHOE BOULEVARD SOUTH LAKE TAHOE, CA OV ERV IE W 2 0 4 2 L A K E T A H O E B O U L E VA R D ST AT EL IN E GO ND SOUTH LAKE TAHOE LV EB TAHOE VALLEY ER LA KE TA HO PIO NE EB LV D TR AIL D O AH
Greater Albuquerque Area Monthly Housing Trends vs. 2011
 Greater Albuquerque Area Monthly Housing Trends - 2010 vs. 2011 Class R1 (Existing Single-Family Detached) and Class R2 (Existing Condo/Townhome Attached) homes Data on this page was obtained from the
Roanoke Metropolitan Area - March 2019
 March 219 69 4% 8% 9% 6% 11% 7% 8% 8% -3% -1% 3% 1% 2% 2% 1% 7% 6% 7% 8% 4% 1 % - - Median Sale Price Percent Change Year/Year 7 $173,4 $164,9 $182,825 $177, $18,975 $178,2 $18,9 $172, $175, $16, $168,
Real life. Real answers.
 Most Recent 12 Months Month to Month Closed 8,682 9,704 Closed 697 738 P 10,315 11,178 P 890 864 0 2,000 4,000 6,000 8,000 10,000 12,000 0 200 400 600 800 1,000 Median Closed Price (,000's) 12 Months Ending
Greater Albuquerque Area Monthly Housing Trends vs. 2016
 Month Greater Albuquerque Area Monthly Housing Trends - 2015 vs. 2016 Class R1 (Existing Single-Family Detached) and Class R2 (Existing Condo/Townhome Attached) homes Data on this page was obtained from
Greater Albuquerque Area Monthly Housing Trends vs. 2017
 Month Greater Albuquerque Association of REALTORS Greater Albuquerque Area Monthly Housing Trends - 2016 vs. 2017 Class R1 (Existing Single-Family Detached) and Class R2 (Existing Condo/Townhome Attached)
FIRST QUARTER 2015 CONNECTICUT SINGLE-FAMILY SALES REPORT
 FIRST QUARTER 2015 CONNECTICUT SINGLE-FAMILY SALES REPORT DARIEN Despite an 11% decline in the number of sales, both the average and median price rose over the past year in Darien. At $1,747,746, the average
Greater Albuquerque Area Monthly Housing Trends vs. 2014
 Month Greater Albuquerque Association of REALTORS Greater Albuquerque Area Monthly Housing Trends - 2013 vs. 2014 Class R1 (Existing Single-Family Detached) and Class R2 (Existing Condo/Townhome Attached)
Darien. Average and Median Sale Price. Number of Sales. Days on Market. Number of Sales. Days on Market
 F o u rt h q u a rt e r 2 0 1 4 C o n n e c t i c u t S i n g l e - F a m i l y S ALE S RE P ORT Darien Single-family home prices averaged $1,849,415 in Darien during the fourth quarter, a 4% decline from
What Does it All Mean?
 What Does it All Mean? There are several hopeful indicators that 2017 could be the turn around year for our Market. There is progress being made on bike lanes, a few cross walks have been installed and
New Construction Absorption and Inventory Report As of March 31, 2014
 New Construction Absorption and Inventory Report As of March 31, 2014 This report identifies the current inventory levels for New Construction in Cumberland Hoke and Harnett County. For Cumberland County
California Regional Travel & Tourism Outlook. September 2016
 California Regional Travel & Tourism Outlook September 2016 California regional & seasonal travel trends The number of visits to California regions surpasses that of total California visits in a given
Sedona and Verde Valley Real Estate 2013 in Review
 Sedona and Verde Valley Real Estate 213 in Review It is all about inventory! In 211 and 12, the big question was when home prices would hit bottom. With the median sales price of a single family home in
WHATS THE SEDONA REAL ESTATE MARKET DOING?
 WHATS THE SEDONA REAL ESTATE MARKET DOING? That is the question on everyone s lips these days. Everyone wants to know what is the market doing. Why, because it matters to all of us. We are either living
Central Okanagan Monthly Statistics Graphs January 2018
 Monthly Statistics Graphs January January Statistics Table of Contents Table of Contents Single Family Monthly Listings by Price Single Family YTD Listings by Price Single Family Monthly Sales by Price
Central Okanagan Monthly Statistics Graphs February 2019
 Monthly Statistics Graphs February February Statistics Table of Contents Table of Contents Single Family Monthly Listings by Price Single Family YTD Listings by Price Single Family Monthly Sales by Price
January 2018 longandfoster.com
 January 218 longandfoster.com 6 % 6% 1% -1% % % % % % 3% 3% 3% 3% 1 1% % - Median Sale Price Percent Change Year/Year 61 $23, $29,95 $21, $225, $226,188 $245, $23, $234, $22,25 $224,825 $225, $23, $212,95
The 8k tax credit,; any impact on the market?
 The 8k tax credit,; any impact on the market? 2015, Fourth Quarter and Annual Market Update Inventory metrics-page 3 The top graph illustrates the inventory by category for the time period stated. The
What Does it All Mean?
 What Does it All Mean? There are several hopeful indicators that 2017 could be the turn around year for our Market. There is progress being made on bike lanes, a few cross walks have been installed and
The 8k tax credit,; any impact on the market?
 The 8k tax credit,; any impact on the market? 2016, February Market Update Inventory metrics-page 3 The top graph illustrates the inventory by category for the time period stated. The middle graph illustrates
ZEPHYR POINT PRESBYTERIAN CONFERENCE CENTER DRIVING DIRECTIONS
 ZEPHYR POINT PRESBYTERIAN CONFERENCE CENTER DRIVING DIRECTIONS Zephyr Point is located at 660 Highway 50, Zephyr Cove, NV GPS Coordinates: N 39 0 7.8 W 119 57 22.8 From Sacramento: Take Hwy 50, travel
Greater Las Vegas Snapshot by Sale Type
 216 Greater Las Vegas ket Update 1.% Closed Sales Trend by Type il Closings by Type 9.% 8.% 7.% 6.% 5.% 4.% Traditional Equity 88% REO 7% Short Sales 5% 3.% 2.% 1.%.% 29 211 21 212 213 214 215 Available
Lake Tahoe Basin Management Unit and Tahoe National Forest, California; Calpeco 625 and 650 Electrical Line Upgrade Project EIS/EIS/EIR
 This document is scheduled to be published in the Federal Register on 04/10/2012 and available online at http://federalregister.gov/a/2012-08579, and on FDsys.gov [3410-11- P] DEPARTMENT OF AGRICULTURE
Weston Market Report
 Weston ket Report First Quarter 219 219 Connecticut Hamptons New York City New Jersey Hudson Valley 379 POST ROAD EAST, WESTPORT, CT 688 (23) 221-666 HALSTEAD CONNECTICUT, LLC Weston Overview 219 218 %
LAKE TAHOE BASIN AMERICANS WITH DISABILITIES ACT PARATRANSIT PLAN
 LAKE TAHOE BASIN AMERICANS WITH DISABILITIES ACT PARATRANSIT PLAN PREPARED FOR Tahoe Regional Planning Agency PREPARED BY [ TRA N ~f'o RTATI ON C ON~l l l T \ N T~, INC. LAKE TAHOE BASIN AMERICANS WITH
US 50/SOUTH SHORE COMMUNITY REVITALIZATION PROJECT
 US 50/SOUTH SHORE COMMUNITY REVITALIZATION PROJECT April 25, 2012 Tahoe Transportation District (TTD) Tahoe Transportation District (TTD) established 1980 as Bi-State Agency TTD Goals Implement Transportation
Robb Drive Development
 O f f e r i n g M e m o r a n d u m Robb Drive Development Interstate 80 & Robb Drive Reno, Nevada 8 5 A c r e s p r e s e n t e d e x c l u s i v e l y b y R o n C o b b Principal Direct: (775) 329-4000
the MARQ CONDO SCOOP Featured Building The Marq Featured Listing Spacious Living in the Heart of Ballard
 NOVEMBER 2016 EDITION SALES STATS FOR OCTOBER 2016 the MARQ inside this issue 02 Featured Building The Marq CONDO SCOOP PUGET SOUND 03 05 08 12 Featured Listing Spacious Living in the Heart of Ballard
September Arizona Regional MLS. All Home Types Single Family Detached Manufactured All Other
 All Home Types Single Family Detached Manufactured All Other Arizona Regional MLS Presented by Arizona Regional MLS 8,7 7,946 6,803-7.4% -6.1% 9,278 9,142-9.8% -2.2% 8,813 8,123-15.0% -5.8% 8,004 7,223
State of Colorado 2.9% Douglas County 1.0% Cultural District (SCFD) 0.1% Total Sales Tax %
 0.1% Total Sales Tax %") March 26, 2018 To Whom It May Concern: RE: SALES TAX - TAXING DISTRICTS for the address of: RESIDENTS of Castle Pines Village Castle Rock, CO 80108 This letter represents the County s identification as
March 26, 2018 To Whom It May Concern: RE: SALES TAX - TAXING DISTRICTS for the address of: RESIDENTS of Castle Pines Village Castle Rock, CO 80108 This letter represents the County s identification as
HIGH PROFILE RETAIL SPACE ON ICONIC GREEN BAY ROAD
 LEASE OVERVIEW AVAILABLE SF: LEASE RATE: YEAR BUILT: 2017 ZONING: MARKET: 2,000-6,200 SF $29.00 SF/Yr (NNN) Village Center Pedestrian Commercial West Chicago PROPERTY DESCRIPTION Incredible retail lease
Greater Las Vegas Snapshot by Sale Type Last Month's Sold
 Available Pending Greater Las Vegas Snapshot by Sale Type Last Month's Sold Median List Price Average List Price Median Sold Price Average Sold Price Months of Inventory 30 Day Average Absorption DOM Rate
Greater Las Vegas Snapshot by Sale Type Last Month's Sold
 Available Pending Greater Las Vegas Snapshot by Sale Type Last Month's Sold Median List Price Average List Price Median Sold Price Average Sold Price Months of Inventory 30 Day Average Absorption DOM Rate
Public Meeting. City of Chicago Department of Transportation & Department of Housing and Economic Development
 Public Meeting City of Chicago Department of Transportation & Department of Housing and Economic Development Funded by Regional Transportation Authority September 12, 2011 In partnership with Presentation
North Okanagan Monthly Statistics Graphs July 2016
 Monthly Statistics Graphs July 6 July 6 Statistics Table of Contents Table of Contents Single Family Monthly Listings by Price Single Family YTD Listings by Price Single Family Monthly Sales by Price Single
Luxury Homes. Wake, Durham, Orange, Chatham Counties September January-September Data. Luxury Home Market; Third Quarter 2010 Summary
 Luxury Homes Wake, Durham, Orange, Chatham Counties September 2010 January-September Data Luxury Home Market; Third Quarter 2010 Summary The information contained in this report presents data and analysis
The Millenia Town Center consists of a ±12.58 acre portion of the ±210 acre. The Millenia Town Center is currently planned to include two projects
 UNDER CONSTRUCTION Meet San Diego s next iconic urban village. A bold claim but Millenia is a bold idea. It will be the new center of South County. Millenia is a unique mixed-use hub that embodies the
Denver Metro Single-Family Vacancy Survey
 Denver Metro Single-Family Vacancy Survey Including Fourplex, Triplex, Duplex, Townhouse, Condominium, and Single-Family For-Rent Properties Third Quarter, Sponsored by: dola.colorado.gov Researched and
A memorial service was held on October 24th for Mark and Jeanne Hounsell at LifePoint Church in Minden, NV.
 NEWSLETTER Celebrating our 50th Anniversary! November 2015 / Volume 4 / Issue 11 Inside this Issue Tragic Loss of Mark Hounsell Tahoe Agencies Awarded $9M for Bike Projects Turkey Trot Fun Run Regan Beach
Regional Transportation Commission, Washoe County Lee Gibson, Executive Director Roger Hanson, Senior Planner
 Regional Transportation Commission, Washoe County Lee Gibson, Executive Director Roger Hanson, Senior Planner Presentation Outline Transit System Facts Economic Challenges in the Truckee Meadows RTC Transit
2040 REGIONAL TRANSPORTATION PLAN
 2040 REGIONAL TRANSPORTATION PLAN Your RTC. Our Community. 1] 2040 Regional Adopted Transportation May Plan 18, 2017 The 2040 Regional Transportation Plan (RTP) identifies the long-term transportation
OVERLAND ROUTE STATIONS AND MILEAGE PART ONE OF FOUR SACRAMENTO TO RENO FROM 1866 THROUGH 1903
 OVERLAND ROUTE STATIONS AND MILEAGE PART ONE OF FOUR SACRAMENTO TO RENO FROM 1866 THROUGH 1903 Date of Station or Dist Dist Dist Dist Distance Issue location name From From From From as at next Sacto SF
Produced by the BPDA Research Division:
 March 2018 Produced by the BPDA Research Division: Alvaro Lima Director Jonathan Lee Deputy Director Christina Kim Research Manager Phillip Granberry Senior Researcher/Demographer Matthew Resseger Senior
Bullhead City, AZ. Topock, Lake Havasu, Parker, Vidal Jct, Needles, AVI- 205 miles. Full day ride. Take Laughlin Ranch Blvd to Bullhead Pkwy
 Bullhead City, AZ to Bullhead Area Chamber of Commerce Topock, Lake Havasu, Parker, Vidal Jct, Needles, AVI- 205 miles. Full day ride Drive 205 miles, 4 h 3 min Map data 2015 Google 10 mi Bullhead City,
Condos November October. Townhomes November October
 November 2018 Detached Properties November October Total 773 855-9.6% 819 841-2.6% 58 94-38.3% 80 107-25.2% Days on Market Average 49 30 + 63.3% 47 26 + 80.8% MLS HPI $1,470,800 $1,573,500-6.5% $1,480,700
Fine particle pollution
 www.pca.state.mn.us Fine particle pollution Fine particle pollution is a complex mixture of extremely small particles and liquid droplets that are created during combustion and can also be formed as other
2042 LAKE TAHOE BOULEVARD SOUTH LAKE TAHOE, CA
 2042 LAKE TAHOE BOULEVARD SOUTH LAKE TAHOE, CA OV ERV IE W 2 0 4 2 L A K E T A H O E B O U L E VA R D PR OJEC T R E N DER I NGS Located at the gateway of South Lake Tahoe the intersection of Highways ST
Permit# Applied: 4/13/2006 Issued: 4/17/2006 Finaled: 9/11/2015 Type: BLD-RES Work: TOWNHOME PLAN B UNIT #21 Sub Type: ISNW
 Permit# 06-1240 Applied: 4/13/2006 Issued: 4/17/2006 Finaled: 9/11/2015 Type: BLD-RES Work: TOWNHOME PLAN B UNIT #21 Sub Type: ISNW 784 ROSEWOOD CIR INCL # Units: 1 Value: $223,074.22 Total Fees: $4,557.30
North Okanagan Monthly Statistics Graphs July 2017
 Monthly Statistics Graphs July 7 July 7 Statistics Table of Contents Table of Contents Single Family Monthly Listings by Price Single Family YTD Listings by Price 4 Single Family Monthly Sales by Price
Year to Date Summary. Average and Median Sale Prices
 A Publication of RMLS, The Source for Real Estate Statistics in Your Community Residential Review: Southwest Washington September 2018 Reporting Period September Residential Highlights Southwest Washington
North Okanagan Monthly Statistics Graphs March 2018
 Monthly Statistics Graphs March March Statistics Table of Contents Table of Contents Single Family Monthly Listings by Price Single Family YTD Listings by Price Single Family Monthly Sales by Price Single
Greater Las Vegas Snapshot by Sale Type
 500,000 Available Greater Las Vegas Snapshot by Sale Type Pending Last Month's Sold SFR Market Prices Median List Price Average List Price Median Sold Price Average Sold Price Months of Inventory Closed
RESIDENTIAL DEVELOPMENT OPPORTUNITY
 FOR SALE REGENCY PARK II - ±,00 SF TENATIVE MAPPED LOTS U.S. HIGHWAY Reno, NV 0 Adjacent housing development to Regency Park II FOR SALE REGENCY PARK II - ±,00 SF TENATIVE MAPPED LOTS U.S. HIGHWAY Reno,
North Okanagan Monthly Statistics Graphs September 2018
 Monthly Statistics Graphs September September Statistics Table of Contents Table of Contents Single Family Monthly Listings by Price Single Family YTD Listings by Price Single Family Monthly Sales by Price
July Market Report Single Family Residential Dwellings (Does not include townhouse, condo, midrise, etc.) CCISD Report
 CCISD Report") July Report Single Family Residential Dwellings (Does not include townhouse, condo, midrise, etc.) CCISD Report Range # of Solds Active Listings Month's of Inventory $0-$100K 20 60 3.0 Extreme Sellers
July Report Single Family Residential Dwellings (Does not include townhouse, condo, midrise, etc.) CCISD Report Range # of Solds Active Listings Month's of Inventory $0-$100K 20 60 3.0 Extreme Sellers
Greater Las Vegas Snapshot by Sale Type Last Month's Sold
 Available Units Pending Units Greater Las Vegas Snapshot by Sale Type Last Month's Sold Units Median List Price Average List Price Median Sold Price Average Sold Price Months of Inventory 30 Day Absorption
Greater Las Vegas Snapshot by Sale Type Last Month's Sold
 Available Units Pending Units Greater Las Vegas Snapshot by Sale Type Last Month's Sold Units Median List Price Average List Price Median Sold Price Average Sold Price Months of Inventory 30 Day Absorption
Greater Las Vegas Snapshot by Sale Type Last Month's Sold
 Available Units Pending Units Las Vegas Market Update - November 2017 Greater Las Vegas Snapshot by Sale Type Last Month's Sold Units Median List Price Average List Price Median Sold Price Average Sold
Truckee Meadows Fire Protection District Monthly Report
 Truckee Meadows Fire Protection District Monthly Report August 2013 The following report contains non-audited figures based on data extracted from the District s incident reporting system and Washoe County