Countywide Transit Corridors Functional Master Plan. Appendix 9 Travel Demand Forecasting Model Documentation
|
|
|
- Charles Daniels
- 5 years ago
- Views:
Transcription
1 Countywide Transit Corridors Functional Master Plan Appendix 9 Travel Demand Forecasting Model Documentation
 727-5050 Memorandum To: From: Larry Cole Michael Flood, Monique Ellis Date: December 7, 2012 Subject: M-NCPPC Countywide Transit Corridors Functional")
2 Tower 1, 10 th Floor 100 S. Charles Street Baltimore, MD (410) Memorandum To: From: Larry Cole Michael Flood, Monique Ellis Date: December 7, 2012 Subject: M-NCPPC Countywide Transit Corridors Functional Master Plan: Summary of Build Scenarios and Model Documentation for Proposed BRT Corridors Introduction As part of a supplemental scope of work agreement with the Montgomery County Planning Department for Maryland National Capital Park and Planning Commissions (M-NCPPC), the Parsons Brinckerhoff (PB) team analyzed various scenarios to assess the impacts of implementing bus rapid transit (BRT) runningway and intersection priority treatments on up to 17 corridors. The purpose of the analysis was to identify the minimum right-of-way needs along the proposed BRT corridors. This effort included updating the transit networks identified in the MCDOT s BRT feasibility study. The forecasts included in the draft deliverables used the model for the Purple Line and Corridor Cities Transitway AA studies. In addition to the forecasts, a microsimulation model was developed to evaluate the impacts of median busway and dedicated curb lane treatments on peak-hour traffic operation along sample BRT corridor segments. The purpose of the travel forecast effort was to provide an overall view of estimated ridership of the proposed regional transit systems. The results of the estimated ridership were then used as a tool to identify potential right-of-way needs along selected roadways. The evaluation of the various corridor right-of-way needs was based on forecasts such as average link volume ridership by route, as well as regional statistics including district-level v/c ratios. MDAAII Model The transit model used for the BRT network is the Maryland Alternative Analysis II (MDAAII) model. The MDAAII model, originally developed by Maryland Transit Administration for the Purple Line and Corridor Cities Transitway (CCT) projects, uses a transit mode choice routine and complete four-step model process to develop ridership estimates for those transit modes. An updated local bus network was developed to reflect assumed local bus service assumptions on the corridor. This network was developed after coordination with Over a Century of Engineering Excellence
3 service providers in the area, including Ride On and WMATA staff. The intent of the development of this network was to reflect how service would be altered to support a fully implemented BRT network, to understand implications of this network at the level needed for decision-making. Highway network and demographics data are based on a previous version of the the MWCOG model, which used the same 2191 zone structure as the MDAA II model. For this study, land use Round 8.1 was used for the forecasts, provided by MWCOG staff and summarized to the 2191 zone structure. For the scenarios where the proposed BRT vehicles are running on dedicated guideway, the model s BRT mode was used and the speeds between stops/stations was adjusted to reflect actual operating conditions. For the scenarios where a route operates both on exclusive guideway for a portion on the roadway and with mixed traffic on other segments, the same BRT mode was used to maintain consistentcy in comparing the impacts of the scenario. Speeds were adjusted accordingly based on the operating characteristics of running in an exclusive guideway or mixed traffic. The local bus component of the model was re-calibrated in Summer 2012 to better reflect existing operating conditions. For each of the scenarios analyzed for this project, the background bus network was modified to provide connectivity with the proposed BRT routes as needed. A set of model documentation has been included with this report to provide additional background on the operation of the model. Those documents include: Purple Line Travel Demand Forecasting Technical Report - Appendix A New Starts Travel Forecasting Model Calibration Report - Appendix B Corridor Cities Non-Included Attributes - Appendix C Washington Area New Starts Model Phase II Documentation Bus Speed Model (DRAFT) - Appendix D Washington Area New Starts Model Transit Fares (DRAFT) Appendix E MWCOG version 2.2 Relationship to MDAA II Model Structure Appendix F Maryland Alternatives Analysis Phase II Model Structure Appendix G Non-Included Attributes The Federal Transit Administration (FTA), in their 2007 Proposed Guidance on New Start/Small Starts Policies and Procedures, proposed new guidelines for calculating and reporting user benefits associated with characteristics of a transit line not included in a travel demand model. Modeled attributes include travel time, frequency and wait time, and fares and parking costs. Service attributes not part of travel demand models include its visibility, reliability, span of service hours, comfort, protection from the weather, the chances of finding a seat, and passenger amenities. These non-included attributes are theoretically part of the mode-specific constant for existing transit modes being modeled. New modes are required by the FTA to use a mode-specific constant of 0, but are now allowed to take credit for any non-included attributes by using a post-processing procedure that applies user benefits (time Over a Century of Engineering Excellence
4 savings) to certain riders of the proposed transit line. Those user benefits are determined by the type and nature of the attributes of the new mode. The non-included attributes derived for the Purple Line light rail project and CCT BRT study were applied to the Montgomery County BRT project. Since the proposed BRT for both the CCT and the Montgomery County study have operating and guideway characteristics that are assumed to be identical to a light rail line, the non-included attributes developed for the Purple Line LRT were also applied to the BRT network in this effort. Refer to Appendix C for details on the non-included attributes as documented for the CCT BRT study. BRT Modeling Scenarios Using MWCOG s Land Use Round 8.1, the he PB team assessed five modeling scenarios for this effort; they are described as follows: 2040 No Build Scenario reflects the baseline condition against which other modeling scenarios were compared 2040 Build Scenario with Exclusive Median Busways (Build1) reflects one of four build scenarios in which all proposed BRT corridors were assumed to operate within exclusive median busways. This means only BRT vehicles operated within these lanes and served median stations only. Local buses continued to operate within the curb lanes of the roadways on which BRT operated Build Scenario with Exclusive Median Busways (Build1A) similar to the Build1, but with adjustments to the land use assumptions to test ridership changes along certain corridors and Countywide based on increased housing and employment in the White Oak and Glenmont planning areas Build Scenario with Hybrid of Exclusive Median Busways and Repurposed Lanes (Build2) - reflects one of four build scenarios in which most of the proposed BRT corridors were assumed to operate within exclusive median busways. Once again, only BRT vehicles operated within these lanes and served median stations only. Highway segments along five BRT corridors had a roadway lane removed in each direction of travel to reflect BRT vehicles operating in curb lanes repurposed for transit vehicle use only. Other vehicles could use the repurposed curb lanes only in cases of making right turns Build Scenario with Hybrid of Exclusive Median Busways, Repurposed Lanes, and Mixed Traffic Operations (Build2A) - reflects one of three build scenarios in which the BRT network modeled in the Build1 and Build2 scenarios were reduced to a little more than 90 miles along nine corridors. Compared to the Build1 and Build2 scenarios, the Build2A scenario reduced the number of corridors in exclusive median busways, increased the number of segments operating in repurposed lanes, and identified segments where BRT vehicles would operate in mixed traffic, based on recommended treatments proposed by M-NCPPC Planning staff. This network was developed to identify travel speeds consistent with MNCPPC recommendations for the transit network. Over a Century of Engineering Excellence
5 BRT Travel Time Assumptions Table 1 lists the key assumptions used to develop the BRT travel times. Over a Century of Engineering Excellence
6 Runningway Type Intersection Priority Fare Collection Station Dwell Time Runningway Speed/ Travel Time Intersection Delays Table 1: Input Assumptions for BRT Travel Times Build 1 Build 1A Exclusive median busway Signal priority at all signalized intersections Off-board (via fare vending machine) 15 sec. for low-volume stations 20 sec. for high-volume stations Busway: Based on roadway s posted speed limit 45-sec. delay for non-priority signals 30-sec. delay for signals with TSP 15-sec. delay for signals with queue jumps Use of synchronization factor:10 percent of delay associated with intersection priority treatments (signal priority and queue jumps) Build 2 Exclusive median busway Dedicated curb lane Same as Build 1/Build 1A Same as Build 1/Build 1A Same as Build 1/Build 1A Busway: Based on roadway s posted speed limit Curb lane: Reduced busway travel time at rate of 1 min/mile across same distance Same as Build 1/Build 1A Build 2A Exclusive median busway Dedicated curb lane Mixed traffic Signal priority at signalized intersections with LOS C or D Queue jumps at limited signalized intersections for BRT in curb lane or mixed traffic Same as Build 1/Build 1A Same as Build 1/Build 1A Busway: Based on roadway s posted speed limit Curb lane: 5 MPH reduction of posted speed limit Mixed traffic: Based on model s congested highway speed Same as Build 1/Build 1A Lane Repurposing Model Steps As part of this effort, a scenario assuming repurposing one travel lane from all vehicles to transit and right-turning vehicles only. Under the current MDAAII modeling application, the following steps were taken to develop the forecast for that alternative: 1. Modify the No-Build highway network to reflect the proposed changes within the COGWithSplits modeling framework (which was developed based on MWCOG s Version 2.2 regional travel demand model) Over a Century of Engineering Excellence

7 2. Run the COGWithSplits modeling procedure and generate the highway network related files to be used as part of the input files needed under the MDAAII s model run for the revised No Build scenario. 3. Run the MDAAII model for the revised No-Build scenario with the above inputs and use the resulting trip tables as the basis for the new model run. These steps were followed for the Build2 model run. The Build2A model run was based on the trip tables resulting from the modified highway network applied to the Build2 model run. Figure 1: Runningway Decision Flowchart Over a Century of Engineering Excellence
8 Appendix A


9 Travel Demand Forecasting Technical Report September 2008
10
11 Table of Contents 1. Introduction Background and Project Location Corridor Setting Travel Forecasts for Alternatives Analysis Alternatives Retained for Detailed Study No Build Alternative TSM Alternative Build Alternatives Alternative 3 - Low Investment BRT Alternative 4 - Medium Investment BRT Alternative 5 - High Investment BRT Alternative 6 - Low Investment LRT Alternative 7 - Medium Investment LRT Alternative 8 - High Investment LRT Build Alternatives Operations Reliability Ridership Total and New Transit Trips District to-district Travel Patterns Daily Line Haul Boardings Daily Station Boardings Station Mode of Access University of Maryland Student Travel Special Event and Special Generators Trips Transportation System User Benefits Farebox Revenue Supplemental Forecast Input and Results by Alternative No Build Assumptions TSM Low Investment BRT Medium Investment BRT High Investment BRT Low Investment LRT Medium Investment LRT Travel Demand Forecasting Technical Report Page i
12 3.8. High Investment LRT Comparative Summary Background Bus Assumptions Non-Included (Mode Specific) Attributes List of Tables Table 2-1: Existing Transit Service Table 2-2: Year 2030 Bus Headways within the Corridor (minutes) Table 2-3: Year 2030 TSM Bus Headways (minutes) Table 2-4: Year 2030 Span of Service Table 2-5: Year 2030 Build Alternatives Headways (minutes) Table 2-6: Year 2030 End-to-End Travel Times Table 2-7: Year 2030 Average Station-to-Station Travel Times (minutes) Table 2-8: Year 2030 Total Daily Linked Transit Trips Table 2-9: Year 2030 Daily Purple Line Ridership Table 2-10: Year 2030 Build Alternatives Daily Boardings Table 2-11: Year 2030 Daily Transportation System User Benefits with Mode Specific Attributes Table 2-12: Year 2030 Annual Change in Systemwide Farebox Revenues by Alternative Relative to No Build Table 3-1: Year 2030 Trips (Linked) by Transit Mode No Build Table 3-2: Year 2030 Background Buses (Total Boardings) No Build Table 3-3: Year 2030 Metrorail (Boardings in Corridor Stations) No Build Table 3-4: Year 2030 Commuter Rail (Boardings in Corridor Stations) No Build Table 3-5: Coding Assumptions - TSM Table 3-6: Year 2030 Trips (Linked) by Transit Mode TSM Table 3-7: User Benefits - TSM Table 3-8: Year 2030 Background Buses (Total Boardings) - TSM Table 3-9: Year 2030 Metrorail (Boardings in Corridor Stations) - TSM Table 3-10: Year 2030 Commuter Rail (Boardings in Corridor Stations) - TSM Table 3-11: Coding Assumptions - Low Investment BRT Table 3-12: Year 2030 Trips (Linked) by Transit Mode - Low Investment BRT Table 3-13: Year 2030 Boardings (Station to Station) - Low Investment BRT Table 3-14: Year 2030 User Benefits - Low Investment BRT Page ii Travel Demand Forecasting Technical Report
13 Table 3-15: Year 2030 Background Buses (Total Boardings) Low Investment BRT Table 3-16: Year 2030 Metrorail (Boardings in Corridor Stations) Low Investment BRT Table 3-17: Year 2030 Commuter Rail (Boardings in Corridor Stations) Low Investment BRT Table 3-18: Coding Assumptions - Medium Investment BRT Table 3-19: Year 2030 Trips (Linked) by Transit Mode - Medium Investment BRT Table 3-20: Year 2030 Boardings (Station to Station) - Medium Investment BRT Table 3-21: Year 2030 User Benefits - Medium Investment BRT Table 3-22: Year 2030 Background Buses (Total Boardings) Medium Investment BRT Table 3-23: Year 2030 Metrorail (Boardings in Corridor Stations) Medium Investment BRT Table 3-24: Year 2030 Commuter Rail (Boardings in Corridor Stations) - Medium Investment BRT Table 3-25: Coding Assumptions - High Investment BRT Table 3-26: Year 2030 Trips (Linked) - High Investment BRT Table 3-27: Year 2030 Boardings (Station to Station) - High Investment BRT Table 3-28: Year 2030 User Benefits - High Investment BRT Table 3-29: Year 2030 Background Buses (Total Boardings) High Investment BRT Table 3-30: Table 3-31: Year 2030 Metrorail (Boardings in Corridor Stations) High Investment BRT Year 2030 Commuter Rail (Boardings in Corridor Stations) - High Investment BRT Table 3-32: Coding Assumptions - Low Investment LRT Table 3-33: Year 2030 Trips (Linked) by Transit Mode - Low Investment LRT Table 3-34: Year 2030 Boardings (Station to Station) - Low Investment LRT Table 3-35: Year 2030 User Benefits - Low Investment LRT Table 3-36: Year 2030 Background Buses (Total Boardings) - Low Investment LRT Table 3-37: Table 3-38: Year 2030 Metrorail (Boardings in Corridor Stations) - Low Investment LRT Year 2030 Commuter Rail (Boardings in Corridor Stations) - Low Investment LRT Table 3-39: Coding Assumptions - Medium Investment LRT Table 3-40: Year 2030 Trips (Linked) by Transit Mode - Medium Investment LRT Table 3-41: Year 2030 Boardings (Station to Station) - Medium Investment LRT Table 3-42: Year 2030 User Benefits - Medium Investment LRT Travel Demand Forecasting Technical Report Page iii
14 Table 3-43: Table 3-44: Table 3-45: Year 2030 Background Buses (Total Boardings) - Medium Investment LRT Year 2030 Metrorail (Boardings in Corridor Stations) - Medium Investment LRT Year 2030 Commuter Rail (Boardings in Corridor Stations) - Medium Investment LRT Table 3-46: Coding Assumptions High Investment LRT Table 3-47: Year 2030 Trips (Linked) by Transit Mode - High Investment LRT Table 3-48: Year 2030Boardings (Station to Station) - High Investment LRT Table 3-49: Year 2030 User Benefits - High Investment LRT Table 3-50: Year 2030 Background Buses (Total Boardings) - High Investment LRT Table 3-51: Table 3-52: Year 2030 Metrorail (Boardings in Corridor Stations) - High Investment LRT Year 2030 Commuter Rail (Boardings in Corridor Stations) - High Investment LRT Table 3-53: Background Bus Table 3-54: Year 2030 Trips, Boardings and User Benefits Table 3-55: Year 2030 Background Bus Boardings (Total Daily) Table 3-56: Year 2030 Metrorail Station Boardings (Total Daily) Table 3-57: Year 2030 Commuter Rail Station Boardings (Total Daily) Table 3-58: Non-Included Attributes Table 3-59: Year 2030 User Benefits Effects of Non-included Attributes List of Figures Figure 1-1: Project Area Figure 2-1: Alternative Alignments Figure 2-2: Travel Districts Page iv Travel Demand Forecasting Technical Report
15 1. Introduction The Maryland Transit Administration (MTA) is preparing an Alternatives Analysis and Draft Environmental Impact Statement (AA/DEIS) to study a range of alternatives for addressing mobility and accessibility issues in the corridor between Bethesda and New Carrollton, Maryland. The corridor is located in Montgomery and Prince George s Counties, just north of the Washington, DC boundary. The Purple Line would provide a rapid transit connection along the 16-mile corridor that lies between the Metrorail Red Line (Bethesda and Silver Spring Stations), Green Line (College Park Station), and Orange Line (New Carrollton Station). This Travel Demand Forecasting Technical Report describes the methodology used for the travel demand forecasting and presents the results of that analysis. This Technical Report presents the methodology and data used in the analyses documented in the Purple Line Alternatives Analysis/Draft Environmental Impact Statement. The results presented in this report may be updated as the AA/DEIS is finalized and in subsequent study activities. Maryland Transit Administration (MTA) developed a common travel demand forecasting model and procedures for two Alternatives Analyses in two separate corridors in the Washington DC regional modeling area. The intention was to use the same No Build forecast as the starting point for future forecasts for both the Corridor Cities Transitway (CCT) and the Purple Line (PL). Preliminary work on the CCT forecasts indicated that some enhancements to the Washington Metropolitan Council of Governments (MWCOG) travel model would be required to provide transit corridor-level alternative analysis travel forecasts information. The enhanced model described in this document is referred to as the Maryland Alternatives Analysis Model, or the MDAA. It is based on the officially adopted MWCOG model version 2.1D#50, as modified by MWCOG for the 2007 Conformity Analysis, and referred to here as the COG Model. The COG model is a classic four step model with a static six iterations of feedback through trip generation, distribution, mode choice, and assignment. The COG mode choice model is a simple multinomial model that relies upon the path builder to distinguish choices among primary transit modes. It does not disaggregate transit trips into the various transit modes or transit access modes, nor does it accommodate transit assignment. The COG Model was not fully developed to accommodate comprehensive transit analysis, and therefore a MWCOG model transit component post processor was developed, typically referred to as the COG Transit Component. Starting from the person trip tables that result from the sixth iteration of the full model feedback, the Transit Component applies a more sophisticated mode choice model which distinguishes between bus, bus/metrorail, Metrorail only and commuter rail trips. Walk, Park-and-Ride, and Kiss-and-Ride trips are modeled separately and transit assignment is included. Full documentation of the Transit Component can be found in Post MWCOG - AECOM Transit Component of Washington Regional Demand Forecasting Model Users Guide, prepared by AECOM Consult, Inc., and dated March The 2005 Transit Component was the starting point for modifications made for initial rounds of forecasts for the CCT. Additional modifications included edits to the networks, zones, and all files that are related to zonal-based demographics and walk percentages, to address corridor-level Travel Demand Forecasting Technical Report Page 1-1
16 conditions and reporting needs. Changes were made to the Transit Component scripts in order to accommodate the new zone structure and network modifications. The resulting model, referred to here as the CCT Model, was the starting point for the MDAA. The MDAA starts with the CCT Model and incorporates modifications to improve confidence in transit forecasts in these two corridors. The MDAA replaces the COG Model home-based work trip distribution with the CTPP. The mode choice model is a nested logit model with bus, Metrorail, commuter rail, light rail and bus rapid transit alternative transit modes. A park-andride station capacity restraint model was implemented to account for limited capacity at key stations Background and Project Location Changing land uses in the Washington metropolitan area have resulted in more suburb-to-suburb travel, while the existing transit system is oriented toward radial travel in and out of downtown Washington, DC. The only transit service available for east-west travel is bus service, which is slow and unreliable. A need exists for efficient, rapid, and high capacity transit for east-west travel. The Purple Line would serve transit patrons whose journey is solely east-west in the corridor, as well as those who want to access the existing north-south rapid transit services, particularly Metrorail and MARC commuter rail service. The corridor has a sizeable population that already uses transit and contains some of the busiest transit routes and transfer areas in the Washington metropolitan area. Many communities in the corridor have a high percentage of households without a vehicle, and most transit in these communities is bus service. Projections of substantial growth in population and employment in the corridor indicate a growing need for transit improvements. The increasingly congested roadway system does not have adequate capacity to accommodate the existing average daily travel demand, and congestion on these roadways is projected to worsen as traffic continues to grow through A need exists for high quality transit service to key activity centers and to improve transit travel time in the corridor. Although north-south rapid transit serves parts of the corridor, transit users who are not within walking distance of these services must drive or use slow and unreliable buses to access them. Faster and more reliable connections along the east-west Purple Line Corridor to the existing radial rail lines (Metrorail and MARC trains) would improve mobility and accessibility. This enhanced system connectivity would also help to improve transit efficiencies. In addition, poor air quality in the region needs to be addressed, and changes to the existing transportation infrastructure would help in attaining federal air quality standards Corridor Setting The Purple Line Corridor, as shown in Figure 1-1, is north and northeast of Washington, DC, with a majority of the alignment within one to three miles of the circumferential I-95/I-495 Capital Beltway. Page 1-2 Travel Demand Forecasting Technical Report
17 Figure 1-1: Project Area Travel Demand Forecasting Technical Report Page 1-3
18
19 2. Travel Forecasts for Alternatives Analysis This section provides descriptions of the alternatives for which travel forecasts were prepared for the alternatives analysis and DEIS, as well as a presentation of the results and discussion of the findings. In Chapter 3, more detailed information and forecast results are presented for each alternatives Alternatives Retained for Detailed Study The Purple Line study has identified eight alternatives for detailed study, shown on Figure 2-1. The alternatives include the No Build Alternative, the Transportation System Management (TSM) Alternative, and six Build Alternatives. The Build Alternatives include three using bus rapid transit (BRT) technology and three using light rail transit (LRT) technology. All alternatives extend the full length of the corridor between the Bethesda Metro Station in the west and the New Carrollton Metro Station in the east, with variations in alignment, type of running way (shared, dedicated, or exclusive), and amount of grade-separation options (e.g. tunnel segments or aerial). For purposes of evaluation, complete alignments need to be considered. These alternatives were used to examine the general benefits, costs, and impacts for serving major market areas within the corridor No Build Alternative Existing transit service in the corridor is provided by WMATA Metrorail and Metrobus, Montgomery County Ride On local bus, Prince George s County TheBus local bus, the University of Maryland Shuttle, MARC commuter rail, and Amtrak. Table 2-1 lists the principal existing transit service within the corridor. The transit service levels in the Constrained Long Range Plan (CLRP) are assumed for the No Build Alternative except for the Bethesda to Silver Spring segment of the Purple Line. Travel Demand Forecasting Technical Report Page 2-1

20 Page 2-2 Travel Demand Forecasting Technical Report Figure 2-1: Alternative Alignments
21 Table 2-1: Existing Transit Service Route Terminal & Intermediate Points Metro Red Line Shady Grove Glenmont Metro Green Line Greenbelt Branch Avenue Metro Orange Line Vienna/Fairfax/GMU New Carrollton J1, J2, J3 Montgomery Mall Bethesda Silver Spring Metro J4 Bethesda Metro Silver Spring College Park Metro C2 Wheaton Metro Greenbelt Metro C4 Twinbrook Metro Prince George s Plaza Metro F4 Silver Spring New Carrollton F6 Silver Spring New Carrollton Ride On 15 Silver Spring Metro Langley Park TheBus 17 Langley Park UM College Park Metro UM Shuttle 111 UM Silver Spring Metro UM Shuttle 104 UM College Park Metro MARC Brunswick Line Washington Rockville Gaithersburg - Brunswick MARC Penn Line Washington BWI Thurgood Marshall Airport Baltimore Perryville MARC Camden Line Washington Baltimore Amtrak Northeast Corridor Washington New York and points north and south Transit projects in the Maryland Consolidated Transportation Program (FY ) located within the corridor, and expected to be in place by 2030, include the following: Southern Entrance to Bethesda Metro Station - A new entrance to the mezzanine of the Bethesda Metro station at the southern end of the platform. This second entrance was anticipated at the time of the initial construction of the station, but left unbuilt until ridership required it. The construction of this project is funded and design is currently underway. Silver Spring Transit Center - This project provides a fully integrated transit center at the Silver Spring Metro Station. It will serve the Metrorail Red Line and the MARC Brunswick Line. It will include bus bays for Metrobus and Ride On, an intercity bus facility, a taxi queue area, a kiss-and-ride facility, and a MARC ticketing office. Construction has begun on this facility and should be complete by Provisions have been made in the Transit Center design to accommodate a Purple Line guideway and platforms. For the Low Investment BRT Alternative, the buses would use the middle level bus facility. Takoma/Langley Park Transit Center - A new transit center will be built at the northwest corner of the University Boulevard and New Hampshire Avenue intersection. It is expected to be completed by All the Purple Line Build Alternatives would have a station at this transit center. The Metrorail system opens at 5 AM on weekdays and 7 AM on weekends. It operates until midnight Sunday through Thursday and until 3 AM on Fridays and Saturdays. Travel Demand Forecasting Technical Report Page 2-3
22 Metrobus schedules vary by route, with most routes running every day. Ride On schedules also vary by route, with most routes running daily. TheBus buses operate Monday through Friday, with no service on weekends or holidays. Bus headways on all three systems vary by time of day. Table 2-2 lists the headways of the bus routes within the corridor. Transit service to the National Naval Medical Center/National Institutes of Health area is provided from Silver Spring and points east via the J1 route, while the Metrorail Red Line Medical Center Station connects to the entire rail-bus network. Table 2-2: Year 2030 Bus Headways within the Corridor (minutes) Route Terminal and Intermediate Points Early Morning J1 Montgomery Mall-Medical Center- Silver Spring Metro J2 Montgomery Mall-Bethesda-Silver Spring Metro J3 Montgomery Mall-Bethesda-Silver Spring Metro J4 Bethesda Metro-Silver Spring-College Park Metro C2 Wheaton Metro-Greenbelt Metro C4 Twinbrook Metro-Prince George s Plaza Metro F4 Silver Spring New Carrollton F6 Silver Spring New Carrollton Ride On 15 Silver Spring Metro-Langley Park TheBus 17 Langley Park-UM-College Park Metro UM Shuttle 111 UM Shuttle 104 UM Silver Spring Metro UM College Park Metro AM Peak Midday PM Peak Evening Saturday Sunday Since no changes are anticipated to the bus network under the No Build Alternative, it is not anticipated that current service levels would change significantly, except for the impacts of growing roadway congestion, which is expected to result in lengthened bus running times and longer travel times for all vehicles. The No Build Alternative would not include any alterations to the existing Metrobus, Ride On, or TheBus systems. It would not include addition of a new mode or new exclusive right-of-way, and would therefore not significantly increase the reliability of the existing transit system. It is expected that increasing roadway congestion will continue to decrease the reliability of the bus service, its adherence to its operational schedule, and the predictability of expected headways and transit travel times. Page 2-4 Travel Demand Forecasting Technical Report
23 2.3. TSM Alternative The TSM Alternative would include enhanced bus service in the corridor and a new throughroute from Bethesda to New Carrollton replacing the existing J4 route and adding service on portions of the F4/F6 routes between College Park and New Carrollton. The TSM bus service would consist of a limited-stop bus route that would make stops consistent with those of the Build Alternatives. The core service improvements under the TSM Alternative are limited-stop bus service, selected intersection and signal preference strategies, and upgrades to bus stop amenities. A principal difference between the TSM and the Build Alternatives is that the TSM service would operate on East West Highway between Bethesda and Silver Spring, rather than along a new guideway facility along the Georgetown Branch and Metropolitan Branch railroad rights-ofway between Bethesda and Silver Spring, as with the Build Alternatives (except under the Low Investment BRT Alternative, which runs along Jones Bridge Road.) Along East West Highway, stops would be located at Connecticut Avenue and at Grubb Road. The TSM service would provide faster one-seat rides between major activity centers, including Medical Center Metro Station, Bethesda Metro Station, Silver Spring Metro Station, Takoma Park, Langley Park, University of Maryland, College Park Metro Station, and New Carrollton Metro Station. This route would also serve transfers to bus routes operating on radial streets, including those on Wisconsin Avenue, Connecticut Avenue, Colesville Road, Georgia Avenue, New Hampshire Avenue, Riggs Road, Adelphi Road, US 1, Kenilworth Avenue, and Annapolis Road. It would serve the long-haul trips now carried by WMATA J2/J3, Ride On 15, and, to a degree, WMATA C2/C4, and is estimated would serve nearly 80 percent of the passengers now boarding the existing routes along this corridor. Transit service to the National Naval Medical Center/National Institutes of Health area would be provided from Silver Spring and points east through the enhanced J1 service with intersection, operational, or service modifications. The Metrorail Red Line Medical Center Station would continue to provide connectivity to the entire rail-bus network. Because of the importance of serving the trips that interface with the Metrorail services in the Purple Line corridor, the TSM span of service would match the Metrorail span of service. The Metrorail system opens at 5 AM on weekdays and 7 AM on weekends. It operates until midnight Sunday through Thursday and until 3 AM on Fridays and Saturdays. The fare structure for the TSM service would be the same as under the No Build Alternative, recognizing that fares would increase over time. SmartCard, or some other means of electronic fare collection, may enable an integrated fare structure and convenient transfer with other transit services in the corridors. End-to-end, the TSM route is 16 miles long, requiring about 108 minutes of running time with an average round trip speed of 9 miles per hour. Today, the bus routes along the alignment operate in very difficult circumstances with a wide range of times in each direction and between the AM and PM. Anecdotal reports from WMATA indicate that the J4 route may require 50 percent Travel Demand Forecasting Technical Report Page 2-5
24 more time than scheduled on certain runs to complete its trip. These conditions complicate schedule preparation and operations planning. It is assumed TSM measures would somewhat mitigate these conditions; however, 2030 background traffic volumes and traffic congestion levels will be far greater than they are today. Table 2-3: Year 2030 TSM Bus Headways (minutes) Route Terminal and Intermediate Points Early Morning TSM Bethesda New Carrollton J1 Medical Center Silver Spring J3 Eliminate; replace with Ride On 15 service C2 Terminate at Langley Park Langley Park Greenbelt C4 Twinbrook Metro Prince George s Plaza Metro F4 Silver Spring New Carrollton F6 Terminate at Prince George s Plaza Prince George s Plaza New Carrollton Ride On 15 Bethesda Langley Park (extend to Bethesda) TheBus 17 Langley Park UM College Park Metro AM Peak Midday PM Peak Evening Weekend The TSM Alternative includes modifications to existing Metrobus routes intended to improve reliability, including limited-stop bus service, and intersection improvements and signal priority at certain intersections. At intersections where queue jump lanes and signal priority would be implemented, transit s reliability would increase because the effects of congestion at these locations would be reduced. In addition, the limited-stop route would provide faster connections between major origins and destinations, as well as providing one-seat rides. However, there is only limited opportunity for improving transit service reliability using signal preference strategies in the corridor. The major radial roadways that cross the corridor, such as Connecticut Avenue, Georgia Avenue, New Hampshire Avenue, Riggs Road, Adelphi Road, US 1, Kenilworth Avenue, and Annapolis Road, are the major sources of delay and unreliability. These roadways carry very heavy arterial traffic flows into and out of Washington, DC and other major activity centers. There is very little opportunity to introduce signal preferences at these intersections without causing a major exacerbation of traffic congestion. Queue jump lanes, however, do provide a travel time reliability advantage enabling transit vehicles to get to the intersection and limit the delay to one or two traffic signal cycles Build Alternatives Six Build Alternatives are under consideration. They include two transit modes, BRT and LRT. Each mode is being analyzed at three potential levels of investment: low, medium, and high. All of the Build Alternatives would extend the full length of the corridor between the Bethesda Page 2-6 Travel Demand Forecasting Technical Report
25 Metro Station and the New Carrollton Metro Station with some variations in alignment location, type of running way (shared, dedicated, or exclusive), and amount of grade separation. The decision to construct dedicated lanes is dependent on the results of the operations modeling (which assumes no dedicated lanes), as well as construction costs and potential environmental benefits and impacts. Each of the Build Alternatives is described briefly below Alternative 3 - Low Investment BRT The Low Investment BRT Alternative would primarily use existing streets to minimize capital costs. It would incorporate improvements to traffic signals (including signal priority where possible), signage, and travel lanes in appropriate areas. This alternative would mostly operate in mixed lanes, crossing all intersections at grade, and would include queue jump lanes at major intersections. Dedicated BRT lanes would be provided southbound along Kenilworth Avenue, and westbound along Annapolis Road. This is the only Build Alternative that would operate on Jones Bridge Road (directly serving the National Institutes of Health and the National Naval Medical Center) and that would use the bus portion of the new Silver Spring Transit Center. Alternative 4 - Medium Investment BRT The Medium Investment BRT Alternative is a composite of elements from the Low and High Investment BRT Alternatives. The Medium Investment BRT Alternative incorporates those lower-cost features for segments of the Low Investment BRT Alternative that perform reasonably well and those of the High Investment BRT Alternatives that provide reasonable benefits relative to the higher costs. The major incremental change for the Medium Investment BRT Alternative is that between Bethesda and Silver Spring, the transit service runs in a guideway in the Georgetown Branch right-of-way instead of along Jones Bridge Road. It would serve both the existing Bethesda bus terminal and the new south entrance to the Metro station beneath the Apex Building. At the Silver Spring Transit Center, the buses would enter on an aerial structure parallel to, but at a higher level than, the existing Metro and CSX tracks. Along University Boulevard the alternative would be in dedicated lanes and the alternative would leave Campus Drive in the University of Maryland at Regent s Drive to proceed directly through the East Campus development. Alternative 5 - High Investment BRT High Investment BRT is structured to provide the fastest travel time of the BRT alternatives. Tunnels and aerial structures are proposed at key locations to improve travel time and reduce delay. When operating within or adjacent to existing roads, this alternative would operate largely in dedicated traffic lanes. Like the Medium Investment BRT Alternative, this alternative would serve the Bethesda Station at both the bus terminal and the new south entrance. At the Silver Spring Transit Center, the buses would enter on an aerial structure parallel to, but at a higher level than, the existing Metro and CSX tracks. Alternative 6 - Low Investment LRT The terminal station for Low Investment LRT would be the Bethesda Metro Station with a connection to the southern end of the existing station platform (the LRT alternatives would only Travel Demand Forecasting Technical Report Page 2-7
26 serve the south entrance of the Bethesda Station and would operate there in a stub-end platform arrangement). It would operate in shared and dedicated lanes with minimal use of vertical grade separation and horizontal traffic separation. At the Silver Spring Transit Center, the light rail transit would enter on an aerial structure parallel to, but at a higher level than, the existing tracks. This alternative would include incorporation of signal priority or queue jump lanes at major intersections where possible, to achieve measurable time savings or reliability without overly adversely affecting traffic at the intersections Alternative 7 - Medium Investment LRT The Medium Investment LRT Alternative is a composite of elements from the Low and High Investment LRT Investment Alternatives. This alternative incorporates those lower cost features for segments of the Low Investment LRT Alternative that perform reasonably well and those of the High Investment LRT Alternative that provide reasonable benefits relative to their higher costs. The principal incremental change for the Medium Investment LRT Alternative is the introduction of several grade separations at major roadways and more dedicated sections along roadways; however, it does not include some of the longer tunnel sections in East Silver Spring, the University of Maryland, or Riverdale Park, that are included under the High Investment BRT and LRT Alternatives. Alternative 8 - High Investment LRT The High Investment LRT Alternative is nearly identical to the High Investment BRT Alternative, except that it only serves the south entrance of the Bethesda Metro Station Build Alternatives Operations The span of service for the Build Alternatives would mirror that for the Metrorail system, including extended hours on weekend nights (see Table 2-4). The headways of the various Build Alternatives would vary by time period to reflect demand requirements. Proposed headways are shown by time period in Table 2-5. The span of services of the bus routes that feed the TSM and Build Alternatives would be adjusted to service the market needing extended service times. Table 2-4: Year 2030 Span of Service Day of Week Monday - Thursday Friday Saturday Sunday Hours 5:00 AM 12:00 AM 5:00 AM 3:00 AM 7:00 AM 3:00 AM 7:00 AM 12:00 AM Page 2-8 Travel Demand Forecasting Technical Report
27 Table 2-5: Year 2030 Build Alternatives Headways (minutes) Day of Week Early AM Peak Midday PM Peak Evening Late PM Weekdays Saturdays 20 N/A 10 N/A Sundays 20 N/A 10 N/A The fare for all of the Build Alternatives under consideration would be consistent with the current local bus fare structure, recognizing that this would increase over time. SmartCard, or some other means of electronic fare collection, would enable an integrated fare structure and convenient transfer with the other transit services in the corridor. The end-to-end travel times and average estimated speeds for each Build Alternative are shown in Table 2-6. As expected, the High Investment LRT Alternative, with strategic grade separation and mostly dedicated or exclusive right-of-way, would have the shortest running time and the highest average speed of all the alternatives. Average station-to-station travel time estimates for the Build Alternatives are shown in Table 2-7. Table 2-6: Year 2030 End-to-End Travel Times End-to-End Running Time (minutes) Average Speed (mph) TSM Low Investment BRT Medium Investment BRT High Investment BRT Low Investment LRT Medium Investment LRT High Investment LRT Reliability The overall reliability of any of the Build Alternatives would be higher than that for the No Build or TSM alternatives because portions of the service, depending on the alternative, would operate largely in dedicated lanes or exclusive right-of-way, thus removing the vehicles from the potential delays of roadway congestion. In areas where the Purple Line would operate in shared lanes, it is anticipated that queue jump lanes and signal prioritization would be implemented where possible. The High Investment Alternatives would have the highest reliability, and the Low Investment Alternatives would have the lowest reliability. Because of the terminal configuration of the High and Medium Investment BRT Alternatives at Bethesda that involves a street running loop, those two alternatives would not be as reliable as their LRT counterparts. Similarly, the Low Investment BRT Alternative with its operations along Jones Bridge Road between Bethesda and Jones Mill Road would have lower reliability than the Low Investment LRT Alternative, which would operate in the Georgetown Branch right-of-way, which is an exclusive right-of-way. Travel Demand Forecasting Technical Report Page 2-9
28 Table 2-7: Year 2030 Average Station-to-Station Travel Times (minutes) Segment TSM Low Inv. BRT Medium Inv. BRT High Inv. BRT Low Inv. LRT Medium Inv. LRT Bethesda Metro, North entrance to Medical Center Metro N/A 4.7 N/A N/A N/A N/A N/A Bethesda Metro, North entrance to Bethesda Metro, South entrance N/A N/A N/A N/A N/A Medical Center Metro to Connecticut Avenue N/A 6.0 N/A N/A N/A N/A N/A Bethesda Metro, South entrance to Connecticut Avenue 10.8 N/A Connecticut Ave. to Grubb Road 7.3 N/A N/A N/A N/A N/A N/A Connecticut Avenue to Lyttonsville N/A Grubb Road to Silver Spring Transit Center 13.2 N/A N/A N/A N/A N/A N/A Lyttonsville to Woodside/16th Street N/A Woodside/16th Street to Silver Spring Transit Center N/A Silver Spring Transit Center to Fenton Street N/A N/A Silver Spring Transit Center to Dale Drive N/A N/A N/A 2.6 N/A N/A 3.6 Fenton Street to Dale Drive N/A N/A Dale Drive to Manchester Road Manchester Road to Arliss Street Arliss Street to Gilbert Street Gilbert Street to Takoma/Langley Transit Center Takoma/Langley Transit Center to Riggs Road Riggs Road to Adelphi Road Adelphi Road to UM Campus Center UM Campus Center to UM East Campus UM East Campus to College Park Metro College Park Metro to River Road River Road to Riverdale Park Riverdale Park to Riverdale Road Riverdale Road to Annapolis Road Annapolis Road to New Carrollton Metro Total Running Time (rounded up to the nearest minute) Note: Times represent the average of morning and afternoon peak period travel times in the eastbound and westbound direction, which may vary with the specific period coding assumptions. High Inv. LRT Page 2-10 Travel Demand Forecasting Technical Report
29 Ridership Ridership forecasts are used to gauge the comparative attractiveness of alternatives under consideration. They are measured in terms of daily passengers and daily boardings, also called linked and unlinked trips. A passenger, or linked trip, is defined as travel from trip origin to trip destination, regardless of the number of transfers or mode changes required. A boarding, or unlinked trip, is counted as the number of times a person enters a vehicle for travel, inclusive of transfers. One linked trip from origin to destination could comprise multiple unlinked trips. Purple Line ridership forecasts were measured in terms of total and new daily transit trips (linked), peak period boardings and alightings by station, and by peak period line volumes. Total and New Transit Trips The Build Alternatives would generate an approximately one percent increase in total regional transit ridership over the No Build Alternative. Detailed ridership forecasts are shown in Table 2-8. The results of the ridership modeling would indicate that forecast ridership on the Purple Line will not be the key determinant in selecting a preferred Build Alternative, but rather the results of the environmental, traffic, and cost-benefit analyses. District to-district Travel Patterns The Washington metropolitan region was defined as a set of districts to enable a discussion of the current travel patterns (see Figure 2-2). A set of districts are identified around the major activity centers of Bethesda, Silver Spring, College Park/University of Maryland, and New Carrollton. Three additional districts are the wedge areas in between the major activity centers, Connecticut Avenue-Lyttonsville, Takoma Park-Langley Park, and Riverdale. These seven districts constitute the Purple Line corridor. Other districts are used to define major sections of Washington, DC and travel market areas around the Metrorail lines (both branches of the Red Line, the Green Line, and the Orange Line) running to the north and northeast of the corridor. The rest of the region is defined by larger districts for the remainder of Maryland and the areas of Virginia. The Purple Line corridor has approximately 169,000 daily transit trips that have one or both ends of the trip in the corridor. This represents some 9.5% of the transit trips for the Washington region. Some 44,000 of these transit trips have both ends of the trip within the Purple Line corridor while 60,000 transit trips are between the corridor and some part of Washington, DC. A large number of the remaining trips are associated with districts to the north or northeast of the Purple Line corridor along the Metrorail lines. The majority of the trips in the corridor are associated with the major activity centers, 134,000, while the other 35,000 are associated with the wedge districts. Of the trips associated with the major activity centers, only 9,000 are from one major activity center to another. For the wedge district trips, 8,400 are associated with the major activity centers with 15,400 associated with the Washington, DC districts. Travel Demand Forecasting Technical Report Page 2-11
30 Table 2-8: Year 2030 Total Daily Linked Transit Trips Type of Low Invest. Medium High Invest. Low Invest. Medium High Invest. No Build TSM Trip BRT Invest. BRT BRT LRT Invest. LRT LRT Bus Work 236, , , , , , , ,879 Non-work 211, , , , , , , ,434 Metrorail Work 561, , , , , , , ,446 Non-work 298, , , , , , , ,011 Commuter Rail Work and Non-Work 47,944 48,983 48,922 48,937 48,984 48,934 48,930 48,956 Purple Line Work NA NA 13,827 17,896 20,759 20,444 21,377 22,953 Non-work NA NA 8,570 11,169 12,423 12,307 12,849 13,488 Total Transit Trips 1,355,395 1,363,585 1,366,773 1,370,704 1,373,059 1,373,612 1,374,602 1,376,167 Page 2-12 Travel Demand Forecasting Technical Report

31 Figure 2-2: Travel Districts Travel Demand Forecasting Technical Report Page 2-13
32 What this information shows is that while there is quite a bit of existing transit travel within the Purple Line corridor, that number of corridor trips associated with areas outside the corridor is greater, i.e., corridor trips associated with Washington, DC and the area north along the Metrorail Red, Green, and Orange Lines that run through the major activity centers, especially up toward the Shady Grove-Rockville area and Glenmont area. While the major activity center districts account for the majority of the trips, a substantial number of trips are associated with the wedge districts, those areas not presently served by Metrorail and dependent on street-running bus service operating in congested mixed traffic, are linked with either one of the major activity centers or areas reachable via the Metrorail system, especially Washington, DC. By the year 2030, daily transit trips are forecast to grow by 953,000, 52%, for a total of 2,711,000. Transit trips associated with the corridor will grow by 38%, to 234,000, while trips within the corridor will grow by 43% to 62,000 trips. While the general pattern and distribution of these transit trips would be similar to current trips, the level of growth is substantial, increasing the severity and the magnitude of the mobility needs of Purple Line corridor travelers. The TSM Alternative would increase daily total transit trips by 16,000 over the 2030 Future No Build. Of these new transit trips, 13,200, over 80%, are between the corridor and areas outside the corridor; while the other 2,800 trips are within the corridor. The TSM alternative provides most of the benefits to corridor trips to access the transit services that connect with the rest of the region; rather than travel among districts within the corridor. All the Build Alternatives have a similar pattern of change in the travel patterns, but because they have a similar alignment and station definitions and vary primarily by travel times, have different amount of new transit trips with High Investment LRT generating the highest number of new transit trips, and Low Investment BRT generating the lowest Daily Line Haul Boardings Table 2-9 shows the total daily boardings for each of the alternatives. A boarding is when a person uses the transit service for all or part of trip. The boardings are shown for trips only using the Purple Line (over half the boardings), trips primarily on Metrorail and using the Purple Line for part of that trip, and trips primarily on MARC and using the Purple Line for part of that trip. High Investment LRT attracts the highest number of boardings followed by the other LRT alternatives and then the BRT alternatives. Page 2-14 Travel Demand Forecasting Technical Report
33 Table 2-9: Year 2030 Daily Purple Line Ridership Low Medium High Low Medium High Transit Ridership TSM Invest. Invest. Invest. Invest. Invest. Invest. (daily boardings) BRT BRT BRT LRT LRT LRT Purple Line 12,700 22,200 29,300 33,800 32,500 33,900 36,100 Purple Line via 2,100 16,700 21,100 23,700 25,300 27,200 30,500 Metrorail Purple Line via -- 1,100 1,400 1,400 1,500 1,500 1,500 MARC Total 14,800 40,000 51,800 58,900 59,300 62,600 68,100 New Transit Trips Relative to No Build 8,200 11,400 15,300 17,700 18,200 19,200 20, Daily Station Boardings Daily boardings, by station, for each of the Build Alternatives are shown in Table Not surprisingly, the highest number of riders is attracted by the High Investment LRT Alternative, followed by the Medium Investment LRT Alternative, and the Low Investment LRT and High Investment BRT, which attract approximately the same number of riders. All of the Build Alternatives, except the Low Investment BRT, have the same top three stations for daily boardings: the western terminus in Bethesda (north or south), the Silver Spring Transit Center, and the College Park Metro Station. For the Low Investment BRT Alternative, the top three stations for daily boardings are the Silver Spring Transit Center, US 1 and College Park Metro Station. Station Mode of Access At all the stations along the Purple Line alternatives, walk and feeder bus access would be the principal means of access and egress. At the Bethesda, Silver Spring, College Park, and New Carrollton Stations, transfer with Metrorail would be the major connection. With the exception of Bethesda, MARC connections would also be available at those stations. Major bus interfaces will occur at Bethesda, Silver Spring, Takoma/Langley, College Park, and New Carrollton stations. All these connections are with existing services. Some of the existing bus services will be modified to better integrate with the Purple Line stations. Some existing bus services that duplicate the Purple Line service may be cut back. While parking facilities exist at the four Metrorail stations that connect with the Purple Line, no new park-and-ride facilities would be provided at any of the Purple Line stations. Some kiss-and-ride could occur at some of stations, as occurs today at some bus stops, but additional kiss-and-ride facilities are being considered at Connecticut Avenue at the Georgetown Branch right-of-way, and at Lyttonsville. Travel Demand Forecasting Technical Report Page 2-15
34 Table 2-10: Year 2030 Build Alternatives Daily Boardings Segment TSM Low Invest. BRT Medium Invest. BRT High Invest. BRT Low Invest. LRT Medium Invest. LRT High Invest. LRT Bethesda Metro, North Entrance 800 1,400 5,600 6,000 N/A N/A N/A Medical Center Metro N/A 3,900 N/A N/A N/A N/A N/A Bethesda Metro, South Entrance N/A N/A 2,800 3,000 11,300 12,700 13,300 Montgomery Avenue 100 N/A N/A N/A N/A N/A N/A Connecticut Avenue Grubb Road 500 N/A N/A N/A N/A N/A N/A Lyttonsville N/A Woodside/16 th Street N/A 1,400 2,000 2,500 2,200 2,300 2,400 Silver Spring Transit Center ,100 8,700 10,400 11,100 12,200 13,600 Fenton Street N/A N/A Dale Drive 500 1,200 1,300 1,400 1,300 1,400 1,500 Manchester Place , ,200 Arliss Street ,700 1,300 1,500 2,200 Gilbert Street ,300 1,200 1,200 1,400 Takoma/Langley Transit Center ,400 2,300 3,200 2,700 3,000 3,700 Riggs Road Adelphi Road UM Campus Center 600 1,500 2,100 2,200 2,100 2,200 2,200 US 1 East Campus 700 4,400 4,400 4,700 4,500 4,500 4,700 College Park Metro ,000 8,600 9,100 8,600 8,600 8,900 River Road 500 1,500 1,500 1,500 1,500 1,500 1,500 Riverdale Park 600 1,400 1,500 1,600 1,600 1,500 1,600 Riverdale Road Annapolis Road ,100 1,200 1,000 1,000 1,200 New Carrollton Metro 1,700 3,100 3,800 4,500 3,800 3,700 4,500 Total Boardings 14,800 40,000 51,800 58,800 59,300 62,600 68,100 Page 2-16 Travel Demand Forecasting Technical Report
35 University of Maryland Student Travel The travel of University of Maryland employees, faculty, and staff to and from the campus is captured within the regional travel model forecasts and these trips are included in the forecasts for the Purple Line. Many of the 36,000 students live on campus or in nearby housing within walking distance of the campus. Others live off campus and commute to school. These trips are not as concentrated in the peak periods as employee trips and are not as regular, given that the university is not in full session over the summer and various break periods. A portion of these commuting students would use the UM shuttle, TheBus and WMATA bus services. The UM Shuttle does provide connecting services to the College Park Metrorail Station and downtown Silver Spring, including the Metrorail station. On-campus students also use the existing bus services to access off-campus destinations, including the College Park and Silver Spring Metro Stations. Many of these trips again occur outside the normal commuting peak periods in evenings and on weekends. The UM Shuttle provides a regular and relatively frequent service between the campus and the College Park Metrorail station throughout most of the day, carrying about 3,000 trips on a typical day. The service connecting with Silver Spring carries about 500 trips on a typical day. According to the Shuttle operator, approximately half of the users are students, or about 1,700 per day. With the Purple Line in place, these shuttle services would be discontinued or re-routed and these 1,700 would likely use the Purple Line. Some portion of these trips is likely already included in the regional model forecasts. As noted earlier, the University faculty and staff are fully accounted for by the regional forecasting model. For the purposes of the comparison of the alternatives, the analysis assumes that these trips are included in the regional forecasts and would be similar across all the alternatives. For the travel forecast for the further development of the Locally Preferred Alternative, a separate student trip purpose forecast will be developed. Special Event and Special Generators Trips Venues such as sport stadiums and arenas and events such as major festival or holiday fireworks displays generate trips that may not be included in the regional travel forecasting process. Washington, DC is the site of many of special events and special generators that occur with enough regularity and frequency that these are included in the regional model forecasts. Within the corridor, the principal special event and special trip generator venue is the University of Maryland campus in College Park, with Byrd Stadium, Comcast Center, and Clarice Smith Performing Arts Center. Byrd Stadium seats 50,000 people and hosts five to seven home weekend football games annually. The UM Shuttle carries a total of 2,000-3,000 trips (i.e. 1,000 to 1,500 individuals) for each game. This would mean that between 2 and 3 percent of the total attendance uses the Shuttle. For basketball, soccer, lacrosse, field hockey, and events at the Clarice Smith Performing Arts Center, shuttle ridership is relatively low. While the University of Maryland does not have actual records, on an annual basis the total number of special event and special generator trips on the Shuttle is between 40,000 to 50,000. Not all these trips would be candidates for the Purple Line; however, the Purple Line could make using transit for these Travel Demand Forecasting Technical Report Page 2-17
36 types of trips associated with the University of Maryland more attractive, especially if the Purple Line is centrally located on Campus Drive. Most of these trips will be outside the normal weekday peak period, being on weekday evenings and on weekends. Averaging out over a typical weekday, these trips would represent about 170 trips, which is less than one percent of the daily usage of the Purple Line alternatives. So, while the Purple Line would provide an improved and attractive means of accessing the events at the University of Maryland and other venues, the amount will be a relatively small compared to the total usage Transportation System User Benefits Transportation system user benefit is a measure of benefits that would accrue to users of the transportation system as a result of implementing an alternative. The users include both existing system users such as existing transit riders who might benefit from a faster trip or more convenient access to the service, as well as new transit users. These benefits include both time and monetary costs and are expressed in terms of minutes saved. The user benefit is calculated within the region s mode choice model for all alternatives and uses a measure of the traveler s value of time to convert monetary and other costs to their equivalence in time, which is added to actual time savings. Additional user benefits can accrue to users of fixed guideway transit services due to attributes of these systems not reflected strictly in terms of travel times and outof-pocket costs. These are referred to as mode specific attributes and account for perceived benefits that users feel they receive for amenity, comfort, reliability, safety and other characteristics associated with the mode. The degree to which these additional benefits accrue to the users depends on the definitions of the alternatives. These would accrue to all the BRT and LRT alternative users to varying degrees depending on the specific attributes of the alternative. In this way, the measure includes a more comprehensive accounting of the total costs of travel. Table 2-11 shows the total user benefits for the TSM and each of the Build Alternatives. As the table shows, the TSM alternative would generate more than 400,000 minutes of user benefit (about 6,700 hours) to travelers in the Washington metropolitan area each day. All of the Build Alternatives would generate higher user benefits than the TSM. The Low Investment BRT alternative would offer 75 percent more user benefits than the TSM, while the High Investment LRT Alternative would generate 271% more user benefits over the TSM alternative. Page 2-18 Travel Demand Forecasting Technical Report
37 Table 2-11: Year 2030 Daily Transportation System User Benefits with Mode Specific Attributes Daily User Benefits (minutes) Increase in Daily User Benefits over TSM (minutes) Percent over TSM TSM 401, Low Investment BRT 702, ,100 75% Medium Investment BRT 1,022, , % High Investment BRT 1,258, , % Low Investment LRT 1,180, , % Medium Investment LRT 1,303, , % High Investment LRT 1,489,600 1,088, % Farebox Revenue Farebox revenues are those that are collected from passengers using the transit services for making trips. People use a variety of means to pay fares, including cash, tokens, passes, and electronic farecards. Passes and farecards for multi-trip, or weekly and monthly periods are typically purchased at a discount. Fares revenues include both fares at the initial boarding of the trip as well any transfer costs. The Purple Line corridor has a number of transit operators including WMATA, MARC, Ride On, and TheBus. For the purposes of this analysis, the operator of the Purple Line would be the MTA. With the increase in systemwide transit users forecasted for the alternatives, the increase in systemwide farebox revenues relative to the 2030 No Build are presented in Table Table 2-12: Year 2030 Annual Change in Systemwide Farebox Revenues by Alternative Relative to No Build Alternative Annual Change TSM $3,423,000 Low Investment BRT $5,829,000 Medium Investment BRT $7,500,000 High Investment BRT $8,452,000 Low Investment LRT $8,921,000 Medium Investment LRT $9,3556,000 High Investment LRT $10,167,000 Travel Demand Forecasting Technical Report Page 2-19
38
39 3. Supplemental Forecast Input and Results by Alternative The following section provides for each alternative further information and assumptions used as input to the travel forecasts, as well as more detailed forecasts results which supplement the information provided in the previous section No Build Assumptions The 2030 No Build network consisted of the Metropolitan Washington Council of Governments (MWCOG) officially adopted 2030 network as provided in the MWCOG model version 2.1D#50 with the following changes: Zone realignments and subdivisions in Montgomery County and the requisite network changes, Network corrections as identified by Michael Baker Corporation in conjunction with Montgomery County, Removal of the CCT transit network coding from the Long Range Plan Removal of the Anacostia LRT Table 3-1: Year 2030 Trips (Linked) by Transit Mode No Build Access Mode HBW-PK HBW-OP HBO-PK HBO-OP NHB-PK NHB-OP TOTAL Bus Walk 149,006 63,632 83,804 49,107 42,604 26, ,402 Park-n-Ride 14, ,784 1,447 2, ,077 Kiss-n-Ride 7,057 1,378 1, ,407 Total 170,341 65,798 87,576 51,552 45,358 27, ,886 Metrorail Walk 252,173 68,182 50,200 53,765 64,583 67, ,175 Park-n-Ride 162,233 24,855 11,619 16,206 10,014 9, ,118 Kiss-n-Ride 46,628 7,043 2,890 3,161 5,593 3,957 69,272 Total 461, ,080 64,709 73,132 80,190 80, ,565 Commuter Rail Walk 5, ,918 Park-n-Ride 37, ,305 Kiss-n-Ride 3, ,721 Total 46,626 1, ,944 TOTAL 678, , , , , ,681 1,355,395 Travel Demand Forecasting Technical Report Page 3-1
40 Table 3-2: Year 2030 Background Buses (Total Boardings) No Build Route Boardings C02 5,960 C04 3,952 F04 5,877 F06 3,701 GO1 85 J01 9,514 J02 6,996 J03 1,924 O1 3,244 Table 3-3: Year 2030 Metrorail (Boardings in Corridor Stations) No Build Station Boardings Bethesda 18,108 College Park 5,610 Medical Center 10,169 New Carrollton 8,105 Silver Spring 21,384 Table 3-4: Year 2030 Commuter Rail (Boardings in Corridor Stations) No Build Station Boardings College Park 225 New Carrollton 12 Silver Spring 335 Page 3-2 Travel Demand Forecasting Technical Report
41 3.2. TSM Table 3-5: Coding Assumptions - TSM Assumptions (min.) -- Headway: pk=6, op=12 Runtime: pk=71, op=66 Station Headed to: Anode Bnode Miles Time Speed Bethesda North Montgomery Ave Montgomery Ave. Conn. Ave Conn. Ave. Grubb Road Grubb Road Silver Spring T.C Silver Spring T.C. Fenton St Fenton St. Sligo Creek Parkway Sligo Creek Parkway Piney Branch & Arliss St Piney Branch & Arliss St. Piney Branch & University Piney Branch & University University & Carroll Ave University & Carroll Ave. Takoma/Langley T.C Takoma/Langley T.C. Riggs Rd Riggs Rd. Adelphi Rd Adelphi Rd. UMD Campus Center UMD Campus Center UMD East UMD East College Park College Park River Rd River Rd. Riverdale Park Riverdale Park Riverdale Road Riverdale Road Annapolis Rd Annapolis Rd. New Carrollton Table 3-6: Year 2030 Trips (Linked) by Transit Mode TSM Access Mode HBW-PK HBW-OP HBO-PK HBO-OP NHB-PK NHB-OP TOTAL Bus Walk 152,024 63,364 86,292 48,812 43,826 26, ,325 Park-n-Ride 14, ,779 1,428 1, ,151 Kiss-n-Ride 6,856 1,393 1, ,169 Total 173,349 65,524 90,068 51,239 46,487 26, ,645 Metrorail Walk 253,357 69,223 52,739 52,770 64,210 69, ,508 Park-n-Ride 158,630 25,633 11,905 16,041 10,051 8, ,802 Kiss-n-Ride 46,343 6,854 2,826 3,093 5,648 3,884 68,648 Total 458, ,710 67,470 71,903 79,909 81, ,958 Commuter Rail Walk 8, ,331 Park-n-Ride 36, ,147 Kiss-n-Ride 3, ,505 Total 47,922 1, ,983 TOTAL 679, , , , , ,613 1,363,586 Travel Demand Forecasting Technical Report Page 3-3
42 Table 3-7: User Benefits - TSM Description HBW-PK HBW-OP HBO-PK HBO-OP NHB-PK NHB-OP TOTAL Total User Benefits 38, ,665 11, ,813 5,122 37, ,024 Capped User Benefits 37, ,711 9, ,416 4,930 36, ,449 Percent of Total 9.4% 49.0% 2.3% 29.0% 1.2% 9.1% 100.0% Percent Capped 1.7% 2.0% 22.6% 4.4% 3.7% 1.8% 3.3% Table 3-8: Year 2030 Background Buses (Total Boardings) - TSM Route Boardings C02 4,952 C04 3,860 F04 4,506 F06 2,837 GO17 64 J01 9,313 J02 5,765 J03 1,821 Table 3-9: Year 2030 Metrorail (Boardings in Corridor Stations) - TSM Station Boardings Bethesda 18,373 College Park 5,266 Medical Center 10,200 New Carrollton 7,969 Silver Spring 20,869 Table 3-10: Year 2030 Commuter Rail (Boardings in Corridor Stations) - TSM Station Boardings College Park 21 New Carrollton 12 Silver Spring 331 Page 3-4 Travel Demand Forecasting Technical Report
43 3.3. Low Investment BRT Table 3-11: Coding Assumptions - Low Investment BRT Assumptions (min.) -- Headway: pk=6, op=12 Runtime: 73 Station Headed to: Anode Bnode Miles Time Speed Bethesda North Medical Center Medical Center Connecticut Avenue North Connecticut Avenue North Lyttonsville Lyttonsville 16th Street th Street SSTC North SSTC North Fenton Street North Fenton Street North Dale Drive Dale Drive Manchester Place Manchester Place Arliss Street Arliss Street Gilbert Street Gilbert Street Takoma Langley Transit Ctr Takoma Langley Transit Ctr Riggs Road Riggs Road Adelphi Road Adelphi Road U of MD Campus Center U of MD Campus Center U of MD Route U of MD Route 1 College Park - U of MD [East] College Park - U of MD [East] River Road River Road Riverdale Park Riverdale Park Riverdale Road Riverdale Road Annapolis Road Annapolis Road New Carrollton Travel Demand Forecasting Technical Report Page 3-5
44 Table 3-12: Year 2030 Trips (Linked) by Transit Mode - Low Investment BRT Access Mode HBW-PK HBW-OP HBO-PK HBO-OP NHB-PK NHB-OP TOTAL Bus Walk 147,059 58,781 84,118 45,717 42,889 24, ,435 Park-n-Ride 14, ,768 1,386 1, ,911 Kiss-n-Ride 6,785 1,393 1, ,050 Total 168,155 60,941 87,872 48,076 45,527 25, ,396 Metrorail Walk 254,149 67,605 52,936 52,809 64,817 69, ,603 Park-n-Ride 157,653 25,666 11,534 15,697 9,984 8, ,962 Kiss-n-Ride 46,226 6,849 2,788 3,077 5,661 3,891 68,492 Total 458, ,120 67,257 71,583 80,463 81, ,057 Commuter Rail Walk 6,713 3,760 3,261 1,917 1, ,630 Park-n-Ride 2, ,482 Kiss-n-Ride Total 9,280 4,547 3,949 2,383 1, ,397 BRT Walk 6,713 3,760 3,261 1,917 1, ,630 Park-n-Ride 2, ,482 Kiss-n-Ride Total 9,280 4,547 3,949 2,383 1, ,397 Total 683, , , , , ,373 1,366,773 Page 3-6 Travel Demand Forecasting Technical Report
45 Table 3-13: Year 2030 Boardings (Station to Station) - Low Investment BRT Total 1: Bethesda No ,435 2: Medical CTR , ,904 3: Conn Ave : Lyttonsville : 16th Street ,437 6: SSTC No 568 1, ,997 7: Fenton St : Dale Drive ,154 9: Manchester Pl : Arliss Street : Gilbert St : Takoma/Langley ,373 13: Riggs Rd : Adelphi Rd : UMD Center ,488 16: UMD US , ,392 17: College Park , ,104 7,916 18: River Rd ,447 19: Riverdale Park ,440 20: Riverdale Rd : Annapolis Rd : New Carrollton , ,096 Total 1,435 3, ,437 4, , , ,488 4,392 7,916 1,447 1, ,096 39,828 Travel Demand Forecasting Technical Report Page 3-7
46 Table 3-14: Year 2030 User Benefits - Low Investment BRT Description HBW-PK HBW-OP HBO-PK HBO-OP NHB-PK NHB-OP TOTAL Total User Benefits 268,103 (76,643) 80,937 (45,684) 37,204 (8,105) 255,812 Capped User Benefits 261,168 (81,125) 71,934 (55,489) 35,235 (9,237) 222,486 Percent of Total 117.4% -36.5% 32.3% -24.9% 15.8% -4.2% 100.0% Percent Capped 2.6% 0.0% 11.1% 0.0% 5.3% 0.0% 13.0% Table 3-15: Year 2030 Background Buses (Total Boardings) Low Investment BRT Route Boardings C02 5,058 C04 3,805 F04 3,375 F06 1,871 GO17 33 J01 8,820 J02 6,062 J03 1,773 Table 3-16: Year 2030 Metrorail (Boardings in Corridor Stations) Low Investment BRT Station Boardings Bethesda 17,313 College Park 9,938 Medical Center 12,431 New Carrollton 8,359 Silver Spring 20,779 Table 3-17: Year 2030 Commuter Rail (Boardings in Corridor Stations) Low Investment BRT Station Boardings College Park 65 New Carrollton 14 Silver Spring 315 Page 3-8 Travel Demand Forecasting Technical Report
47 3.4. Medium Investment BRT Table 3-18: Coding Assumptions - Medium Investment BRT Assumptions (min.) -- Headway: pk=6, op=12 Runtime: 64 Station Headed to: Anode Bnode Miles Time Speed Bethesda North Bethesda South Bethesda South Connecticut Avenue South Connecticut Avenue South Lyttonsville Lyttonsville 16th Street th Street SSTC South SSTC South Fenton Street North Fenton Street North Dale Drive Dale Drive Manchester Place Manchester Place Arliss Street Arliss Street Gilbert Street Gilbert Street Takoma Langley Transit Ctr Takoma Langley Transit Ctr Riggs Road Riggs Road Adelphi Road Adelphi Road U of MD Campus Center U of MD Campus Center East Campus East Campus College Park - U of MD [West] College Park - U of MD [West] River Road River Road Riverdale Park Riverdale Park Riverdale Road Riverdale Road Annapolis Road Annapolis Road New Carrollton Travel Demand Forecasting Technical Report Page 3-9
48 Bus Table 3-19: Year 2030 Trips (Linked) by Transit Mode - Medium Investment BRT Access Mode HBW-PK HBW-OP HBO-PK HBO-OP NHB-PK NHB-OP TOTAL Walk 145,548 58,229 83,603 45,440 42,530 24, ,049 Park-n-Ride 14, ,766 1,384 1, ,779 Kiss-n-Ride 6,741 1,390 1, ,992 Total 166,502 60,384 87,350 47,795 45,135 25, ,820 Metrorail Walk 254,633 67,588 52,976 52,888 65,358 69, ,005 Park-n-Ride 157,432 25,594 11,433 15,514 10,031 8, ,371 Kiss-n-Ride 46,209 6,844 2,789 3,090 5,670 3,905 68,506 Total 458, ,025 67,197 71,493 81,058 81, ,882 Commuter Rail Walk 8, ,333 Park-n-Ride 36, ,095 Kiss-n-Ride 3, ,510 Total 47, ,937 BRT Walk 8,965 4,796 4,299 2,570 1,381 1,109 23,120 Park-n-Ride 3, ,596 Kiss-n-Ride Total 12,212 5,684 5,111 3,150 1,653 1,255 29,064 TOTAL 684, , , , , ,743 1,370,703 Page 3-10 Travel Demand Forecasting Technical Report
49 Table 3-20: Year 2030 Boardings (Station to Station) - Medium Investment BRT Total 1: Bethesda No , ,532 2: Bethesda So , ,388 3: Conn Ave : Lyttonsville : 16th St ,885 6: SSTC So 3,175 1, ,671 7: Fenton St : Dale Drive ,304 9: Manchester Pl : Arliss St : Gilbert St : Takoma/Langley ,325 13: Riggs Rd : Adelphi Rd : UMD , ,062 16: East Campus , ,423 17: College Park ,157 2, ,370 8,533 18: River Rd ,477 19: Riverdale Park ,516 20: Riverdale Rd : Annapolis Rd : New Carrollton , ,750 Total 5,532 2, ,885 8, , , ,062 4,423 8,533 1,477 1, ,750 51,104 Travel Demand Forecasting Technical Report Page 3-11
50 Table 3-21: Year 2030 User Benefits - Medium Investment BRT Description HBW-PK HBW-OP HBO-PK HBO-OP NHB-PK NHB-OP TOTAL Total User Benefits 383,142 (41,805) 112,277 (26,406) 62,354 6, ,978 Capped User Benefits 373,866 (47,668) 98,315 (39,128) 59,703 4, ,073 Percent of Total 83.1% -10.6% 21.8% -8.7% 13.3% 1.1% 100.0% Percent Capped 2.4% 0.0% 12.4% 0.0% 4.3% 22.3% 9.3% Table 3-22: Year 2030 Background Buses (Total Boardings) Medium Investment BRT Route Boardings C02 4,857 C04 3,716 F04 3,133 F06 1,838 GO17 33 J01 8,295 J02 5,147 J03 1,574 Table 3-23: Year 2030 Metrorail (Boardings in Corridor Stations) Medium Investment BRT Station Boardings Bethesda 20,920 College Park 10,271 Medical Center 10,577 New Carrollton 8,248 Silver Spring 20,890 Table 3-24: Year 2030 Commuter Rail (Boardings in Corridor Stations) - Medium Investment BRT Station Boardings College Park 77 New Carrollton 16 Silver Spring 299 Page 3-12 Travel Demand Forecasting Technical Report
51 3.5. High Investment BRT Table 3-25: Coding Assumptions - High Investment BRT Assumptions (min.) -- Headway: pk=6, op=12 Runtime: 57 Station Headed to: Anode Bnode Miles Time Speed Bethesda North Bethesda South Bethesda South Connecticut Avenue South Connecticut Avenue South Lyttonsville Lyttonsville 16th Street th Street SSTC South SSTC South Dale Drive Dale Drive Manchester Place Manchester Place Arliss Street Arliss Street Gilbert Street Gilbert Street Takoma Langley Transit Ctr Takoma Langley Transit Ctr Riggs Road Riggs Road Adelphi Road Adelphi Road U of MD Campus Center U of MD Campus Center East Campus East Campus College Park - U of MD [West] College Park - U of MD [West] River Road River Road Riverdale Park Riverdale Park Riverdale Road Riverdale Road Annapolis Road Annapolis Road New Carrollton Travel Demand Forecasting Technical Report Page 3-13
52 Bus Table 3-26: Year 2030 Trips (Linked) - High Investment BRT Access Mode HBW-PK HBW-OP HBO-PK HBO-OP NHB-PK NHB-OP TOTAL Walk 44,941 57,950 83,323 45,304 42,456 24, ,641 Park-n-Ride 14, ,763 1,383 1, ,754 Kiss-n-Ride 6,733 1,388 1, ,978 Total 165,868 60,102 87,065 47,658 45,058 25, ,373 Metrorail Walk 254,448 67,399 52,979 52,985 65,394 69, ,800 Park-n-Ride 157,256 25,547 11,451 15,579 10,039 8, ,243 Kiss-n-Ride 46,182 6,836 2,789 3,091 5,672 3,907 68,477 Total 457,886 99,782 67,220 71,654 81,105 81, ,520 Commuter Rail Walk 8, ,364 Park-n-Ride 36, ,109 Kiss-n-Ride 3, ,512 Total 47, ,984 BRT Walk 10,705 5,718 4,928 2,902 1,557 1,214 27,023 Park-n-Ride 3, ,785 Kiss-n-Ride Total 14,112 6,647 5,750 3,458 1,856 1,359 33,182 TOTAL 685, , , , , ,855 1,373,060 Page 3-14 Travel Demand Forecasting Technical Report
53 Table 3-27: Year 2030 Boardings (Station to Station) - High Investment BRT Total 1: Bethesda No , ,981 2: Bethesda So , ,515 3: Conn Ave So : Lyttonsville : 16th St ,961 6: SSTC So 3,043 1, ,387 8: Dale Drive ,417 9: Manchester Road ,104 10: Arliss St ,729 11: Gilbert St ,295 12: Takoma/Langley ,212 13: Riggs Rd : Adelphi Rd : UM ,197 16: East Campus , ,654 17: College Park , ,672 9,025 18: River Rd ,527 19: Riverdale Park ,598 20: Riverdale Rd : Annapolis Rd ,122 22: New Carrollton , ,452 Total 5,981 2, ,961 10,387 1,417 1,104 1,729 1,295 3, ,197 4,654 9,025 1,527 1, ,122 4,452 57,854 Travel Demand Forecasting Technical Report Page 3-15
54 Table 3-28: Year 2030 User Benefits - High Investment BRT Description HBW-PK HBW-OP HBO-PK HBO-OP NHB-PK NHB-OP TOTAL Total User Benefits 452,969 (9,264) 132,337 (10,503) 69,041 10, ,063 Capped User Benefits 442,243 (15,948) 116,728 (24,370) 65,588 8, ,043 Percent of Total 74.6% -2.7% 19.7% -4.1% 11.1% 1.5% 100.0% Percent Capped 2.4% 0.0% 11.8% 0.0% 5.0% 16.0% 8.1% Table 3-29: Year 2030 Background Buses (Total Boardings) High Investment BRT Route Boardings C02 4,763 C04 3,589 F04 2,908 F06 1,766 GO17 32 J01 8,269 J02 5,120 J03 1,562 Table 3-30: Year 2030 Metrorail (Boardings in Corridor Stations) High Investment BRT Station Boardings Bethesda 21,288 College Park 10,468 Medical Center 10,583 New Carrollton 8,223 Silver Spring 21,262 Table 3-31: Year 2030 Commuter Rail (Boardings in Corridor Stations) - High Investment BRT Station Boardings College Park 87 New Carrollton 16 Silver Spring 295 Page 3-16 Travel Demand Forecasting Technical Report
55 3.6. Low Investment LRT Table 3-32: Coding Assumptions - Low Investment LRT Assumptions (min.) -- Headway: pk=6, op=12 Runtime: 59 Station Headed to: Anode Bnode Miles Time Speed Bethesda South Connecticut Avenue South Connecticut Avenue South Lyttonsville Lyttonsville 16th Street th Street SSTC South SSTC South Fenton Street South Fenton Street South Dale Drive Dale Drive Manchester Place Manchester Place Arliss Street Arliss Street Gilbert Street Gilbert Street Takoma Langley Transit Ctr Takoma Langley Transit Ctr Riggs Road Riggs Road Adelphi Road Adelphi Road U of MD Campus Center U of MD Campus Center East Campus East Campus College Park - U of MD [West] College Park - U of MD [West] River Road River Road Riverdale Park Riverdale Park Riverdale Road Riverdale Road Annapolis Road Annapolis Road New Carrollton Travel Demand Forecasting Technical Report Page 3-17
56 Table 3-33: Year 2030 Trips (Linked) by Transit Mode - Low Investment LRT Access Mode HBW-PK HBW-OP HBO-PK HBO-OP NHB-PK NHB-OP TOTAL Bus Walk 144,810 57,942 83,317 45,316 42,414 24, ,437 Park-n-Ride 14, ,765 1,384 1, ,757 Kiss-n-Ride 6,731 1,389 1, ,980 Total 165,733 60,096 87,063 47,672 45,018 25, ,174 Metrorail Walk 254,929 67,387 53,028 53,014 65,525 69, ,653 Park-n-Ride 157,506 25,576 11,487 15,586 10,064 8, ,617 Kiss-n-Ride 46,185 6,838 2,792 3,087 5,674 3,908 68,485 Total 458,621 99,802 67,307 71,686 81,263 82, ,755 Commuter Rail Walk 8, ,327 Park-n-Ride 36, ,098 Kiss-n-Ride 3, ,510 Total 47, ,935 LRT Walk 10,347 5,702 4,885 2,881 1,593 1,244 26,651 Park-n-Ride 3, ,694 Kiss-n-Ride Total 13,810 6,634 5,650 3,412 1,874 1,371 32,751 TOTAL 686, , , , , ,038 1,373,614 Page 3-18 Travel Demand Forecasting Technical Report
57 Table 3-34: Year 2030 Boardings (Station to Station) - Low Investment LRT Total 2: Bethesda So , ,303 3: Conn Ave So : Lyttonsville : 16th St ,186 6: SSTC So 6, ,082 7: Fenton St So : Dale Drive ,341 9: Manchester Pl : Arliss St ,281 11: Gilbert St ,207 12: Tak/Lang ,651 13: Riggs Rd : Adelphi Rd : UMD , ,090 16: East Campus , ,516 17: College Park ,102 2, ,455 8,503 18: River Rd ,483 19: Riverdale Park ,557 20: Riverdale Rd : Annapolis Rd ,042 22: New Carroll , ,798 Total 11, ,186 11, , ,281 1,207 2, ,090 4,516 8,503 1,483 1, ,042 3,798 59,110 Travel Demand Forecasting Technical Report Page 3-19
58 Table 3-35: Year 2030 User Benefits - Low Investment LRT Description HBW-PK HBW-OP HBO-PK HBO-OP NHB-PK NHB-OP TOTAL Total User Benefits 478,705 (8,484) 131,866 (10,328) 75,702 18, ,518 Capped User Benefits 467,783 (14,723) 116,088 (24,464) 71,753 16, ,551 Percent of Total 74.0% -2.3% 18.4% -3.9% 11.3% 2.5% 100.0% Percent Capped 2.3% 0.0% 12.0% 0.0% 5.2% 10.8% 7.7% Table 3-36: Year 2030 Background Buses (Total Boardings) - Low Investment LRT Route Boardings C02 4,846 C04 3,666 F04 3,099 F06 1,835 GO1 32 J01 7,979 J02 4,892 J03 1,453 Table 3-37: Year 2030 Metrorail (Boardings in Corridor Stations) - Low Investment LRT Station Boardings Bethesda 22,120 College Park 10,211 Medical Center 10,822 New Carrollton 8,244 Silver Spring 21,807 Table 3-38: Year 2030 Commuter Rail (Boardings in Corridor Stations) - Low Investment LRT Station Boardings College Park 79 New Carrollton 16 Silver Spring 293 Page 3-20 Travel Demand Forecasting Technical Report
59 3.7. Medium Investment LRT Table 3-39: Coding Assumptions - Medium Investment LRT Assumptions (min.) -- Headway: pk=6, op=12 Runtime: 52 Station Headed to: Anode Bnode Miles Time Speed Bethesda South Connecticut Avenue South Connecticut Avenue South Lyttonsville Lyttonsville 16th Street th Street SSTC South SSTC South Fenton Street South Fenton Street South Dale Drive Dale Drive Manchester Place Manchester Place Arliss Street Arliss Street Gilbert Street Gilbert Street Takoma Langley Transit Ctr Takoma Langley Transit Ctr Riggs Road Riggs Road Adelphi Road Adelphi Road U of MD Campus Center U of MD Campus Center East Campus East Campus College Park - U of MD [West] College Park - U of MD [West] River Road River Road Riverdale Park Riverdale Park Riverdale Road Riverdale Road Annapolis Road Annapolis Road New Carrollton Travel Demand Forecasting Technical Report Page 3-21
60 Table 3-40: Year 2030 Trips (Linked) by Transit Mode - Medium Investment LRT Access Mode HBW-PK HBW-OP HBO-PK HBO-OP NHB-PK NHB-OP TOTAL Bus Walk 144,551 57,837 83,202 45,262 42,362 24, ,828 Park-n-Ride 14, ,765 1,384 1, ,743 Kiss-n-Ride 6,727 1,388 1, ,974 Total 165,458 59,990 86,947 47,618 44,966 25, ,546 Metrorail Walk 254,998 67,403 53,036 53,085 65,607 69, ,982 Park-n-Ride 157,413 25,556 11,464 15,556 10,062 8, ,444 Kiss-n-Ride 46,171 6,836 2,793 3,089 5,676 3,910 68,475 Total 458,582 99,795 67,293 71,730 81,345 82, ,901 Commuter Rail Walk 8, ,314 Park-n-Ride 36, ,106 Kiss-n-Ride 3, ,510 Total 47, ,929 LRT Walk 10,889 5,931 5,120 2,982 1,678 1,302 27,901 Park-n-Ride 3, ,901 Kiss-n-Ride Total 14,486 6,891 5,917 3,532 1,964 1,436 34,225 TOTAL 686, , , , , ,158 1,374,601 Page 3-22 Travel Demand Forecasting Technical Report
61 Table 3-41: Year 2030 Boardings (Station to Station) - Medium Investment LRT Total 2: Bethesda So ,029 7, ,692 3: Conn Ave : Lyttonsville : 16th St 1, ,336 6: SSTC 7, ,126 7: Fenton St : Dale Dr ,381 9: Manchester Pl : Arliss St ,546 11: Gilbert St ,142 12: Tak/Lang ,031 13: Riggs Rd : Adelphi Rd : UMD , ,144 16: East Campus , ,534 17: College Park ,023 2, ,362 8,513 18: River Rd ,481 19: Riverdale Park ,545 20: Riverdale Rd : Annapolis Rd ,006 22: New Carroll , ,707 Total 12, ,336 12, , ,546 1,142 3, ,144 4,534 8,513 1,481 1, ,006 3,707 62,488 Travel Demand Forecasting Technical Report Page 3-23
62 Table 3-42: Year 2030 User Benefits - Medium Investment LRT Description HBW-PK HBW-OP HBO-PK HBO-OP NHB-PK NHB-OP TOTAL Total User Benefits 509,171 2, ,494 (4,831) 81,341 22, ,668 Capped User Benefits 498,269 (3,697) 123,509 (19,078) 77,133 20, ,993 Percent of Total 71.5% -0.5% 17.7% -2.7% 11.1% 3.0% 100.0% Percent Capped 2.1% 0.0% 11.5% 0.0% 5.2% 9.1% 7.2% Table 3-43: Year 2030 Background Buses (Total Boardings) - Medium Investment LRT Route Boardings C02 4,799 C04 3,630 F04 3,123 F06 1,836 GO17 32 J01 7,785 J02 4,815 J03 1,434 Table 3-44: Year 2030 Metrorail (Boardings in Corridor Stations) - Medium Investment LRT Station Boardings Bethesda 22,757 College Park 10,180 Medical Center 10,846 New Carrollton 8,246 Silver Spring 21,909 Table 3-45: Year 2030 Commuter Rail (Boardings in Corridor Stations) - Medium Investment LRT Station Boardings College Park 79 New Carrollton 16 Silver Spring 290 Page 3-24 Travel Demand Forecasting Technical Report
63 3.8. High Investment LRT Table 3-46: Coding Assumptions High Investment LRT Assumptions (min.) -- Headway: pk=6, op=12 Runtime: 46 Station Headed to: Anode Bnode Miles Time Speed Bethesda South Connecticut Avenue South Connecticut Avenue South Lyttonsville Lyttonsville 16th Street th Street SSTC South SSTC South Dale Drive Dale Drive Manchester Place Manchester Place Arliss Street Arliss Street Gilbert Street Gilbert Street Takoma Langley Transit Ctr Takoma Langley Transit Ctr Riggs Road Riggs Road Adelphi Road Adelphi Road U of MD Campus Center U of MD Campus Center East Campus East Campus College Park - U of MD [West] College Park - U of MD [West] River Road River Road Riverdale Park Riverdale Park Riverdale Road Riverdale Road Annapolis Road Annapolis Road New Carrollton Travel Demand Forecasting Technical Report Page 3-25
64 Table 3-47: Year 2030 Trips (Linked) by Transit Mode - High Investment LRT Access Mode HBW-PK HBW-OP HBO-PK HBO-OP NHB-PK NHB-OP TOTAL Bus Walk 144,166 57,676 83,015 45,168 42,308 24, ,925 Park-n-Ride 14, ,764 1,385 1, ,728 Kiss-n-Ride 6,721 1,387 1, ,964 Total 165,052 59,827 86,757 47,525 44,909 25, ,617 Metrorail Walk 255,110 67,494 53,089 53,237 65,666 69, ,498 Park-n-Ride 157,301 25,526 11,500 15,624 10,076 8, ,425 Kiss-n-Ride 46,175 6,840 2,813 3,104 5,684 3,917 68,533 Total 458,586 99,860 67,403 71,964 81,427 82, ,456 Commuter Rail Walk 8, ,337 Park-n-Ride 36, ,109 Kiss-n-Ride 3, ,509 Total 47, ,956 LRT Walk 11,974 6,326 5,523 3,180 1,805 1,379 30,186 Park-n-Ride 3, ,807 Kiss-n-Ride Total 15,653 7,300 6,233 3,652 2,103 1,500 36,441 TOTAL 687, , , , , ,263 1,376,470 Page 3-26 Travel Demand Forecasting Technical Report
65 Table 3-48: Year 2030Boardings (Station to Station) - High Investment LRT Total 2: Bethesda So ,033 7, , ,353 3: Conn Ave : Lyttonsville : 16th Street 1, ,399 6: SSTC 7, ,574 8: Dale Dr ,524 9: Manchester Pl ,168 10: Arliss Street 1, ,187 11: Gilbert Street ,354 12: Tak/Langley ,683 13: Riggs Rd : Adelphi Rd : UMD ,227 16: East Campus , ,725 17: College Park , ,703 8,897 18: River Rd ,530 19: Riverdale Park ,628 20: Riverdale Rd : Annapolis Rd ,162 22: New Carroll , ,459 Total 13, ,399 13,574 1,524 1,168 2,187 1,354 3, ,227 4,725 8,897 1,530 1, ,162 4,459 67,994 Travel Demand Forecasting Technical Report Page 3-27
66 Table 3-49: Year 2030 User Benefits - High Investment LRT Description HBW-PK HBW-OP HBO-PK HBO-OP NHB-PK NHB-OP TOTAL Total User Benefits 569,199 25, ,528 7,830 87,845 26, ,795 Capped User Benefits 556,873 18, ,850 (7,593) 82,616 24, ,639 Percent of Total 68.7% 2.3% 16.8% -0.9% 10.2% 3.0% 100.0% Percent Capped 2.2% 27.8% 10.9% 0.0% 6.0% 8.9% 6.8% Table 3-50: Year 2030 Background Buses (Total Boardings) - High Investment LRT Route Boardings C02 4,764 C04 3,566 F04 2,922 F06 1,782 GO1 30 J01 7,786 J02 4,805 J03 1,431 Table 3-51: Year 2030 Metrorail (Boardings in Corridor Stations) - High Investment LRT Station Boardings Bethesda 23,256 College Park 10,325 Medical Center 10,860 New Carrollton 8,238 Silver Spring 22,715 Table 3-52: Year 2030 Commuter Rail (Boardings in Corridor Stations) - High Investment LRT Station Boardings College Park 87 New Carrollton 17 Silver Spring 292 Page 3-28 Travel Demand Forecasting Technical Report
67 3.9. Comparative Summary Information is provided below on the background bus system as well as additional information formatted to show comparisons across alternatives Background Bus Assumptions Bus routes listed in the following table were diverted to connect to the given stations by alternative in order to provide feeder service to the Purple Line For the 2030 networks. Table 3-53: Background Bus Stations TSM Low Inv. BRT All Others Connecticut Avenue J1, J2, J3 Lyttonsville Place RO1, RO4 RO1, RO4 Grubb Road RO2 (AM) Arliss/Piney Branch RO 12, RO 13 RO 12, RO 13 RO 12, RO 13 The J4 bus route, present in the 2000 base year has been discontinued and removed from all future year forecast networks. In addition, route RO15 has been removed. For the Low BRT, route J1 has also been removed to eliminate redundant service. Travel Demand Forecasting Technical Report Page 3-29
68 Table 3-54: Year 2030 Trips, Boardings and User Benefits Version 3 TSM Low Inv. BRT Med. Inv. BRT High Inv. BRT Low Inv. LRT Med. Inv. LRT High Inv. LRT Total User Benefits (daily minutes) 414, , , , , , ,795 Capped User Benefits (daily minutes) 401, , , , , , ,639 Percent Capped 3.3% 13.0% 9.3% 8.1% 7.7% 7.2% 6.8% Baseline Linked Transit Trips 1,366,361 1,363,580 1,363,580 1,363,580 1,363,580 1,363,580 1,363,580 Build Linked Transit Trips 1,363,580 1,366,773 1,370,703 1,373,060 1,373,614 1,374,601 1,376,470 LRT/BRT Linked Trips 0 22,397 29,064 33,182 32,751 34,225 36,441 Boardings Purple Line Boardings 22,201 29,329 33,795 32,459 33,922 36,114 Purple Line Boardings in MR Paths 16,689 21,075 23,750 25,307 27,165 30,494 Purple Line Boardings in CR Paths 1,085 1,350 1,292 1,495 1,536 1,465 Route NB TSM Table 3-55: Year 2030 Background Bus Boardings (Total Daily) Low Inv. BRT Med. Inv. BRT High Inv. BRT Low Inv. LRT Med. Inv. LRT High Inv. LRT C02 5,960 4,952 5,058 4,857 4,763 4,846 4,799 4,764 C04 3,952 3,860 3,805 3,716 3,589 3,666 3,630 3,566 F04 5,877 4,506 3,375 3,133 2,908 3,099 3,123 2,922 F06 3,701 2,837 1,871 1,838 1,766 1,835 1,836 1,782 GO J01 9,514 9,313 8,820 8,295 8,269 7,979 7,785 7,786 J02 6,996 5,765 6,062 5,147 5,120 4,892 4,815 4,805 J03 1,924 1,821 1,773 1,574 1,562 1,453 1,434 1,431 RO15 3,244 Page 3-30 Travel Demand Forecasting Technical Report
69 Table 3-56: Year 2030 Metrorail Station Boardings (Total Daily) Station NB TSM Low Inv. BRT Med. Inv. BRT High Inv. BRT Low Inv. LRT Med. Inv. LRT High Inv. LRT Bethesda 18,108 18,373 17,313 20,920 21,288 22,120 22,757 23,256 College Park 5,610 5,266 9,938 10,271 10,468 10,211 10,180 10,325 Medical Center 10,169 10,200 12,431 10,577 10,583 10,822 10,846 10,860 New Carrollton 8,105 7,969 8,359 8,248 8,223 8,244 8,246 8,238 Silver Spring 21,384 20,869 20,779 20,890 21,262 21,807 21,909 22,715 Table 3-57: Year 2030 Commuter Rail Station Boardings (Total Daily) Station NB TSM Low Inv. BRT Med. Inv. BRT High Inv. BRT Low Inv. LRT Med. Inv. LRT High Inv. LRT College Park New Carrollton Silver Spring Travel Demand Forecasting Technical Report Page 3-31
70 3.11. Non-Included (Mode Specific) Attributes Non-included attribute Prem. only Table 3-58: Non-Included Attributes Prem. + local Prem. only Prem. + local Prem. only Prem. + local Prem. only Prem. + local Prem. only Prem. + local Guideway-like characteristics reliability of vehicle arrival branding/visibility/learnability schedule-free service Span of good service Passenger amenities stations/stops dynamic schedule information TOTAL IVT coefficient Prem. only Prem. + local Table 3-59: Year 2030 User Benefits Effects of Non-included Attributes TSM Low Inv. BRT Med. Inv. BRT High Inv. BRT Low Inv. LRT Med. Inv. LRT High Inv. LRT Capped User Benefits (minutes) 401, , , , , , ,639 Capped User w/ Non-Included Effects 301, , , , ,640 1,088,460 Percent Increase 35% 38% 44% 23% 30% 34% Page 3-32 Travel Demand Forecasting Technical Report
71 Appendix B


72 New Starts Travel Forecasting Model Calibration Report For Evaluating the Purple Line and the Corridor Cities Transitway Projects November 2010
73
74 Washington, D.C. Area: New Starts Travel Forecasting Model Table of Contents 1. INTRODUCTION... 1 A. PROJECT OVERVIEW... 1 B. RELATIONSHIP OF THE MWCOG AND MDAAII MODELS... 1 C. MAJOR CHANGES IN MDAAII TRANSIT SURVEY DATA AND CALIBRATION TARGETS... 3 A. TRANSIT SURVEY DATA... 3 B. PERSON TRIP ADJUSTMENTS... 6 C. IMPLIED TRANSIT SHARES HOME BASED WORK TRIP DISTRIBUTION... 8 A. METHODOLOGY... 8 B. EVALUATING HBW PERSON TRIP DISTRIBUTION CHANGES MODEL AND PATHBUILDING MODIFICATIONS A. ACCESS IMPEDANCES Walk from Park n Ride Lots Access to Platform Time B. MAXIMUM WALK AND DRIVE DISTANCES C. HIERARCHY OF MODES AND WEIGHTS D. TRANSFER PROHIBITIONS AND PENALTIES E. BUS SPEED MODEL F. FARE MODEL G. COEFFICIENTS Coefficients on In Vehicle Time Wage Rates and Income Groups Split Initial Wait Times MODEL CALIBRATION A. OTHER CONSTANTS B. CHALLENGES TO CALIBRATION C. PARKING CAPACITY RESTRAINT AND CALIBRATION VALIDATION APPENDIX A: FINAL CALIBRATION CONSTANTS APPENDIX B: FINAL OBSERVED AND ESTIMATED COMPARISONS APPENDIX C: IMPLIED TRANSIT SHARE APPENDIX D: TRANSIT SURVEY TABULATIONS APPENDIX E: ZONE RE AGGREGATION AND SPLITTING Page 1
75 Washington, D.C. Area: New Starts Travel Forecasting Model Tables TABLE 1: TRANSIT SURVEYS... 4 TABLE 2: CALIBRATION TARGET VALUES... 5 TABLE 3: PERSON TRIP TABLE ADJUSTMENT FACTORS... 7 TABLE 4: COMPARISON OF COG HBW PERSON TRIP TABLE WITH CTPP... 9 TABLE 5: HBW INTRAZONAL FACTORS AND MARGINAL TARGETS TABLE 6: COMPARISON OF MDAA ADJUSTED HBW PERSON TRIPS WITH CTPP TABLE 7: PARK AND RIDE LOT SIZES AND ASSIGNED AVERAGE WALK TIMES TO STATIONS TABLE 8: WALK TIMES TO METRORAIL PLATFORMS TABLE 9: PARK AND RIDE CODES AND MAXIMUM DRIVE SHEDS TABLE 10: PATHBUILDING HIERARCHY OF MODES AND WEIGHT TABLE 11: TRANSFER PROHIBITIONS AND PENALTIES TABLE 12: BUS SPEED MODEL, ADDITIONAL MINUTES OF DELAY PER MILE TABLE 13: BUS MODE ADJUSTMENT FACTORS LOCAL VS. LIMITED STOP TABLE 14: ORIGINAL AND REVISED COEFFICIENTS TABLE 15: REVISED WAGE RATES AND COST COEFFICIENTS TABLE 16: NESTING STRUCTURE AND ASSERTED LOGSUM COEFFICIENTS TABLE 17: ADDITIONAL CONSTANTS IN THE UTILITY EXPRESSIONS TABLE 18: PARKING CAPACITY RESTRAINT RESULTS TABLE 19: AFFECT OF PARKING CAPACITY RESTRAINT ON METRORAIL CONSTANTS (IN EQUIVALENT MINUTES) Figures FIGURE 1: CORRIDOR LOCATIONS... 2 FIGURE 2: SURVEY SOURCES... 4 FIGURE 3: PERSON TRIP AND CALIBRATION TARGET VALUES ADJUSTMENTS... 7 FIGURE 4: ACCESS CODING Page 2
76 Washington, D.C. Area: New Starts Travel Forecasting Model 1. Introduction A. Project Overview The Maryland Transit Administration (MTA) has been analyzing two corridors for potential new transit service: 1) the Purple Line (PL) in the near northern suburbs of Washington, DC; and 2) the Corridor Cities Transitway (CCT) also in the Washington, DC suburbs and in the heart of Montgomery County, Maryland. To support the Alternatives Analyses/Draft Environmental Impact Statements (AA/DEIS) for these two projects, the MTA enhanced the Metropolitan Washington Council of Governments (MWCOG) regional travel model to generate transit forecasts for each of these New Starts projects. That enhanced model is referred to as the MDAA Phase I model (MDAAI). The FTA requires that travel forecasts for inclusion in the application to enter Preliminary Engineering (PE) be developed based on current observed transit survey data. As such, a Phase II model (MDAAII) development effort was undertaken, which included surveying Metrorail riders and incorporating the MWCOG 2007 regional bus survey. Additional issues identified in MDAAI were also addressed in MDAAII, including; inconsistency between bus speeds and highway congestion, inflexible fare model, partial (rather than full) implementation of the parking capacity restraint mechanism, imprecise coding of station access times and an incorrectly defined hierarchy of modes. This report documents the mode choice model calibration of MDAAII. B. Relationship of the MWCOG and MDAAII Models MDAAI, and therefore MDAAII, originated as transit component add-ons to the MWCOG regional travel model version 2.1D#50. The transit component evolved over several years through use by many different project sponsors. A description of the lineage of MDAAI can be found in Technical Memorandum: Travel Demand Forecasting Model Enhancements. MTA s modeling efforts have focused on transit mode choice and ridership. Every effort was made during the development of MDAAI and MDAAII to maintain the integrity of the MWCOG forecasting elements regarding highway components. The MWCOG model person trip tables and other key outputs that resulted from a full run through six iterations of model feedback were carried forward to MDAAII and serve as the starting point for MDAAII. The two project alignments (PL and CCT) are shown in Figure 1. The district system shown reflects MDAAII redistricting, which resulted to assure that districts used for calibration represented unique and cohesive areas of density and development rather than political jurisdictions. Page 1
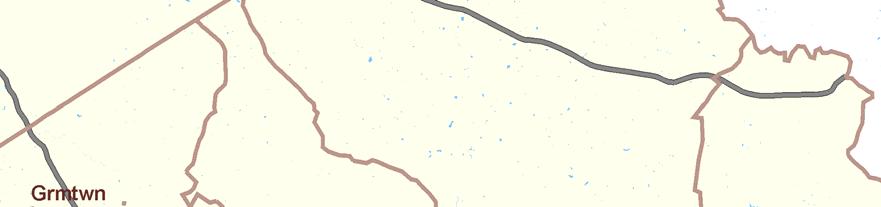
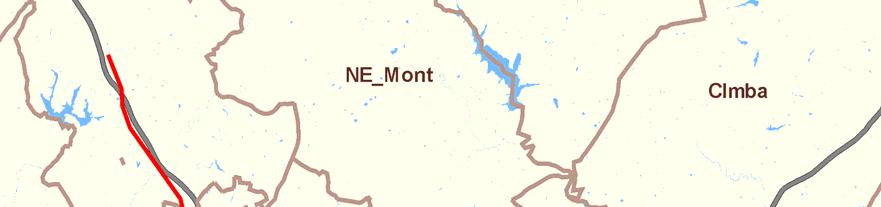


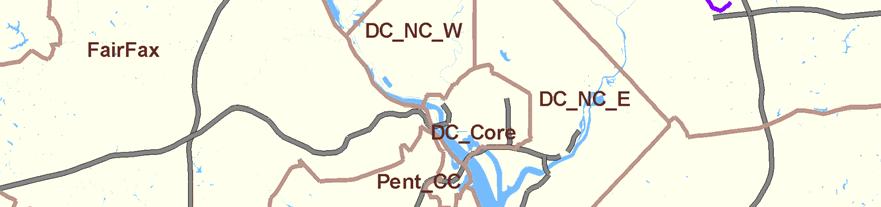

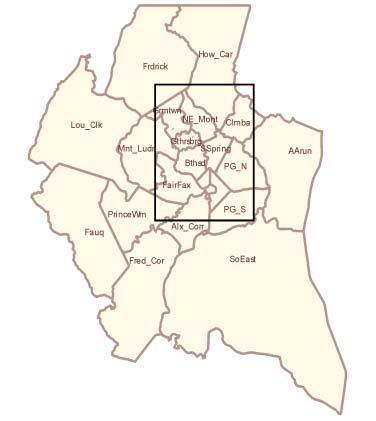
77 Washington, D.C. Area: New Starts Travel Forecasting Model Figure 1: Corridor Locations Page 2
78 Washington, D.C. Area: New Starts Travel Forecasting Model C. Major Changes in MDAAII The following lists the major changes in MDAAII: 1. Transit Calibration Target Values (CTV) based on current survey data. 2. Based on MWCOG model version 2.2 (referred to hereafter as COG). MDAAI was based on MWCOG version 2.1D # Adjustment to a 2005 base year rather than Costs are in year 2000 dollars. 4. Realignment of zones in the CCT Corridor, and zone splitting in the PL Corridor. 5. Zone splits and related network changes coded in the MWCOG inputs, and results after splits validated against MWCOG results for both 2005 and (In MDAAI, the effects of zone splits on MWCOG outputs were approximated.) 6. Transit Fare Model added. 7. Bus Speed Model added. 8. Path Building modifications 9. Modifications to mode choice model in-vehicle time and cost coefficients. Section 2 of this report describes the survey data and its use in tabulation of calibration targets. As in Phase I, the HBW person trip table distribution from COG version 2.2 does not match well the distribution of the Census Bureau s 2000 Census Transportation Planning Package (CTPP). Section 3 discusses adjustments made to the COG HBW person trip table to bring it into closer alignment with the CTPP observed distribution. Changes to the model structure and pathbuilding parameters are discussed in Section 4. The calibration and validation are described in Sections 5 and Transit Survey Data and Calibration Targets A. Transit Survey Data Table 1 lists the transit survey data from four different surveys. Because of the variance in formats, survey instruments, distribution methodology, and expansion methodology, the surveys were not combined into one comprehensive observed database. The survey data was used to evaluate transit travel behavior in the region and the model s path building assumptions, and to develop calibration target values. Tabulations of key variables from the transit surveys provide information about transit travel behavior and are provided in Appendix D. Evaluation of path building assumptions is discussed in Section 4. Data by mode from the four surveys were recombined (Figure 2) to create the final CTVs (Table 2). Page 3
79 Washington, D.C. Area: New Starts Travel Forecasting Model Table 1: Transit Surveys Survey Washington Metropolitan Area Transit Authority (WMATA) 2008 Mezzanine Survey. Metropolitan Washington Council of Governments Regional Bus Survey (2007/2008). Baltimore Metropolitan Council (BMC) 2007 Survey. Virginia Railway Express (VRE) boarding survey from Brief Description Conducted by WB&A Associates in the fall of Distributed on Mezzanines and expanded to September 2008 automated fare collection boardings and alightings. On board survey conducted by NuStats LLP in 2007, expanded by PB. Note that this survey was provided by MWCOG in draft form and may not include any subsequent MWCOG edits. Conducted and expanded by NuStats LLP in the spring and fall of An on board survey on all transit modes in the Baltimore region, including those transit services operating in the Washington, DC region. Conducted by VRE annually. Figure 2: Survey Sources Page 4
80 Washington, D.C. Area: New Starts Travel Forecasting Model Table 2: Calibration Target Values HBO HBW NHB TOTAL CTV FOR NHB DD AIR PASSENGERS TOTAL OBSERVED AUTO/TRANSIT PERIOD MODE ACCESS INCOME 1 INCOME 2 INCOME 3 TOTAL INCOME 1 INCOME 2 INCOME 3 TOTAL MODE CHOICE TARGETS AND VISITORS TRANSIT TRIPS Auto PK Drive Alone 896,026 1,072,387 1,205,671 3,174, , , ,315 1,866,192 1,250,679 6,290,955 6,290,955 Shared Ride 2 320, , ,857 1,134, ,169 99, , , ,195 1,869,210 1,869,210 Share Ride , , , ,030 37,973 37,115 44, , ,690 1,243,296 1,243,296 PK Total 1,451,953 1,737,734 1,953,713 5,143, , , ,502 2,307,498 1,952,563 9,403,461 9,403,461 OP Drive Alone 1,370,673 1,640,456 1,844,345 4,855, , , , ,380 2,277,329 7,990,183 7,990,183 Shared Ride 2 489, , ,092 1,735,144 46,939 45,879 54, , ,375 2,635,332 2,635,332 Share Ride , , ,206 1,277,366 17,446 17,052 20,439 54, ,667 1,857,970 1,857,970 OP Total 2,221,088 2,658,254 2,988,642 7,867, , , ,420 1,060,129 3,555,372 12,483,485 12,483,485 Auto Total 3,673,041 4,395,987 4,942,356 13,011,384 1,069,427 1,045,278 1,252,922 3,367,627 5,507,935 21,886,946 21,886,946 Transit PK Commuter Rail KNR ,261 1, ,314 PNR 2,868 3,763 9,243 15,874 15, ,637 WLK ,285 1, ,384 Bus KNR , , , ,660 PNR ,540 3,773 2,382 9, , ,741 WLK 26,380 2, ,493 76,210 17,784 8, ,889 11, , ,471 Metrorail KNR ,849 10,491 8,527 16,835 35,853 37,702 3,994 1,270 42,966 PNR 1,536 1,045 2,006 4,588 20,068 27,691 71, , ,296 6,169 1, ,318 WLK 13,755 4,001 4,964 22,720 76,129 48,784 83, , ,639 36,278 8, ,791 PK Total 43,198 7,766 8,582 59, , , , ,116 12, ,846 46,441 13, ,282 OP Commuter Rail KNR PNR WLK Bus KNR , ,435 2,435 PNR ,250 1, , , ,661 WLK 49,018 4,044 2,335 55,397 60,348 9,693 3,558 73,599 23, , ,703 Metrorail KNR 1, ,862 2,554 2,006 3,472 8,031 10,893 3,105 1,506 15,504 PNR 2,287 1,599 3,861 7,748 4,562 5,466 14,497 24,525 32,273 4,007 1,344 37,624 WLK 22,976 7,733 9,608 40,317 31,372 15,546 25,800 72, ,036 42,498 10, ,561 OP Total 76,368 13,869 16, , ,330 34,726 48, ,421 24, ,903 49,610 13, ,351 Transit Total 119,566 21,636 25, , , , , ,537 36, ,749 96,050 27,834 1,007,633 Grand Total 3,792,607 4,417,623 4,967,879 13,178,109 1,361,785 1,191,496 1,494,883 4,048,164 5,544,423 22,770,695 96,050 27,834 22,894,579 TRANSIT TOTAL BY MODE PK Commuter Rail 3,533 4,545 10,343 18,421 18, ,334 Bus 27,133 2, ,389 80,808 21,944 11, ,215 12, ,788 1, ,872 Metrorail 16,065 5,453 7,640 29, ,687 85, , , ,637 46,441 11, ,076 PK Total 43,198 7,766 8,582 59, , , , ,116 12, ,846 46,441 13, ,282 OP Commuter Rail ,240 1, ,864 Bus 49,657 4,044 2,550 56,251 62,429 11,217 4,260 77,906 24, , ,799 Metrorail 26,710 9,826 14,391 50,927 38,488 23,017 43, , ,202 49,610 12, ,689 OP Total 76,368 13,869 16, , ,330 34,726 48, ,421 24, ,903 49,610 13, ,351 TRANSIT TOTAL BY MODE 119,566 21,636 25, , , , , ,537 36, ,749 96,050 27,834 1,007,633 TRANSIT TOTAL BY ACCESS PK KNR 1, ,392 11,812 9,312 17,621 38, ,516 3,994 1,431 46,941 PNR 1,771 1,164 2,006 4,942 26,476 35,228 83, , ,337 6,169 3, ,695 WLK 40,135 6,194 5,884 52, ,740 66,952 92, ,094 11, ,993 36,278 9, ,646 PK Total 43,198 7,766 8,582 59, , , , ,116 12, ,846 46,441 13, ,282 OP KNR 1, ,121 3,487 3,489 2,253 3,579 9, ,482 3,105 1,690 18,277 PNR 2,501 1,599 3,877 7,977 6,023 7,175 15,381 28, ,760 4,007 1,498 42,265 WLK 71,994 11,777 11,943 95,714 91,818 25,298 29, ,521 23, ,661 42,498 10, ,810 OP Total 76,368 13,869 16, , ,330 34,726 48, ,421 24, ,903 49,610 13, ,351 TRANSIT TOTAL BY ACCESS 119,566 21,636 25, , , , , ,537 36, ,749 96,050 27,834 1,007,633 Page 5
81 Washington, D.C. Area: New Starts Travel Forecasting Model It was assumed that commuter rail trips are entirely HBW trips. The Virginia Railway Express (VRE) operates only in the peak periods and therefore the assumption that these are primarily work trips is reasonable. Maryland Area Regional Commuter (MARC) train service serves passengers throughout the day, and serves a few passengers destined to Baltimore-Washington International Airport (BWI). Air passengers and visitors were not included in the mode choice calibration. Commuter rail home-based other (HBO) trips in the BMC survey that had one end in the Washington region s model area (the Region) were negligible and omitted. Non-homebased (NHB) targets were separated into Metrorail and bus categories. Metrorail trips were used to estimate the NHB direct demand model (NHBDD). The NHB observed trips were used as targets for the mode choice model to estimate the choice between bus and auto. Observed transit air passengers and visitors were not included in the mode choice, but were added to the transit trip tables after mode choice. It was assumed that these trips would not grow substantially between 2005 and They are not expected to have a substantial effect on the PL or CCT projects. Trips in the BMC survey that were neither produced nor attracted in the Region were eliminated. Those that were produced and attracted in the Region were added to the commuter rail and bus calibration targets. BMC trips that had either a production or attraction end in the Region with the opposing end outside the Region were added to the external trip tables for commuter rail and bus. Auto calibration targets were taken from the final auto trip tables from COG after the sixth iteration of model feedback 1. B. Person Trip Adjustments The MDAAII survey data included transit data but no additional household travel survey data. COG has been validated for highway performance and for Metrorail ridership and therefore it is desirable to maintain the number of auto person trips in MDAAII as in COG, which estimated transit trips of 1,040,804 in 2005 while the MDAAII surveys indicate 979,799 transit trips (excluding 4,562 air passenger and 23,272 visitor transit trips) in 2005; therefore, when adding the transit targets to the auto targets (from COG), the targeted person trips are greater (by 157,055) than COG s person trips. Differences vary by time of day, income, and purpose. Person trip table adjustment factors are shown in Table 3. COG person trips were reduced by 0.68% (or 157,055 trips), from 22,927,750 to 22,770,695. Figure 3 illustrates the adjustments made to the person trip tables to accommodate the difference in MDAAII transit calibration targets and COG s transit trips as well as adjustments in HBW person trips required to more closely match the CTPP trip distribution. 1 TPB Travel Forecasting Model, Version 2.2; Specification, Validation, and User s Guide, National Capital Regional Transportation Planning Board, March 1, Page 6


82 Washington, D.C. Area: New Starts Travel Forecasting Model Table 3: Person Trip Table Adjustment Factors HBW HBO NHB Peak Off Peak Peak Off Peak Peak Off Peak Income Group Income Group Income Group Income Group Notes: 1. Factors are rounded to two digits for ease of reading. 2. Income Groups 1 and 2 were subsequently combined into one income group. Figure 3: Person Trip and Calibration Target Values Adjustments Page 7
83 Washington, D.C. Area: New Starts Travel Forecasting Model C. Implied Transit Shares District-to-district tabulations of the implied transit share (person trips divided by observed transit trips) by purpose and income group were prepared. The district-to-district trip tables are in Appendix C. There are two purposes for calculating the implied transit shares. The first purpose is to determine if there are enough person trips in each market to allow the mode choice model to allocate trips to transit. If the implied transit share for a given district-to-district interchange is extremely high then it would be difficult for the mode choice model to achieve convergence with explainable constants. Reasons for the unacceptably high, implied shares must be identified and addressed. The second purpose is to validate the changes made to the HBW person trip table. If the result of changes to the HBW distribution is districts with unacceptably high, implied transit shares then the re-distribution methodology must be reviewed. The MDAAII implied transit shares were all within reason. 3. Home based Work Trip Distribution Home-Based Work (HBW) trips are considered an important market for transit ridership, and as the Census Bureau s Journey to Work (JTW) data from the Census Transportation Planning Package (CTPP) provides a good source for verifying the HBW trip distribution patterns, the first step in the calibration effort was to verify the HBW person trip distribution from COG against the JTW distribution. Adjustments were made as described below. A. Methodology The CTPP survey data was collected in 1999 and adjusted by MWCOG to account for major employers that were incorrectly geocoded. In addition, MWCOG converted the CTPP observed trips to translate into average weekday work attractions. The CTPP data was normalized to COG s 2005 total HBW trips and compared to COG s HBW trips at the district level. COG s HBW trips used for this comparison resulted from a full run of COG through six iterations of model feedback after the zone splitting that is described in Appendix E and after adjustments required to accommodate the development of calibration target. The comparison is shown in Table 4. Substantial differences resulted in some of the key geographic areas for the MTA projects. Intra-district trips are over-estimated, particularly in the far suburban districts, but also in the DC-Core East and in the CCT districts. HBW trips to the DC-Core are underestimated by 15% and many other districts vary from the CTPP by more than ±15%. Attempts to adjust the distribution by iterative proportional fitting (IPF) did not address the intra-district anomalies, and resulted in unacceptably high levels of implied transit shares (or trips available to transit) in many district-to-district pairs. Page 8
84 Washington, D.C. Area: New Starts Travel Forecasting Model Table 4: Comparison of COG HBW Person Trip Table with CTPP COG version 2.2 Person Trips After Zone Splitting and Six Iterations of Model Feedback TOTAL 1 DC_Core 21,831 3,316 4,903 1, , ,685 2,319 5, ,669 2 DC_NC_W 64,530 16,032 8,680 10,484 2,896 2,793 1, ,884 4,153 11, ,004 3 DC NC E 75,246 8,598 27,970 6,703 3,763 11,428 1, ,114 4,681 3,793 5,311 9, ,718 4 Bethesda 43,323 8,680 5,499 61,454 9,691 5,078 18,147 2, ,446 2,885 15,133 1, ,808 5 SilverSpring 41,561 6,036 9,744 34,631 27,156 17,324 10,563 1, , ,257 1,849 1,286 1,624 1,698 6, ,041 6 PG_north 63,192 9,254 36,655 18,721 15,089 96,060 4, ,369 20,534 16,025 5,137 5,876 11, ,448 7 Gaithersburg 7,979 2,080 1,260 20,840 2,927 1,687 36,403 7,097 1, , ,510 8 Germantown 5,597 1, ,798 2,900 1,508 36,306 25,387 5,148 1, , , ,888 9 Frederick , ,700 8, , ,620 3, , , , NE_Mont 5, ,150 10,438 4,399 2,803 11,266 5,492 1,792 3, , , , How_Carroll ,780 1,377 1,863 3,231 3,020 18, ,796 11,352 2, , Columbia 4,244 1,109 2,853 5,428 5,773 14,128 2, , ,179 56,706 18, , AnneArundel 12,038 1,162 8,571 2,946 3,173 28, , ,926 9, , , , PG_South 65,724 5,351 40,378 4,645 2,985 26, ,079 56,816 6,612 12,347 11, , , Pent_CC 4, ,803 1,359 1, , Alx_Corridor 89,998 6,116 13,004 4, ,200 1, ,177 22, ,197 68,874 6,207 11,527 2, , Fairfax 65,815 7,366 7,218 8,607 1,181 1,206 2, ,637 30, ,637 28,836 14, , Mont_Loud 10,414 1,927 1,153 5, ,915 1,541 1, ,656 5,119 45, ,829 16, , , PrinceWm 17,400 1,778 2,313 2, ,987 33,223 64,656 39, ,998 4,437 2,286 4, , Fred_Corridor 13, ,932 53,945 12,935 2,853 28, , ,787 2, , Lou_Clk ,821 1,358 10, ,770 27,653 7, , , Fauquier ,792 11,002 4, , , SouthEast 12, , , ,774 24,944 1,175 2,643 1, , , ,713 Total 625,485 83, , ,825 86, , ,984 58, ,574 9,581 75, , , ,371 72, , , , , ,436 41,828 28, ,901 4,076,730 CTPP Adjusted by COG and Normalized to COG Total Person Trips TOTAL 1 DC_Core 21,269 3,788 4,102 2, , ,256 1,994 3, ,066 2DC_NC_W 61,294 11,882 7,144 6,727 1,414 2,117 1, ,265 3,141 6,993 1, ,074 3DC NC E 97,653 14,582 42,606 9,035 4,461 10,433 2, ,420 5,455 7,395 9,677 1,964 1, ,609 4Bethesda 47,902 10,672 6,271 54,548 8,881 7,477 16,847 4, , , ,085 1,281 2,950 10,237 3,453 1, ,570 5SilverSpring 43,406 8,380 13,291 37,120 31,596 18,791 13,625 3, , ,795 2,048 2,731 2,022 3,017 7,770 2,470 1, ,350 6PG_north 67,660 8,906 30,943 21,533 16, ,371 8,243 2, ,638 10,931 22,767 5,146 8,616 11,871 2,667 2, , ,487 7Gaithersburg 10,465 2,342 1,889 21,431 3,358 2,596 24,524 8,009 1, ,272 4,247 1, ,044 8Germantown 10,613 1,967 1,850 24,931 4,550 2,664 28,898 19,390 2,533 1, ,410 5,077 2, ,080 9Frederick 3, ,036 2,226 1,469 12,060 9,203 80,409 1,270 3,493 1,990 1, ,654 3, , NE_Mont 4, ,032 9,293 3,642 2,269 7,983 3, , , , , How_Carroll 1, ,470 1,498 3,478 2,439 1,845 4, ,010 13,200 7, , Columbia 9, ,658 6,034 5,663 18,215 3, ,762 55,227 19,346 1, ,141 2, , AnneArundel 19,624 1,143 5,819 4,483 2,367 30,530 2, ,098 20, ,098 8,949 1,826 2,693 3, , , PG_South 66,175 5,444 26,786 5,768 3,355 29,379 2, ,420 2,117 45,020 6,483 13,736 12,055 2,675 2, , , Pent_CC 6, , , Alx_Corridor 93,694 7,361 16,898 7,111 2,006 5,720 2, ,200 5,612 27, ,678 76,747 17,445 26,845 5, , , Fairfax 78,308 8,201 7,256 8,447 1,263 3,003 3, ,243 8,731 28, ,737 26,741 22,422 1, , Mont_Loud 16,124 1,561 2,372 6,578 1,150 1,641 3,811 1, ,755 9,136 45,441 92,972 18, , , PrinceWm 29,282 2,019 4,752 3, ,454 1, ,521 8,586 31,168 68,587 34,184 88,259 8, , , Fred_Corridor 23,165 1,259 5,152 1, , ,362 10,245 42,405 24,195 9,010 23, , , , Lou_Clk 2, , , ,337 4,645 17,567 3, , , Fauquier 1, ,344 4,183 3,415 8,586 1, , , SouthEast 20,893 1,227 8,465 1,837 1,023 14,643 1, ,507 24,388 3,090 6,192 4,531 1,471 1,214 3, , ,152 Total 737,629 93, , ,734 96, , ,873 60,967 95,879 14,846 60, , , ,522 90, , , , , ,922 26,228 18, ,094 4,076,732 Page 9
85 Washington, D.C. Area: New Starts Travel Forecasting Model Table 4: Comparison of COG HBW Person Trip Table with CTPP (continued) Absolute Difference (COG CTPP) TOTAL 1 DC_Core , DC_NC_W 3,235 4,150 1,536 3,757 1, ,619 1,012 4, ,931 3DC NC E 22,406 5,984 14,636 2, , ,662 2, ,417 1, ,889 4Bethesda 4,579 1, , ,398 1,299 2, , ,896 1,977 1, ,758 5SilverSpring 1,845 2,344 3,547 2,489 4,441 1,467 3,063 1, , ,319 1,328 1,925 1, ,310 6PG_north 4, ,712 2, ,311 3,878 1, ,731 9,603 6, , ,128 1, ,213 20,040 7Gaithersburg 2, , , ,464 8Germantown 5, ,133 1,650 1,155 7,407 5,997 2, ,186 1, ,193 9Frederick 3, ,925 1,722 1,044 2, , ,127 1, , , , NE_Mont , ,284 1,639 1,074 1, , , How_Carroll 1, , ,175 14, ,786 1,847 4, , Columbia 5, , , ,583 1,479 1,216 1, , , AnneArundel 7, ,752 1, ,527 1, , ,046 1,875 2, , PG_South ,592 1, ,448 1, ,962 11, , ,332 1, ,353 16, Pent_CC 2, , , Alx_Corridor 3,696 1,246 3,894 2,662 1,282 3,520 1, ,067 2,435 4,953 18,519 7,873 11,237 15,318 3, ,028 48, Fairfax 12, ,798 1, ,907 2,178 20,900 2,095 7,587 1, Mont_Loud 5, , ,316 1, , ,099 4, ,857 1, , PrinceWm 11, ,439 1, , ,599 2,055 3,931 5,617 25,738 3,992 1,425 2, , Fred_Corridor 9, ,326 1, , ,012 7,313 11,540 11,260 6,157 4,558 63, ,101 2,529 33, Lou_Clk 2, , , ,086 3, , , Fauquier 1, ,172 3,261 1,623 2,416 2, , , SouthEast 8, ,371 1, , , ,915 3,549 2,904 1,445 1,134 1, ,521 12,563 Total 112,143 10,478 6,552 19,910 10,198 41,565 8,108 2,325 50,694 5,267 15,342 3,571 6,978 5,149 18,053 13,247 7,116 31,121 1,047 51,516 15,598 9,824 33,806 NOTE: CTPP table was modified by MWCOG to convert trips to Ps and As and to correct the location of some major employers. It was then normalized to the COG totals by PB. Percent Difference TOTAL 1 DC_Core 3% 20% 1% 2DC_NC_W 5% 35% 22% 56% 58% 20% 3DC NC E 23% 41% 34% 26% 16% 10% 14% 30% 28% 2% 25% 4Bethesda 10% 19% 12% 13% 9% 32% 8% 58% 48% 2% 5SilverSpring 4% 28% 27% 7% 14% 8% 22% 17% 15% 6PG_north 7% 4% 18% 13% 6% 7% 47% 32% 88% 30% 0% 32% 7% 6% 7Gaithersburg 24% 3% 48% 11% 12% 3% 8Germantown 47% 21% 36% 26% 31% 23% 4% 9Frederick 66% 20% 7% 30% 6% 10 NE_Mont 17% 12% 41% 32% 19% 11 How_Carroll 367% 32% 14% 70% 23% 12 Columbia 55% 10% 2% 22% 3% 6% 11% 13 AnneArundel 39% 47% 34% 8% 0% 1% 3% 5% 14 PG_South 1% 2% 51% 19% 8% 26% 2% 10% 4% 26% 7% 15 Pent_CC 38% 11% 16 Alx_Corridor 4% 17% 23% 37% 62% 43% 18% 14% 10% 64% 57% 58% 11% 17 Fairfax 16% 10% 1% 2% 22% 8% 20% 8% 34% 0% 18 Mont_Loud 35% 12% 44% 1% 54% 10% 16% 19 PrinceWm 41% 51% 54% 7% 6% 16% 29% 47% 1% 20 Fred_Corridor 42% 84% 71% 27% 47% 68% 19% 48% 51% 12% 21 Lou_Clk 19% 57% 63% 51% 22 Fauquier 78% 28% 38% 6% 23 SouthEast 38% 28% 54% 2% 57% 64% 32% 6% Total 15% 11% 3% 8% 11% 16% 6% 4% 53% 35% 25% 3% 3% 4% 20% 4% 2% 14% 1% 33% 59% 53% 23% 0% Page 10
86 Washington, D.C. Area: New Starts Travel Forecasting Model Combinations of approaches to adjustment were tested and a final approach adopted involved the following steps: 1. Aggregate COG s HBW person trip tables by time of day and income level into one total COG HBW person trip table, and calculate the time of day and income level shares at the i-j pair level for later use. 2. Adjust COG s HBW total person trip table intra-district trips to target the total number of intra-district trips in the CTPP. This resulted in a net loss of 480,000 HBW trips (12%), reflecting the regionwide over-estimation of intra-district trips. 3. Use an IPF procedure to adjust COG s HBW total person trip productions and attractions at the district level to match the CTPP productions and attractions district totals. 4. At the zonal level, calculate production and attraction adjustment factors by dividing the adjusted zonal marginal totals (#2 above) by the original COG zonal marginal totals to derive a set of zonal level marginal targets. 5. Apply the zonal level marginal production and attraction targets from #3 above to COG s 2005 and 2030 HBW person trip tables to derive MDAAII HBW person trip tables. 6. Disaggregate MDAAII HBW person trip tables into income and time-of-day tables using shares at the zonal i-j pair level (#1 above). Table 5 shows the intrazonal factors and marginal targets as well as the district-level totals for the CTPP, the original COG trip table, and the final MDAAII HBW trip table. Table 6 shows the comparison of the final 2005 MDAAII HBW total person trip table to the CTPP person trip table normalized to COG s total HBW person trips. The final IPF to match the district marginal totals causes the intra-district totals to not match exactly, and some intradistrict totals are still over estimated, but the intra-district trip tables are substantially improved (see Table 4), and MDAAII marginal totals match CTPP marginal totals at the district level. B. Evaluating HBW Person Trip Distribution Changes To further evaluate the adequacy of the person trip tables, the implied transit share was calculated by dividing the observed transit trips by the person trips at the district level. This was done for all purposes and times of day. However, the implied transit shares for the HBW purposes suggest the distribution changes made to the HBW trip table have eliminated potential problems in calibration. Page 11
87 Washington, D.C. Area: New Starts Travel Forecasting Model Table 5: HBW Intrazonal Factors and Marginal Targets District District Name COG CTPP Intra-Dist Factors After Intra-Dist Factoring Marginal Targets Final Adjusted MDAAII Marginal Totals Prod Attr Prod Attr Factors Prod Attr Prod Attr Prod Attr 1 DC_Core 43, ,488 43, , , , , ,631 2 DC_NC_W 128,004 83, ,073 93, ,357 77, ,074 93,851 3 DC NC E 161, , , , , , , ,523 4 Bethesda 178, , , , , , , ,734 5 SilverSpring 168,041 86, ,351 96, ,501 87, ,351 96,854 6 PG_north 316, , , , , , , ,761 7 Gaithersburg 89, ,983 87, , , , , ,876 8 Germantown 107,886 58, ,079 60, ,446 50, ,079 60,967 9 Frederick 143, , ,043 95, , , ,042 95, NE_Mont 52,294 9,578 43,906 14, ,209 10, ,906 14, How_Carroll 112,039 75,548 91,193 60, ,953 53, ,192 60, Columbia 119, , , , , , , , AnneArundel 289, , , , , , , , PG_South 247, , , , , , , , Pent_CC 10,411 72,372 11,687 90, ,184 71, ,687 90, Alx_Corridor 381, , , , , , , , Fairfax 307, , , , , , , , Mont_Loud 242, , , , , , , , PrinceWm 292, , , , , , , , Fred_Corridor 315, , , , , , , , Lou_Clk 88,515 41,828 58,589 26, ,907 26, ,589 26, Fauquier 39,043 28,232 37,009 18, ,732 20, ,010 18, SouthEast 240, , , , , , , ,095 4,076,734 4,076,734 4,076,734 4,076,734 3,597,131 3,597,131 4,076,734 4,076,734 Page 12
88 Washington, D.C. Area: New Starts Travel Forecasting Model Table 6: Comparison of MDAA Adjusted HBW Person Trips with CTPP COG Model Version 2.2 After Adjustments TOTAL 1 DC_Core 22,685 3,404 4,433 1, , ,824 1,849 4, ,067 2 DC_NC_W 56,440 13,762 6,589 8,406 2,327 2, ,536 2,790 8, ,072 3 DC NC E 106,501 11,981 34,474 8,686 4,875 15,923 1, ,137 5,947 5,609 5,775 12, ,609 4 Bethesda 48,457 9,549 5,329 62,543 9,912 5,529 15,373 1, ,854 2,489 14,855 1, ,568 5 SilverSpring 53,274 7,626 10,825 40,607 31,657 21,568 10,270 1, , ,761 1,715 1,478 2,168 1,674 7, ,352 6 PG_north 72,750 10,522 36,604 19,807 15, ,403 3, ,317 17,374 16,604 6,166 5,186 11, ,488 7 Gaithersburg 9,412 2,418 1,289 22,219 3,145 1,929 31,529 6, , ,045 8 Germantown 7,397 2,330 1,113 23,670 3,480 1,926 35,208 24,956 2,344 1, , ,078 9 Frederick , ,786 13,322 76,144 1,786 6,459 5, , , , NE_Mont 5, ,251 3,870 2,613 8,395 4, , , , How_Carroll ,325 1,766 2,506 3,643 3,551 10,160 1,706 50,365 10,972 2, , Columbia 6,290 1,626 3,670 7,373 7,798 19,996 3,006 1,085 1,220 1,283 2,005 56,870 19,245 1, , , AnneArundel 16,425 1,573 10,142 3,721 3,985 37, , ,368 11,147 1, , , , PG_South 67,270 5,415 35,763 4,351 2,782 27, ,736 51,172 7,063 9,622 10, , , Pent_CC 4, ,225 1,246 1, , Alx_Corridor 116,847 7,844 14,609 5, ,803 1, ,642 30, ,751 78,071 6,790 12,928 1, , Fairfax 73,450 8,111 6,977 8,784 1,208 1,316 1, ,383 26, ,485 27,481 14, , Mont_Loud 11,324 2,104 1,085 6, ,887 1, ,821 4,090 41, ,885 14, , , PrinceWm 21,148 2,113 2,445 2, ,068 30,567 67,096 39, ,892 2,898 1,981 2, , Fred_Corridor 18, ,253 56,233 15,696 3,381 32, , ,663 1, , Lou_Clk ,527 1,134 3, ,137 22,322 5, , , Fauquier ,254 2,347 14,061 4, , , SouthEast 17, , , ,965 30,984 1,706 2,798 1, , , ,144 Total 737,629 93, , ,735 96, , ,878 60,967 95,881 14,846 60, , , ,523 90, , , , , ,921 26,229 18, ,094 4,076,742 CTPP After MWCOG Adjustments, Normalized to COG Total Person Trips TOTAL 1 DC_Core 21,269 3,788 4,102 2, , ,256 1,994 3, ,066 2 DC_NC_W 61,294 11,882 7,144 6,727 1,414 2,117 1, ,265 3,141 6,993 1, ,074 3 DC NC E 97,653 14,582 42,606 9,035 4,461 10,433 2, ,420 5,455 7,395 9,677 1,964 1, ,609 4 Bethesda 47,902 10,672 6,271 54,548 8,881 7,477 16,847 4, , , ,085 1,281 2,950 10,237 3,453 1, ,570 5 SilverSpring 43,406 8,380 13,291 37,120 31,596 18,791 13,625 3, , ,795 2,048 2,731 2,022 3,017 7,770 2,470 1, ,350 6 PG_north 67,660 8,906 30,943 21,533 16, ,371 8,243 2, ,638 10,931 22,767 5,146 8,616 11,871 2,667 2, , ,487 7 Gaithersburg 10,465 2,342 1,889 21,431 3,358 2,596 24,524 8,009 1, ,272 4,247 1, ,044 8 Germantown 10,613 1,967 1,850 24,931 4,550 2,664 28,898 19,390 2,533 1, ,410 5,077 2, ,080 9 Frederick 3, ,036 2,226 1,469 12,060 9,203 80,409 1,270 3,493 1,990 1, ,654 3, , NE_Mont 4, ,032 9,293 3,642 2,269 7,983 3, , , , , How_Carroll 1, ,470 1,498 3,478 2,439 1,845 4, ,010 13,200 7, , Columbia 9, ,658 6,034 5,663 18,215 3, ,762 55,227 19,346 1, ,141 2, , AnneArundel 19,624 1,143 5,819 4,483 2,367 30,530 2, ,098 20, ,098 8,949 1,826 2,693 3, , , PG_South 66,175 5,444 26,786 5,768 3,355 29,379 2, ,420 2,117 45,020 6,483 13,736 12,055 2,675 2, , , Pent_CC 6, , , Alx_Corridor 93,694 7,361 16,898 7,111 2,006 5,720 2, ,200 5,612 27, ,678 76,747 17,445 26,845 5, , , Fairfax 78,308 8,201 7,256 8,447 1,263 3,003 3, ,243 8,731 28, ,737 26,741 22,422 1, , Mont_Loud 16,124 1,561 2,372 6,578 1,150 1,641 3,811 1, ,755 9,136 45,441 92,972 18, , , PrinceWm 29,282 2,019 4,752 3, ,454 1, ,521 8,586 31,168 68,587 34,184 88,259 8, , , Fred_Corridor 23,165 1,259 5,152 1, , ,362 10,245 42,405 24,195 9,010 23, , , , Lou_Clk 2, , , ,337 4,645 17,567 3, , , Fauquier 1, ,344 4,183 3,415 8,586 1, , , SouthEast 20,893 1,227 8,465 1,837 1,023 14,643 1, ,507 24,388 3,090 6,192 4,531 1,471 1,214 3, , ,152 Total 737,629 93, , ,734 96, , ,873 60,967 95,879 14,846 60, , , ,522 90, , , , , ,922 26,228 18, ,094 4,076,732 Page 13
89 Washington, D.C. Area: New Starts Travel Forecasting Model Table :6 Comparison of MDAA Adjusted HBW Person Trips with CTPP (continued) Absolute Difference (COG CTPP) TOTAL 1DC_Core 1, DC_NC_W 4,854 1, , , , DC NC E 8,848 2,601 8, ,490 1, ,620 2,516 1,319 1, Bethesda 555 1, ,995 1,031 1,948 1,474 3, , ,618 2,087 1, SilverSpring 9, ,466 3, ,777 3,355 1, , , ,890 1, PG_north 5,090 1,616 5,661 1, ,032 4,446 1, ,443 6,163 1,020 3, ,151 1, , Gaithersburg 1, ,005 1, , Germantown 3, ,261 1, ,310 5, , Frederick 3, ,289 1, ,726 4,119 4, ,966 3, ,125 1, , NE_Mont How_Carroll 1, ,204 1,706 6, ,228 4, Columbia 3, ,012 1,339 2,135 1, ,757 1, , AnneArundel 3, , ,618 6,867 1, , ,841 1, , PG_South 1, ,977 1, ,315 1, ,619 6, ,114 1,695 2,381 1, Pent_CC 1, , Alx_Corridor 23, ,289 1,817 1,145 2,917 1, ,075 1,970 3,008 16,073 1,324 10,655 13,917 3, , Fairfax 4, ,687 1, ,652 1,975 17, ,829 1, Mont_Loud 4, , ,266 1, ,046 3,877 22,913 3, PrinceWm 8, , ,079 1, , ,491 4,885 21,633 5,531 1, Fred_Corridor 4, , , ,992 13,828 8,499 5,629 8,572 14, , Lou_Clk 2, , ,067 1,508 4,755 2, , Fauquier 1, ,135 2,929 1,068 5,475 2, SouthEast 2, ,634 1, , ,458 6,596 1,384 3,394 2,549 1,440 1,118 1, ,367 8 Total NOTE: CTPP table was modified by MWCOG to convert trips to Ps and As and to correct the location of some major employers. It was then normalized to the COG totals by PB. Percent Difference TOTAL 1DC_Core 7% 8% 0% 2DC_NC_W 8% 16% 8% 25% 21% 0% 3DC NC E 9% 18% 19% 4% 9% 53% 10% 3% 22% 26% 0% 4Bethesda 1% 11% 15% 15% 12% 26% 9% 64% 45% 0% 5 SilverSpring 23% 9% 19% 9% 0% 15% 25% 7% 0% 6PG_north 8% 18% 18% 8% 1% 5% 54% 8% 59% 27% 20% 40% 6% 0% 7Gaithersburg 10% 4% 29% 21% 16% 0% 8Germantown 30% 5% 24% 22% 29% 11% 0% 9 Frederick 36% 23% 45% 5% 0% 10 NE_Mont 12% 0% 5% 17% 0% 11 How_Carroll 151% 1% 17% 69% 0% 12 Columbia 34% 22% 38% 10% 3% 1% 0% 13 AnneArundel 16% 74% 17% 22% 3% 0% 25% 0% 14 PG_South 2% 1% 34% 25% 8% 14% 9% 30% 14% 18% 0% 15 Pent_CC 26% 0% 16 Alx_Corridor 25% 7% 14% 26% 51% 35% 11% 12% 2% 61% 52% 69% 0% 17 Fairfax 6% 1% 4% 4% 42% 7% 17% 3% 35% 0% 18 Mont_Loud 30% 2% 55% 9% 25% 20% 0% 19 PrinceWm 28% 49% 41% 2% 2% 14% 25% 66% 0% 20 Fred_Corridor 19% 81% 58% 33% 35% 62% 36% 11% 64% 0% 21 Lou_Clk 32% 27% 10% 0% 22 Fauquier 70% 64% 3% 0% 23 SouthEast 14% 55% 36% 27% 55% 56% 9% 0% Total 0% 0% 0% 0% 0% 0% 0% 0% 0% 0% 0% 0% 0% 0% 0% 0% 0% 0% 0% 0% 0% 0% 0% 0% Page 14
90 Washington, D.C. Area: New Starts Travel Forecasting Model 4. Model and Pathbuilding Modifications Substantial changes have been made to MDAAII since MDAAI was completed: some are a direct result of information made available from the new survey data and field-collected data, some corrections were identified in MDAAI, and some were structural changes required to accurately reflect transit travel behavior and/or level-of-service attributes (i.e., the inclusion of a fare model and a bus speed model). A. Access Impedances Figure 4 illustrates the types of transit access available in the model. Walk access must be either directly from a TAZ to a station (if it is within the maximum walk distance) or along the sidewalk network. The sidewalk network is constructed from the highway network excepting the freeways. Access to the sidewalk network must be at an existing bus node. Walk speeds are assumed to be 3 mph. Walk access times were modified to reflect faithful station coding paradigms. These changes are described in the following sections. 1. Walk from Park n Ride Lots Average walk time from park-and-ride (PNR) lots to the stations were assigned to the PNR access links based on PNR lot sizes; the underlying theory being that the size of the lot is related to the average time it takes to walk across the lot to the station. The lot sizes were allocated to ranges as shown in Table 7. These average walk times were validated by scaling distances from the visually identified geographic centroids of parking lots as shown on aerial photographs (Google Maps), applying a 3 mph speed, and comparing the resulting times to documented parking lot sizes. Table 7: Park and Ride Lot Sizes and Assigned Average Walk Times to Stations Assigned Average Minutes of Access Time from Parking Lot Capacity up to: Auto to Station , , , , Access to Platform Time The estimated time required to reach the platform from the station entrance is sometimes called faithful station coding. Because some of the Metrorail stations are very deep, and access can require a substantial amount of time on escalators or walking on long platforms, the more accurate assessment of actual walk access time from the station entrance to the platform was considered to be important. Field data collection approximated an average walking time during a typical rush hour, and in some cases, multiple samples from the same station were collected and averaged. Table 8 shows the minutes of impedance added to each Metrorail station path. Page 15
91 Washington, D.C. Area: New Starts Travel Forecasting Model Figure 4: Access Coding Page 16
92 Washington, D.C. Area: New Starts Travel Forecasting Model Table 8: Walk Times to Metrorail Platforms Added Walk to Platform (Minutes) Added Walk to Platform (Minutes) Metrorail Station Metrorail Station Addison Road 1.0 Eisenhower Avenue 1.5 Anacostia 2.0 Farragut North 2.0 Archives 2.0 Farragut West 2.0 Arlington Cemetery 2.0 Federal Center SW 2.5 Ballston 3.0 Federal Triangle 2.5 Benning Road 2.0 Foggy Bottom GWU 2.0 Bethesda 4.0 Forest Glen 2.5 Braddock Road 1.5 Fort Totten 2.0 Branch Avenue 1.5 Franconia Springfield 2.5 Brookland CUA 1.5 Friendship Heights 4.5 Capitol Heights 2.0 Gallery Place 3.5 Capitol South 2.5 Georgia Ave 3.0 Cheverly 1.5 Glenmont 2.5 Clarendon 2.5 Greenbelt 1.0 Cleveland Park 3.0 Grosvenor 2.0 College Park 2.0 Herndon/Monroe 1.5 Columbia Heights 3.0 Huntington 2.0 Congress Heights 2.5 King Street 1.0 Court House 5.0 Landover 1.0 Crystal City 3.0 Largo Town Center 2.0 Deanwood 1.0 L'Enfant Plaza 4.0 Dulles Airport 1.5 McPherson Square 2.5 Dulles North 1.5 Medical Center 4.0 Dunn Loring 1.5 Metro Center 4.0 Dupont Circle 3.0 Minnesota Avenue 1.5 East Falls Church 1.5 Morgan Boulevard 2.0 Eastern Market 2.5 Mt Vernon Square 3.0 National Airport 1.5 Tysons East 1.5 Navy Yard 2.5 Tysons West 1.5 Naylor Road 1.0 Union Station 1.5 New Carrollton 1.5 U Street Cardozo 2.5 New York Ave NE. 1.5 Van Dorn Street 1.0 Shaw Howard Univ 2.5 Van Ness UDC 3.0 Silver Spring 1.0 Vienna 2.0 Smithsonian 2.0 Virginia Square 2.5 Southern Avenue 2.0 Waterfront 2.5 Stadium Armory 2.0 West Falls Church 1.5 Suitland 2.0 West Hyattsville 1.5 Takoma 1.5 Wheaton 4.5 Tenleytown 4.0 White Flint 1.5 Twinbrook 2.0 Wiehle Ave 1.5 Tysons Central RT Woodley Park Zoo 4.5 Page 17
93 Washington, D.C. Area: New Starts Travel Forecasting Model B. Maximum Walk and Drive Distances Based on survey data and results of assigning the transit survey data, the maximum walk and drive distances were adjusted. The walk access program generates walk access links for each zone to any bus stop within a search radius equal to 1.5 times the square root of the area of the zone. The maximum length of any walk link is 2 miles. Zones that do not find a connection within the search radius are allowed a larger search radius and walk distance (up to 150% of the maximum). Analysis of the survey data indicated that the maximum walk distance of 2 miles is too short to capture all walk to transit trips. Various the maximum walk distances were tested during pathbuilding and assignment of the observed transit trip tables. The conclusion of the survey assignment testing was that both the search radius and maximum walk distance should be doubled in order to capture the majority of the observed walk to transit trips. The maximum drive distances are controlled separately for Metrorail and commuter rail driveto-transit paths. PNR stations are assigned a code that is used to determine the size of the search radius for drive to transit trips. If a zone is within the search radius of a PNR lot, then the drive time to the station is taken from the congested highway skim matrix. Station types and their associated maximum drive sheds are shown in Table 9. Table 9: Park and Ride Codes and Maximum Drive Sheds Maximum Drive Distance by Mode (miles) Type Code Metrorail Commuter Rail Light Rail Bus Rapid Transit Bus NA NA NA NA NA NA NA NA NA NA NA C. Hierarchy of Modes and Weights The hierarchy of modes and accompanying pathbuilding weights are shown in Table 10. Designating light rail as a subordinate mode to Metrorail, and bus rapid transit as subordinate to light rail is a correction from MDAAI, which treated all of these fixed guideway modes as equal. The 2.5 weight on Metrorail trips in the commuter rail alternative is a result of testing the assignment of observed survey data. Several tests of maximum drive distances for Commuter Rail were performed. The longer maximum drive distances toward the end of the commuter rail lines yielded a better match of estimated to observed drive to commuter rail trips. However, the longer drive to commuter rail maximum drive distances at the far commuter rail stations resulted in Metrorail park-and-ride lots falling within the Commuter Rail drive to transit distance. Therefore, a 2.5 Metrorail path weight was applied in conjunction with the increased maximum Commuter Rail drive distance. Page 18
94 Washington, D.C. Area: New Starts Travel Forecasting Model Table 10: Pathbuilding Hierarchy of Modes and Weight Mode Description in Doc./Scripts Notes Created by prgm: File Name 2 Wgt LB 3 BR 2 LR 2 MR 2 CR 2 1 Metrobus Local Manual coding Mode1am.tb Metrobus Express Manual coding Mode2am.tb Metrorail Manual coding Mode3am.tb Metrorail created from rail_tpp.bse & sta_tpp.base staprotp_v1 met_link.tb NA NA 4 Commuter Rail Manual coding Mode4am.tb Commuter Rail created from rail_tpp.bse & sta_tpp.base staprotp_v1 com_link.tb NA 5 Light Rail Manual coding Mode5am.tb Light Rail created from rail_tpp.bse & sta_tpp.base staprotp_v1 lrt_link.tb NA NA NA NA 6 Primary Local Bus Manual coding Mode6am.tb Primary Express Bus Manual coding Mode7am.tb Secondary Local Bus Manual coding Mode8am.tb Secondary Express Bus Manual coding Mode9am.tb Bus Rapid Transit Manual coding Mode10am.tb Bus Rapid Transit created from rail_tpp.bse & sta_tpp.base staprotp_v1 new_link.tb NA NA NA NA 11 connects centroids to PNR lots busam.asc (Bus, MR, CR, LRT, and BRT) 4 autoacc3 for newam.asc Drive to transit (Metrorail, (autoall.asc=all drive PNR lrtam.asc commuter rail and bus) access link files connects centroids to stations for appended) mrpram.asc KNR mrkram.asc 1.0 cram.asc Bus metro links and connects MR, CR, LRT and BRT new_bus.tb 12 transfer cards stations to Bus stops lrt_bus.tb staprotp_v1 Bus commuter rail links connects MR, CR, LRT and BRT met_bus.tb 2.0 and transfer cards stations to each other com_bus.tb 13 Sidewalk Network Walkacc_v2 sidewalk.asc busampnr.tb Connects MR (and CR) stations to PNR connectors (bus to PNR, newampnr.tb MR (and CR) PNR lots Metrorail to PNR, and parker lrtampnr.tb Connects Bus stops to Bus PNR Commuter Rail to PNR) metampnr.tb lots comampnr.tb Walk to local transit Walkacc_v2 walkacc.asc 2.0 Notes: Drive to MR and Drive to Bus are prohibited in the CR paths. CR PNR skims are used for CR KNR mode choice. Bus paths allow parking at MR stations. Express bus IVTT is not permitted in the CR skims. 2 To simplify the chart, all peak periods (AM and PM) are referenced as AM. All files referencing links have an accompanying file referencing nodes. Mode##am.tb files are assumed for modes Path-building Hierarchy (& MODEFAC). X = not available in path-building. Page 19
95 Washington, D.C. Area: New Starts Travel Forecasting Model D. Transfer Prohibitions and Penalties Transfer prohibitions and penalties are shown in Table 11. In MDAAI, walk to Metrorail transfers were inadvertently prohibited. This was a holdover from previous versions, which included a bus/metrorail alternative separate from the Metrorail only alternative. Walk to Metrorail had been prohibited in the bus/metrorail alternative and was inadvertently carried over to MDAAI combined Metrorail alternative. This was the primary reason for the unacceptably high bus boardings in the Metrorail paths in MDAAI. It has been corrected in MDAAII. E. Bus Speed Model A substantial change in MDAAII over MDAAI was the introduction of the bus speed model. MDAAI reflected no relationship between highway speeds and bus speeds. During the development of MDAAII, a bus speed model was developed and validated using total route runtimes in the base year networks as the observed bus speeds. A correlation was developed (by area type and facility type) between these observed bus speeds and congested highway speeds. For each unique combination of area type and facility type, average variances between link level highway times and bus times were calculated. For combinations of facility type and area type that have few links with observed transit time, manual smoothing is used to obtain consistent, reasonable additional delays. Additional manual adjustments are made to minimize the system-wide route percent root-mean-square error (RMSE) between the total run times derived with the estimated bus speed model and RUNTIMES coded on the bus line cards. The resulting additional minutes of delay by area type and facility type are shown in Table 12. The model is implemented by creating a highway network specifically for skimming the transit networks. Travel times on the highway links are adjusted according the minutes of delay for the link s area type and facility type. This approach prohibits assigning a different bus delay to express bus modes running on the same links as local bus modes. In many cases, limited-stop buses run on the same roads as local buses. This bus speed model does not distinguish between these bus modes. To accommodate differences between operating characteristics of bus modes, an additional analysis of bus run times at the link level was performed. Differences between observed link level bus times by mode resulted in the adjustment factors shown in Table 13. These adjustments are applied using the TIMEFAC parameter in the mode files. Page 20
96 Washington, D.C. Area: New Starts Travel Forecasting Model Table 11: Transfer Prohibitions and Penalties Transit Modes Access Modes Transit Modes Access Modes Local Bus Express Bus Metrorail Commuter Rail LRT Other Local Bus Other Express Bus Other Local Bus Local Bus Prhbt Prhbt 2.0 Prhbt Prhbt 0.0 Express Bus Prhbt Prhbt 2.0 Prhbt Prhbt 0.0 Metrorail Prhbt Prhbt 2.0 Prhbt Prhbt 0.0 Commuter Rail Prhbt Prhbt 2.0 Prhbt Prhbt 0.0 LRT Prhbt Prhbt 2.0 Prhbt Prhbt 0.0 Other Local Bus Prhbt Prhbt 2.0 Prhbt Prhbt 0.0 Other Express Bus Prhbt Prhbt 2.0 Prhbt Prhbt 0.0 Other Local Bus Prhbt Prhbt 0.0 Other Express Bus Prhbt Prhbt 0.0 BRT Prhbt Prhbt 0.0 Drive Prhbt Prhbt 0.0 Prhbt Walk Connector Prhbt Prhbt Prhbt 0.0 Sidewalk Prhbt Prhbt 0.0 Unused Prhbt Prhbt 0.0 PNR Connector Prhbt Prhbt Prhbt Prhbt Prhbt Prhbt Walk Prhbt Prhbt Prhbt Other Express Bus BRT Drive Walk Connector Sidewalk Unused PNR Connector Walk Page 21
97 Washington, D.C. Area: New Starts Travel Forecasting Model Table 12: Bus Speed Model, Additional Minutes of Delay per Mile Facility Type Area Type Centroid Freeway Major Arterial Minor Arterial Collector Expressway Ramps Table 13: Bus Mode Adjustment Factors Local vs. Limited Stop Bus Mode/Type Adjustment Factor Mode 1 Local WMATA Mode 2 Express WMATA Mode 6 Other Local Mode 7 Other Express Mode 8 Other Local Mode 9 Other Express Page 22
98 Washington, D.C. Area: New Starts Travel Forecasting Model F. Fare Model Another substantial change from MDAAI was the introduction of the transit fare model. MDAAI created an accurate Metrorail distance-based fare matrix and used a complex set of district systems to allocate fares for all bus and commuter rail modes. The difficulty was twofold: 1) fares for local buses, express buses, some commuter buses, and for commuter rail modes were recognized by the model as equal; and 2) it was difficult to reliably implement baseline bus alternatives or new modes that might have vastly different fares. Neither MDAAI nor MDAAII used fare in pathbuilding. The MDAAII fare model contains three components: boarding-based bus fares, distancebased Metrorail fares, and zonal based fares for commuter rail and MTA commuter buses. An inventory of bus boarding and transfer fares for all bus systems in the Region was compiled and the 2005 fares associated with these systems identified. Thirty-nine unique fare policies and therefore 39 new fare modes were identified. A 39-mode fare matrix was created. A procedure was developed to translate the MDAAII model s 10 mode codes into the 39 mode codes based on route name and the route s associated operator. The fares were then skimmed using the new 39-mode line files. Zonal-based modes were captured during the skimming process using the TP+ FARELINKS option. The Metrorail portion of any path was assigned a fare of $0.00 during the fare skimming process. The distance-based Metrorail fares were then added to the fare skims using the Metrorail station-to-station fares and the station-to-station skim matrices generated by the fare skimming described above. It should be noted that the fare skims are not 100% the same paths as those generated by the model s regular 10-mode transit skimming step. Because composite headways can only be calculated within the same mode, disaggregating the 10 modes into 39 modes results in some paths not finding a combined headway in the 39-mode fare skims where combined headways are found in the 10-mode regular skims. In addition, transfer penalties between modes can change the paths. Every effort was made to match the 10-mode paths by eliminating transfer penalties and extending the maximum transit travel time. Tests indicated that the 39-mode fare skims reasonably approximated the 10-mode regular skims. G. Coefficients Several changes were made to the MDAAI coefficients and utility expressions to make them more consistent with current standard practice. 1. Coefficients on In Vehicle Time Coefficients on in-vehicle time were changed to correspond with standard accepted practice. Further, the auto access in-vehicle time and the walk-time coefficients should be 2 times the in-vehicle time coefficient. Coefficients on out-of-vehicle time and transit-boarding penalty should be 2.5 times the in-vehicle time coefficient. These standards were adopted for MDAAII and are shown in Table 14. Page 23
99 Washington, D.C. Area: New Starts Travel Forecasting Model Table 14: Original and Revised Coefficients Original Coefficients HBW HBO NHB Relation to IVTT In vehicle time Auto access time Out vehicle time and terminal time Transit boarding penalty Walk access time Revised Coefficients In vehicle time Auto access time Out vehicle time and terminal time Transit boarding penalty Walk access time Wage Rates and Income Groups Income coefficients in MDAAI and the revised MDAAII income coefficients are shown in Table 15. It is unclear how the original income coefficients were derived; however, COG documentation provides regional wage rates as documented by the 2000 Census. The MTA used these documented wage rates to calculate income stratified coefficients for HBW purposes. HBO cost coefficients were set to be one-sixth of HBW coefficients, and NHB coefficients were set to be one-half of HBW, consistent with standard accepted practice. Table 15: Revised Wage Rates and Cost Coefficients Original Cost Coefficients Income Group HBW HBO NHB inc inc inc inc Revised Cost Coefficients Income Group Wage Rate HBW HBO NHB inc1 $ inc2 $ inc3 $ inc4 $ Calibration efforts suggested that income groups one and two could be combined. Calculated income coefficients for income groups one and two were averaged. Page 24
100 Washington, D.C. Area: New Starts Travel Forecasting Model 3. Split Initial Wait Times In the utility expressions, the initial wait times have been split into two parts: 5 minutes or less and greater than 5 minutes. The part that is 5 minutes or less is multiplied by the out-of-vehicle coefficient. The part greater than 5 minutes is multiplied by the in-vehicle time coefficient. 5. Model Calibration MDAAII is a nested logit model with three nests (Table 16). A constant for PNR-to-local-bus was added to reflect un-included attributes. Specifically, PNR lots for buses are informal lots and substantially less secure and convenient than PNR lots at Metrorail and commuter rail stations. Table 16: Nesting Structure and Asserted LogSum Coefficients AUTO TRANSIT LOV HOV WALK ACC PNR ACC KNR ACC HOV2 HOV3+ WLK WLK WLK PNR PNR PNR KNR KNR KNR CR LB MR CR LB MR CR LB MR A. Other Constants During calibration, several variables were evaluated for relevance to the utility of some of the transit alternatives for some of the purposes. Table 17 lists the constants that were developed by purpose. Final calibrated constants can be found in Appendix A. Table 17: Additional Constants in the Utility Expressions HBW HBO NHB Peak Off Off Off Peak Peak Peak Peak Peak Zero Car Households Yes Yes Yes Yes Distance Yes Yes Yes Yes Yes Yes CBD Attraction Yes Yes Yes Yes CBD Non Core East Attraction Yes Yes Yes Yes Pentagon Attraction Yes Yes Yes Yes CBD Production & Attraction Yes Yes CBD Non Core East Production & Attraction Yes Yes The zero-car household production zones, distance stratification, and central business district (CBD) attraction zones as variables for constant calibration are not unusual in mode choice utility equations. The other constants are unique to Washington, DC s character. The zone containing the Pentagon and related office buildings is outside the CBD and yet represents a major attraction for unique work trips. A positive constant for trips destined to the Pentagon/Crystal City district was added. Page 25
101 Washington, D.C. Area: New Starts Travel Forecasting Model The CBD-Non-Core-East District is the district east of the CBD but inside the district limits. This district is unique in that it has a mix of very-low-income, zero-car households and some pockets of higher-income residents. At the same time, small pockets of dense employment serve as attractors. Efforts to calibrate a constant for employment density in the CBD-Non- Core-East District failed because the character of the employment densities is similar to those in the CBD. Therefore, adding a constant on employment density did nothing to address the competition between the CBD and the CBD-Non-Core-East District for transit attractions. A separate constant was added to the transit utility calculations for all CBD-Non-Core-East District attractions. The majority of the NHB transit trips (all Metrorail trips) were removed from the mode choice model to be addressed by the NHBDD model. Under the assumption that NHB transit trips are short trips to and from densely developed areas, a constant was developed for the NHB bus trips where both the production and attraction end of the trip are in the CBD. A similar constant was developed for bus trips completely within the CBD-Non-Core-East District. B. Challenges to Calibration Final constants are shown in Appendix A, and the observed and estimated comparisons by district, income, and distance stratification are shown in Appendix B. An intractable challenge to satisfactorily calibrating the mode choice model was a high number of bus trips and correspondingly low number of Metrorail trips in the low-income markets. The inverse of this problem existed in the high-income markets low numbers of bus trips and high numbers of Metrorail trips. Many tests attempted to understand the reasons for this dichotomy, but without success. The final (but not ideal) conclusion was the application of mode-specific constants stratified by income. These constants are shown in Appendix A. Another less-than-optimal result of the calibration effort was the negative commuter rail constants. While evaluating these two issues, the decision was made to collapse the two lower-income groups into one low-income group. In addition, discounts on transit fare were introduced for the low- and high-income groups. The discounts were based on survey data that indicated the number of transit riders by income group that receive an employer subsidy for transit usage, as well as other information, suggesting the number and size of employer subsidies. High-income groups receive a 70% reduction in fares while low-income groups receive a 25% reduction. C. Parking Capacity Restraint and Calibration The Parking Capacity Restraint (PCR) mechanism was developed in MDAAI but only partially implemented for a few key stations in the PL and CCT Corridors. For MDAAII, improved observed data regarding parking capacities and costs were compiled, and the PCR was implemented for all stations. The PCR model was implemented after calibration without restraint was complete. It was implemented for all Metrorail stations with full iterations of feedback for the peak HBW purpose. A final re-calibration of the peak HBW purpose with the skims resulting from the PCR was performed. Page 26
102 Washington, D.C. Area: New Starts Travel Forecasting Model The result is a shadow price added to the Metrorail PNR connectors between the parking lots and the Metrorail stations. Table 18 shows the station parking capacities, the initial HBW Peak PNR trips to each station after the initial calibration and before the PCR, and the results of the implementation of the PCR on the shadow prices and PNR trips by station. Implementing the PCR causes a slightly more positive Metrorail constant (to draw back Metrorail trips that were lost to the higher shadow prices) and a shift of 4,700 trips from PNR Metrorail trips to walk-to-metrorail trips. The change in Metrorail constants by income group are shown in Page 27
103 Washington, D.C. Area: New Starts Travel Forecasting Model Table 19. An additional 7,300 trips shift from stations that were over capacity to stations with excess capacity. The following observed vs. estimated trip comparisons are provided in Appendix B. 1. Linked trips by Mode 2. District to District Trips by Purpose 3. Frequency Distribution of Trip Length by Production District and Purpose 6. Validation The following comparisons of observed and estimated boardings were prepared and can be found in Appendix B. 1. Boardings by Alternative and Mode 2. Bus Boardings by System 3. Bus Boardings for Key Bus Routes 4. Metrorail Boardings by Line 5. Metrorail Boardings by Line Segment 6. Metrorail Boardings and Alightings by Station 7. Metrorail Boardings by Station and Access Mode 8. Commuter Rail Boardings by Station Page 28
104 Washington, D.C. Area: New Starts Travel Forecasting Model Table 18: Parking Capacity Restraint Results Station Capacity Model Assigned (Initial) Percent Over Assigned Initial 5 Impedance (min.) Final Capacity Restrained Impedance (min.) Final Capacity Restrained Assigned PNR Trips PNR Trips Added PNR Trips Removed Shady Grove 6,662 1,838 0% , Rockville 645 1,011 57% Twinbrook 1, % White Flint 1, % Grosvenor 1,796 2,184 22% , Bethesda 2,687 1,953 0% , Rhode Island Ave 540 1, % Fort Totten 608 2, % ,687 Silver Spring 3,895 1,709 0% , Forest Glen % Wheaton 977 1,069 9% Glenmont 1,781 3, % ,812 1,944 Greenbelt 3,999 2,428 0% , College Park 1, % PG Plaza 1, % West Hyattsville % Anacostia 1,133 1,800 59% , Southern Avenue 3, % ,049 1,150 Naylor Road 892 1,132 27% Suitland 2,204 2,753 25% , Branch Avenue 3,728 4,835 30% , Van Dorn Street 1,161 1,583 36% , Franconia Springfield 5,166 3,209 0% , Calculated from length of the access link and an assumed 3 mph walking speed. Link distances are automatically calculated and are a function of the size of the PNR lot. Page 29
105 Washington, D.C. Area: New Starts Travel Forecasting Model Table 17: Parking Capacity Restraint Results (continued) Station Capacity Model Assigned (Initial) Percent Over Assigned Initial Impedance (min.) Final Capacity Restrained Impedance (min.) Final Capacity Restrained Assigned Trips Shifted to Stations with Capacity Trips Lost from Over Capacity Stations Huntington 3,090 4,303 39% ,244 1,060 Vienna 5,950 3,178 0% , Dunn Loring 1,319 1,680 27% , West Falls Church 5,422 1,692 0% , East Falls Church 422 1, % ,448 Ballston 500 2, % ,578 Stadium Armory 500 1, % Minnesota Avenue % Deanwood % Cheverly % Landover 1, % , New Carrollton 5, % Capitol Heights 572 1,105 93% Addison Road 1,268 1,160 0% , Morgan Boulevard % Largo Town Center 2,299 3,215 40% , ,280 61,883 54,563 7,322 7,319 Page 30
106 Washington, D.C. Area: New Starts Travel Forecasting Model Table 19: Affect of Parking Capacity Restraint on Metrorail Constants (in Equivalent Minutes) Low Income Medium Income High Income Before After Page 31
107
108 Washington, D.C. Area: New Starts Travel Forecasting Model Page E-1
109 Appendix C
110 Corridor Cities Non-Included Attributes The Federal Transit Administration (FTA), in their 2007 Proposed Guidance on New Start / Small Starts Policies and Procedures, proposed new guidelines for calculating and reporting user benefits associated with characteristics of a transit line not included in a travel demand model. Modeled attributes include travel time, frequency and wait time, and fares and parking costs. Service attributes not part of travel demand models include its visibility, reliability, span of service hours, comfort, protection from the weather, the chances of finding a seat, and passenger amenities. These non-included attributes are theoretically part of the mode-specific constant for existing transit modes being modeled. New modes are required by the FTA to use a mode-specific constant of 0, but are now allowed to take credit for any non-included attributes by using a post-processing procedure that applies user benefits (time savings) to certain riders of the proposed transit line. Those user benefits are determined by the type and nature of the attributes of the new mode. FTA proposes to credit projects that introduce a transit mode to an urban area with additional transportation benefits, the magnitude of which will depend on the characteristics of the proposed project and the number of transit trips predicted to use the project. The additional benefits will occur in three forms: (1) a relatively large positive constant for trips using the project via park & ride access and no dependence on local buses; (2) a smaller positive constant for all other trips on the project; and (3) a less onerous weight applied to the time spent riding on the new facility compared to the weight applied to time on all other modes. The large constant will not be applied to walk trips to the proposed project because of the inability of current travel models to distinguish the walk-to-guideway-only market from all other walk-to-transit markets, a limitation that would produce a gross over-estimation of the size of that market. FTA will determine the values of the constants and travel-time weight based on three types of project characteristics that are not recognized in current methods for ridership forecasting: Guideway-like Characteristics Reliability of vehicle arrival (up to four minutes for trips using park & ride access with no dependence on local bus, and up to two minutes for all other trips using the proposed project): depending on the extent that the vehicle right-of-way is grade-separated and the extent of traffic signal priority or pre-emption along portions of the alignment that are controlled by traffic signals; Branding/visibility/learnability (two minutes, one minute): depending on the extent that stations, vehicles, and right-of-way are distinctive, and the system is easy to use; Schedule-free service (two minutes, zero minutes): depending on the extent to which service headways are less than 10 minutes in the peak period and less than 15 minutes during the offpeak; 1
111 Span of Good Service Hours of frequent service (three minutes, zero minutes): depending on the extent to which weekday service extends beyond the peak period with headways that are less than 30 minutes; Passenger Amenities Stations/stops (three minutes, two minutes): depending on the extent to which these have passenger amenities that relate to safety and security features, protection from the weather, retail activities, comfort, and other features valued by users; Dynamic schedule information (one minute, one minute): depending on the provision of real time information on vehicle arrivals at stations; and Vehicle amenities (discount on the weight applied to time spent on the transit vehicle of up to 20 percent): depending factors such as comfort, and the probability of getting a seat of the proposed service. Because the values listed above are the maximum possible credit for each characteristic, the specific values assigned to each project will depend on specific characteristics of the project. For example, a project running at grade through intersections without traffic signal priority or pre- emption would have a significantly lower value for reliability compared to a project in a tunnel, on an aerial structure, or on other dedicated right-of-way for which travel is uninterrupted by cross traffic 1. To derive the non-included benefits for a specific project, each of the attributes described above are assessed for the degree to which they are incorporated in the design of the proposed project. A premium only service, incorporating exclusive guideway, next train information, and clear signage and branding, can derive the maximum benefit, while areas of mixed traffic operations and fixed schedules will derive less benefit. The possible range for each attribute is shown below in Table 1. Table 1: Potential Benefits from Non-included Attributes Non-included attribute Max benefit Premium only Premium + local Local Guideway-like characteristics reliability of vehicle arrival branding/visibility/learnability schedule-free service Span of good service Passenger amenities stations/stops FTA 2007 Proposed Guidance on New Start / Small Starts Policies and Procedures 2
112 - dynamic schedule information TOTAL IVT coefficient 0.85*Civt 0.95*Civt Civt - ride quality - vehicle amenities - reliability of travel time - availability of seat 3
113 Corridor Cities LRT Non-included Attributes The non-included attributes for the light rail mode match those already accepted by FTA for the Purple Line Study since light rail constructed in for the CCT project would match the Purple Line in all attributes. Non-included attributes for the CCT light rail are shown in Table 2 and described below. Table 2: Non-included Attributes for CCT Light Rail Non-included attribute Premium Only Premium + local Guideway-like characteristics reliability of vehicle arrival branding/visibility/learnability schedule-free service Span of good service Passenger amenities stations/stops dynamic schedule information TOTAL IVT coefficient - ride quality - vehicle amenities - reliability of travel time - availability of seat 0.90*Civt 0.95*Civt Guideway-like Characteristics Reliability of vehicle arrival (2.0 minutes for trips using park & ride access with no dependence on local bus, and 1.2 minutes for all other trips using the proposed project): Schedule adherence will be better than local bus but not as high as Metrorail. The CCT light rail alternative includes exclusive, grade-separated guideway for much of the corridor, allowing higher speeds and little or no delay from at-grade crossings. In several places CCT light rail would employ either a tunnel or aerial structure in order to avoid signalized intersections. Branding/visibility/learnability (1.5 minutes, 0.8 minute): CCT light rail will be very visible with much of the guideway at-grade, adjacent to major arterials. The vehicles will be new, low-floor, attractive light rail vehicles with bright interiors and air-conditioning. While stations will be generally easy to find and to use, some stations will be in the median of streets, and some of those will have side platforms necessitating passengers to determine the correct direction of travel. 4
114 Schedule-free service (1.5 minutes, zero minutes): CCT light rail will operate at 6 minutes in the peak period and 10 minutes during the off-peak, providing service more frequent than the thresholds of 10 and 15 minutes respectively. Span of Good Service Hours of frequent service (2.0 minutes, zero minutes): CCT light rail is expected to match the span of service of WMATA s Metrorail, with 20 hours of service Sunday through Thursday and 22 hours of service on Fridays and Saturdays. Passenger Amenities Stations/stops (1.5 minutes, 1.0 minute): All stations will have canopies, benches, and platforms for level boarding. Stations will also have ticket vending machines and fare payment will be off-vehicle. CCT light rail stations will not be fully-enclosed, staffed stations like Metrorail. Dynamic schedule information (1.0 minute, 1.0 minute): All stations will have Next Train schedule information. Vehicle amenities (discount on the weight applied to time spent on the transit vehicle of up to 20 percent): The light rail cars will be low-floor, air conditioned, with large doors for easy boarding, and between 62 and 72 seats. Boardings and alightings will take place at front and back doors. Together the non-included attributes for the CCT light rail totals 9.5 minutes of savings of a possible 15 minutes for Premium Only service and 4.0 minutes of a possible 6.0 minutes for Premium plus Local Bus service. 5
115 Corridor Cities BRT Non-included Attributes The CCT bus rapid transit alternative is designed to have virtually the same characteristics and amenities as the light rail mode, with the only difference being the vehicle and guideway employed. Therefore, CCT bus rapid transit non-included attributes are expected to be the same as light rail. Non-included attributes for the CCT bus rapid transit are shown in Table 3 and described below. Table 3: Non-included Attributes for CCT Bus Rapid Transit Non-included attribute Premium Only Premium + local Guideway-like characteristics reliability of vehicle arrival branding/visibility/learnability schedule-free service Span of good service Passenger amenities stations/stops dynamic schedule information TOTAL IVT coefficient - ride quality - vehicle amenities - reliability of travel time - availability of seat 0.90*Civt 0.95*Civt Guideway-like Characteristics Reliability of vehicle arrival (2.0 minutes for trips using park & ride access with no dependence on local bus, and 1.2 minutes for all other trips using the proposed project): Schedule adherence will be better than local bus but not as high as Metrorail. The CCT bus rapid transit alternative includes exclusive, grade-separated guideway for much of the corridor, allowing higher speeds and little or no delay from at-grade crossings. In several places CCT bus rapid transit would employ either a tunnel or aerial structure in order to avoid signalized intersections. Branding/visibility/learnability (1.5 minutes, 0.8 minutes): CCT bus rapid transit will be very visible with much of the guideway at-grade, adjacent to major arterials. The vehicles will be new, low-floor, attractive 60-ft articulated buses. While stations will be generally easy to find and to use, some stations will be in the median of streets, and some of those will have side platforms necessitating passengers to determine the correct direction of travel. 6
116 Schedule-free service (1.5 minutes, zero minutes): CCT bus rapid transit will operate at 6 minutes in the peak period and 10 minutes during the off-peak, providing service more frequent than the thresholds of 10 and 15 minutes respectively. Span of Good Service Hours of frequent service (2.0 minutes, zero minutes): CCT bus rapid transit is expected to match the span of service of WMATA s Metrorail, with 20 hours of service Sunday through Thursday and 22 hours of service on Fridays and Saturdays. Passenger Amenities Stations/stops (1.5 minutes, 1.0 minutes): All stations will have canopies, benches, and platforms for level boarding. Stations will also have ticket vending machines and fare payment will be off-vehicle. Unlike Metrorail, CCT bus rapid transit stations will be open air and unstaffed. Dynamic schedule information (1.0 minute, 1.0 minute): All stations will have Next Bus schedule information. Vehicle amenities (discount on the weight applied to time spent on the transit vehicle of up to 20 percent): CCT bus rapid transit will employ low-floor articulated buses. Boardings and alightings will take place at front and back doors. Together the non-included attributes for the CCT bus rapid transit totals 9.5 minutes of savings of a possible 15 minutes for Premium Only service and 4.0 minutes of a possible 6.0 minutes for Premium plus Local Bus service. 7
117 Appendix D
118 Maryland Transit Administration Washington Area New Starts Model Phase II Documentation Bus Speed Model DRAFT I. Background and Objective The current implementation of the MTA Model applies fixed end to end run times for buses. Run times for the base year are taken from the 2000 bus schedule times. Forecasted local bus times are degraded by a fixed factor, using a slightly larger factor for each incremental future year. Express bus run times are not degraded. The model assumes that local buses in the region s core during the peak period travel at speed that is 10% slower than in 2000 (see Table 1). Such an approach does not explicitly link roadway and bus speeds, and results in inaccurate future year bus travel times. In specific corridors where roadway congestion is expected to increase rapidly this approach can result in bus travel times that are forecasted to be unrealistically short relative to the travel times for the same roadways on which the buses are traveling. Table 1: MCOG Local Bus Run Time Factors (percent of base year scheduled time) WMATA and Primary Local Bus Secondary Local Bus Peak 9.8% 23.9% Off Peak 6.9% 13.0% The purpose of this task is to develop a function that will estimate additional link level bus time delay (over highway time) based the relationship between the highway time, the observed transit time, facility type, area type, and time of day. This function is then applied to buses in the future year to estimate bus speeds relative to the congestion on the roadways on which they are operating. This delay is applied as follows: Bus travel time = Highway travel time + delay (minutes per mile) * link distance II. Methodology The only source of observed roadway and bus speeds are the speeds that are assumed for the base year (2000) calibrated/validated model. We have assumed that the RUNTIME variables in the bus route line cards adequately represent the observed time it takes for a bus to travel its route. The link by link bus travel times are generated by TRNBUILD. The roadway link by link congested travel times are calculated from the highway network after the network is built and the speed/capacity assumptions applied in the model stream. A TP+ script is used to export link level highway speeds, distances and times to a comma delimited file. The estimation of the bus speed delay rate is implemented in an Excel workbook. For each unique combination of area type and facility type, average variances between link level highway times and bus times are calculated. For combinations of facility type and area type that have few links with observed Over a Century of Page 1 Engineering Excellence
119 Maryland Transit Administration Washington Area New Starts Model Phase II Documentation Bus Speed Model DRAFT transit time, manual smoothing is used to obtain consistent, reasonable additional delays. Additional manual adjustments are made to minimize the system wide route percent root mean square error (RMSE) between the total run times derived with the estimated bus speed model and RUNTIMES coded on the bus line cards. The bus speed model assumes that highway congestion adequately reflects the difference in peak and off peak bus speeds. Slowing down off peak buses at a different rate than peak buses can result in the undesirable situation in which off peak buses travel slower than peak buses on the same highway link (this can only occur in the implemented model if the off peak highway speed is slower than the peak highway speed). The service type (express vs. local) segmentation was eliminated because the TRNBUILD module of TP+ does not allow the user to specify separate expressions for transit time by mode. Therefore, we cannot specify one expression for express bus time and another for local bus time. As such, a single set of factors, used to represent all buses, are calibrated. III. Results and Conclusions After manual adjustments to the bus speed deterioration functions, a final percent RMSE of 29.5% was achieved. The estimated deterioration rates are shown in Table 1. These additional minutes of delay will be re estimated after the final network edits are completed for the MDAA2 model (Phase II using the COG v2.2 model). Table 2: Bus Speed Model Additional Minutes of Delay per Mile Facility Type Area Major Minor Centroid Freeway Type Arterial Arterial Collector Expressway Ramps Figure 1 shows a comparison of Peak Observed total run times by route to estimated run times based on the bus speed model. Figure 2 shows the same for the off peak. The peak scatter plot shows a slope of 1.04 and an R 2 of between observed and estimated. As noted above, the model was Over a Century of Page 2 Engineering Excellence
120 Maryland Transit Administration Washington Area New Starts Model Phase II Documentation Bus Speed Model DRAFT estimated on Peak period data, under the assumption that the relationship between highway congestion and transit travel times is independent of time of day. Figure 1: Scatter Plot of "Observed" by Estimated Transit Run Times by Route Peak Period Computed Runtime Run Time runtime Linear (runtime) Over a Century of Page 3 Engineering Excellence
121 Figure 2: Scatter Plot of "Observed by Estimated Transit Run Times by Route Off Peak Maryland Transit Administration Washington Area New Starts Model Phase II Documentation Bus Speed Model DRAFT Computed Runtime comptime Linear (comptime) Run Time IV. Implementation A. Script Changes The model stream was modified to allow for these deterioration factors to be added to the transit speeds. The following changes were made to the transit skimming scripts: 1. A script is added before the transit skimming scripts to compute the peak and off peak bus travel times for each link in the highway network. A background, temporary highway network (I6HWYP.BUS.NET) is created with these transit travel times to be referenced in the transit skimming scripts. 2. Each of the transit skimming and assignment scripts is modified, including the shadow skimming scripts (for parking capacity restraint). 3. The reference to the run time factors in the skimming scripts (LBus_TimFTRS.ASC) is removed. Also, the bus runtime factor variables _IBFTR and _OBFTR have been removed. 4. Global variables PEAK_MODEL and OFF_PEAK_MODEL are added to the global loops in the skimming scripts. This allows the use different bus times for the peak and off peak skims. 5. The HWYTIME variable obtains its value from the temporary highway network, I6HWYP.BUS.NET. Over a Century of Page 4 Engineering Excellence
122 Maryland Transit Administration Washington Area New Starts Model Phase II Documentation Bus Speed Model DRAFT 6. USERUNTIME = Y is replaced with USERUNTIME = N. The following changes are made to the transit assignment scripts: 1. The HWYTIME variable obtains its value for peak time and off peak transit travel times from the temporary highway network, I6HWY.BUS.NET. 2. USERUNTIME = Y is replaced with USERUNTIME = N. B. Testing The model was tested by applying these factors. Differences in mode choice model results are illustrated in Table 3. The magnitude of the change is considered inconsequential, and does not represent a problem for base year validation. Table 3: Comparison of Mode Choice Results with and without Bus Speed Model 2000 Base MDAA Phase I Base Year (using static run time parameters) Bus Speed Model Difference % Difference Auto Drive Alone 10,549,120 10,544,175 4, % Shared Ride 2 6,513,663 6,511,720 1, % Shared Ride 3+ 4,426,057 4,424,555 1, % Subtotal 21,488,839 21,480,450 8, % Transit Bus 338, ,291 12, % Metrorail 532, ,906 4, % Commuter Rail 23,100 22, % Subtotal 894, ,826 8, % Grand Total 22,383,276 22,383, % Over a Century of Page 5 Engineering Excellence
123 Appendix E
124 Maryland Transit Administration Washington Area New Starts Model Phase II Documentation Transit Fares DRAFT Modification of the Application of Transit Fares I. Background and Objectives The existing zone to zone fares that are generated by the MWCOG Travel Demand Model are a composite of fares for all transit modes. For regional modeling and conformity analysis this approach has worked well, but for purposes of detailed analysis of specific transit projects in narrow corridors, particularly when new modes with new fare policies are introduced, a means of distinguishing fares by mode is important. The objective of this task was to develop a method for extracting and applying zone to zone transit fares by major mode. So, for example, the commuter rail path from zone I to zone J would include the total cost of the Commuter rail transit fares including commuter rail and any feeder bus fares. II. Methodology The approach required the development of four data tables: 1. A unique set of system fare types (for bus and commuter rail trips only) and associated boarding fares. (Baker Engineering developed this list, which is documented in the attached memo (Attachment C), dated November 14, This memo outlined the initial fare structure concept, which has been modified as it was finally implemented.) 2. Transfer policies and fares associated with boardings and transfers between system fare types (see above mentioned memo from Baker Engineering and the final boarding and transfer fares used as shown in Attachment B). 3. Unique and temporary mode codes for each system fare type (see the cross reference in Attachment A). Temporary mode codes are assigned based on a combination of prefixes and original mode codes. 4. Fare links with zone based fares for commuter buses. An external program was developed to temporarily translate modes in the transit line files to new temporary bus fare modes. A TRNBUILD skimming script assigns a bus and/or commuter rail fare for each zone to zone skim based on the mode to mode transfers generated for each alternative. Where Metrorail in vehicle time is found in a zone to zone path the station to station Metrorail fare is added to the bus fare. If no bus in vehicle time is found in a Metrorail path a zero bus fare is added to the Metrorail fare. The mode modification program and revised TRANBUILD script have been incorporated Over a Century of Engineering Excellence Page 1 of 12
125 Maryland Transit Administration Washington Area New Starts Model Phase II Documentation Transit Fares DRAFT into model stream for the MDAAII (Maryland Alternatives Analysis Phase II). Bus and commuter rail fares are assumed not to vary by time of day. Existing Metrorail fare data (as of 12/02/2008) from each station to station pair was taken from WMATA website. These 2008 fares were scaled down to 2005 based on the data provided by Metrorail. Peak and off peak final zone to zone fares are stored in separate dbf files and called by the fare building script. III. Results and Conclusions The following table shows the zone to zone fares for some selected zone to zone pairs for alternative major modes before and after the change in fare allocation process. Peak Period, Walk to Transit Fares (incl. transfers) FROM TO MDAAII COG v2.2 TAZ TAZ Bus Metrorail Comm. Rail 1043 Frederick 19 Metro Center Vienna 19 Metro Center No Path Silver Spring 64 Union Station No Path Manassas 64 Union Station New Carltn 64 Union Station Alexandria 64 Union Station Over a Century of Engineering Excellence Page 2 of 12
126 Attachment A: Routes and Temporary Mode Codes Maryland Transit Administration Washington Area New Starts Model Phase II Documentation Transit Fares DRAFT Route Mode Prefix Temp FRED1I 4 FR 5 FRED1O 4 FR 5 FRED2I 4 FR 5 FRED3O 4 FR 5 MASS1I 4 MA 5 MASS1O 4 MA 5 MASS2O 4 MA 5 MBRU1I 4 MB 4 MBRU1O 4 MB 4 MBRU2I 4 MB 4 MBRU2O 4 MB 4 MBRU3I 4 MB 4 MCAM1I 4 MC 4 MCAM1O 4 MC 4 MCAM2I 4 MC 4 MCAM3O 4 MC 4 MCAM3O 4 MC 4 MCAM4O 4 MC 4 MFREDI 4 FR 5 MPEN1I 4 MP 4 MPEN1I 4 MP 4 MPEN1O 4 MP 4 MPEN1O 4 MP 4 MPEN2I 4 MP 4 MPEN2O 4 MP 4 MPEN3I 4 MP 4 VFRED1I 4 FR 5 VFRED1O 4 FR 5 VMASS1I 4 MA 5 VMASS1O 4 MA 5 VMASS2I 4 MA 5 VMASS2O 4 MA 5 ART41E 6 ART 17 ART41N 6 ART 17 ART41N 6 ART 17 ART41S 6 ART 17 ART41S 6 ART 17 ART41W 6 ART 17 ART51I 6 ART 17 ART51I 6 ART 17 ART51O 6 ART 17 ART51O 6 ART 17 Over a Century of Engineering Excellence Route Mode Prefix Temp ART52 6 ART 17 ART52I 6 ART 17 ART52I 6 ART 17 ART52O 6 ART 17 ART52O 6 ART 17 ART53E 6 ART 17 ART53E 6 ART 17 ART53W 6 ART 17 ART53W 6 ART 17 ART61L 6 ART 17 ART62 6 ART 17 ART66L 6 ART 17 ART67L 6 ART 17 ART73L 6 ART 17 ART74L 6 ART 17 ART75I 6 ART 17 ART75O 6 ART 17 ART82% 6 ART 17 ART82L 6 ART 17 ART90L 6 ART 17 DAT10 6 DAT 18 DAT10 6 DAT 18 DAT10I 6 DAT 18 DAT10I 6 DAT 18 DAT2%E 6 DAT 18 DAT2%E 6 DAT 18 DAT2%O 6 DAT 18 DAT2%W 6 DAT 18 DAT2%W 6 DAT 18 DAT2E 6 DAT 18 DAT2EI 6 DAT 18 DAT2W 6 DAT 18 DAT2W 6 DAT 18 DAT2WO 6 DAT 18 DAT3%4L 6 DAT 18 DAT3LI 6 DAT 18 DAT3O 6 DAT 18 DAT4%I 6 DAT 18 DAT4%O 6 DAT 18 DAT4I 6 DAT 18 DAT4LO 6 DAT 18 DAT5I 6 DAT 18 Route Mode Prefix Temp DAT5I 6 DAT 18 DAT5O 6 DAT 18 DAT5O 6 DAT 18 DAT6% 6 DAT 18 DAT6I 6 DAT 18 DAT6I 6 DAT 18 DAT6O 6 DAT 18 DAT6O 6 DAT 18 DAT7%I 6 DAT 18 DAT7I 6 DAT 18 DAT7I 6 DAT 18 DAT7O 6 DAT 18 DAT7O 6 DAT 18 DAT8%I 6 DAT 18 DAT8%I 6 DAT 18 DAT8%O 6 DAT 18 DAT8%O 6 DAT 18 DAT8I 6 DAT 18 DAT8I 6 DAT 18 DAT8O 6 DAT 18 DAT8O 6 DAT 18 DATLL 6 DAT 18 F101I 6 F 20 F101N 6 F 20 F101N 6 F 20 F101O 6 F 20 F101S 6 F 20 F101S 6 F 20 F102I 6 F 20 F103LI 6 F 20 F103LO 6 F 20 F105%I 6 F 20 F105%O 6 F 20 F105A 6 F 20 F105BI 6 F 20 F105CI 6 F 20 F105I 6 F 20 F105O 6 F 20 F106I 6 F 20 F106O 6 F 20 F107%I 6 F 20 F107O 6 F 20 Page 3 of 12
127 Maryland Transit Administration Washington Area New Starts Model Phase II Documentation Transit Fares DRAFT Route Mode Prefix Temp F108I 6 F 20 F108O 6 F 20 F109 6 F 20 F109E 6 F 20 F109E 6 F 20 F109I 6 F 20 F109O 6 F 20 F109W 6 F 20 F109W 6 F 20 F110%I 6 F 20 F110I 6 F 20 F110O 6 F 20 F112L 6 F 20 F151CC 6 F 20 F151CC 6 F 20 F152C 6 F 20 F152C 6 F 20 F161CC 6 F 20 F161CC 6 F 20 F162C 6 F 20 F162C 6 F 20 F171E 6 F 20 F171E 6 F 20 F171W 6 F 20 F171W 6 F 20 F202I 6 F 20 F202O 6 F 20 F203I 6 F 20 F203O 6 F 20 F204I 6 F 20 F204O 6 F 20 F231CC 6 F 20 F232C 6 F 20 F232C 6 F 20 F301E 6 F 20 F301I 6 F 20 F301O 6 F 20 F301W 6 F 20 F303I 6 F 20 F303N 6 F 20 F303O 6 F 20 F303S 6 F 20 F304I 6 F 20 F304LI 6 F 20 F304LO 6 F 20 F304O 6 F 20 F305I 6 F 20 Over a Century of Engineering Excellence Route Mode Prefix Temp F307E 6 F 20 F307W 6 F 20 F310E 6 F 20 F310E 6 F 20 F310W 6 F 20 F310W 6 F 20 F311I 6 F 20 F311O 6 F 20 F321CC 6 F 20 F321CC 6 F 20 F322C 6 F 20 F322C 6 F 20 F331CC 6 F 20 F331CC 6 F 20 F332C 6 F 20 F332C 6 F 20 F401I 6 F 20 F401N 6 F 20 F401N 6 F 20 F401O 6 F 20 F401S 6 F 20 F401S 6 F 20 F402E 6 F 20 F402I 6 F 20 F403O 6 F 20 F403W 6 F 20 F404I 6 F 20 F404O 6 F 20 F504I 6 F 20 F504O 6 F 20 F505I 6 F 20 F505O 6 F 20 F556A 6 F 20 F556E 6 F 20 F556L 6 F 20 F574E 6 F 20 F574E 6 F 20 F574I 6 F 20 F574O 6 F 20 F574W 6 F 20 F574W 6 F 20 F605I 6 F 20 F605N 6 F 20 F605N 6 F 20 F605O 6 F 20 F605S 6 F 20 F605S 6 F 20 Route Mode Prefix Temp F922L 6 F 20 F922L 6 F 20 F924I 6 F 20 F924S 6 F 20 F926N 6 F 20 F926O 6 F 20 F927L 6 F 20 F927L 6 F 20 F929L 6 F 20 FRIBS1 6 FR 19 FRIBS1 6 FR 19 FRIBS2 6 FR 19 FRIBS2 6 FR 19 FRIBS3 6 FR 19 FRIBS3 6 FR 19 FRIBS4 6 FR 19 FRIBS4 6 FR 19 GO11L 6 GO 23 GO11L 6 GO 23 GO12L 6 GO 23 GO12L 6 GO 23 GO13L 6 GO 23 GO13L 6 GO 23 GO14E 6 GO 23 GO14E 6 GO 23 GO14W 6 GO 23 GO14W 6 GO 23 GO15E 6 GO 23 GO15E 6 GO 23 GO15W 6 GO 23 GO15W 6 GO 23 GO15X 6 GO 23 GO16N 6 GO 23 GO16N 6 GO 23 GO16S 6 GO 23 GO16S 6 GO 23 GO17N 6 GO 23 GO17N 6 GO 23 GO17S 6 GO 23 GO17S 6 GO 23 GO18N 6 GO 23 GO18N 6 GO 23 GO18S 6 GO 23 GO18S 6 GO 23 GO20 6 GO 23 GO20 6 GO 23 GO21 6 GO 23 Page 4 of 12
128 Maryland Transit Administration Washington Area New Starts Model Phase II Documentation Transit Fares DRAFT Route Mode Prefix Temp GO21 6 GO 23 GO21S 6 GO 23 GO21XN 6 GO 23 GO21XS 6 GO 23 GO21XS 6 GO 23 GO22 6 GO 23 GO22N 6 GO 23 GO22N 6 GO 23 GO22S 6 GO 23 GO22S 6 GO 23 GO23 6 GO 23 GO23 6 GO 23 GO24 6 GO 23 GO24E 6 GO 23 GO24E 6 GO 23 GO24W 6 GO 23 GO24W 6 GO 23 GO25E 6 GO 23 GO25E 6 GO 23 GO25L 6 GO 23 GO25W 6 GO 23 GO25W 6 GO 23 GO26E 6 GO 23 GO26E 6 GO 23 GO26W 6 GO 23 GO26W 6 GO 23 GO27E 6 GO 23 GO27N 6 GO 23 GO27N 6 GO 23 GO27W 6 GO 23 GO28N 6 GO 23 GO28N 6 GO 23 GO28S 6 GO 23 GO28S 6 GO 23 GO30 6 GO 23 GO30 6 GO 23 GO32N 6 GO 23 GO32N 6 GO 23 GO32S 6 GO 23 GO32S 6 GO 23 GO33 6 GO 23 GO33 6 GO 23 GO34 6 GO 23 GO34 6 GO 23 GO51%L 6 GO 23 GO51%L 6 GO 23 GO51L 6 GO 23 Over a Century of Engineering Excellence Route Mode Prefix Temp GO51L 6 GO 23 GO53L 6 GO 23 GO53L 6 GO 23 ICCA 6 ICC 24 ICCB 6 ICC 24 ICCC 6 ICC 24 ICCD 6 ICC 24 ICCE 6 ICC 24 ICCF 6 ICC 24 REXS 6 REX 2 RIBS1L 6 RI 19 RIBS2L 6 RI 19 RIBS3L 6 RI 19 RIBS4L 6 RI 19 RO01 6 RO 24 RO01 6 RO 24 RO01BO 6 RO 24 RO01I 6 RO 24 RO02 6 RO 24 RO02 6 RO 24 RO02AO 6 RO 24 RO02I 6 RO 24 RO03O 6 RO 24 RO04 6 RO 24 RO04 6 RO 24 RO05B 6 RO 24 RO05B 6 RO 24 RO05I 6 RO 24 RO05O 6 RO 24 RO06AI 6 RO 24 RO06BI 6 RO 24 RO06BI 6 RO 24 RO06DO 6 RO 24 RO06DO 6 RO 24 RO07AI 6 RO 24 RO07I 6 RO 24 RO07O 6 RO 24 RO08 6 RO 24 RO08A 6 RO 24 RO08A 6 RO 24 RO09 6 RO 24 RO09A 6 RO 24 RO09A 6 RO 24 RO09I 6 RO 24 RO09O 6 RO 24 RO10 6 RO 24 RO10 6 RO 24 Route Mode Prefix Temp RO100 6 RO 24 RO100 6 RO 24 RO100R 6 RO 24 RO100R 6 RO 24 RO11I 6 RO 24 RO11O 6 RO 24 RO11O 6 RO 24 RO12 6 RO 24 RO12 6 RO 24 RO124I 6 RO 24 RO124O 6 RO 24 RO12I 6 RO 24 RO12O 6 RO 24 RO13I 6 RO 24 RO13O 6 RO 24 RO14 6 RO 24 RO14AI 6 RO 24 RO14AI 6 RO 24 RO14BI 6 RO 24 RO14BI 6 RO 24 RO14O 6 RO 24 RO14O 6 RO 24 RO15 6 RO 24 RO15 6 RO 24 RO15I 6 RO 24 RO15O 6 RO 24 RO16 6 RO 24 RO16 6 RO 24 RO16AI 6 RO 24 RO16AO 6 RO 24 RO17 6 RO 24 RO17 6 RO 24 RO17I 6 RO 24 RO17O 6 RO 24 RO18 6 RO 24 RO18 6 RO 24 RO18AI 6 RO 24 RO18AO 6 RO 24 RO18B 6 RO 24 RO18B 6 RO 24 RO18I 6 RO 24 RO18O 6 RO 24 RO19AO 6 RO 24 RO19I 6 RO 24 RO19O 6 RO 24 RO20DO 6 RO 24 RO20DO 6 RO 24 Page 5 of 12
129 Maryland Transit Administration Washington Area New Starts Model Phase II Documentation Transit Fares DRAFT Route Mode Prefix Temp RO20I 6 RO 24 RO20I 6 RO 24 RO20O 6 RO 24 RO22I 6 RO 24 RO22O 6 RO 24 RO23 6 RO 24 RO23I 6 RO 24 RO23I 6 RO 24 RO23O 6 RO 24 RO23O 6 RO 24 RO24I 6 RO 24 RO25I 6 RO 24 RO25I 6 RO 24 RO25O 6 RO 24 RO25O 6 RO 24 RO26 6 RO 24 RO26 6 RO 24 RO26I 6 RO 24 RO26O 6 RO 24 RO28I 6 RO 24 RO28I 6 RO 24 RO29 6 RO 24 RO29 6 RO 24 RO30 6 RO 24 RO30AI 6 RO 24 RO30AI 6 RO 24 RO30O 6 RO 24 RO30O 6 RO 24 RO31 6 RO 24 RO32BI 6 RO 24 RO32O 6 RO 24 RO33 6 RO 24 RO33I 6 RO 24 RO33I 6 RO 24 RO33O 6 RO 24 RO34B 6 RO 24 RO34B 6 RO 24 RO34BI 6 RO 24 RO34BO 6 RO 24 RO34I 6 RO 24 RO35 6 RO 24 RO36 6 RO 24 RO36 6 RO 24 RO36AO 6 RO 24 RO36I 6 RO 24 RO36O 6 RO 24 RO37AI 6 RO 24 Over a Century of Engineering Excellence Route Mode Prefix Temp RO37O 6 RO 24 RO38 6 RO 24 RO38BO 6 RO 24 RO38CI 6 RO 24 RO38CI 6 RO 24 RO38I 6 RO 24 RO38O 6 RO 24 RO39AO 6 RO 24 RO39I 6 RO 24 RO41 6 RO 24 RO41 6 RO 24 RO42 6 RO 24 RO42 6 RO 24 RO42I 6 RO 24 RO42O 6 RO 24 RO43 6 RO 24 RO43 6 RO 24 RO44 6 RO 24 RO45 6 RO 24 RO45 6 RO 24 RO46 6 RO 24 RO46 6 RO 24 RO47 6 RO 24 RO47 6 RO 24 RO48 6 RO 24 RO48 6 RO 24 RO49 6 RO 24 RO49 6 RO 24 RO51 6 RO 24 RO52I 6 RO 24 RO52O 6 RO 24 RO53 6 RO 24 RO54 6 RO 24 RO54 6 RO 24 RO55 6 RO 24 RO55 6 RO 24 RO56 6 RO 24 RO56 6 RO 24 RO57 6 RO 24 RO57 6 RO 24 RO58 6 RO 24 RO58 6 RO 24 RO59 6 RO 24 RO59 6 RO 24 RO60 6 RO 24 RO61 6 RO 24 RO61 6 RO 24 Route Mode Prefix Temp RO63 6 RO 24 RO63 6 RO 24 RO64 6 RO 24 RO64 6 RO 24 RO65 6 RO 24 RO66 6 RO 24 RO67 6 RO 24 RO70I 6 RO 24 RO70O 6 RO 24 RO71 6 RO 24 RO74I 6 RO 24 RO74I 6 RO 24 RO74O 6 RO 24 RO74O 6 RO 24 RO75 6 RO 24 RO75 6 RO 24 RO76I 6 RO 24 RO76I 6 RO 24 RO76O 6 RO 24 RO78I 6 RO 24 RO78O 6 RO 24 RO79 6 RO 24 RO81 6 RO 24 RO82 6 RO 24 RO83 6 RO 24 RO83 6 RO 24 RO90 6 RO 24 RO90 6 RO 24 RO92 6 RO 24 RO92I 6 RO 24 RO93 6 RO 24 RO96 6 RO 24 RO96 6 RO 24 RO96%I 6 RO 24 RO96AI 6 RO 24 RO96AO 6 RO 24 RO97 6 RO 24 RO97 6 RO 24 RO98 6 RO 24 RO98 6 RO 24 SGOLD1 6 SG 21 SGOLD1 6 SG 21 SGOLD2 6 SG 21 SGOLD2 6 SG 21 SGRN1 6 SG 21 SGRN1 6 SG 21 SGRN2 6 SG 21 Page 6 of 12
130 Maryland Transit Administration Washington Area New Starts Model Phase II Documentation Transit Fares DRAFT Route Mode Prefix Temp SGRN2 6 SG 21 TSMA 6 TSM 24 TSMB 6 TSM 24 TSMC 6 TSM 24 TSMD 6 TSM 24 TSME 6 TSM 24 VREEZN 6 VRE 19 VREEZS 6 VRE 19 DAT3I 7 DAT 18 DAT3O 7 DAT 18 DAT4%I 7 DAT 18 DAT4I 7 DAT 18 DAT4O 7 DAT 18 F1 7 F 20 F1 7 F 20 F2I 7 F 20 F2I 7 F 20 F2O 7 F 20 F2O 7 F 20 F306I 7 F 20 F306N 7 F 20 F306O 7 F 20 F306S 7 F 20 F380N 7 F 20 F380S 7 F 20 F383I 7 F 20 F384I 7 F 20 F384O 7 F 20 F385I 7 F 20 F3I 7 F 20 F3I 7 F 20 F3O 7 F 20 F3O 7 F 20 F425LI 7 F 20 F425LI 7 F 20 F425LO 7 F 20 F425LO 7 F 20 F427LI 7 F 20 F427LI 7 F 20 F427LO 7 F 20 F427LO 7 F 20 F505E 7 F 20 F505I 7 F 20 F505O 7 F 20 F505W 7 F 20 F505W 7 F 20 F551E 7 F 20 Over a Century of Engineering Excellence Route Mode Prefix Temp F551I 7 F 20 F551O 7 F 20 F551W 7 F 20 F552E 7 F 20 F552I 7 F 20 F553AI 7 F 20 F553E 7 F 20 F554E 7 F 20 F554I 7 F 20 F557E 7 F 20 F557I 7 F 20 F585E 7 F 20 F585E 7 F 20 F585I 7 F 20 F585O 7 F 20 F585W 7 F 20 F595E 7 F 20 F597E 7 F 20 F621I 7 F 20 F621LI 7 F 20 F621LO 7 F 20 F621O 7 F 20 F622I 7 F 20 F622L 7 F 20 F622O 7 F 20 F623I 7 F 20 F623LI 7 F 20 F623LO 7 F 20 F623O 7 F 20 F950E 7 F 20 F950E 7 F 20 F950I 7 F 20 F950O 7 F 20 F950W 7 F 20 F950W 7 F 20 F951O 7 F 20 F952O 7 F 20 F952W 7 F 20 F952W 7 F 20 F980E 7 F 20 F980I 7 F 20 F980W 7 F 20 F984I 7 F 20 F984O 7 F 20 F989I 7 F 20 CCLS1 8 CC 28 CCLS1 8 CC 28 Route Mode Prefix Temp CCLS2 8 CC 28 CCLS2 8 CC 28 CCLS3 8 CC 28 CCLS3 8 CC 28 CCPF1I 8 CC 28 CCPF1L 8 CC 28 CCPF1L 8 CC 28 CCPF1O 8 CC 28 CCPF2I 8 CC 28 CCPF2L 8 CC 28 CCPF2O 8 CC 28 CCPFBI 8 CC 28 CCPFBI 8 CC 28 CCPFBO 8 CC 28 CCPFBO 8 CC 28 CCPFL 8 CC 28 CCPFMC 8 CC 28 CCPFMC 8 CC 28 CCPFSI 8 CC 28 CCPFSI 8 CC 28 CCPFSO 8 CC 28 CCPFSO 8 CC 28 CCS1 8 CC 28 CCS2 8 CC 28 FBRNI 8 FB 25 FBRNI 8 FB 25 FBRNO 8 FB 25 FBRNO 8 FB 25 FCECOI 8 FC 25 FCECOI 8 FC 25 FCECOO 8 FC 25 FCECOO 8 FC 25 FCT10I 8 FC 25 FCT10I 8 FC 25 FCT10O 8 FC 25 FCT10O 8 FC 25 FCT20 8 FC 25 FCT20 8 FC 25 FCT30 8 FC 25 FCT30 8 FC 25 FCT40 8 FC 25 FCT40 8 FC 25 FCT50 8 FC 25 FCT50 8 FC 25 FCT60 8 FC 25 FCT60 8 FC 25 FCT70 8 FC 25 Page 7 of 12
131 Maryland Transit Administration Washington Area New Starts Model Phase II Documentation Transit Fares DRAFT Route Mode Prefix Temp FCT70 8 FC 25 FCT85 8 FC 25 FEMTI 8 FE 25 FEMTO 8 FE 25 FT801 8 FT 25 FT802 8 FT 25 FT803 8 FT 25 FTMARC 8 FT 25 FTMDAY 8 FT 25 FTMDAY 8 FT 25 FTWALK 8 FT 25 HTBL1I 8 HT 26 HTBL1I 8 HT 26 HTBL1O 8 HT 26 HTBL2I 8 HT 26 HTBL2O 8 HT 26 HTBLUI 8 HT 26 HTBLUN 8 HT 26 HTBLUO 8 HT 26 HTBLUS 8 HT 26 HTBR1I 8 HT 26 HTBR1I 8 HT 26 HTBR1O 8 HT 26 HTBR1O 8 HT 26 HTBR2I 8 HT 26 HTBR2I 8 HT 26 HTBR2O 8 HT 26 HTBR2O 8 HT 26 HTBRN 8 HT 26 HTBRNI 8 HT 26 HTBRNO 8 HT 26 HTGRNL 8 HT 26 HTGRNL 8 HT 26 HTORGL 8 HT 26 HTPUR 8 HT 26 HTPURN 8 HT 26 HTPURN 8 HT 26 HTPURS 8 HT 26 HTPURS 8 HT 26 HTRDXI 8 HT 26 HTRDXI 8 HT 26 HTRDXO 8 HT 26 HTRDXO 8 HT 26 HTRED2 8 HT 26 HTREDI 8 HT 26 HTREDI 8 HT 26 HTREDO 8 HT 26 Over a Century of Engineering Excellence Route Mode Prefix Temp HTREDO 8 HT 26 HTSLVI 8 HT 26 HTSLVO 8 HT 26 HTUS1L 8 HT 26 HTUS1N 8 HT 26 HTYE2I 8 HT 26 HTYE2O 8 HT 26 HTYELI 8 HT 26 HTYELI 8 HT 26 HTYELO 8 HT 26 HTYELO 8 HT 26 HTYELX 8 HT 26 LA00AI 8 LA 27 LA00AI 8 LA 27 LA00AI 8 LA 27 LA00AO 8 LA 27 LA00AO 8 LA 27 LA00AO 8 LA 27 LB00A 8 LB 27 LB00A 8 LB 27 LB00AI 8 LB 27 LB00AI 8 LB 27 LB00AO 8 LB 27 LB00AO 8 LB 27 LC00A 8 LC 27 LC00A 8 LC 27 LC00AI 8 LC 27 LC00AO 8 LC 27 LC00AO 8 LD 27 LD00AI 8 LD 27 LD00AI 8 LD 27 LD00AO 8 LD 27 LD00AO 8 LD 27 LE00AI 8 LE 27 LE00AI 8 LE 27 LE00AO 8 LE 27 LE00AO 8 LE 27 LF00AO 8 LF 27 LG00AI 8 LG 27 LG00AI 8 LG 27 LG00AO 8 LG 27 LG00AO 8 LG 27 LJ00AI 8 LJ 27 LJ00AI 8 LI 27 LJ00AI 8 LI 27 LJ00AO 8 LJ 27 LJ00AO 8 LI 27 Route Mode Prefix Temp LJ00AO 8 LI 27 LK00AI 8 LK 27 LK00AI 8 LK 27 LK00AO 8 LK 27 LK00AO 8 LK 27 LK00O 8 LK 27 LL00AL 8 LL 27 LM00AL 8 LM 27 LT01L 8 LT 31 LT02L 8 LT 31 LT03L 8 LT 31 LT04L 8 LT 31 LT05L 8 LT 31 LT06L 8 LT 31 LT07I 8 LT 31 LT07I 8 LT 31 LT07O 8 LT 31 LT07O 8 LT 31 LT08I 8 LT 31 LT09O 8 LT 31 LT2DE 8 LT 31 LT2DE 8 LT 31 LT2DW 8 LT 31 LT2DW 8 LT 31 LTAC 8 LT 31 LTAC 8 LT 31 LTAFI 8 LT 31 LTAFI 8 LT 31 LTAFO 8 LT 31 LTAFO 8 LT 31 LTARS 8 LT 31 LTARS% 8 LT 31 LTAVI 8 LT 31 LTAVI 8 LT 31 LTAVO 8 LT 31 LTAVO 8 LT 31 LTBLU 8 LT 31 LTBLU 8 LT 31 LTBRM 8 LT 31 LTBRM 8 LT 31 LTGRN 8 LT 31 LTGRN 8 LT 31 LTPCE 8 LT 31 LTPCE 8 LT 31 LTPCW 8 LT 31 LTPUR 8 LT 31 LTPUR 8 LT 31 Page 8 of 12
132 Maryland Transit Administration Washington Area New Starts Model Phase II Documentation Transit Fares DRAFT Route Mode Prefix Temp LTPVCE 8 LT 31 LTPVCE 8 LT 31 LTPVCW 8 LT 31 LTPVCW 8 LT 31 LTSCI 8 LT 31 LTSCI 8 LT 31 LTSCO 8 LT 31 OLBRA 8 OL 32 OLBRA 8 OL 32 OLBRA% 8 OL 32 OLBRA1 8 OL 32 OLBRB 8 OL 32 OLBRB 8 OL 32 OLBRB% 8 OL 32 OLBRB1 8 OL 32 OLCC1 8 OL 32 OLCC1I 8 OL 32 OLCC1O 8 OL 32 OLCCE 8 OL 32 OLCCE 8 OL 32 OLCCW 8 OL 32 OLCCW 8 OL 32 OLDCI 8 OL 32 OLDCI 8 OL 32 OLDCO 8 OL 32 OLDCO 8 OL 32 OLDLEI 8 OL 32 OLDLEO 8 OL 32 OLDMFI 8 OL 32 OLDMFI 8 OL 32 OLDMFO 8 OL 32 OLDMFO 8 OL 32 OLMNI 8 OL 32 OLMNI 8 OL 32 OLMNO 8 OL 32 OLMNO 8 OL 32 OLMPKA 8 OL 32 OLMPKA 8 OL 32 OLMPKB 8 OL 32 OLMPKB 8 OL 32 OLRT1I 8 OL 32 OLRT1I 8 OL 32 OLRT1O 8 OL 32 OLRT1O 8 OL 32 OWDMFO 8 OW 32 STCCI 8 ST 30 STCCI 8 ST 30 Over a Century of Engineering Excellence Route Mode Prefix Temp STCCO 8 ST 30 STCCO 8 ST 30 STCHN 8 ST 30 STCHN 8 ST 30 STCHS 8 ST 30 STCHS 8 ST 30 STGML 8 ST 30 STGML 8 ST 30 STLPLT 8 ST 30 STLPLT 8 ST 30 STLTL 8 ST 30 STLTL 8 ST 30 STLTLP 8 ST 30 STLTLP 8 ST 30 STNRTL 8 ST 30 STNRTL 8 ST 30 STRT5N 8 ST 30 STRT5N 8 ST 30 STRT5S 8 ST 30 STRT5S 8 ST 30 STSRTL 8 ST 30 STSRTL 8 ST 30 UMD01 8 UMD 40 UMD01 8 UMD 40 UMD02 8 UMD 40 UMD02 8 UMD 40 UMD03 8 UMD 40 UMD03 8 UMD 40 UMD04 8 UMD 40 UMD04 8 UMD 40 UMD05 8 UMD 40 UMD05 8 UMD 40 UMD06 8 UMD 40 UMD07 8 UMD 40 UMD07 8 UMD 40 UMD08 8 UMD 40 UMD08 8 UMD 40 UMD09 8 UMD 40 UMD09 8 UMD 40 UMD10 8 UMD 40 UMD10 8 UMD 40 UMD11 8 UMD 40 UMD11 8 UMD 40 VBLKE 8 VG 29 VBLKI 8 VG 29 VBLKI 8 VG 29 VBLKO 8 VG 29 Route Mode Prefix Temp VBLKW 8 VG 29 VBLUA 8 VG 29 VBLUA 8 VG 29 VBLUB 8 VG 29 VBLUB 8 VG 29 VBRNO 8 VG 29 VGOLDN 8 VG 29 VGOLDS 8 VG 29 VGOLDS 8 VG 29 VGRAY 8 VG 29 VGRAYL 8 VG 29 VGRNA 8 VG 29 VGRNAL 8 VG 29 VGRNB 8 VG 29 VGRNBL 8 VG 29 VORGAO 8 VG 29 VPURN 8 VG 29 VPURS 8 VG 29 VREDAN 8 VG 29 VREDAN 8 VG 29 VREDAS 8 VG 29 VREDBL 8 VG 29 VWHTE 8 VG 29 VWHTE 8 VG 29 VWHTW 8 VG 29 VWHTW 8 VG 29 VYELL 8 VG 29 VYELL 8 VG 29 LC01I 9 LC 27 LC02I 9 LC 27 LC04I 9 LC 27 LCSD12 9 LCS 33 LCSD15 9 LCS 33 LCSD5E 9 LCS 33 LCSD6W 9 LCS 33 LCSD7E 9 LCS 33 LCSD9E 9 LCS 33 LCSDNI 9 LCS 33 LCSDTC 9 LCS 33 LCSGWI 9 LCS 33 LCSM1O 9 LCS 33 LCSWF1 9 LCS 33 LCSWF2 9 LCS 33 LINK1I 9 LINK 38 LINK1I 9 LINK 38 LINK1O 9 LINK 38 LINK1O 9 LINK 38 Page 9 of 12
133 Maryland Transit Administration Washington Area New Starts Model Phase II Documentation Transit Fares DRAFT Route Mode Prefix Temp MT01AI 9 MT 39 MT01AO 9 MT 39 MT01AO 9 MT 39 MT01BI 9 MT 39 MT01BO 9 MT 39 MT01CO 9 MT 39 MT02AI 9 MT 39 MT02AO 9 MT 39 MT02AO 9 MT 39 MT02BI 9 MT 39 MT02BO 9 MT 39 MT02CO 9 MT 39 MT03AI 9 MT 39 MT03AO 9 MT 39 MT04AI 9 MT 39 MT04AO 9 MT 39 MT04AO 9 MT 39 MT04BI 9 MT 39 MT05AI 9 MT 39 MT05AO 9 MT 39 MT05AO 9 MT 39 MT05BI 9 MT 39 MT05BO 9 MT 39 MT05CO 9 MT 39 MT07AI 9 MT 39 MT07BI 9 MT 39 MT09AI 9 MT 39 MT13AI 9 MT 39 MT15AI 9 MT 39 MT15BI 9 MT 39 MT15CI 9 MT 39 MT15CO 9 MT 39 MT15DO 9 MT 39 MT21AI 9 MT 39 MT21AI 9 MT 39 MT21AO 9 MT 39 MT21AO 9 MT 39 MT21BI 9 MT 39 MT22AI 9 MT 39 MT22BI 9 MT 39 MT29AI 9 MT 39 MT29BI 9 MT 39 MT29BI 9 MT 39 MT29BO 9 MT 39 MT29BO 9 MT 39 MT50AI 9 MT 39 MT50BI 9 MT 39 Over a Century of Engineering Excellence Route Mode Prefix Temp MT91AI 9 MT 39 MT91AO 9 MT 39 MT91AO 9 MT 39 MT91BI 9 MT 39 MT95AI 9 MT 39 MT95BI 9 MT 39 MT95CI 9 MT 39 MT95DI 9 MT 39 ORC1I 9 OR 34 ORD1I 9 OR 34 ORD1O 9 OR 34 ORD2I 9 OR 34 ORD3I 9 OR 34 ORD3O 9 OR 34 ORDC2I 9 OR 34 ORDMX1 9 OR 34 ORDN3I 9 OR 34 ORDS1I 9 OR 34 ORFC1O 9 OR 34 ORFC2I 9 OR 34 ORFC2O 9 OR 34 ORFC4I 9 OR 34 ORFCI 9 OR 34 ORFCML 9 OR 34 ORFSDI 9 OR 34 ORFSDO 9 OR 34 ORFSI 9 OR 34 ORFSL 9 OR 34 ORFSL 9 OR 34 ORFSO 9 OR 34 ORL1I 9 OR 34 ORL203 9 OR 34 ORL204 9 OR 34 ORL2I 9 OR 34 ORL4I 9 OR 34 ORLHI 9 OR 34 ORLMX1 9 OR 34 ORM3I 9 OR 34 ORM3RI 9 OR 34 ORM4RI 9 OR 34 ORMC1O 9 OR 34 ORMC1O 9 OR 34 ORMC4I 9 OR 34 ORMCI 9 OR 34 ORMFSI 9 OR 34 ORMI 9 OR 34 ORMVI 9 OR 34 Route Mode Prefix Temp ORMX1I 9 OR 34 ORMX2O 9 OR 34 ORMX2O 9 OR 34 ORMX3O 9 OR 34 ORMX3O 9 OR 34 ORMX4O 9 OR 34 ORMX5O 9 OR 34 ORMX6A 9 OR 34 ORMX6B 9 OR 34 ORNR2I 9 OR 34 ORRI 9 OR 34 ORRSI 9 OR 34 ORRT1I 9 OR 34 ORWFCI 9 OR 34 ORWFCI 9 OR 34 ORWFML 9 OR 34 PQ01I 9 PQ 35 PQ03I 9 PQ 35 PQ05I 9 PQ 35 PQ07I 9 PQ 35 PQ09I 9 PQ 35 PQ12I 9 PQ 35 PQ13I 9 PQ 35 PQ14I 9 PQ 35 PQ15I 9 PQ 35 PQ16I 9 PQ 35 PQ17I 9 PQ 35 SDC10I 9 SDC 36 SDC12I 9 SDC 36 SDC14I 9 SDC 36 SDC5I 9 SDC 36 SDC6I 9 SDC 36 SDC7I 9 SDC 36 SDC8I 9 SDC 36 SDC9I 9 SDC 36 Page 10 of 12
134 Attachment B: Boarding and Transfer Fares Maryland Transit Administration Washington Area New Starts Model Phase II Documentation Transit Fares DRAFT Over a Century of Engineering Excellence Page 11 of 12
135 FARE.DAT ;**************************************************************************** ; MDAA ; ; ; ;**************************************************************************** ; FILE NAME: FARE.DAT ; FILE DESCRIPTION: Transit Fares for 2005 Transit Network ; Actual Cash Fares in 2005 Dollars ; PURPOSE: Mode Choice Model for MDAA ; FILE HISTORY: * Created by FL, Baker, 9/2008 ; * Update 2/09 ; * [sra-pb] 01/21/09 --> Metro Rail Fare column is set to zeros ; * [sra-pb] 01/20/10 --> University Purpose Removed - mode 40 has been taken out ;***************************************************************************** ;2005 Fares ; DEFINE TRANSFER FARES -(CENTS) XFARE[1] = 0,210,0,370,429,135,135,135,135,0, 6*0, 0, 0, 0,210, 0, 0, 0, 0,110,150,200,150,100,100,050,100,700,550, 650, 625, 650, 900,275 XFARE[2] = 0,210,0,370,429,135,135,135,135,0, 6*0, 0, 0, 0,210, 0, 0, 0, 0,110,150,200,150,100,100,050,100,700,550, 650, 625, 650, 900,275 XFARE[3] = 35,210,0,370,429,135,135,135,135,0, 6*0, 35, 35, 35,210,35, 35, 35, 35,110,150,200,150,100,100,050,100,700,550, 650, 625, 650, 900,275 XFARE[4] =125,300,0,370,429,135,135,135,135,0, 6*0,125,100,100,300,075,100,75,125,110,150,200,150,100,100,050,100,700,550, 650, 625, 650, 900,275 XFARE[5] =125,300,0,370,429,135,135,135,135,0, 6*0,125,100,100,300,075,100,75,125,110,150,200,150,100,100,050,100,700,550, 650, 625, 650, 900,275 XFARE[6] =125,300,0,370,429, 0,135,135,135,0, 6*0,125,100,100,300,075,100,75,125,110,150,200,150,100,100,050,100,700,550, 650, 625, 650, 900,275 XFARE[7] =125,300,0,370,429,135, 0,135,135,0, 6*0,125,100,100,300,075,100,75,125,110,150,200,150,100,100,050,100,700,550, 650, 625, 650, 900,275 XFARE[8] =125,300,0,370,429,135,135, 0,135,0, 6*0,125,100,100,300,075,100,75,125,110,150,200,150,100,100,050,100,700,550, 650, 625, 650, 900,275 XFARE[9] =125,300,0,370,429,135,135,135, 0,0, 6*0,125,100,100,300,075,100,75,125,110,150,200,150,100,100,050,100,700,550, 650, 625, 650, 900,275 XFARE[10] =125,300,0,370,429,135,135,135,135,0, 6*0,125,100,100,300,075,100,75,125,110,150,200,150,100,100,050,100,700,550, 650, 625, 650, 900,275 ; XFARE[17] = 0,210,0,370,429,135,135,135,135,0, 6*0, 0, 0, 0,200, 0, 0, 0, 0,110,150,200,150,100,100,050,100,700,550, 650, 625, 650, 900,275 XFARE[18] = 0,210,0,370,429,135,135,135,135,0, 6*0, 0, 0, 0,200, 0, 0, 0, 0,110,150,200,150,100,100,050,100,700,550, 650, 625, 650, 900,275 XFARE[19] = 0,175,0,370,429,135,135,135,135,0, 6*0, 0, 0, 0,200, 0, 0, 0, 0,110,150,200,150,100,100,050,100,700,550, 650, 625, 650, 900,275 XFARE[20] = 0,175,0,370,429,135,135,135,135,0, 6*0, 0, 0, 0, 0, 0, 0, 0, 0,110,150,200,150,100,100,050,100,700,550, 650, 625, 650, 900,275 XFARE[21] = 0,210,0,370,429,135,135,135,135,0, 6*0, 0, 0, 0,200, 0, 0, 0, 0,110,150,200,150,100,100,050,100,700,550, 650, 625, 650, 900,275 XFARE[22] = 0,210,0,370,429,135,135,135,135,0, 6*0, 0, 0, 0,200, 0, 0, 0, 0,110,150,200,150,100,100,050,100,700,550, 650, 625, 650, 900,275 XFARE[23] = 0,210,0,370,429,135,135,135,135,0, 6*0, 0, 0, 0,200, 0, 0, 0, 0,110,150,200,150,100,100,050,100,700,550, 650, 625, 650, 900,275 XFARE[24] = 0,210,0,370,429,135,135,135,135,0, 6*0, 0, 0, 0,200, 0, 0, 0, 0,110,150,200,150,100,100,050,100,700,550, 650, 625, 650, 900,275 XFARE[25] =125,300,0,370,429,135,135,135,135,135,6*0, 35, 35,100,200, 75,100,75,125, 0,150,200,150,100,100,050,100,700,550, 650, 625, 650, 900,275 XFARE[26] =125,300,0,370,429,135,135,135,135,135,6*0, 35, 35,100,200, 75,100,75,125,110, 0,200,150,100,100,050,100,700,550, 650, 625, 650, 900,275 XFARE[27] =125,300,0,370,429,135,135,135,135,135,6*0,125,100,100,300,075,100,75,125,110,150, 0,150,100,100,050,100,700,550, 650, 625, 650, 900,275 XFARE[28] =125,300,0,370,429,135,135,135,135,135,6*0,125,100,100,300,075,100,75,125,110,150,200, 0,100,100,050,100,700,550, 650, 625, 650, 900,275 XFARE[29] =125,300,0,370,429,135,135,135,135,135,6*0,125,100,100,300,075,100,75,125,110,150,200,150, 0,100,050,100,700,550, 650, 625, 650, 900,275 XFARE[30] =125,300,0,370,429,135,135,135,135,135,6*0,125,100,100,300,075,100,75,125,110,150,200,150,100, 0,050,100,700,550, 650, 625, 650, 900,275 XFARE[31] =125,300,0,370,429,135,135,135,135,135,6*0,125,100,100,300,075,100,75,125,110,150,200,150,100,100, 0,100,700,550, 650, 625, 650, 900,275 XFARE[32] =125,300,0,370,429,135,135,135,135,135,6*0,125,100,100,300,075,100,75,125,110,150,200,150,100,100,050, 0,700,550, 650, 625, 650, 900,275 XFARE[33] =125,300,0,370,429,135,135,135,135,135,6*0,125,100,100,300,075,100,75,125,110,150,200,150,100,100,050,100, 0,550, 650, 625, 650, 900,275 XFARE[34] =125,300,0,370,429,135,135,135,135,135,6*0,125,100,100,300,075,100,75,125,110,150,200,150,100,100,050,100,700, 0, 650, 625, 650, 900,275 XFARE[35] =125,300,0,370,429,135,135,135,135,135,6*0,125,100,100,300,075,100,75,125,110,150,200,150,100,100,050,100,700,550, 0, 625, 650, 900,275 XFARE[36] =125,300,0,370,429,135,135,135,135,135,6*0,125,100,100,300,075,100,75,125,110,150,200,150,100,100,050,100,700,550, 650, 0, 650, 900,275 XFARE[37] =125,300,0,370,429,135,135,135,135,135,6*0,125,100,100,300,075,100,75,125,110,150,200,150,100,100,050,100,700,550, 650, 625, 0, 900,275 XFARE[38] =125,300,0,370,429,135,135,135,135,135,6*0,125,100,100,300,075,100,75,125,110,150,200,150,100,100,050,100,700,550, 650, 625, 650, 0,275 XFARE[39] =125,300,0,370,429,135,135,135,135,135,6*0,125,100,100,300,075,100,75,125,110,150,200,150,100,100,050,100,700,550, 650, 625, 650, 900,275 ; DEFINE BOARDING FARES -(CENTS) XFARE[11] =125,300,0,370,429,135,135,135,135,135,6*0,125,100,100,300,075,100,75,125,110,150,200,150,100,100,050,100,700,550, 650, 625, 650, 900,275 XFARE[12] =125,300,0,370,429,135,135,135,135,135,6*0,125,100,100,300,075,100,75,125,110,150,200,150,100,100,050,100,700,550, 650, 625, 650, 900,275 XFARE[13] =125,300,0,370,429,135,135,135,135,135,6*0,125,100,100,300,075,100,75,125,110,150,200,150,100,100,050,100,700,550, 650, 625, 650, 900,275 XFARE[14] =125,300,0,370,429,135,135,135,135,135,6*0,125,100,100,300,075,100,75,125,110,150,200,150,100,100,050,100,700,550, 650, 625, 650, 900,275 XFARE[15] =125,300,0,370,429,135,135,135,135,135,6*0,125,100,100,300,075,100,75,125,110,150,200,150,100,100,050,100,700,550, 650, 625, 650, 900,275 XFARE[16] =125,300,0,370,429,135,135,135,135,135,6*0,125,100,100,300,075,100,75,125,110,150,200,150,100,100,050,100,700,550, 650, 625, 650, 900,275 /* 1 WMATA 2 WMATA 3 WMATA 4 MTA 5 NVTC/PRTC 6 DDOT/WMATA 1
136 FARE.DAT 7 MTA LRT 8 MTA BRT 9 BRT VA Arlington 18 City of Alexandria 19 Fairfax County 20 Fairfax County 21 Fairfax City 22 Tyson's Circulator 23 MD Prince Georges 24 Montgomery 25 Frederick County 26 Howard County 27 City of Laurel 28 Calvert 29 Charles County 30 St. Mary's County 31 VA Loudound County 32 Prince William Co (PRTC) 33 Loudound County Commuter 34 Prince William Co (PRTC) Commuter 35 Quicks Commuter Bus 36 National Coach Cummer Bus 37 Lee Coaches Commuter Bus 38 Washington Flyer-Dulles/WFC 39 MD MTA */ ;Non-Transit Modes: ;11 Drive access ;12 Bus/rail walk connect ;13 Downtown walk link ;14 Unused ;15 PNR/rail walk connect ;16 Zonal walk access/egress link ; DEFINE BUS FARE ZONE LINKS -(CENTS) FARELINKS FARE=75 MODES=39 L= ;MTA 991 Mono MARC FARELINKS FARE=75 MODES=39 L= ;MTA 991 Mono MARC FARELINKS FARE=75 MODES=39 L= ;MTA 915 & ;FARELINKS FARE=75 MODES=39 L= ;MTA 929o FARELINKS FARE=75 MODES=39 L= ;MTA 915/929 Silver Spring FARELINKS FARE=150 MODES=39 L= ;MTA FARELINKS FARE=150 MODES=39 L= ;MTA ,950 FARELINKS FARE=75 MODES=39 L= ;MTA 921O FARELINKS FARE=75 MODES=39 L= ;MTA FARELINKS FARE=75 MODES=39 L= ;MTA FARELINKS FARE=75 MODES=39 L= ;MTA 902 FARELINKS FARE=75 MODES=39 L= ;MTA 904 FARELINKS FARE=75 MODES=39 L= ;MTA 904 FARELINKS FARE=75 MODES=39 L= ;MTA 903,905,909 FARELINKS FARE=75 MODES=39 L= ;MTA 903,909 FARELINKS FARE=75 MODES=39 L= ;MTA 905 FARELINKS FARE=75 MODES=39 L= ;MTA 909 FARELINKS FARE=75 MODES=39 L= ;MTA 909 FARELINKS FARE=150 MODES=39 L= ;MTA 901,907 2
137 Maryland Transit Administration Washington Area New Starts Model Phase II Documentation Transit Fares DRAFT Attachment C: Baker Engineering Memo Over a Century of Engineering Excellence Page 12 of 12
138 CORRIDOR CITIES TRANSITWAY Memo Project: MDAA Date: Nov 14, 2008 Subject: Bus Transit Fare Skim CC: Bill Thomas To: Elizabeth Harper From: Feng Liu This memo summarizes the bus fare structure proposed for implementation for the MDAA analysis in the Phase II model development and application. 1. Bus Fare Structure In this bus fare process, the original mode files (1 through 10) are retained. However, transit modes are re-numbered as shown in Table 1. Essentially, modes 1 through 3 remain intact, while the other transit modes are renumbered. Non-transit modes are still kept the same as the original MWCOG definition. Based on this transit mode definition, a bus fare matrix was established to reflect the fare structure in The published fare structures from various transit providers are the data sources for these fares. Regular fares were used for all modes, except for four private commuter service providers, namely, National Coach Commuter Bus, Lee Coaches Commuter Bus, Quicks Commuter Bus, and Washington Flyer-Dulles/WFC. These services charge a very high price for a single ticket, which, if used in the fare skims, would make those fares appear to be outliers compared with the rest of the fare systems in the region. Considering the nature of their commuter services, it seems to be reasonable to believe that regular users of these services will not likely pay for single ticket price, but rather monthly or bi-weekly prices, which appear to be reasonable compared with similar public service providers. A transfer fare matrix was also constructed, based on the inter-modal, intra-agency, and inter-agency transfer policies. Almost all bus fares are flat shares as shown in Table 1, except for MTA commuter bus services. MTA charges its commuter bus riders, based on a zonal system. Table 2 shows MTA s commuter bus services and their zone designation. All bus fares described above were coded in FARE.DAT, which should be placed in the input file directory and needs to be updated to reflect fare policies for different years and different scenarios.
139 CORRIDOR CITIES TRANSITWAY New Mode # Table 1. Mode Definition Old Mode # Transit System Service Type Service Name Prefix Fare* 1 1 WMATA Local Bus MetroBus WM WMATA Express MetroBus WM WMATA Metrorail Metrorail M 135* 4 4 MTA Commuter Rail MARC MB 370* 5 4 NVTC/PRTC Commuter Rail VRE FR MA 429* 6 5 DDOT/WMATA LRT Anacostia LRT Line MTA LRT LRT CCT/Purple Line MTA BRT BRT CCT/Purple Line BRT BRT VA BRT Arlington Local Bus ART City of Alexandria Local Bus VA-Dash Fairfax County Local Bus Fairfax Connector F Fairfax County Express Bus Fairfax Connector F Fairfax City Local Bus CUE Bus SG Tyson's Circulator Local Bus TYSL Prince Georges Local Bus The Bus GO Montgomery Local Bus Ride-On RO Frederick County Local Bus TranIT FT Howard County Local Bus Howard Transit HT City of Laurel Local Bus Connect-A-Ride L Calvert Local Bus Calvert County Route 4 Flyer CC Charles County Local Bus VanGO VG St. Mary's County Local Bus STS ST Loudoun County Local Bus Loudoun County Transit LT Prince William Co (PRTC) Local Bus OMNI LINK IL Loudoun County Commuter Bus Loudoun County Transit LCS Prince William Co (PRTC) Commuter Bus OMNI-RIDE ORC Quicks Commuter Bus Commuter Bus Quicks PQ 650 National Coach Commuter 36 9 Bus Commuter Bus National Coach SDC Lee Coaches Commuter Bus Commuter Bus Less Coaches LC 650 Washington Flyer Dulles/WFC Express Bus Washington Flyer LINK MTA Commuter Bus MTA Commuter MT 275* * Fares are in cents. All are flat fares except for WMATA Metrorail which is distance-based with a 2005 base fare of $1.35, MTA MARC which is zone-based with a base fare of $3.7, MTA Commuter, which is zone-based with a base fare of $2.75, and VRE which is zone-based with a base fare of $4.29. Definition of future transit services such as CCT and Purple Line is to be adopted and provided elsewhere.
140 CORRIDOR CITIES TRANSITWAY Table 2. MTA Commuter Bus Service RT# Origins and Destinations Zone 901 Washington to Waldorf and La Plata: Zone Washington to Dunkirk: Washington to Sunderland, Prince Frederick, and Fairgrounds: Washington to St. Leonard: 903 Suitland Metro Station to Waldorf and Charlotte Hall: Washington to Waldorf and Charlotte Hall: 904 Washington to Equestrian Center through Pindell: Washington to Owings and North Beach: 905 Washington to Waldorf and Charlotte Hall: Washington to California: Zone 2 Zone 3 Zone 4 Zone 2 Zone 3 Zone 2 Zone 3 Zone 3 Zone Washington to Waldorf and La Plata: Zone Washington to Charlotte Hall: Washington to California: Zone 3 Zone Waldorf to Suitland Metrorail Station: Zone Silver Spring to Burtonsville, Scaggsville, and Columbia: Washington to Burtonsville, Scaggsville, and Columbia: 921 Davidsonville to Prince George's County: Annapolis to Prince George's County: 922 Washington to Annapolis: Washington to Kent Island: 929 Silver Spring to Burtonsville, Scaggsville, and Columbia: Washington to Burtonsville, Scaggsville, and Columbia: 950 Washington to Annapolis: Washington to Kent Island: 991 Shady Grove to Rock Spring: Monocacy and Urbana to Shady Grove: Monocacy and Urbana to Rock Spring: Zone 2 Zone 3 Zone 1 Zone 2 Zone 3 Zone 4 Zone 2 Zone 3 Zone 3 Zone 4 Zone 2 Zone 2 Zone Washington to Columbia, Ellicott City, and Clarksville: Zone 3

141 CORRIDOR CITIES TRANSITWAY 2. All Bus Fare Skim The bus fares between one TAZ and another are skimmed in the transit skim process. Transit_Skims_AB.s script file was modified to generate zone-to-zone bus fares, which were calculated as the sum of the boarding fare, any applicable mode-mode transfer fare, and zonal fare surcharges for MTA commuter routes. The script generates TAZ-to-TAZ fare tables as a component of the transit skim matrices, which include six skim matrices (by time of day and access mode). Representative TAZ pairs were selected and traced to examine the reasonableness of their fare values.
Bi-County Transitway/ Bethesda Station Access Demand Analysis
 Bi-County Transitway/ Bethesda Station Access Demand Analysis Prepared for: Washington Metropolitan Area Transit Authority Office of Planning and Project Development May 2005 Prepared by: in conjunction
RESU ULTS. nt & Delivery
 TRAVEL FORECASTSS RESU ULTS TECHNICAL REPORT August 2013 Transit Developmen nt & Delivery 100 South Charles Street Tower Two, Suite 700 Baltimore, Maryland 21201 August 2013 TABLE OF CONTENTS 1. Introduction...
Maryland Gets to Work
 I-695/Leeds Avenue Interchange Reconstruction Baltimore County Reconstruction of the I-695/Leeds Avenue interchange including replacing the I-695 Inner Loop bridges over Benson Avenue, Amtrak s Northeast
5. OPPORTUNITIES AND NEXT STEPS
 5. OPPORTUNITIES AND NEXT STEPS When the METRO Green Line LRT begins operating in mid-2014, a strong emphasis will be placed on providing frequent connecting bus service with Green Line trains. Bus hours
Prince George s County & Montgomery County Delegates Briefing. July 31, 2008
 Prince George s County & Montgomery County Delegates Briefing July 31, 2008 Agenda Project Overview Alternatives Project Updates Travel Markets Ridership Travel Times Cost Effectiveness Public Outreach
EUGENE-SPRINGFIELD, OREGON EAST WEST PILOT BRT LANE TRANSIT DISTRICT
 EUGENE-SPRINGFIELD, OREGON EAST WEST PILOT BRT LANE TRANSIT DISTRICT (BRIEF) Table of Contents EUGENE-SPRINGFIELD, OREGON (USA)... 1 COUNTY CONTEXT AND SYSTEM DESCRIPTION... 1 SYSTEM OVERVIEW... 1 PLANNING
FINAL. Sound Transit Long-Range Plan Update. Issue Paper S.1: Tacoma Link Integration with Central Link. Prepared for: Sound Transit
 Sound Transit Long-Range Plan Update Issue Paper S.1: Tacoma Link Integration with Central Link Prepared for: Sound Transit Prepared by: Quade & Douglas, Inc. FINAL March 2005 Foreword This issue paper
Click to edit Master title style
 Nelson/Nygaard Consulting Associates SERVICE IMPROVEMENT STRATEGIES September 22, 2015 1 PROJECT OVERVIEW & WORK TO DATE 1. Extensive stakeholder involvement Throughout 2. System and market assessment
Table 8-1: Service Frequencies for All Short-List Alternatives by Day of Week and Time of Day Frequency Day of Week Time of Day Time Period
 8. Operating Plans The following Section presents the operating plans for the Short-List Alternatives. The modern streetcar operating plans are presented for Alternatives 2 and 3, followed by bus rapid
Transit Access to the National Harbor
 Transit Access to the National Harbor December 2014 Table of Contents Executive Summary... 3 Introduction and Project Purpose... 6 Methodology.. 9 Definition of Alternatives..... 9 Similar Project Implementation
Operating & Maintenance Cost Results Report
 Operating & Maintenance Cost Results Report Prepared for: Hennepin County Regional Railroad Authority Prepared by: Connetics Transportation Group Under Contract To: Kimley-Horn and Associates FINAL June
Executive Summary. Draft Environmental Impact Statement/Environmental Impact Report ES-1
 Executive Summary Introduction The Eastside Transit Corridor Phase 2 Project is a vital public transit infrastructure investment that would provide a transit connection to the existing Metro Gold Line
Executive Summary. Treasure Valley High Capacity Transit Study Priority Corridor Phase 1 Alternatives Analysis October 13, 2009.
 Treasure Valley High Capacity Transit Study Priority Corridor Phase 1 Alternatives Analysis October 13, 2009 Background As the Treasure Valley continues to grow, high-quality transportation connections
Madison BRT Transit Corridor Study Proposed BRT Operations Plans
 Madison BRT Transit Corridor Study Proposed BRT Operations Plans This paper presents a description of the proposed BRT operations plan for use in the Madison BRT Transit Corridor Study. The objective is
US 29 Bus Rapid Transit Planning Board Briefing. February 16, 2017
 US 29 Bus Rapid Transit Planning Board Briefing February 16, 2017 Project Goals Improve the quality of transit service Improve mobility opportunities and choices Enhance quality of life Support master
CEDAR AVENUE TRANSITWAY Implementation Plan Update
 CEDAR AVENUE TRANSITWAY Implementation Plan Update EECUTIVE SUMMARY DECEMBER 2015 Executive Summary In 2013, the Twin Cities metropolitan area s first bus rapid transit (BRT) line, the METRO Red Line,
TORONTO TRANSIT COMMISSION REPORT NO.
 Form Revised: February 2005 TORONTO TRANSIT COMMISSION REPORT NO. MEETING DATE: October 24, 2012 SUBJECT: DOWNTOWN RAPID TRANSIT EXPANSION STUDY (DRTES) PHASE 1 STRATEGIC PLAN ACTION ITEM RECOMMENDATIONS
Chapter 4 : THEME 2. Transportation
 Chapter 4 : THEME 2 Strengthen connections to keep the Central Area easy to reach and get around 55 Figure 4.2.1 Promote region-wide transit investments. Metra commuter rail provides service to the east,
Project Status Update January 2017
 Project Status Update January 2017 1 What is the Purple Line? A new 16 mile east-west light rail line Operates mostly on the surface with 21 stations Connects New Carrollton in Prince George s County and
BROWARD BOULEVARD CORRIDOR TRANSIT STUDY
 BROWARD BOULEVARD CORRIDOR TRANSIT STUDY FM # 42802411201 EXECUTIVE SUMMARY July 2012 GOBROWARD Broward Boulevard Corridor Transit Study FM # 42802411201 Executive Summary Prepared For: Ms. Khalilah Ffrench,
Preliminary Definition of Alternatives. 3.0 Preliminary Definition of Alternatives
 3.0 What preliminary alternatives are being evaluated? The alternatives for the East San Fernando Valley Transit Corridor project that were considered for screening include the No Build Alternative, Transportation
Public Meeting. City of Chicago Department of Transportation & Department of Housing and Economic Development
 Public Meeting City of Chicago Department of Transportation & Department of Housing and Economic Development Funded by Regional Transportation Authority September 12, 2011 In partnership with Presentation
Montgomery County Transit Projects
 Montgomery County Transit Projects Discussion with Maryland Transit Administration Mode, alignment, and design options Project implementation Master planning coordination Funding opportunities M-NCPPC
ANDERSON PROPERTY SITE ANALYSIS
 ANDERSON PROPERTY SITE ANALYSIS Introduction The Montgomery County Department of Transportation (MCDOT) initiated a feasibility study in the fall of 2012 to evaluate the need for transit service expansion
Needs and Community Characteristics
 Needs and Community Characteristics Anticipate Population and Job Growth in the City Strongest density of population and jobs in Ann Arbor are within the Study Area Population expected to grow 8.4% by
Alternatives Analysis Findings Report
 6.0 This chapter presents estimates of the potential capital, operations and maintenance costs associated with the alternatives carried forward for detailed evaluation. The methodology used to develop
Travel Forecasting Methodology
 Travel Forecasting Methodology Introduction This technical memorandum documents the travel demand forecasting methodology used for the SH7 BRT Study. This memorandum includes discussion of the following:
Regional Inventory of Projects Planned High Capacity Surface Transit Improvements in the WMATA Service Area. DRAFT Project Summaries
 Regional Inventory of Projects Planned High Capacity Surface Transit Improvements in the WMATA Service Area DRAFT Project Summaries May 2009 TABLE OF CONTENTS 1.0 INTRODUCTION... 1 2.0 PROJECTS... 3 2.1
Background Information about the Metrobus 29 Lines Study
 Background Information about the Metrobus 29 Lines Study Questions Overview of Existing Service Q. Why is the study being conducted? A. The 29 Lines provide an important connection between Annandale and
Chapter 9 Recommended Locally Preferred Alternative and Alternatives for Evaluation in Draft SEIS/SEIR
 Chapter 9 Recommended Locally Preferred Alternative and Alternatives for Evaluation in Draft SEIS/SEIR 9.0 RECOMMENDED LOCALLY PREFERRED ALTERNATIVE AND ALTERNATIVES FOR EVALUATION IN DRAFT SEIS/SEIR
RTSP Phase II Update
 Washington Metropolitan Area Transit Authority RTSP Phase II Update Presentation to the Technical Advisory Group July 18, 2013 Meeting 1 Presentation Outline RTSP Integration with Momentum RTSP Process
CITY OF LONDON STRATEGIC MULTI-YEAR BUDGET ADDITIONAL INVESTMENTS BUSINESS CASE # 6
 2016 2019 CITY OF LONDON STRATEGIC MULTI-YEAR BUDGET ADDITIONAL INVESTMENTS BUSINESS CASE # 6 STRATEGIC AREA OF FOCUS: SUB-PRIORITY: STRATEGY: INITIATIVE: INITIATIVE LEAD(S): BUILDING A SUSTAINABLE CITY
County Engineers of Maryland. William Parks Michael D. Madden Maryland Transit Administration
 County Engineers of Maryland William Parks Michael D. Madden Maryland Transit Administration May 25, 2017 1 Project Description 16 mile east-west light rail line between Bethesda in Montgomery County and
Energy Technical Memorandum
 Southeast Extension Project Lincoln Station to RidgeGate Parkway Prepared for: Federal Transit Administration Prepared by: Denver Regional Transportation District May 2014 Table of Contents Page No. Chapter
King County Metro. Columbia Street Transit Priority Improvements Alternative Analysis. Downtown Southend Transit Study. May 2014.
 King County Metro Columbia Street Transit Priority Improvements Alternative Analysis Downtown Southend Transit Study May 2014 Parametrix Table of Contents Introduction... 1 Methodology... 1 Study Area...
MILLERSVILLE PARK TRAFFIC IMPACT ANALYSIS ANNE ARUNDEL COUNTY, MARYLAND
 MILLERSVILLE PARK TRAFFIC IMPACT ANALYSIS ANNE ARUNDEL COUNTY, MARYLAND Prepared for: Department of Public Works Anne Arundel County Prepared by: URS Corporation 4 North Park Drive, Suite 3 Hunt Valley,
METRO Orange Line BRT American Boulevard Station Options
 METRO Orange Line BRT American Boulevard Station Options Bloomington City Council Work Session November 18, 2013 Christina Morrison BRT/Small Starts Project Office Coordinating Planning and Design AMERICAN
Waco Rapid Transit Corridor (RTC) Feasibility Study
 Feasibility Study") Waco Rapid Transit Corridor (RTC) Feasibility Study Chris Evilia, Director of Waco Metropolitan Planning Organization Allen Hunter, General Manager Waco Transit System Jimi Mitchell, Project Manager AECOM
Waco Rapid Transit Corridor (RTC) Feasibility Study Chris Evilia, Director of Waco Metropolitan Planning Organization Allen Hunter, General Manager Waco Transit System Jimi Mitchell, Project Manager AECOM
EXECUTIVE SUMMARY. The following is an outline of the traffic analysis performed by Hales Engineering for the traffic conditions of this project.
 EXECUTIVE SUMMARY This study addresses the traffic impacts associated with the proposed Shopko redevelopment located in Sugarhouse, Utah. The Shopko redevelopment project is located between 1300 East and
CTfastrak Expansion. Stakeholder Meeting #4 Manchester Town Hall June 3, 2016
 CTfastrak Expansion Stakeholder Meeting #4 Manchester Town Hall June 3, 2016 Today s Agenda Phase I Update 2016 Service Plan Implementation Schedule & Cost Update Phase II Services Timeline Market Analysis
4.0 TIER 2 ALTERNATIVES
 4.0 TIER 2 ALTERNATIVES The Tier 2 Alternatives represent the highest performing Tier 1 Alternatives. The purpose of the Tier 2 Screening was to identify the LPA utilizing a more robust list of evaluation
Central Maryland Transit Development Plan
 Central Maryland Transit Development Plan Planning the Future of Transit in Our Region Anne Arundel County Transportation Commission December 13, 2017 Anne Arundel County Howard County Prince George s
Travel Time Savings Memorandum
 04-05-2018 TABLE OF CONTENTS 1 Background 3 Methodology 3 Inputs and Calculation 3 Assumptions 4 Light Rail Transit (LRT) Travel Times 5 Auto Travel Times 5 Bus Travel Times 6 Findings 7 Generalized Cost
Chapter 7: Travel Demand Analysis. Chapter 8. Plan Scenarios. LaSalle Community Center. Image Credit: Town of LaSalle
 Chapter 7: Travel Demand Analysis Chapter 8 Plan Scenarios LaSalle Community Center. Image Credit: Town of LaSalle 164 Chapter 8: Plan Scenarios Moving Ahead for Progress in the 21 st Century Act (MAP
1 On Time Performance
 MEMORANDUM: US 29 Travel Time & OTP To: From: Joana Conklin, Montgomery County DOT James A. Bunch, SWAI Subject: US 29 Travel Time and On Time Performance Analysis Date: This memorandum documents the US
7359 WISCONSIN AVENUE MONTGOMERY COUNTY, MARYLAND
 7359 WISCONSIN MONTGOMERY COUNTY, MARYLAND September 1, 2017 7359 Wisconsin Avenue September 2017 7359 WISCONSIN Local Area Transportation Review Montgomery County, Maryland September 1, 2017 Prepared
CLRP. Performance Analysis of The Draft 2014 CLRP. Long-Range Transportation Plan For the National Capital Region
 NATIONAL CAPITAL REGION TRANSPORTATION PLANNING BOARD Item 12 CLRP Financially Constrained Long-Range Transportation Plan For the National Capital Region 2014 Performance Analysis of The Draft 2014 CLRP
TBARTA USF to Wesley Chapel Express Bus Service Operating Plan. Draft 3/25/2014
 TBARTA USF to Wesley Chapel Express Bus Service Operating Plan Draft 3/25/2014 March 2014 Table of Contents 1.0 Introduction... 1 2.0 Study Area... 1 3.0 Existing Available Service... 3 4.0 Proposed Service...
A Transit Plan for the Future. Draft Network Plan
 A Transit Plan for the Future Draft Network Plan Project Overview and Status Completed Market Analysis and Service Evaluation. Developed Plan Framework and Guiding Principles. Developed a draft Five Year
Troost Corridor Transit Study
 Troost Corridor Transit Study May 23, 2007 Kansas City Area Transportation Authority Agenda Welcome Troost Corridor Planning Study Public participation What is MAX? Survey of Troost Riders Proposed Transit
V03. APTA Multimodal Operations Planning Workshop August Green Line LRT
 V03 APTA Multimodal Operations Planning Workshop August 2016 Green Line LRT 2 Presentation Outline Past Present Future 3 16/03/2016 RouteAhead Update 4 4 16/03/2016 RouteAhead Update 5 5 16/03/2016 6 6
DETAILED DEFINITION OF ALTERNATIVES. July 2014 FINAL
 DETAILED DEFINITION OF ALTERNATIVES July 2014 Table of Contents 1.0 Introduction... 1 1.1 Detailed Mode Alternatives... 1 1.2 Detailed Alignment Alternatives... 1 1.3 Key Physical and Service Elements...
Clifton Corridor Transit Initiative. Briefing to Medlock Area Neighborhood Association (MANA) February 15, 2016
 February 15, 2016") Clifton Corridor Transit Initiative Briefing to Medlock Area Neighborhood Association (MANA) February 15, 2016 Neighborhood Concerns and Requests Provide a general overview and background of the project
Clifton Corridor Transit Initiative Briefing to Medlock Area Neighborhood Association (MANA) February 15, 2016 Neighborhood Concerns and Requests Provide a general overview and background of the project
SERVICE DESIGN GUIDELINES
 VTA TRANSIT SUSTAINABILITY POLICY: APPENDIX A SERVICE DESIGN GUIDELINES Adopted February 2007 COMMUNITYBUS LOCALBUS EXPRESSBUS BUSRAPIDTRANSIT LIGHTRAILTRANSIT STATIONAREAS S A N T A C L A R A Valley Transportation
NICTI Alternatives Analysis
 EXECUTIVE SUMMARY Development of Detailed Alternatives Report Prepared for: Northern Illinois Commuter Transportation Initiative City of Rockford, Illinois Prepared by: 222 South Riverside Plaza, Suite
2 EXISTING ROUTE STRUCTURE AND SERVICE LEVELS
 2 EXISTING ROUTE STRUCTURE AND SERVICE LEVELS In the Study Area, as in most of the Metro Transit network, there are two distinct route structures. The base service structure operates all day and the peak
Kendall Drive Premium Transit PD&E Study Project Kick-Off Meeting SR 94/Kendall Drive/SW 88 Street Project Development and Environment (PD&E) Study
 Study") Florida Department of Transportation District Six Kendall Drive Premium Transit PD&E Study Project Kick-Off Meeting SR 94/Kendall Drive/SW 88 Street Project Development and Environment (PD&E) Study What
Florida Department of Transportation District Six Kendall Drive Premium Transit PD&E Study Project Kick-Off Meeting SR 94/Kendall Drive/SW 88 Street Project Development and Environment (PD&E) Study What
APPENDIX I: [FIXED-GUIDEWAY TRANSIT FEASIBILITY]
![APPENDIX I: [FIXED-GUIDEWAY TRANSIT FEASIBILITY]](/thumbs/83/87090921.jpg "APPENDIX I: [FIXED-GUIDEWAY TRANSIT FEASIBILITY]") APPENDIX I: [FIXED-GUIDEWAY TRANSIT FEASIBILITY] Jackson/Teton Integrated Transportation Plan 2015 Appendix I. Fixed-Guideway Transit Feasibility Jackson/Teton County Integrated Transportation Plan v2
APPENDIX I: [FIXED-GUIDEWAY TRANSIT FEASIBILITY] Jackson/Teton Integrated Transportation Plan 2015 Appendix I. Fixed-Guideway Transit Feasibility Jackson/Teton County Integrated Transportation Plan v2
The Preferred Alternative: a Vision for Growth on the Northeast Corridor
 A Long-Term Vision is Needed The Preferred Alternative: a Vision for Growth on the Northeast Corridor The Federal Railroad Administration (FRA) has released the Tier 1 Final Environmental Impact Statement
What is the Connector?
 What is the Connector? The Connector is a plan for a high-capacity transit system from northeast to south Ann Arbor, connecting major destinations including downtown, commercial, and residential areas,
4 COSTS AND OPERATIONS
 4 COSTS AND OPERATIONS 4.1 INTRODUCTION This chapter summarizes the estimated capital and operations and maintenance (O&M) costs for the Modal and High-Speed Train (HST) Alternatives evaluated in this
The Boston South Station HSIPR Expansion Project Cost-Benefit Analysis. High Speed Intercity Passenger Rail Technical Appendix
 The Boston South Station HSIPR Expansion Project Cost-Benefit Analysis High Speed Intercity Passenger Rail Technical Appendix Prepared by HDR August 5, 2010 The Boston South Station HSIPR Expansion Project
BERKELEY DOWNTOWN AREA PLAN PROGRAM ENVIRONMENTAL IMPACT REPORT TRAFFIC IMPACT ANALYSIS
 BERKELEY DOWNTOWN AREA PLAN PROGRAM ENVIRONMENTAL IMPACT REPORT TRAFFIC IMPACT ANALYSIS Prepared for: City of Berkeley Prepared by: REVISED JANUARY 9, 2009 Berkeley Downtown Area Plan Program EIR Traffic
Parks and Transportation System Development Charge Methodology
 City of Sandy Parks and Transportation System Development Charge Methodology March, 2016 Background In order to implement a City Council goal the City of Sandy engaged FCS Group in January of 2015 to update
Service Quality: Higher Ridership: Very Affordable: Image:
 Over the past decade, much attention has been placed on the development of Bus Rapid Transit (BRT) systems. These systems provide rail-like service, but with buses, and are typically less expensive to
Bus Rapid Transit. Jennifer Flynn and Cheryl Thole Senior Research Associates Commuter Choice Workshop January 2012 Tampa, FL
 Bus Rapid Transit Jennifer Flynn and Cheryl Thole Senior Research Associates Commuter Choice Workshop January 2012 Tampa, FL What is Bus Rapid Transit? BRT is an enhanced bus system that operates on bus
Letter EL652 City of Mercer Island. Page 1. No comments n/a
 Letter EL652 City of Mercer Island Page 1 No comments n/a Page 2 Response to comment EL652 1 Section 4.5.3 of the Final EIS presents the range of potential impacts of the project. This project also lists
What IS BRT, Really? Not BRT and RNY
 What IS BRT, Really? 2007 Winter TexITE Meeting Presented by Jeff Arndt, TTI Not BRT and RNY 1 What is Bus Rapid Transit? A flexible, rubber-tired from of rapid transit that combines stations, vehicles,
Transit Access Study
 West of Hudson Regional Transit Access Study Open House presentation July 20, 2010 1 Agenda Progress To date Summary of Level 2 Alternatives and Screening Service Plans Bus and Rail Operating and Capital
West Broadway Transit Study. Community Advisory Committee September 17, 2015
 West Broadway Transit Study Community Advisory Committee September 17, 2015 Introductions Community Engagement Summer Outreach Fall Outreach Technical Analysis Process Update Alternatives Review Economic
TRANSIT IDEA STRATEGIC INITIATIVE On BUS RAPID TRANSIT (BRT)
") TRANSIT IDEA STRATEGIC INITIATIVE On BUS RAPID TRANSIT (BRT) The panel for the Transit IDEA program has endorsed a Bus Rapid Transit (BRT) strategic initiative and focus area as part of the Transit IDEA
TRANSIT IDEA STRATEGIC INITIATIVE On BUS RAPID TRANSIT (BRT) The panel for the Transit IDEA program has endorsed a Bus Rapid Transit (BRT) strategic initiative and focus area as part of the Transit IDEA
APPENDIX B Traffic Analysis
 APPENDIX B Traffic Analysis Rim of the World Unified School District Reconfiguration Prepared for: Rim of the World School District 27315 North Bay Road, Blue Jay, CA 92317 Prepared by: 400 Oceangate,
TRAVEL DEMAND FORECASTS
 Jiangxi Ji an Sustainable Urban Transport Project (RRP PRC 45022) TRAVEL DEMAND FORECASTS A. Introduction 1. The purpose of the travel demand forecasts is to assess the impact of the project components
1.0 Detailed Definition of Alternatives
 1.0 Detailed Definition of Alternatives 1.1 Introduction This chapter provides supplemental information on the four alternatives, including both physical and operational characteristics (e.g. service plans)
Service and Operations Planning for Ottawa s New Light Rail Line Pat Scrimgeour
 Service and Operations Planning for Ottawa s New Light Rail Line Pat Scrimgeour Manager, Transit Service Planning and Reporting OC Transpo Ottawa, Ontario Ottawa Light Rail Project 12.5 km, 13 stations
STRATEGIC PRIORITIES AND POLICY COMMITTEE MAY 5, 2016
 STRATEGIC PRIORITIES AND POLICY COMMITTEE MAY 5, 2016 Shift Rapid Transit Initiative Largest infrastructure project in the city s history. Rapid Transit initiative will transform London s public transit
Appendix B. Tier 2 Final Environmental Assessment I-66 Transit/TDM Technical Report
 Tier 2 Final Environmental Assessment I-66 Transit/TDM Technical Report Appendix B Bus Bay, Maintenance, and Storage Capacity Analysis Technical Memorandum FINAL MAY 2016 INTRODUCTION This technical memorandum
Valley Metro Overview. ITE/IMSA Spring Conference March 6, 2014
 Valley Metro Overview ITE/IMSA Spring Conference March 6, 2014 Valley Metro Who Are We? Operate Regional Transit Services Valley Metro and Phoenix are region s primary service providers Light Rail and
Subarea Study. Manning Avenue (CSAH 15) Corridor Management and Safety Improvement Project. Final Version 1. Washington County.
 Corridor Management and Safety Improvement Project. Final Version 1. Washington County.") Subarea Study Manning Avenue (CSAH 15) Corridor Management and Safety Improvement Project Final Version 1 Washington County June 12, 214 SRF No. 138141 Table of Contents Introduction... 1 Forecast Methodology
Subarea Study Manning Avenue (CSAH 15) Corridor Management and Safety Improvement Project Final Version 1 Washington County June 12, 214 SRF No. 138141 Table of Contents Introduction... 1 Forecast Methodology
The Engineering Department recommends Council receive this report for information.
 CORPORATE REPORT NO: R161 COUNCIL DATE: July 23, 2018 REGULAR COUNCIL TO: Mayor & Council DATE: July 19, 2018 FROM: General Manager, Engineering FILE: 8740-01 SUBJECT: Surrey Long-Range Rapid Transit Vision
Midtown Corridor Alternatives Analysis Initial Screening Analysis
 Midtown Corridor Alternatives Analysis Initial Screening Analysis 7/24/2013 Prepared by the SRF Consulting Group Team for Table of Contents Purpose... 1 Initial Screening Analysis Methodology... 1 Screening...
Appendix B: Travel Demand Forecasts July 2017
 Appendix B: Travel Demand Forecasts July 2017 Table of Contents 1 Introduction... 2 2 Model Review and Updates... 2 2.1 Overview of Smart Moves Model ( City of London Model )... 2 2.1.1 Network and Zone
DEVELOPMENT OF RIDERSHIP FORECASTS FOR THE SAN BERNARDINO INFRASTRUCTURE IMPROVEMENT STUDY
 APPENDIX 1 DEVELOPMENT OF RIDERSHIP FORECASTS FOR THE SAN BERNARDINO INFRASTRUCTURE IMPROVEMENT STUDY INTRODUCTION: This Appendix presents a general description of the analysis method used in forecasting
Pacific Electric Right-of-Way / West Santa Ana Branch Corridor Alternatives Analysis
 Pacific Electric Right-of-Way / West Santa Ana Branch Corridor Alternatives Analysis Transit Coalition September 26, 2012 2 Study Area Pacific Electric Rightof-Way/West Santa Ana Branch (PEROW/ WSAB) extends
Note: The October 2007 version of this report has been updated in this December 2008 report to present costs in year 2007 dollars.
 Sound Transit Phase 2 South Corridor LRT Design Report: SR 99 and I-5 Alignment Scenarios (S 200 th Street to Tacoma Dome Station) Tacoma Link Extension to West Tacoma Prepared for: Sound Transit Prepared
I-26 Fixed Guideway Alternatives Analysis
 I-26 Fixed Guideway Alternatives Analysis Public Meetings: North Charleston, January 25, 2016 Charleston: January 26, 2016 Summerville: January 28, 2016 Agenda I. Project Update II. III. IV. Screen Two
Pedestrians, Cars, Buses and Trains? Considerations for Rapid Transit Service at Western University
 Pedestrians, Cars, Buses and Trains? Considerations for Rapid Transit Service at Western University Shift: The City of London s Rapid Transit Proposal Shift: The City of London s Rapid Transit Proposal
9. Downtown Transit Plan
 CORRADINO 9. Downtown Transit Plan KAT Transit Development Plan As part of the planning process for the TDP, an examination of downtown transit operations was conducted. The Downtown Transit Plan 1 is
Purple Line Functional Master Plan Advisory Group (MPAG)
") Purple Line Functional Master Plan Advisory Group (MPAG) Tonight s Agenda Schedule Update MTA Additional Studies Comments On Functional Plan Format County Zoning Code Re-Write Takoma Langley Crossroads
Purple Line Functional Master Plan Advisory Group (MPAG) Tonight s Agenda Schedule Update MTA Additional Studies Comments On Functional Plan Format County Zoning Code Re-Write Takoma Langley Crossroads
Downtown Lee s Summit Parking Study
 Downtown Lee s Summit Parking Study As part of the Downtown Lee s Summit Master Plan, a downtown parking and traffic study was completed by TranSystems Corporation in November 2003. The parking analysis
Help shape your community investment in Wake Transit. Fiscal Year 2019 Draft Work Plan Summary
 Help shape your community investment in Wake Transit Fiscal Year 2019 Draft Work Plan Summary Wake County, growth and transit The Triangle is one of the fastest-growing regions in the nation. Wake County
Location Concept Plan Amendment Recommendation Approved 2011 Concept Plan
 Valley Line West LRT Concept Plan Recommended Amendments Lewis Farms LRT Terminus Site Location Concept Plan Amendment Recommendation Approved 2011 Concept Plan Lewis Farms LRT terminus site, 87 Avenue/West
East San Fernando Valley Transit Corridor. TAC Briefing December 4, 2013
 East San Fernando Valley Transit Corridor TAC Briefing December 4, 2013 Overview Measure R Project Long Range Transportation Plan Reserves $170.1 Million 2018 Revenue Operations Date Coordination with
State Avenue Corridor Bus Rapid Transit (BRT)
") State Avenue Corridor Bus Rapid Transit (BRT) Moving Forward Incrementally April 2010 State Ave. BRT Update Bus Rapid Transit Overview State Ave. Alternatives Analysis Results What s Coming Up Right Away!
State Avenue Corridor Bus Rapid Transit (BRT) Moving Forward Incrementally April 2010 State Ave. BRT Update Bus Rapid Transit Overview State Ave. Alternatives Analysis Results What s Coming Up Right Away!
ConnectGreaterWashington: Can the Region Grow Differently?
 Washington Metropolitan Area Transit Authority ConnectGreaterWashington: Can the Region Grow Differently? Transportation Planning Board (TPB) Travel Forecasting Subcommittee July 17, 2015 1 Alternatives
TRANSPORTATION EFFECTS
 6 TRANSPORTATION EFFECTS This chapter describes the long-term and construction effects of the No Build Alternative, the Wiehle Avenue, and the full LPA on the local and regional transportation network.
Metrorail Line Load Application
 Metrorail Line Load Application Presented to Travel Demand Forecasting Subcommittee Wendy Jia & Tom Harrington, WMATA Bassel Younan & Jeff Bruggeman, AECOM November 20, 2009 Metrorail Line Load Application
DRAFT METROCENTER CORRIDOR STUDY
 DRAFT METROCENTER CORRIDOR STUDY TIER 2 EVALUATION OF ALTERNATIVES JUNE 20, 2005 TABLE OF CONTENTS SECTION PAGE 1.0 INTRODUCTION... 1 1.1 Overview... 1 1.2 Project Description... 1 2.0 EVALUATION PROCESS...
Alpine Highway to North County Boulevard Connector Study
 Alpine Highway to North County Boulevard Connector Study prepared by Avenue Consultants March 16, 2017 North County Boulevard Connector Study March 16, 2017 Table of Contents 1 Summary of Findings... 1
6/6/2018. June 7, Item #1 CITIZENS PARTICIPATION
 June 7, 2018 Item #1 CITIZENS PARTICIPATION 1 Item #2 APPROVAL OF MINUTES Item #3 TRAC GOALS, FRAMEWORK & AGENDA REVIEW 2 COMMITTEE GOALS Learn about Southern Nevada s mobility challenges, new developments