Daily Pipeline Status As of 23:
|
|
|
- Ronald Webb
- 5 years ago
- Views:
Transcription
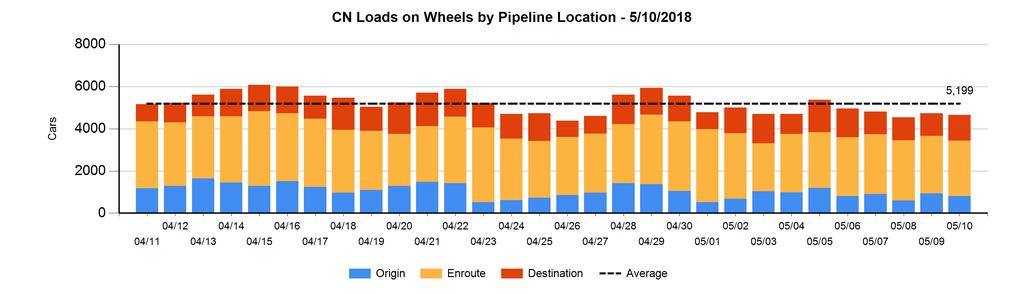
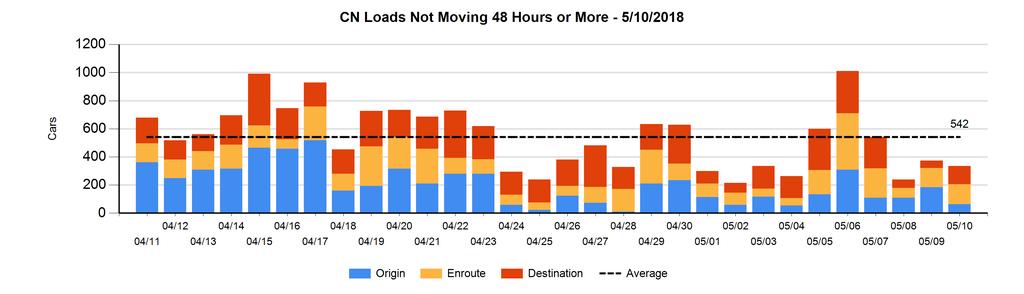
1 SPEED READ Loads on wheels increased slightly in the last 24 hours reflecting nominal changes on each railway with CN slightly lower and CP slightly higher. Volumes are up slightly in the Prince Rupert and Vancouver corridors offset by small declines in other corridors. CN rationed no hopper car orders in week 40 although signs of rationing are now appearing on CP. Network fluidity changed little for either railway overnight with both CN and CP showing nominal declines in the count of idle cars. On a positive note CN made a notable dent in "old date" cars reducing the number of cars dwelling for 4+ days to the lowest levels seen in more than 30 days. On a less positive note CP's count of cars idle for 7+ days jumped 50% and now exceeds 250. Western port unloads now tracking more than 600 cars behind last week reflecting lower unloads at Prince Rupert - which is expected - and Thunder Bay offset by higher unloads at Vancouver. It is expected that pipeline volumes and unloads in the Prince Rupert corridor will continue to tail off somewhat reflecting reduced unload capacity at the Port beginning this week due to scheduled maintenance. As shippers adjust their pipelines order volumes in the Prince Rupert corridor have fallen below 1,000 cars for two consecutive weeks as compared to a weekly average of 1,500 for the preceding four weeks. ====================================================================================================================== Loads on Wheels Loads on wheels increased nominally overnight for the second consecutive day - now at 9,834-5% below the trailing 30 day average The change in loads on wheels reflects slight changes on CN (-80) and on CP (+61). On a net basis the increase in loads on wheels reflects small increases in the Vancouver and Prince Rupert corridors offset by declines in other corridors. Lower CN volumes are driven primarily by higher volumes in the Prince Rupert and lower volumes in the Vancouver corridor. System wide CN loads on wheels now at 4,651-11% below the trailing 30 day average. CP volumes changed little on a net basis but reflect higher volumes in the Vancouver corridor offset by lower US destined traffic. CP system wide loads on wheels now at 4,758 - in line with the trailing 30 day average. Vancouver now at 5,949-2% below the trailing 30 day average. The Prince Rupert pipeline currently sits at 1,055 - above the 1,000 car threshold for the first time in a week and 22% below the trailing 30 day average. Thunder Bay volumes down slightly and remain above 1,400 cars - 11% above the trailing 30 day average - 70% of traffic moving on CP. Hopper Car Rationing No hopper car rationing by CN occurred in week 40 although evidence of rationing is now appearing on CP. Loads Not Moving The count of cars not moving for 48+ hours declined modestly in total reflecting lower counts on both CN and CP. The count of idle cars now stands at 1,246. CN The count of idle cars declined nominally (39 cars) overnight. Idle car counts now at 335. The number of cars idle for 4+ days down significantly overnight - now below 50 cars - the lowest level seen in more than 30 days. The count of cars not moving for 7+ days unchanged - remains below 30 cars. Vancouver represents 72% of all idle cars. CP 1
2 CP counts decreased slightly (58 cars) overnight remaining below the 1,000 car threshold for the second consecutive day. The count of idle cars on CP now at 911. The number of cars idle for 4+ days declined for the first time in five days dropping by more than 200 cars - remains above 450 cars. The count of cars idle for 7+ days up 50% overnight - now above 250 cars. Vancouver continues to account for the majority of all idle cars (68%). In total 73% of all idle cars are dwelling at origin locations. Port Performance CN and CP reported a total of 1,172 cars unloaded at the three western ports - week 41 unloads now lagging last week's performance by more than 600 unloads through the first four days of the week reflecting lower unloads at Prince Rupert and Thunder Bay. Vancouver 801 cars reported unloaded by CN and CP at the Port of Vancouver; CN and CP There are 1,100+ cars on hand at Vancouver waiting placement for unloading - with 900 cars arriving at the port in the last 24 hours. CN and CP have nearly 1,700 cars enroute to Vancouver west of Alberta Kamloops and west - with 60% of traffic currently moving on CN. Prince Rupert Prince Rupert reported unloads of just 14 cars yesterday. A drop in unloads was expected yesterday given the lack of cars on hand and location of cars enroute to the port. Unloads now running 500+ behind last week through four days. Loads on wheels now above 1,000 cars. There are 400 cars west of Jasper west of Prince George. With cars on hand and the timely movement of inbound traffic it is expected that unloads should rise above 200 for the next couple of days. Lower overall unloads are expected given the reduced unload capacity at the Port since the start of maintenance this week. Thunder Bay 357 unloads reported by CN and CP yesterday - above 300 for the third time in four days yet total unloads for the week continue to trail last week's performance by more than 250 cars. There are currently 450+ cars on hand waiting placement for unload with only 225 cars arriving at the Port in the last 24 hours. There are 275+ cars enroute to Thunder Bay - all Winnipeg and east. Given the cars on hand at the Port and the status of the inbound pipeline we would expect that Thunder Bay should see reasonable unloads over the next few days. 2

3 Daily Loads on Wheels - 5/10/2018 E Canada Prince Rupert Thunder Bay USA/MEX Vancouver Total CN 185 1, ,774 4,651 CP ,158 4,758 Short Line US Rail ,055 1,400 1,110 5,949 9,834 Change in Loads on Wheels - Prior 24 Hours E Canada Prince Rupert Thunder Bay USA/MEX Vancouver Total CN CP Short Line US Rail
4 Daily Loads on Wheels By Pipeline Location - 5/10/2018 CN CP US Rail / Short Line E Canada Prince Rupert Thunder Bay USA/MEX Vancouver Total Origin Enroute ,454 2,623 Destination , , ,774 4,651 Origin ,267 1,870 Enroute ,304 1,889 Destination ,158 4,758 Origin Enroute Destination Change in Daily Loads on Wheels By Pipeline Location - Prior 24 Hours CN CP US Rail / Short Line E Canada Prince Rupert Thunder Bay USA/MEX Vancouver Total Origin Enroute Destination Origin Enroute Destination Origin Enroute Destination
5 5
6 Loads Not Moving 48 Hours or More - 5/10/2018 CN CP US Rail / Short Line E Canada Prince Rupert Thunder Bay USA/MEX Vancouver Total Origin Enroute Destination Origin Enroute Destination Origin Enroute Destination Change in Loads Not Moving 48 Hours or More - 5/10/2018 CN CP US Rail / Short Line E Canada Prince Rupert Thunder Bay USA/MEX Vancouver Total Origin Enroute Destination Origin Enroute Destination Origin Enroute Destination
7 7

8 Port Unloads - 5/10/2018 Prince Rupert Vancouver West Coast Total Thunder Bay Total CN CP ,172 8

9 Port Terminal Status Vancouver Daily Activity for 5/10/2018 Port Unloads Cars Arrived Cars Received in Interchange Cars Delivered in Interchange Cars Placed for Unloading Loads on Wheels at Destination As of 5/10/2018 CN CP SRY /10 05/09 Week To Date Last Week CN ,536 2,807 CP ,806 2,854 SRY Age Profile of Loaded Cars Waiting Placement for Unloading Today < 24 Hrs Hrs > Hrs > 72 Hrs Total On Hand Change in Last 24 Hours < 24 Hrs Hrs Hrs > 72 Hrs CN CP SRY 0 CN CP SRY 9
10 Port Terminal Status Prince Rupert Daily Activity for 5/10/2018 Port Unloads Cars Arrived Cars Received in Interchange Cars Delivered in Interchange Cars Placed for Unloading Loads on Wheels at Destination As of 5/10/2018 CN /10 05/09 Week To Date Last Week CN ,451 Age Profile of Loaded Cars Waiting Placement for Unloading Today < 24 Hrs Hrs > Hrs > 72 Hrs Total On Hand Change in Last 24 Hours < 24 Hrs Hrs Hrs > 72 Hrs CN 4 4 CN 4 10

11 Port Terminal Status Thunder Bay Daily Activity for 5/10/2018 Port Unloads Cars Arrived Cars Received in Interchange Cars Delivered in Interchange Cars Placed for Unloading Loads on Wheels at Destination As of 5/10/2018 CN CP /10 05/09 Week To Date Last Week CN CP ,475 Age Profile of Loaded Cars Waiting Placement for Unloading Today < 24 Hrs Hrs > Hrs > 72 Hrs Total On Hand Change in Last 24 Hours < 24 Hrs Hrs Hrs > 72 Hrs CN CP CN CP
12 Measurement Definitions Loads on Wheels Loads Not Moving Port Unloads Cars Arrived Cars Received in Interchange Cars Delivered in Interchange Cars Placed for Unloading Loads on Wheels at Destination Waiting Placement for Unloading Count of loaded rail cars including all rail cars that have been released loaded at origin and have not been reported by the railway as unloaded at destination. Counts include all rail cars (hopper cars and boxcars) moving within a pipeline. Loaded rail cars for which the railways have not reported a movement event for 48 hours or more whether the rail car is at origin, enroute or at destination. Count of rail cars reported by railways as unloaded at the western port destinations of Vancouver, Prince Rupert and Thunder Bay. Unload counts include all rail cars (hopper cars and boxcars) unloaded by all receivers including major port terminals, transloaders and other receivers. Count of rail cars reported as arrived at the destination railway terminal. Count of rail cars received in interchange by each railway within a destination railway terminal. Interchange activity is tracked for the Vancouver and Thunder Bay pipelines as applicable. Count of rail cars delivered in interchange by each railway within a destination railway terminal. Interchange activity is tracked for the Vancouver and Thunder Bay pipelines as applicable. Count of rail cars reported by the railways as placed loaded at the receiver s facility for unloading. Count of rail cars that remain under load within the destination railway terminal including rail cars that have been reported as placed for unloading but not yet reported as unloaded. Count of rail cars that have been reported as arrived at the destination railway terminal but not reported as placed for unloading by the railway. For the Ports of Vancouver, Prince Rupert and Thunder Bay the count of rail cars waiting placement for unloading is categorized by age i.e. the elapsed time from arrival at destination to the current report date. 12
Daily Pipeline Status As of 23:
 Note to Reader Prince Rupert unloads have been lower than normal for a number of weeks as a result of ongoing maintenance at the terminal which is reducing unload capacity. Over the last four weeks unloads
Monitoring the Canadian Grain Handling and Transportation System. Annual Report Crop Year. Data Tables
 Monitoring the Canadian Grain Handling and Transportation System Annual Report 2008-2009 Crop Year 2 Data Tables Government of Canada Gouvernement du Canada Data Tables PREFACE The material presented in
Government of Canada Hopper Car Fleet 2011 Annual Report
 Government of Canada Hopper Car Fleet 2011 Annual Report Prairie and Northern Region TP 14995E Her Majesty the Queen in Right of Canada, represented by the Minister of Transport, the Honourable Denis Lebel
Government of Canada Hopper Car Fleet
 Government of Canada Hopper Car Fleet 2010 Annual Report Prairie and Northern Region TP 14995E Her Majesty the Queen in Right of Canada, represented by the Minister of Transport, the Honourable Denis Lebel
Canola Weekly. Index. WCE May/07 Canola Jul 9-Aug 14-Sep 20-Oct 27-Nov 4-Jan 8-Feb 16-Mar
 March 2, 2 Canola Weekly Index ) Canola Steady Despite Weak Soy Complex 2) Slow Crush Improves Canola Oil Basis ) Export Demand Underpins Canola Last week, we mentioned that May canola had key support
CN in Your Community British Columbia Photo: Squamish, 1BC
 CN in Your Community British Columbia 2018 Photo: Squamish, 1BC CN in Numbers Global West 24% Domestic Canada 18% Global East 4% Transborder 33% Well Diversified Portfolio Intermodal 24% Petroleum and
Facility Management Webinar
 www.cn.ca Facility Management Webinar Dial In Number 866 305 1459 Pass Code 3610198# 1 Questions during presentation Phones are in listen only mode Use Chat to ask questions Keep your questions generic
G o v e r n m e n t o f C a n ada Hopper Car Fleet
 G o v e r n m e n t o f C a n ada Hopper Car Fleet Annual Report Prairie and Northern Region TP 14995E Government of Canada Hopper Car Fleet Annual Report 1 Gover nment of Canada Hopper Car Fleet Annual
Air Brake Tests and Procedures TABLE OF CONTENTS
 General Operating Instructions (GOI) Section Air Brake Tests and Procedures TABLE OF CONTENTS 1.0 General...160 2.0 Locomotive Brake Test...161 3.0 RSC (Safety Control System)...162 4.0 Locomotive and
U.S. Rail Traffic 1. Week 18, 2018 Ended May 5, 2018
 U.S. Rail Traffic 1 265,563 6.4% 4,612,788 256,266 0.9% 33,807 9.5% 583,320 32,407 3.6% 77,468 5.5% 1,483,363 82,409 0.4% Farm Products excl., and Food 16,952 8.3% 290,667 16,148 0.6% 10,407 4.6% 181,165
U.S. Rail Traffic 1. Week 17, 2018 Ended April 28, 2018
 U.S. Rail Traffic 1 266,453 3.7% 4,347,225 255,719 0.6% 32,916 3.4% 549,513 32,324 3.2% 78,970 4.2% 1,405,895 82,700 0.1% Farm Products excl., and Food 16,221 4.5% 273,715 16,101 0.1% 10,563 4.7% 170,758
U.S. Rail Traffic 1. Week 26, 2018 Ended June 30, 2018
 U.S. Rail Traffic 1 270,916 0.7% 6,747,414 259,516 1.3% 33,563 5.5% 841,770 32,376 3.8% 83,214-5.3% 2,141,239 82,355-0.1% Farm Products excl., and Food 16,316 2.1% 421,097 16,196 1.3% 11,027 1.8% 265,428
U.S. Rail Traffic 1. Week 24, 2018 Ended June 16, 2018
 U.S. Rail Traffic 1 269,748 1.9% 6,208,034 258,668 1.3% 31,707 1.5% 775,785 32,324 3.7% 85,538-1.6% 1,975,019 82,292 0.3% Farm Products excl., and Food 16,717 6.2% 388,721 16,197 1.3% 10,837 7.4% 244,234
U.S. Rail Traffic 1. Week 27, 2018 Ended July 7, 2018
 U.S. Rail Traffic 1 240,514 5.4% 6,987,928 258,812 1.4% 30,160 3.2% 871,930 32,294 3.8% 76,562-0.5% 2,217,801 82,141-0.1% Farm Products excl., and Food 15,124 10.0% 436,221 16,156 1.5% 10,017 7.2% 275,445
U.S. Rail Traffic 1. Week 42, 2018 Ended October 20, 2018
 U.S. Rail Traffic 1 265,776-0.7% 11,047,756 263,042 1.8% 30,761-0.2% 1,352,962 32,213 4.1% 85,929-0.4% 3,546,082 84,431-0.9% Farm Products excl., and Food 16,808-4.1% 681,566 16,228 2.4% 9,845 2.3% 432,578
U.S. Rail Traffic 1. Week 39, 2018 Ended September 29, 2018
 U.S. Rail Traffic 1 272,306 0.5% 10,248,559 262,784 2.0% 33,047 4.4% 1,260,433 32,319 4.5% 89,445 1.5% 3,284,902 84,228-1.0% Farm Products excl., and Food 16,942 2.8% 631,634 16,196 2.7% 10,721-2.9% 402,632
U.S. Rail Traffic 1. Week 44, 2018 Ended November 3, 2018
 U.S. Rail Traffic 1 270,305 1.8% 11,586,596 263,332 1.9% 32,209 2.2% 1,416,860 32,201 4.1% 88,399 1.6% 3,722,456 84,601-0.7% Farm Products excl., and Food 17,133 2.8% 715,329 16,257 2.3% 10,357 3.2% 453,424
U.S. Rail Traffic 1. Week 41, 2018 Ended October 13, 2018
 U.S. Rail Traffic 1 263,787 10,781,980 262,975 1.9% 30,416-1.7% 1,322,201 32,249 4.2% 86,312 0.2% 3,460,153 84,394-0.9% Farm Products excl., and Food 16,355 664,758 16,214 2.5% 9,927-0.3% 422,733 10,311
U.S. Rail Traffic 1. Week 46, 2018 Ended November 17, 2018
 U.S. Rail Traffic 1 262,514-1.1% 12,110,985 263,282 1.8% 31,796-0.4% 1,480,087 32,176 4.0% 86,159-0.2% 3,893,147 84,634-0.7% Farm Products excl., and Food 16,141-3.7% 747,905 16,259 2.1% 9,541-5.4% 473,048
U.S. Rail Traffic 1. Week 45, 2018 Ended November 10, 2018
 U.S. Rail Traffic 1 261,875 0.1% 11,848,471 263,299 1.8% 31,431 1,448,291 32,184 4.1% 84,532-0.7% 3,806,988 84,600-0.7% Farm Products excl., and Food 16,435-1.3% 731,764 16,261 2.3% 10,083 2.5% 463,507
Into (and Out of?) the Valley
 the Valley") Into (and Out of?) the Valley Rail Traffic Trends in the 2010s Michael W. Blaszak Overall Trends U.S. Overall Trends U.S. Gross Domestic Product U.S. Source: https://fred.stlouisfed.org/series/gdp#0 Overall
Into (and Out of?) the Valley Rail Traffic Trends in the 2010s Michael W. Blaszak Overall Trends U.S. Overall Trends U.S. Gross Domestic Product U.S. Source: https://fred.stlouisfed.org/series/gdp#0 Overall
CITY OF VANCOUVER ADMINISTRATIVE REPORT
 Supports Item No. 1 T&T Committee Agenda May 13, 2008 CITY OF VANCOUVER ADMINISTRATIVE REPORT Report Date: April 29, 2008 Author: Don Klimchuk Phone No.: 604.873.7345 RTS No.: 07283 VanRIMS No.: 13-1400-10
APPENDIX B. Origin Destination Study Data
 APPENDIX B Origin Destination Study Data - TABLE OF CONTENTS - Page No. EXECUTIVE SUMMARY... 1 Map of the Study area with Site Locations... 2 Summary Table of Results for the TH 14 Corridor Study... 3
Canadian Pacific Railway: Addressing Climate Change. UN Conference on Climate Change (COP 11) December 3, 2005
 December 3, 2005") Canadian Pacific Railway: Addressing Climate Change UN Conference on Climate Change (COP 11) December 3, 2005 CPR Network Canadian Pacific Railway Limited operates a transcontinental railway in Canada
Canadian Pacific Railway: Addressing Climate Change UN Conference on Climate Change (COP 11) December 3, 2005 CPR Network Canadian Pacific Railway Limited operates a transcontinental railway in Canada
IRSCH REEN Hirsch/Green Transportation Consulting, Inc.
 IRSCH REEN Hirsch/Green Transportation Consulting, Inc. February 6, 2013 Mr. David Weil Director of Finance St. Matthew s Parish School 1031 Bienveneda Avenue Pacific Palisades, California 90272 RE: Trip
Fuel Focus. Understanding Gasoline Markets in Canada and Economic Drivers Influencing Prices. Issue 24, Volume 8
 Fuel Focus Understanding Gasoline Markets in Canada and Economic Drivers Influencing Prices Issue 24, Volume 8 December, Copies of this publication may be obtained free of charge from: Natural Resources
Fuel Focus. Understanding Gasoline Markets in Canada and Economic Drivers Influencing Prices. Volume 10, Issue 4
 Fuel Focus Understanding Gasoline Markets in Canada and Economic Drivers Influencing Prices Volume 1, Issue 4 March, Copies of this publication may be obtained free of charge from: Natural Resources Canada
East Stockton Boulevard (South Sacramento) Costco Gasoline Expansion Fuel Station Expansion Trip Generation Estimate
 Costco Gasoline Expansion Fuel Station Expansion Trip Generation Estimate") MEMORANDUM Date: February 7, 2013 Project #: 13270.0 To: From: Matt Cyr, Barghausen Consulting Engineers Sonia Hennum, PTOE & Alex Kiheri Project: Subject: cc: East Stockton Boulevard (South Sacramento)
MEMORANDUM Date: February 7, 2013 Project #: 13270.0 To: From: Matt Cyr, Barghausen Consulting Engineers Sonia Hennum, PTOE & Alex Kiheri Project: Subject: cc: East Stockton Boulevard (South Sacramento)
Transport Group Perspective Chris Blow Chair of The Guildford Society Transport Group 21st Jan 2015
 Transport Group Perspective Chris Blow Chair of The Guildford Society Transport Group 21st Jan 2015 LET'S REMEMBER THAT THIS IS NOT A STATION REDEVELOPMENT BUT A STATION SITE REDEVELOPMENT. The big question:
Empire State Manufacturing Survey
 December 218 Empire State Manufacturing Survey Business activity grew at a slower pace than in recent months in New York State, according to firms responding to the December 218 Empire State Manufacturing
Clean Harbors Canada, Inc.
 Clean Harbors Canada, Inc. Proposed Lambton Landfill Expansion Environmental Assessment Terms of Reference Transportation Assessment St. Clair Township, Ontario September 2009 itrans Consulting Inc. 260
May 8th Feel free to call us for live up to date market pricing.
 May 8th - 2018 The economy continues to hum. Everything looks good for rail, with some challenges. The U.S. unemployment rate is at its lowest level in 18 years at 3.9%. The labor market is tight for skilled
The Boston South Station HSIPR Expansion Project Cost-Benefit Analysis. High Speed Intercity Passenger Rail Technical Appendix
 The Boston South Station HSIPR Expansion Project Cost-Benefit Analysis High Speed Intercity Passenger Rail Technical Appendix Prepared by HDR August 5, 2010 The Boston South Station HSIPR Expansion Project
Expansion Projects Description
 Expansion Projects Description The Turnpike expansion program was authorized by the Florida Legislature in 1990 to meet the State s backlog of needed highway facilities. The Legislature set environmental
National Safety Code. SAFE Companies Revised 2010 Audits. Regulations for Light Truck Carriers
 National Safety Code SAFE Companies Revised 2010 Audits Regulations for Light Truck Carriers Introduction The intent of this information is to give Light Truck Carriers explanation on the National Safety
CLRP. Performance Analysis of The Draft 2014 CLRP. Long-Range Transportation Plan For the National Capital Region
 NATIONAL CAPITAL REGION TRANSPORTATION PLANNING BOARD Item 12 CLRP Financially Constrained Long-Range Transportation Plan For the National Capital Region 2014 Performance Analysis of The Draft 2014 CLRP
Introduction: Supplied to 360 Test Labs... Battery packs as follows:
 2007 Introduction: 360 Test Labs has been retained to measure the lifetime of four different types of battery packs when connected to a typical LCD Point-Of-Purchase display (e.g., 5.5 with cycling LED
THE GREAT PROVINCIAL OBSTACLE COURSE
 PRO LOG CANADA THE GREAT PROVINCIAL OBSTACLE COURSE GOODS AND SERVICES WE CAN T SELL TO OURSELVES A CLOSE LOOK AT THE ENERGY AND TRANSPORTATION SECTORS THE GREAT PROVINCIAL OBSTACLE COURSE The BNA Act
TRAFFIC DEPARTMENT 404 EAST WASHINGTON BROWNSVILLE, TEXAS City of Brownsville Speed Hump Installation Policy
 A. GENERAL Speed humps are an effective and appropriate device for safely reducing vehicle speeds on certain types of streets when installed accordance with the provisions of this policy. In order for
CN is offering our Fleet Integration Program for grain shippers who are using privately owned, covered hopper cars for
 US Covered Hopper Fleet Integration Program CN is offering our Fleet Integration Program for grain shippers who are using privately owned, covered hopper cars for their shipments. The objectives of this
Report on the MLA Job Information List,
 MLA Office of Research Web publication, September 211 211 by The Modern Language Association of America All material published by the Modern Language Association in any medium is protected by copyright.
RAILWAY INVESTIGATION REPORT R00W0106 MAIN TRACK DERAILMENT
 RAILWAY INVESTIGATION REPORT R00W0106 MAIN TRACK DERAILMENT CANADIAN NATIONAL FREIGHT TRAIN NO. E20531-15 MILE 154.4, REDDITT SUBDIVISION WHITE, ONTARIO 16 MAY 2000 The Transportation Safety Board of Canada
Empire State Manufacturing Survey.
 Month March 18 19 Business activity grew only slightly in New York State, according to firms responding to the March 19. The headline general business conditions index fell five points to 3.7. New orders
Fuel Focus. National Overview. Recent Developments. In this Issue. Volume 11, Issue 13 June 24, 2016 ISSN
 National Overview Fuel Focus Canadian Retail Gasoline Prices Remained the Same over the Last Two Weeks For the two-week period ending June 21, 16, the Canadian average retail gasoline price was $1.1 per
King County Metro. Columbia Street Transit Priority Improvements Alternative Analysis. Downtown Southend Transit Study. May 2014.
 King County Metro Columbia Street Transit Priority Improvements Alternative Analysis Downtown Southend Transit Study May 2014 Parametrix Table of Contents Introduction... 1 Methodology... 1 Study Area...
Mark Westhoff Director, Facility and Capacity Planning El Paso Western Pipelines
 El Paso Corporation Mark Westhoff Director, Facility and Capacity Planning El Paso Western Pipelines Capacity Reservation Factors October 22, 2008 Defining Our Purpose El Paso Corporation provides natural
Analysis of Radial and Trunk Feeder Transit System Configurations in Downtown Charlottesville
 Analysis of Radial and Trunk Feeder Transit System Configurations in Downtown Charlottesville 1. Introduction During the stakeholder input sessions of Charlottesville Area Transit s (CAT) Transit Development
Fuel Focus. Understanding Gasoline Markets in Canada and Economic Drivers Influencing Prices. Issue 20, Volume 8
 Fuel Focus Understanding Gasoline Markets in Canada and Economic Drivers Influencing Prices Issue 20, Volume 8 October 18, 2013 Copies of this publication may be obtained free of charge from: Natural Resources
Service Quality: Higher Ridership: Very Affordable: Image:
 Over the past decade, much attention has been placed on the development of Bus Rapid Transit (BRT) systems. These systems provide rail-like service, but with buses, and are typically less expensive to
2019 Residential Solar Grid-Tie Catalogue April Issue
 2019 Residential Solar Grid-Tie Catalogue April Issue Generating Electricity for a Sustainable World Grid-Tie System in Vernon, BC www.ipwr.net #101-2387 Dominion Rd West Kelowna, BC Canada V1Z 2Y4 Phone:
BR Class 105. Copyright Dovetail Games 2015, all rights reserved Release Version 1.0
 BR Class 105 1 BACKGROUND... 3 1.1 Loco... 3 1.2 Design & Specification... 3 2 ROLLING STOCK... 4 2.1 BR Class 105 DMBS... 4 2.2 BR Class 105 DTCL... 4 3 DRIVING THE BR CLASS 105... 5 3.1 Cab Controls...
TRANSPACIFIC CUSTOMER ADVISORY Implementation of New BAF Formula Effective January 01, 2019
 December 7, 2018 TRANSPACIFIC CUSTOMER ADVISORY Implementation of New BAF Formula Effective January 01, 2019 Dear Valued Customer, Bunker is one of the important cost components for a container shipping
TRAVEL DEMAND FORECASTS
 Jiangxi Ji an Sustainable Urban Transport Project (RRP PRC 45022) TRAVEL DEMAND FORECASTS A. Introduction 1. The purpose of the travel demand forecasts is to assess the impact of the project components
Fuel Focus. Understanding Gasoline Markets in Canada and Economic Drivers Influencing Prices. Volume 7, Issue 14
 Fuel Focus Understanding Gasoline Markets in Canada and Economic Drivers Influencing Prices Volume 7, Issue 14 July 27, 12 Copies of this publication may be obtained free of charge from: Natural Resources
Alpine Highway to North County Boulevard Connector Study
 Alpine Highway to North County Boulevard Connector Study prepared by Avenue Consultants March 16, 2017 North County Boulevard Connector Study March 16, 2017 Table of Contents 1 Summary of Findings... 1
President, Public Transport Users Association
 East West Toll Road: Impacts Missing From the Comprehensive Impact Statement Dr Tony Morton President, Public Transport Users Association Urban 'connectivity' and agglomeration benefits To our knowledge
A SPS Comparison Graphs
 A SPS Comparison Graphs This section of the specification document provides either an example of the default graph for each case or instructions on how to generate such a graph external to the program
CPC (Certificate of Professional Competence)
") Vocational Qualifications (QCF, NVQ, NQF) CPC (Certificate of Professional Competence) Level 3 CPC (Certificate of Professional Competence) for Transport Managers (Road Haulage) - 05669 Unit R2: Certificate
Vocational Qualifications (QCF, NVQ, NQF) CPC (Certificate of Professional Competence) Level 3 CPC (Certificate of Professional Competence) for Transport Managers (Road Haulage) - 05669 Unit R2: Certificate
Date: February 7, 2017 John Doyle, Z-Best Products Robert Del Rio. T.E. Z-Best Traffic Operations and Site Access Analysis
 Memorandum Date: February 7, 07 To: From: Subject: John Doyle, Z-Best Products Robert Del Rio. T.E. Z-Best Traffic Operations and Site Access Analysis Introduction Hexagon Transportation Consultants, Inc.
2018 Residential Solar Grid-Tie Catalogue September Issue
 2018 Residential Solar Grid-Tie Catalogue September Issue Generating Electricity for a Sustainable World Grid-Tie System in Vernon, BC A+ www.ipwr.net #101-2387 Dominion Rd West Kelowna, BC Canada V1Z
Hours of Service. Accurate reference is on the Internet at:
 Hours of Service This is an unofficial interpretation of the federal Commercial Vehicle Drivers Hours of Service regulations that take effect on January 1, 2007. 1 Hours of Service Accurate reference is
WIM #39 MN 43, MP 45.2 WINONA, MN APRIL 2010 MONTHLY REPORT
 WIM #39 MN 43, MP 45.2 WINONA, MN APRIL 2010 MONTHLY REPORT In order to understand the vehicle classes and groupings the Mn/DOT Vehicle Classification Scheme and the Vehicle Class Groupings for Forecasting
4.2 Series Station Option Description
 4.2 Series Station Option Description The series station proposal features a new set of side platforms constructed approximately 250 feet north of the existing platforms. The two new platforms would extend
Trading the Line. How to Use Trendlines to Spot Reversals and Ride Trends. ebook
 Trading the Line How to Use Trendlines to Spot Reversals and Ride Trends ebook EWI ebook Trading the Line How to Use Trendlines to Spot Reversals and Ride Trends By Jeffrey Kennedy, Elliott Wave International
HUMC/Mountainside Hospital Redevelopment Plan
 Traffic and Parking Analysis HUMC/Mountainside Hospital Redevelopment Plan in Glen Ridge Borough and Montclair Township PREPARED FOR H2M 119 Cherry Hill Road, Suite 110 Parsippany, NJ 07054 862.207.5900
Residential Load Profiles
 Residential Load Profiles TABLE OF CONTENTS PAGE 1 BACKGROUND... 1 2 DATA COLLECTION AND ASSUMPTIONS... 1 3 ANALYSIS AND RESULTS... 2 3.1 Load Profiles... 2 3.2 Calculation of Monthly Electricity Bills...
HIGHWAY TRAFFIC ACT COMMERCIAL VEHICLE DRIVERS HOURS OF SERVICE REGULATIONS
 c t HIGHWAY TRAFFIC ACT COMMERCIAL VEHICLE DRIVERS HOURS OF SERVICE REGULATIONS PLEASE NOTE This document, prepared by the Legislative Counsel Office, is an office consolidation of this regulation, current
Fredericksburg. Richmond, VA. Accident
 1 2 3 4 5 6 7 8 9 NOON 1 2 3 4 5 6 7 8 9 10 11 1: OFF DUTY 2: SLEEPER BERTH 3: DRIVING 4: ON DUTY (NOT DRIVING) 1 2 3 4 5 6 7 8 9 10 11 NOON 1 2 3 4 5 6 7 8 9 10 11 REMARKS Richmond, VA Fredericksburg
Rates of Motor Vehicle Crashes, Injuries, and Deaths in Relation to Driver Age, United States,
 RESEARCH BRIEF This Research Brief provides updated statistics on rates of crashes, injuries and death per mile driven in relation to driver age based on the most recent data available, from 2014-2015.
PUBLICATION NEW TRENDS IN ELEVATORING SOLUTIONS FOR MEDIUM TO MEDIUM-HIGH BUILDINGS TO IMPROVE FLEXIBILITY
 PUBLICATION NEW TRENDS IN ELEVATORING SOLUTIONS FOR MEDIUM TO MEDIUM-HIGH BUILDINGS TO IMPROVE FLEXIBILITY Johannes de Jong E-mail: johannes.de.jong@kone.com Marja-Liisa Siikonen E-mail: marja-liisa.siikonen@kone.com
Appendix SAN San Diego, California 2003 Annual Report on Freeway Mobility and Reliability
 (http://mobility.tamu.edu/mmp) Office of Operations, Federal Highway Administration Appendix SAN San Diego, California 2003 Annual Report on Freeway Mobility and Reliability This report is a supplement
Abstract. Executive Summary. Emily Rogers Jean Wang ORF 467 Final Report-Middlesex County
 Emily Rogers Jean Wang ORF 467 Final Report-Middlesex County Abstract The purpose of this investigation is to model the demand for an ataxi system in Middlesex County. Given transportation statistics for
Northwest Residential Electric Bills
 Henry Lorenzen Chair Oregon Bill Bradbury Oregon Phil Rockefeller Washington Tom Karier Washington W. Bill Booth Vice Chair Idaho James Yost Idaho Pat Smith Montana Jennifer Anders Montana July 2016 Northwest
2010 Motorcycle Risk Study Update
 2010 Motorcycle Risk Study Update Introduction This report provides an update to the Motorcycle Risk Study from AI.16 of the 2005 Rate Application. The original study was in response to Public Utilities
GPS Robot Navigation Bi-Weekly Report 2/07/04-2/21/04. Chris Foley Kris Horn Richard Neil Pittman Michael Willis
 GPS Robot Navigation Bi-Weekly Report 2/07/04-2/21/04 Chris Foley Kris Horn Richard Neil Pittman Michael Willis GPS Robot Navigation Bi-Weekly Report 2/07/04-2/21/04 Goals for Two Week Period For the first
Welcome. Green Line in Your Community
 Welcome Green Line in Your Community Today's session will provide you with information about Administration's recommendation for connecting the Green Line in the Beltline to Victoria Park and Inglewood/Ramsay
RE: A Traffic Impact Statement for a proposed development on Quinpool Road
 James J. Copeland, P.Eng. GRIFFIN transportation group inc. 30 Bonny View Drive Fall River, NS B2T 1R2 May 31, 2018 Ellen O Hara, P.Eng. Project Engineer DesignPoint Engineering & Surveying Ltd. 200 Waterfront
BUSINESS AND CONSUMER SURVEY RESULTS. February 2019: Economic Sentiment broadly stable in the euro area, down in the EU
 February 2019 BUSINESS AND CONSUMER SURVEY RESULTS 120 Graph 1: Economic sentiment indicator (s.a.) 110 100 90 80 EA EU 70 long-term av erage (1990-2018) = 100 60 1995 1997 1999 2001 2003 2005 2007 2009
BUSINESS AND CONSUMER SURVEY RESULTS. Euro Area (EA) European Union (EU)
 European Union (EU)") June 2015 BUSINESS AND CONSUMER SURVEY RESULTS 120 Graph 1: Economic sentiment indicator (s.a.) 110 100 90 80 70 60 long-term average (1990-2014) = 100 Euro Area (EA) European Union (EU) 1990 1991 1992
June 2015 BUSINESS AND CONSUMER SURVEY RESULTS 120 Graph 1: Economic sentiment indicator (s.a.) 110 100 90 80 70 60 long-term average (1990-2014) = 100 Euro Area (EA) European Union (EU) 1990 1991 1992
Impact Evaluation of 2004 Compressed Air Prescriptive Rebates
 Impact Evaluation of 2004 Compressed Air Prescriptive Rebates May 15, 2006 Prepared for: National Grid USA Service Company P.O. 0000027684 DMI# 05006.520 Prepared by: DMI 450 Lexington Street Newton, MA
New West Partnership Deliverables July 2011/2012 Reporting
 Area 1 - Vehicle Weights and Dimensions Steering Axle Weight Limits July 2011 Changes to vehicle design and It is Alberta s position, jointly agreed upon by other New West additional required equipment
Presentation A Blue Slides 1-5.
 Presentation A Blue Slides 1-5. 1 Presentation A Blue Slides 1-5. 2 Presentation A Blue Slides 1-5. 3 Presentation A Blue Slides 1-5. 4 Presentation A Blue Slides 1-5. 5 Transit Service right. service
Electromobility as an opportunity
 newsroom Technology Aug 28, 2018 Electromobility as an opportunity Porsche is actively pursuing the future of electromobility where the journey is going and where challenges await is discussed in this
NEWSFILE RICKMANSWORTH AND EALING COMMON END OF TUBE EVENT AT THE EPPING-ONGAR RAILWAY
 NEWSFILE RICKMANSWORTH AND EALING COMMON During the August Bank Holiday weekend, with points replacement taking place at Rickmansworth (Above), your photographer was amused to see an umbrella covering
In this report, last week multiple commodities came down in price while parts of Wall Street hit new all-time highs.
 This is the Scrap Metal & Commodities Recycling report, by BENLEE Roll off, Lugger and Open Top Trailers and Raleigh and Goldsboro Metal Recycling Monday August 8th, 2016. In this report, last week multiple
CITY OF LONDON STRATEGIC MULTI-YEAR BUDGET ADDITIONAL INVESTMENTS BUSINESS CASE # 6
 2016 2019 CITY OF LONDON STRATEGIC MULTI-YEAR BUDGET ADDITIONAL INVESTMENTS BUSINESS CASE # 6 STRATEGIC AREA OF FOCUS: SUB-PRIORITY: STRATEGY: INITIATIVE: INITIATIVE LEAD(S): BUILDING A SUSTAINABLE CITY
BC Region. New Home Market. Subscribe Now! Table of Contents. Housing market intelligence you can count on
 H o u s i n g M a r k e t I n f o r m a t i o n Housing Now BC Region C a n a d a M o r t g a g e a n d H o u s i n g C o r p o r a t i o n Date Released: Third Quarter 2011 Table of Contents 1 New Home
Emerging Trends in Petroleum Markets
 Emerging Trends in Petroleum Markets For Defense Logistics Agency, Worldwide Energy Conference Washington, D.C. By T. Mason Hamilton, Petroleum Markets Analyst U.S. Energy Information Administration Independent
WIM #40 US 52, MP S. ST. PAUL, MN APRIL 2010 MONTHLY REPORT
 WIM #40 US 52, MP 126.8 S. ST. PAUL, MN APRIL 2010 MONTHLY REPORT In order to understand the vehicle classes and groupings the Mn/DOT Vehicle Classification Scheme and the Vehicle Class Groupings for Forecasting
Factory activity accelerated further in our region this month, posting its highest composite reading since 2011, said Wilkerson.
 FOR RELEASE Thursday, October 26, 17 EMBARGOED FOR A.M. CENTRAL TIME CONTACT: Pam Campbell 45-27-8617 Pam.Campbell@kc.frb.org TENTH DISTRICT MANUFACTURING ACTIVITY POSTS STRONG GROWTH Federal Reserve Bank
Start covering fall fuel needs OPEC unity stabilizes oil market for now By Bryce Knorr, senior grain market analyst
 Start covering fall fuel needs OPEC unity stabilizes oil market for now By Bryce Knorr, senior grain market analyst OPEC and its allies are a strange bunch. Iran hates Saudi Arabia as much as it dislikes
The Fuel and Vehicle Trends Report August 31, 2016
 ISSN 1948-2388 The Fuel and Vehicle Trends Report August 31, 2016 This report is a summary of the latest fuel prices and other oil industry key statistics. In addition, this report provides the latest
ZLogs Help. Tablet Applications. Contents. ZLogs Help
 Contents ZLogs Home Screen... 3 What s the difference between certifying logs and verifying edits?... 5 What is the self-check and what if it fails?... 6 How do I check and submit my status logs?... 6
Fuel Focus. Understanding Gasoline Markets in Canada and Economic Drivers Influencing Prices. Volume 7, Issue 8
 Fuel Focus Understanding Gasoline Markets in Canada and Economic Drivers Influencing Prices May 4, 12 Copies of this publication may be obtained free of charge from: Natural Resources Canada Petroleum
Interstate Operations Study: Fargo-Moorhead Metropolitan Area Simulation Output
 NDSU Dept #2880 PO Box 6050 Fargo, ND 58108-6050 Tel 701-231-8058 Fax 701-231-6265 www.ugpti.org www.atacenter.org Interstate Operations Study: Fargo-Moorhead Metropolitan Area 2015 Simulation Output Technical
Analyses. May HolidayEuro Summer Purchasing Power of the Euro Abroad. Bank Austria Economics & Market Analysis Austria
 Bank Austria Economics & Market Analysis Austria Analyses HolidayEuro Summer 2011 Purchasing Power of the Euro Abroad May 2011 http://economicresearch.bankaustria.at Overview Holiday uro in summer 2011
Traffic Impact Analysis Walden Lake Plant City, Florida
 Traffic Impact nalysis Plant ity, Florida Final Summary Report January 2015 Prepared by: 18115 U.S. Highway 41, Suite 600 Lutz, Florida 33549 ertificate of uthorization # 4548 Traffic Impact nalysis 2
First Half 2018 Resale Retail Transaction performance was better in Larger and Newer market groups and segments:
 For Immediate Release: AMSTAT releases latest Business Jet and Turbo Prop Resale Market Update for the first six months of 218 showing continued strength in Heavy Jet resale transactions and a tightening
SOLENT OYSTER FISHERY
 SOLENT OYSTER FISHERY 2015 Stock Report Baird Dredge 9 th -15 th July 2015 Report compiled by Richard Gibbs AKNOWLEDGEMENTS Thanks to the following people for providing assistance during the survey: David
Our Mission Safely move people and goods.
 Our Mission Safely move people and goods. Published 1/15/2013 CNN Money that Williston strippers earn up to $3,000 a night. It's time Las Vegas lost its title as "stripper capital of the universe" to