Daily Pipeline Status As of 23:
|
|
|
- Juliana Floyd
- 5 years ago
- Views:
Transcription
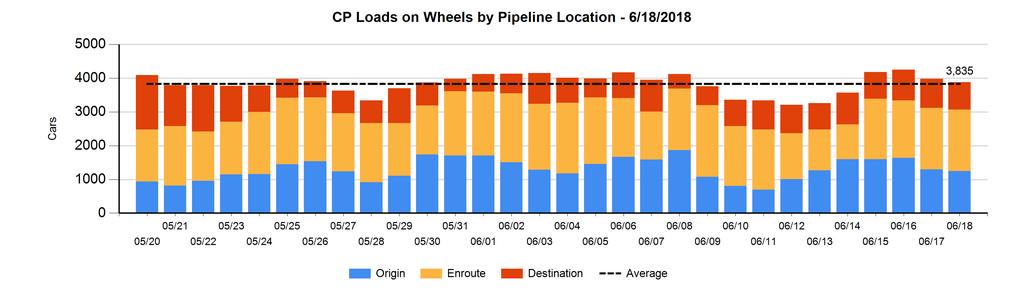
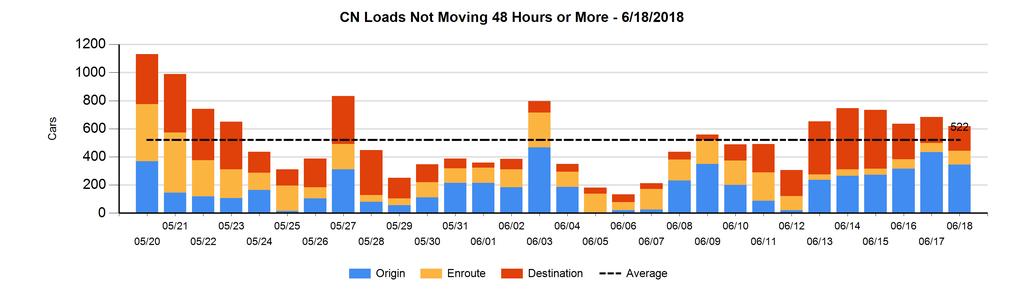
1 Note to Reader Prince Rupert unloads have been lower than normal for a number of weeks as a result of ongoing maintenance at the terminal which is reducing unload capacity. Over the last four weeks unloads have averaged 770 unloads. Following three weeks of declining unloads last week saw unloads rise above 900 once again. Alliance Grain Terminal in Vancouver has now begun planned maintenance which is expected to continue until mid-august. SPEED READ Loads on wheels declined slightly overnight reflecting marginal declines on both railways. On a net basis Vancouver traffic increased slightly for both CN and CP while Thunder Bay and Prince Rupert declined. Network fluidity improved overnight albeit the principal improvement was seen on CP where idle car counts declined by some 32% or more than 300 cars in the last 24 hours. For CP the improvement occurred across all major corridors while the improvement on CN was seen largely in the Prince Rupert corridor. On a less positive note CP's count, while improving overall, worsened with respect to cars not moving for four days or more doubling overnight and surpassing 350 cars. CN counts above 4 days remained steady but still number above on a combined basis the two railways have 600+ cars or roughly half the total of all idle cars having been idle for four days or more. Week 47 unloads began the week tracking at last week's pace although performance is mixed across the three western ports with Rupert and Thunder Bay off to strong starts while Vancouver unloads lag last week's start by 25%. ====================================================================================================================== Loads on Wheels Loads on wheels declined marginally overnight reflecting small declines on both CN and CP - now at 8,137 and in line with the trailing 30 day average On a net basis the decrease in loads on wheels reflects principally an increase in the Vancouver and US corridors offset by lower volumes in the Prince Rupert and Thunder Bay corridors. CN volumes were largely unchanged overnight reflecting an increase in Thunder Bay traffic offset by a decline in Prince Rupert volumes. System wide CN loads on wheels now at 3,958 and in line with the trailing 30 day average. CP volumes declined slightly overnight with lower volumes in the Thunder Bay corridor offset somewhat by an increase in Vancouver traffic. CP system wide loads on wheels now at 3,881 - in line with the trailing 30 day average. Vancouver now at 5,098-6% above the trailing 30 day average. The Prince Rupert pipeline currently sits at falling below the 1,000 car threshold for the first time in four days and now 4% above the trailing 30 day average. Thunder Bay volumes fell 15% (-152 cars) reflecting an increase on CN offset by a larger decline on CP with the latter reflecting high unloads at the Port in the last 24 hours. Now below 900 cars - 21% below the trailing 30 day average with 70% of traffic moving on CP Hopper Car Rationing No hopper car rationing has been reported for either CN or CP in week 46 and none expected in week 47. Loads Not Moving The count of cars not moving for 48+ hours declined by 23% (401 cars) reflecting lower counts on both railways but predominantly reflecting an improvement on CP. Idle car counts now at 1,321. CN 1
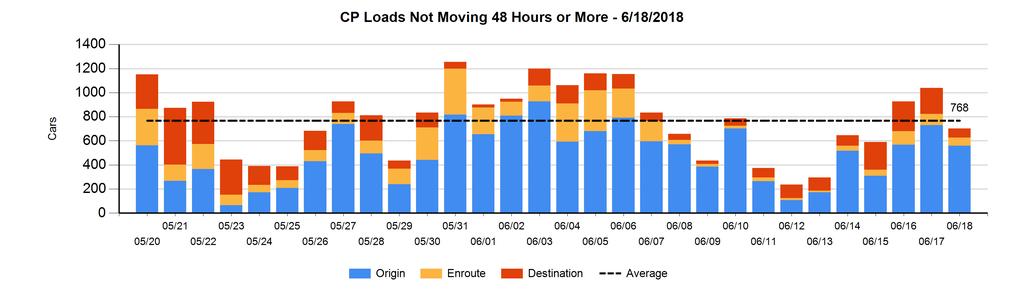
2 The count of idle cars declined slightly overnight (-64 cars) - idle car counts now at 620. The number of cars idle for 4+ days largely unchanged overnight - remains above 250 cars. The count of cars not moving for 7+ days doubled overnight - now above 100 cars. Vancouver represents 70% of all idle cars. CP CP counts fell 32% (337 cars) overnight - idle car counts now at 701. The number of cars idle for 4+ days more than doubled overnight - now above 350 cars. The count of cars idle for 7+ days unchanged overnight - remains below 10 cars. Vancouver accounts for 49% of all idle cars. In total 80% of all idle cars are dwelling at origin locations. Port Performance CN and CP reported a total of 964 cars unloaded at the three western ports. One day in Week 47 unloads tracking at the same pace as last week. Vancouver 490 cars reported unloaded by CN and CP at the Port of Vancouver; CN and CP There are 750+ cars on hand at Vancouver waiting placement for unloading with 750+ cars arriving at the port in the last 24 hours. CN and CP have only 700 cars enroute to Vancouver west of Alberta Kamloops and west - with 65% of traffic currently moving on CP. Prince Rupert As anticipated Prince Rupert unloads came in just below 150 yesterday reflecting 50% higher unloads than Monday of last week. Loads on wheels now below 900 cars There are fewer than 150 cars west of Jasper - less than 50 Prince George and west. There are currently 300 cars on site and despite the seemingly thin pipeline for inbound traffic it is anticipated that the Port should continue to have sufficient cars available to support unloads per day for the next 2-3 days. Thunder Bay 326 unloads reported at Thunder Bay yesterday - all on CP - approximately 50% more unloads than reported for Monday of last week. There are 400+ cars on site at Thunder Bay with 150 cars arriving at the Port in the prior 24 hours. There are fewer than 150 cars enroute to Thunder Bay - none of these east of Winnipeg. While cars on hand will carry unloads for another day the current structure of the pipeline suggests unloads may be challenged by mid week. 2

3 Daily Loads on Wheels - 6/18/2018 E Canada Prince Rupert Thunder Bay USA/MEX Vancouver Total CN ,416 3,958 CP ,653 3,881 Short Line US Rail ,114 5,098 8,137 Change in Loads on Wheels - Prior 24 Hours E Canada Prince Rupert Thunder Bay USA/MEX Vancouver Total CN CP Short Line US Rail
4 Daily Loads on Wheels By Pipeline Location - 6/18/2018 CN CP US Rail / Short Line E Canada Prince Rupert Thunder Bay USA/MEX Vancouver Total Origin Enroute ,437 2,145 Destination , ,416 3,958 Origin ,247 Enroute ,347 1,824 Destination ,653 3,881 Origin Enroute Destination Change in Daily Loads on Wheels By Pipeline Location - Prior 24 Hours CN CP US Rail / Short Line E Canada Prince Rupert Thunder Bay USA/MEX Vancouver Total Origin Enroute Destination Origin Enroute Destination Origin Enroute Destination
5 5
6 Loads Not Moving 48 Hours or More - 6/18/2018 CN CP US Rail / Short Line E Canada Prince Rupert Thunder Bay USA/MEX Vancouver Total Origin Enroute Destination Origin Enroute Destination Origin Enroute Destination Change in Loads Not Moving 48 Hours or More - 6/18/2018 CN CP US Rail / Short Line E Canada Prince Rupert Thunder Bay USA/MEX Vancouver Total Origin Enroute Destination Origin Enroute Destination Origin Enroute Destination
7 7

8 Port Unloads - 6/18/2018 Prince Rupert Vancouver West Coast Total Thunder Bay Total CN CP

9 Port Terminal Status Vancouver Daily Activity for 6/18/2018 Port Unloads Cars Arrived Cars Received in Interchange Cars Delivered in Interchange Cars Placed for Unloading Loads on Wheels at Destination As of 6/18/2018 CN CP SRY /18 06/17 Week To Date Last Week CN ,686 CP ,954 SRY Age Profile of Loaded Cars Waiting Placement for Unloading Today < 24 Hrs Hrs > Hrs > 72 Hrs Total On Hand Change in Last 24 Hours < 24 Hrs Hrs Hrs > 72 Hrs CN CP SRY 0 CN CP SRY 9
10 Port Terminal Status Prince Rupert Daily Activity for 6/18/2018 Port Unloads Cars Arrived Cars Received in Interchange Cars Delivered in Interchange Cars Placed for Unloading Loads on Wheels at Destination As of 6/18/2018 CN /18 06/17 Week To Date Last Week CN Age Profile of Loaded Cars Waiting Placement for Unloading Today < 24 Hrs Hrs > Hrs > 72 Hrs Total On Hand Change in Last 24 Hours < 24 Hrs Hrs Hrs > 72 Hrs CN CN

11 Port Terminal Status Thunder Bay Daily Activity for 6/18/2018 Port Unloads Cars Arrived Cars Received in Interchange Cars Delivered in Interchange Cars Placed for Unloading Loads on Wheels at Destination As of 6/18/2018 CN CP /18 06/17 Week To Date Last Week CN 399 CP ,061 Age Profile of Loaded Cars Waiting Placement for Unloading Today < 24 Hrs Hrs > Hrs > 72 Hrs Total On Hand Change in Last 24 Hours < 24 Hrs Hrs Hrs > 72 Hrs CN CP CN 76 0 CP
12 Measurement Definitions Loads on Wheels Loads Not Moving Port Unloads Cars Arrived Cars Received in Interchange Cars Delivered in Interchange Cars Placed for Unloading Loads on Wheels at Destination Waiting Placement for Unloading Count of loaded rail cars including all rail cars that have been released loaded at origin and have not been reported by the railway as unloaded at destination. Counts include all rail cars (hopper cars and boxcars) moving within a pipeline. Loaded rail cars for which the railways have not reported a movement event for 48 hours or more whether the rail car is at origin, enroute or at destination. Count of rail cars reported by railways as unloaded at the western port destinations of Vancouver, Prince Rupert and Thunder Bay. Unload counts include all rail cars (hopper cars and boxcars) unloaded by all receivers including major port terminals, transloaders and other receivers. Count of rail cars reported as arrived at the destination railway terminal. Count of rail cars received in interchange by each railway within a destination railway terminal. Interchange activity is tracked for the Vancouver and Thunder Bay pipelines as applicable. Count of rail cars delivered in interchange by each railway within a destination railway terminal. Interchange activity is tracked for the Vancouver and Thunder Bay pipelines as applicable. Count of rail cars reported by the railways as placed loaded at the receiver s facility for unloading. Count of rail cars that remain under load within the destination railway terminal including rail cars that have been reported as placed for unloading but not yet reported as unloaded. Count of rail cars that have been reported as arrived at the destination railway terminal but not reported as placed for unloading by the railway. For the Ports of Vancouver, Prince Rupert and Thunder Bay the count of rail cars waiting placement for unloading is categorized by age i.e. the elapsed time from arrival at destination to the current report date. 12
Daily Pipeline Status As of 23:
 SPEED READ Loads on wheels increased slightly in the last 24 hours reflecting nominal changes on each railway with CN slightly lower and CP slightly higher. Volumes are up slightly in the Prince Rupert
Monitoring the Canadian Grain Handling and Transportation System. Annual Report Crop Year. Data Tables
 Monitoring the Canadian Grain Handling and Transportation System Annual Report 2008-2009 Crop Year 2 Data Tables Government of Canada Gouvernement du Canada Data Tables PREFACE The material presented in
Government of Canada Hopper Car Fleet 2011 Annual Report
 Government of Canada Hopper Car Fleet 2011 Annual Report Prairie and Northern Region TP 14995E Her Majesty the Queen in Right of Canada, represented by the Minister of Transport, the Honourable Denis Lebel
Government of Canada Hopper Car Fleet
 Government of Canada Hopper Car Fleet 2010 Annual Report Prairie and Northern Region TP 14995E Her Majesty the Queen in Right of Canada, represented by the Minister of Transport, the Honourable Denis Lebel
Canola Weekly. Index. WCE May/07 Canola Jul 9-Aug 14-Sep 20-Oct 27-Nov 4-Jan 8-Feb 16-Mar
 March 2, 2 Canola Weekly Index ) Canola Steady Despite Weak Soy Complex 2) Slow Crush Improves Canola Oil Basis ) Export Demand Underpins Canola Last week, we mentioned that May canola had key support
CN in Your Community British Columbia Photo: Squamish, 1BC
 CN in Your Community British Columbia 2018 Photo: Squamish, 1BC CN in Numbers Global West 24% Domestic Canada 18% Global East 4% Transborder 33% Well Diversified Portfolio Intermodal 24% Petroleum and
Into (and Out of?) the Valley
 the Valley") Into (and Out of?) the Valley Rail Traffic Trends in the 2010s Michael W. Blaszak Overall Trends U.S. Overall Trends U.S. Gross Domestic Product U.S. Source: https://fred.stlouisfed.org/series/gdp#0 Overall
Into (and Out of?) the Valley Rail Traffic Trends in the 2010s Michael W. Blaszak Overall Trends U.S. Overall Trends U.S. Gross Domestic Product U.S. Source: https://fred.stlouisfed.org/series/gdp#0 Overall
G o v e r n m e n t o f C a n ada Hopper Car Fleet
 G o v e r n m e n t o f C a n ada Hopper Car Fleet Annual Report Prairie and Northern Region TP 14995E Government of Canada Hopper Car Fleet Annual Report 1 Gover nment of Canada Hopper Car Fleet Annual
Fuel Focus. Understanding Gasoline Markets in Canada and Economic Drivers Influencing Prices. Issue 24, Volume 8
 Fuel Focus Understanding Gasoline Markets in Canada and Economic Drivers Influencing Prices Issue 24, Volume 8 December, Copies of this publication may be obtained free of charge from: Natural Resources
Canadian Pacific Railway: Addressing Climate Change. UN Conference on Climate Change (COP 11) December 3, 2005
 December 3, 2005") Canadian Pacific Railway: Addressing Climate Change UN Conference on Climate Change (COP 11) December 3, 2005 CPR Network Canadian Pacific Railway Limited operates a transcontinental railway in Canada
Canadian Pacific Railway: Addressing Climate Change UN Conference on Climate Change (COP 11) December 3, 2005 CPR Network Canadian Pacific Railway Limited operates a transcontinental railway in Canada
Facility Management Webinar
 www.cn.ca Facility Management Webinar Dial In Number 866 305 1459 Pass Code 3610198# 1 Questions during presentation Phones are in listen only mode Use Chat to ask questions Keep your questions generic
The Boston South Station HSIPR Expansion Project Cost-Benefit Analysis. High Speed Intercity Passenger Rail Technical Appendix
 The Boston South Station HSIPR Expansion Project Cost-Benefit Analysis High Speed Intercity Passenger Rail Technical Appendix Prepared by HDR August 5, 2010 The Boston South Station HSIPR Expansion Project
Introduction: Supplied to 360 Test Labs... Battery packs as follows:
 2007 Introduction: 360 Test Labs has been retained to measure the lifetime of four different types of battery packs when connected to a typical LCD Point-Of-Purchase display (e.g., 5.5 with cycling LED
Clean Harbors Canada, Inc.
 Clean Harbors Canada, Inc. Proposed Lambton Landfill Expansion Environmental Assessment Terms of Reference Transportation Assessment St. Clair Township, Ontario September 2009 itrans Consulting Inc. 260
Empire State Manufacturing Survey.
 Month March 18 19 Business activity grew only slightly in New York State, according to firms responding to the March 19. The headline general business conditions index fell five points to 3.7. New orders
Fuel Focus. National Overview. Recent Developments. In this Issue. Volume 11, Issue 13 June 24, 2016 ISSN
 National Overview Fuel Focus Canadian Retail Gasoline Prices Remained the Same over the Last Two Weeks For the two-week period ending June 21, 16, the Canadian average retail gasoline price was $1.1 per
RAILWAY INVESTIGATION REPORT R00W0106 MAIN TRACK DERAILMENT
 RAILWAY INVESTIGATION REPORT R00W0106 MAIN TRACK DERAILMENT CANADIAN NATIONAL FREIGHT TRAIN NO. E20531-15 MILE 154.4, REDDITT SUBDIVISION WHITE, ONTARIO 16 MAY 2000 The Transportation Safety Board of Canada
Sound Transit Operations July 2016 Service Performance Report. Ridership
 Ridership Total Boardings by Mode Mode Jul-15 Jul-16 % YTD-15 YTD-16 % ST Express 1,618,779 1,545,852-4.5% 10,803,486 10,774,063-0.3% Sounder 333,000 323,233-2.9% 2,176,914 2,423,058 11.3% Tacoma Link
In this report, last week multiple commodities came down in price while parts of Wall Street hit new all-time highs.
 This is the Scrap Metal & Commodities Recycling report, by BENLEE Roll off, Lugger and Open Top Trailers and Raleigh and Goldsboro Metal Recycling Monday August 8th, 2016. In this report, last week multiple
U.S. Rail Traffic 1. Week 18, 2018 Ended May 5, 2018
 U.S. Rail Traffic 1 265,563 6.4% 4,612,788 256,266 0.9% 33,807 9.5% 583,320 32,407 3.6% 77,468 5.5% 1,483,363 82,409 0.4% Farm Products excl., and Food 16,952 8.3% 290,667 16,148 0.6% 10,407 4.6% 181,165
U.S. Rail Traffic 1. Week 17, 2018 Ended April 28, 2018
 U.S. Rail Traffic 1 266,453 3.7% 4,347,225 255,719 0.6% 32,916 3.4% 549,513 32,324 3.2% 78,970 4.2% 1,405,895 82,700 0.1% Farm Products excl., and Food 16,221 4.5% 273,715 16,101 0.1% 10,563 4.7% 170,758
U.S. Rail Traffic 1. Week 26, 2018 Ended June 30, 2018
 U.S. Rail Traffic 1 270,916 0.7% 6,747,414 259,516 1.3% 33,563 5.5% 841,770 32,376 3.8% 83,214-5.3% 2,141,239 82,355-0.1% Farm Products excl., and Food 16,316 2.1% 421,097 16,196 1.3% 11,027 1.8% 265,428
U.S. Rail Traffic 1. Week 24, 2018 Ended June 16, 2018
 U.S. Rail Traffic 1 269,748 1.9% 6,208,034 258,668 1.3% 31,707 1.5% 775,785 32,324 3.7% 85,538-1.6% 1,975,019 82,292 0.3% Farm Products excl., and Food 16,717 6.2% 388,721 16,197 1.3% 10,837 7.4% 244,234
U.S. Rail Traffic 1. Week 27, 2018 Ended July 7, 2018
 U.S. Rail Traffic 1 240,514 5.4% 6,987,928 258,812 1.4% 30,160 3.2% 871,930 32,294 3.8% 76,562-0.5% 2,217,801 82,141-0.1% Farm Products excl., and Food 15,124 10.0% 436,221 16,156 1.5% 10,017 7.2% 275,445
U.S. Rail Traffic 1. Week 42, 2018 Ended October 20, 2018
 U.S. Rail Traffic 1 265,776-0.7% 11,047,756 263,042 1.8% 30,761-0.2% 1,352,962 32,213 4.1% 85,929-0.4% 3,546,082 84,431-0.9% Farm Products excl., and Food 16,808-4.1% 681,566 16,228 2.4% 9,845 2.3% 432,578
U.S. Rail Traffic 1. Week 39, 2018 Ended September 29, 2018
 U.S. Rail Traffic 1 272,306 0.5% 10,248,559 262,784 2.0% 33,047 4.4% 1,260,433 32,319 4.5% 89,445 1.5% 3,284,902 84,228-1.0% Farm Products excl., and Food 16,942 2.8% 631,634 16,196 2.7% 10,721-2.9% 402,632
U.S. Rail Traffic 1. Week 44, 2018 Ended November 3, 2018
 U.S. Rail Traffic 1 270,305 1.8% 11,586,596 263,332 1.9% 32,209 2.2% 1,416,860 32,201 4.1% 88,399 1.6% 3,722,456 84,601-0.7% Farm Products excl., and Food 17,133 2.8% 715,329 16,257 2.3% 10,357 3.2% 453,424
U.S. Rail Traffic 1. Week 41, 2018 Ended October 13, 2018
 U.S. Rail Traffic 1 263,787 10,781,980 262,975 1.9% 30,416-1.7% 1,322,201 32,249 4.2% 86,312 0.2% 3,460,153 84,394-0.9% Farm Products excl., and Food 16,355 664,758 16,214 2.5% 9,927-0.3% 422,733 10,311
U.S. Rail Traffic 1. Week 46, 2018 Ended November 17, 2018
 U.S. Rail Traffic 1 262,514-1.1% 12,110,985 263,282 1.8% 31,796-0.4% 1,480,087 32,176 4.0% 86,159-0.2% 3,893,147 84,634-0.7% Farm Products excl., and Food 16,141-3.7% 747,905 16,259 2.1% 9,541-5.4% 473,048
U.S. Rail Traffic 1. Week 45, 2018 Ended November 10, 2018
 U.S. Rail Traffic 1 261,875 0.1% 11,848,471 263,299 1.8% 31,431 1,448,291 32,184 4.1% 84,532-0.7% 3,806,988 84,600-0.7% Farm Products excl., and Food 16,435-1.3% 731,764 16,261 2.3% 10,083 2.5% 463,507
BUSINESS AND CONSUMER SURVEY RESULTS
 May 2018 BUSINESS AND CONSUMER SURVEY RESULTS 120 Graph 1: Economic sentiment indicator (s.a.) 110 100 90 80 70 60 long-term av erage (1990-2017) = 100 1994 1996 1998 2000 2002 2004 2006 2008 2010 2012
Aging of the light vehicle fleet May 2011
 Aging of the light vehicle fleet May 211 1 The Scope At an average age of 12.7 years in 21, New Zealand has one of the oldest light vehicle fleets in the developed world. This report looks at some of the
Western ND Meeting. February 19, 2014 Grant Levi, NDDOT Director
 Western ND Meeting February 19, 2014 Grant Levi, NDDOT Director 1 Traffic Trends in North Dakota 2 Truck Traffic 2008 3 Truck Traffic 2012 4 Average Daily Traffic 5 ND Vehicle Miles Traveled Statewide
Market Report. Grain HIGHLIGHTS INTERNATIONAL GRAINS COUNCIL. WORLD ESTIMATES. GMR November 2018
 Grain INTERNATIONAL GRAINS COUNCIL www.igc.int Market Report GMR 494 22 November 2018 HIGHLIGHTS With small adjustments for wheat, maize and sorghum, the forecast for world total grains (wheat and coarse
Saft Groupe SA reports Quarterly Financial Information for the third quarter of 2007
 N 61-07 Saft Groupe SA reports Quarterly Financial Information for the third quarter of 2007 Paris, 9 th November 2007 - Saft, leader in the design, development and manufacture of high-end batteries for
Service Quality: Higher Ridership: Very Affordable: Image:
 Over the past decade, much attention has been placed on the development of Bus Rapid Transit (BRT) systems. These systems provide rail-like service, but with buses, and are typically less expensive to
REPORT N O AMBIENT AIR QUALITY MONTHLY REPORT MAY 2017
 REPORT N O 171-00556-00 AMBIENT AIR QUALITY MONTHLY REPORT MAY 2017 MAY 2017 AMBIENT AIR QUALITY MONTHLY REPORT MAY 2017 Lafarge Canada Inc. Project no: 171-00556-00 Date: May 2017 WSP Canada Inc. 150-12791
Air Brake Tests and Procedures TABLE OF CONTENTS
 General Operating Instructions (GOI) Section Air Brake Tests and Procedures TABLE OF CONTENTS 1.0 General...160 2.0 Locomotive Brake Test...161 3.0 RSC (Safety Control System)...162 4.0 Locomotive and
Transport Group Perspective Chris Blow Chair of The Guildford Society Transport Group 21st Jan 2015
 Transport Group Perspective Chris Blow Chair of The Guildford Society Transport Group 21st Jan 2015 LET'S REMEMBER THAT THIS IS NOT A STATION REDEVELOPMENT BUT A STATION SITE REDEVELOPMENT. The big question:
East Stockton Boulevard (South Sacramento) Costco Gasoline Expansion Fuel Station Expansion Trip Generation Estimate
 Costco Gasoline Expansion Fuel Station Expansion Trip Generation Estimate") MEMORANDUM Date: February 7, 2013 Project #: 13270.0 To: From: Matt Cyr, Barghausen Consulting Engineers Sonia Hennum, PTOE & Alex Kiheri Project: Subject: cc: East Stockton Boulevard (South Sacramento)
MEMORANDUM Date: February 7, 2013 Project #: 13270.0 To: From: Matt Cyr, Barghausen Consulting Engineers Sonia Hennum, PTOE & Alex Kiheri Project: Subject: cc: East Stockton Boulevard (South Sacramento)
Prices indeed dropped on Thursday, aided by a surprise increase in crude oil supplies caused by stronger imports.
 Trump s war on OPEC Farm fuel prices resist President s attempt to jawbone cartel By Bryce Knorr, senior grain market analyst For a day or two, at least, it looked like President Trump s attempt to tweet
BUSINESS AND CONSUMER SURVEY RESULTS. September 2018: Economic Sentiment decreases in both the euro area and the EU
 September 2018 BUSINESS AND CONSUMER SURVEY RESULTS 120 Graph 1: Economic sentiment indicator (s.a.) 110 100 90 80 70 60 long-term av erage (1990-2017) = 100 1994 1996 1998 2000 2002 2004 2006 2008 2010
New West Partnership Deliverables July 2011/2012 Reporting
 Area 1 - Vehicle Weights and Dimensions Steering Axle Weight Limits July 2011 Changes to vehicle design and It is Alberta s position, jointly agreed upon by other New West additional required equipment
Diesel prices finally ease Winter weather and international events could determine your fuel bill for 2018 By Bryce Knorr, senior grain market analyst
 Diesel prices finally ease Winter weather and international events could determine your fuel bill for 2018 By Bryce Knorr, senior grain market analyst After rallying to their highest level in nearly three
May 8th Feel free to call us for live up to date market pricing.
 May 8th - 2018 The economy continues to hum. Everything looks good for rail, with some challenges. The U.S. unemployment rate is at its lowest level in 18 years at 3.9%. The labor market is tight for skilled
REPORT N O AMBIENT AIR QUALITY MONTHLY REPORT JUNE 2017
 REPORT N O 171-00556-00 AMBIENT AIR QUALITY MONTHLY REPORT JUNE 2017 JUNE 2017 AMBIENT AIR QUALITY MONTHLY REPORT JUNE 2017 Lafarge Canada Inc. Project no: 171-00556-00 Date: June 2017 WSP Canada Inc.
PRESS RELEASE 13:30 BST, 27 th February 2019 London, UK
 PRESS RELEASE 13:30 BST, 27 th February 2019 London, UK EUROPEAN CAR MARKET SEES FIFTH CONSECUTIVE MONTH OF DECLINE IN JANUARY 2019, BUT STILL RECORDS SECOND HIGHEST JANUARY VOLUME OF THE LAST 10 YEARS
AMAG posts record shipments in 2013; dividend recommendation of 0.60 EUR per share unchanged on last year
 Ranshofen, 28 February 2014 AMAG posts record shipments in 2013; dividend recommendation of 0.60 EUR per share unchanged on last year Shipments at an all-time high of 351,700 tonnes (t) in 2013, compared
Date: February 7, 2017 John Doyle, Z-Best Products Robert Del Rio. T.E. Z-Best Traffic Operations and Site Access Analysis
 Memorandum Date: February 7, 07 To: From: Subject: John Doyle, Z-Best Products Robert Del Rio. T.E. Z-Best Traffic Operations and Site Access Analysis Introduction Hexagon Transportation Consultants, Inc.
Fuel Focus. Understanding Gasoline Markets in Canada and Economic Drivers Influencing Prices. Volume 10, Issue 4
 Fuel Focus Understanding Gasoline Markets in Canada and Economic Drivers Influencing Prices Volume 1, Issue 4 March, Copies of this publication may be obtained free of charge from: Natural Resources Canada
Commercial Vehicle Drivers Hours of Service. Module 10. Special Permit - Oil Well Service Vehicle Permits. Microsoft.
 Module 10 Special Permit - Oil Well Service Vehicle Permits Microsoft. June 23, 2008 Microsoft. Things to think about Drivers of oil well service vehicles operate within a challenging environment that
Re: 233 Armstrong Street Residential Condominium Traffic Brief
 1223 Michael Street, Suite 100, Ottawa, ON K1J 7T2 Tel: 613.738.4160 Fax: 613.739.7105 www.delcan.com August 8, 2008 TO3031TOP00 BY E-MAIL: gerry.lalonde@rogers.com Spencedale Properties 7 Cobb Court Ottawa,
IRSCH REEN Hirsch/Green Transportation Consulting, Inc.
 IRSCH REEN Hirsch/Green Transportation Consulting, Inc. February 6, 2013 Mr. David Weil Director of Finance St. Matthew s Parish School 1031 Bienveneda Avenue Pacific Palisades, California 90272 RE: Trip
AMSTAT Global Business Aircraft Resale Market Update NBAA BACE 2017
 AMSTAT Global Business Aircraft Resale Market Update NBAA BACE 217 1/4/217 AMSTAT will be exhibiting at NBAA BACE 217 Booth #N171 (US) 877 426 7828 / (Int l) 732 53 64 / sales@amstatcorp.com A Review by
GROWTH IN TENTH DISTRICT MANUFACTURING ACTIVITY EDGED HIGHER Federal Reserve Bank of Kansas City Releases September Manufacturing Survey
 FOR RELEASE Thursday, September 25, 2014 EMBARGOED FOR 10 A.M. CENTRAL TIME CONTACT: Pam Campbell 405-270-8617 Pam.Campbell@kc.frb.org GROWTH IN TENTH DISTRICT MANUFACTURING ACTIVITY EDGED HIGHER Federal
BNSF 2185, an END GP 38, was doing flat switching in the Yard during our visit.
 A VISIT TO BNSF HAVRE MONTANA YARD by Charles H. Bogart In our drive across Montana, one of the places we wanted to stay overnight at was Havre, Montana. Havre is home to a major BN-SF Yard, locomotive
Ambient PM 10 Monitoring Sechelt, B.C Update
 Ministry of Environment LOWER MAINLAND REGION Ambient PM 10 Monitoring Sechelt, B.C. 2004-2005 Update E N V I R O N M E N T A L Q U A L I T Y Library and Archives Canada Cataloguing in Publication Data
THE GREAT PROVINCIAL OBSTACLE COURSE
 PRO LOG CANADA THE GREAT PROVINCIAL OBSTACLE COURSE GOODS AND SERVICES WE CAN T SELL TO OURSELVES A CLOSE LOOK AT THE ENERGY AND TRANSPORTATION SECTORS THE GREAT PROVINCIAL OBSTACLE COURSE The BNA Act
Petroleum Product Market Outlook. Oil Division Natural Resources Canada
 Petroleum Product Market Outlook Oil Division Natural Resources Canada May 2007 The petroleum product supply available to consumers in Canada is determined mainly by domestic refinery production, inventories,
WIM #31 US 2, MP 8.0 EAST GRAND FORKS, MN JANUARY 2015 MONTHLY REPORT
 WIM #31 US 2, MP 8.0 EAST GRAND FORKS, MN JANUARY 2015 MONTHLY REPORT WIM #31 EAST GRAND FORKS MONTHLY REPORT - JANUARY 2015 WIM Site Location WIM #31 is located on US 2 at mile post 8.0, southeast of
Valeo reports 14% growth in consolidated sales for third quarter 2011
 24.11 Valeo reports 14 growth in consolidated sales for third quarter 2011 Third quarter 2011-14 growth in consolidated sales (12 on a like-for-like basis 1 ) to 2,662 million euros - 17 growth in original
HOUSING REPORT NORTHWEST MICHIGAN YEAR END 2018
 NORTHWEST MICHIGAN Northwest Michigan 218 Highlights Waterfront Non-Waterfront : dropped 2% from last year to the lowest level in the past 4 years : had a slight decline of 3% from the prior year. Average
Greater Toronto Area Industrial Market Report $ % $ msf. 4 th Quarter Partnership. Performance. MARKE T FAC TS.
 Greater Toronto Area Industrial Report th Quarter 1 Overview GTA Central GTA East GTA Nor th GTA West The Greater Toronto Area (GTA), Canada s largest (and North America s third largest) industrial market,
Start covering fall fuel needs OPEC unity stabilizes oil market for now By Bryce Knorr, senior grain market analyst
 Start covering fall fuel needs OPEC unity stabilizes oil market for now By Bryce Knorr, senior grain market analyst OPEC and its allies are a strange bunch. Iran hates Saudi Arabia as much as it dislikes
New Insights into Natural Aeration Grain Drying
 New Insights into Natural Aeration Grain Drying IHARF UPDATE Melville Horizon Conexus Union Center. Wednesday Feb 6, 2013 2:45 Ron Palmer P.Eng. Ph.D. Indian Head Agricultural Research Foundation Bin #9
Development of the Preferred Option and Implementation Plan
 Presentation To RMRA Peer Panel Day #1 Preferred Option and Risk Assessment August 25, 2009 TEMS, Inc. / Quandel Consultants, LLC 0 Development of the Preferred Option and Implementation Plan 1 1 Results
I m Tetsuji Yamanishi, Corporate Officer at TDK. Thank you for taking the time to attend TDK s performance briefing for the fiscal year ended March
 I m Tetsuji Yamanishi, Corporate Officer at TDK. Thank you for taking the time to attend TDK s performance briefing for the fiscal year ended March 2016. I will be presenting an overview of our consolidated
Basis gains despite transport woes Floods shut river system while congestion snarls rail traffic to Mexico By Bryce Knorr
 Basis gains despite transport woes Floods shut river system while congestion snarls rail traffic to Mexico By Bryce Knorr Transportation problems at harvest are nothing new for farmers, but when they occur
CN is offering our Fleet Integration Program for grain shippers who are using privately owned, covered hopper cars for
 US Covered Hopper Fleet Integration Program CN is offering our Fleet Integration Program for grain shippers who are using privately owned, covered hopper cars for their shipments. The objectives of this
Vehicle Replacement Policy - Toronto Police Service
 STAFF REPORT June 21, 2000 To: From: Subject: Policy and Finance Committee Chairman, Toronto Police Services Board and City Auditor Vehicle Replacement Policy - Toronto Police Service Purpose: The purpose
ALG July/August 2011 Edition Report
 ALG July/August 2011 Edition Report ALG July/August 2011 Edition Report Introduction: For the July/August 2011 edition, ALG has updated both gas price and used supply outlook to reflect the latest available
2010 Motorcycle Risk Study Update
 2010 Motorcycle Risk Study Update Introduction This report provides an update to the Motorcycle Risk Study from AI.16 of the 2005 Rate Application. The original study was in response to Public Utilities
DECEMBER 12, Parking Meter and Time Limit Preliminary Evaluation
 Parking Meter and Time Limit Preliminary Evaluation / PAGE 2 Executive Summary The following report evaluates the effects of new SFpark parking meters and extended time limits on meter revenue and parking
PUBLICATION NEW TRENDS IN ELEVATORING SOLUTIONS FOR MEDIUM TO MEDIUM-HIGH BUILDINGS TO IMPROVE FLEXIBILITY
 PUBLICATION NEW TRENDS IN ELEVATORING SOLUTIONS FOR MEDIUM TO MEDIUM-HIGH BUILDINGS TO IMPROVE FLEXIBILITY Johannes de Jong E-mail: johannes.de.jong@kone.com Marja-Liisa Siikonen E-mail: marja-liisa.siikonen@kone.com
APPENDIX B. Origin Destination Study Data
 APPENDIX B Origin Destination Study Data - TABLE OF CONTENTS - Page No. EXECUTIVE SUMMARY... 1 Map of the Study area with Site Locations... 2 Summary Table of Results for the TH 14 Corridor Study... 3
Hello, I m Tetsuji Yamanishi, Senior Vice President of TDK. Thank you for taking the time to attend TDK s performance briefing for the first half
 Hello, I m Tetsuji Yamanishi, Senior Vice President of TDK. Thank you for taking the time to attend TDK s performance briefing for the first half (April to September) of the fiscal year ending March 2019.
Results from the Auto Laundry News. Detailing Survey
 Detail Survey Cover:Detail Survey Cover T H E V O I C E 12/19/12 O F 12:23 PM T H E Page 27 C A R C A R E I N D U S T R Y Results from the Auto Laundry News 2013 Detailing Survey Results From The Auto
National Safety Code. SAFE Companies Revised 2010 Audits. Regulations for Light Truck Carriers
 National Safety Code SAFE Companies Revised 2010 Audits Regulations for Light Truck Carriers Introduction The intent of this information is to give Light Truck Carriers explanation on the National Safety
Analysis of Radial and Trunk Feeder Transit System Configurations in Downtown Charlottesville
 Analysis of Radial and Trunk Feeder Transit System Configurations in Downtown Charlottesville 1. Introduction During the stakeholder input sessions of Charlottesville Area Transit s (CAT) Transit Development
Post Opening Project Evaluation. M6 Toll
 M6 Toll Five Post Years Opening After Study: Project Summary Evaluation Report Post Opening Project Evaluation M6 Toll Five Years After Study Summary Report October 2009 Document History JOB NUMBER: 5081587/905
PETROLEUM EMISSIONS DOWN JUST 1.3 PER CENT REPORT SYNOPSIS - PAGE TWO
 Embargoed 00:01-4 December 2009 PETROLEUM EMISSIONS DOWN JUST 1.3 PER CENT REPORT SYNOPSIS - PAGE TWO Greenhouse gas emissions from Australian petroleum use fell by 1.6 million tonnes or 1.3 per cent over
For personal use only
 Limited ACN 141 075 201 International Limited EC43828 Level 7, 50 Martin Place SYDNEY NSW 2000 GPO Box 4294 SYDNEY NSW 1164 AUSTRALIA Telephone 612 8232 3333 Facsimile 612 8232 4713 Internet www.macquarie.com/mqa
Traffic Engineering Study
 Traffic Engineering Study Bellaire Boulevard Prepared For: International Management District Technical Services, Inc. Texas Registered Engineering Firm F-3580 November 2009 Executive Summary has been requested
AMBIENT AIR QUALITY MONTHLY REPORT
 REPORT N O 171-00556-00 AMBIENT AIR QUALITY MONTHLY REPORT DECEMBER 2017 DECEMBER 2017 AMBIENT AIR QUALITY MONTHLY REPORT DECEMBER 2017 Lafarge Canada Inc. Project no: 171-00556-00 Date: December 2017
2014 Specialty Crop Report
 2014 Specialty Crop Report 2016 Lentil Lentil production in Canada reached a record high in 2016, at 3.2 million, up 28 per cent from the previous year. The increase in lentil production was the result
SECTION M: Agriculture
 SECTION M: Agriculture G.I. Trant, Agriculture Canada The statistics of agriculture presented here are in five sections. Series Ml-248 are the general statistics of the industry, covering such topics as
Chapter 1: Overview of Industry
 Chapter 1: Overview of Industry A macro overview of a company's industry and the economy are critical starting points for any valuation analysis. In many cases, the industry trends are better indications
PT Astra International Tbk 2014 Third Quarter Financial Statements
 To: Business Editor 30th October 2014 For immediate release PT Astra International Tbk 2014 Third Quarter Financial Statements The following announcement was issued today by the Company s 74%-owned subsidiary,
Downtown Lee s Summit Parking Study
 Downtown Lee s Summit Parking Study As part of the Downtown Lee s Summit Master Plan, a downtown parking and traffic study was completed by TranSystems Corporation in November 2003. The parking analysis
PARKING OCCUPANCY IN WINDSOR CENTER
 PARKING OCCUPANCY IN WINDSOR CENTER TOWN OF WINDSOR, CONNECTICUT REPORT JUNE 2017 CONTENTS Background... 3 Other Relevant Data... 3 Parking Survey Design... 6 Parking Supply Inventory... 6 Parking Demand
Atlas Arteria. TOLL REVENUE AND TRAFFIC STATISTICS AND APRR / AREA UPDATE 3 rd Quarter 2018
 23 October ASX RELEASE Atlas Arteria TOLL REVENUE AND TRAFFIC STATISTICS AND APRR / AREA UPDATE 3 rd Quarter Toll Revenue and Traffic Statistics Atlas Arteria (ALX) today released its September quarter
Traffic Impact Analysis Walden Lake Plant City, Florida
 Traffic Impact nalysis Plant ity, Florida Final Summary Report January 2015 Prepared by: 18115 U.S. Highway 41, Suite 600 Lutz, Florida 33549 ertificate of uthorization # 4548 Traffic Impact nalysis 2
October 15, The Honorable John F. Kerry Secretary of State. Dear Secretary Kerry:
 October 15, 2014 The Honorable John F. Kerry Secretary of State Dear Secretary Kerry: I am writing concerning a State Department contract to purchase three mobile television production trucks for donation
Inbound Tourism Trends Quarterly Q Issue 20 January 2017
 Inbound Tourism Trends Quarterly Q3 216 Issue 2 January 217 1 Contents 1. About this data 2. Global Context: Global view, Economic outlook and Exchange rate 3. Inbound Volume and Value 4. Journey Purpose,
CITY OF VANCOUVER ADMINISTRATIVE REPORT
 Supports Item No. 1 T&T Committee Agenda May 13, 2008 CITY OF VANCOUVER ADMINISTRATIVE REPORT Report Date: April 29, 2008 Author: Don Klimchuk Phone No.: 604.873.7345 RTS No.: 07283 VanRIMS No.: 13-1400-10
TRANSPACIFIC CUSTOMER ADVISORY Implementation of New BAF Formula Effective January 01, 2019
 December 7, 2018 TRANSPACIFIC CUSTOMER ADVISORY Implementation of New BAF Formula Effective January 01, 2019 Dear Valued Customer, Bunker is one of the important cost components for a container shipping
1 On Time Performance
 MEMORANDUM: US 29 Travel Time & OTP To: From: Joana Conklin, Montgomery County DOT James A. Bunch, SWAI Subject: US 29 Travel Time and On Time Performance Analysis Date: This memorandum documents the US
Modernising the Great Western railway
 Report by the Comptroller and Auditor General Department for Transport and Network Rail Modernising the Great Western railway HC 781 SESSION 2016-17 9 NOVEMBER 2016 4 Key facts Modernising the Great Western
Technical Memorandum. Purpose of Report and Study Objectives. Summary of Results
 Technical Memorandum To: Derek Leuer, MnDOT Traffic Safety Engineer From: Max Moreland, P.E. and Bryant Ficek, P.E., P.T.O.E. Date: February 17, 217 Re: Median Acceleration Lane Usage Purpose of Report
Technical Service Bulletin
 Number 02-36-030 Subject OBD-II READINESS TEST DRIVE CYCLE FOR 1996-1998 SONATA Date Model DECEMBER, 2002 1996-1998 SONATA DESCRIPTION: This TSB describes Drive Cycles which may assist the vehicle s OBD-II