Annual Oil Questionnaire Overview. Joint IEA, ESCWA and RCREEE National Workshop on Energy Statistics Cairo, Egypt 27 April 01 May 2014
|
|
|
- Lindsey Gray
- 5 years ago
- Views:
Transcription


1 Annual Oil Questionnaire Overview Joint IEA, ESCWA and RCREEE National Workshop on Energy Statistics Cairo, Egypt 27 April 01 May 2014
2 Annual Oil Questionnaire Why are oil statistics important? The IEA/Eurostat/UNECE oil questionnaire Data dissemination

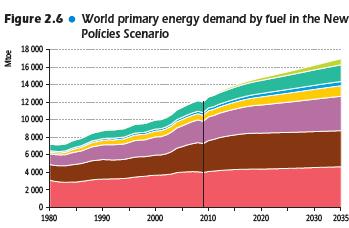
3 World Total Primary Energy Supply **Other includes geothermal, solar, wind, heat, etc The share of oil in energy supply may be decreasing but it is still the largest.

4 OECD oil use in different sectors Transport sector demand increased significantly.

5 Oil Demand: OECD vs. Non-OECD The Non-OECD oil demand as percentage of total demand increased.


6 Good oil statistics: essential for accurate forecasts & analysis
7 Annual Oil Questionnaire Why are oil statistics important? The IEA/Eurostat/UNECE oil questionnaire Data dissemination
8 How does IEA collect oil statistics?


9 OECD & Non-OECD countries World Data OECD Non- OECD National Statistics Office OECD Petroleum Companies National Statistics 34 countries Energy Ministries

10 Oil Questionnaire has 8 tables Oil Questionnaire Supply of crude oil, NGL and others Supply of oil products Deliveries by sector Trade Energy Of which: use non-energy use Imports Non-energy use Exports
11 Questionnaire Structure Table 1 Table 2A Table 3 Supply of crude, NGL & Others Supply of finished products Deliveries by sector
12 Crude, NGL & Feedstocks Flows From Other Sources Exports Direct Use Stock Change Production Refinery Imports Backflows from Petrochemical Industry Products Transferred
13 Supply of finished products Table 2A Supply of finished products
14 Supply of finished products IEA data collection Refinery Gas Ethane LPG Naphtha Motor Gasoline Aviation Gasoline Gasoline Type Jet Fuel Kerosene Type Jet Fuel Other Kerosene Gas/Diesel Oil Fuel Oil White Spirit and SBP Lubricants Bitumen Paraffin Waxes Petroleum Coke Other Oil Products Lighter molecules Low Sulphur Fuel Oil High Sulphur Fuel Oil Heavier molecules
15 Oil Product Flow Chart Refinery Fuel International Marine Bunkers Exports Products Transferred Gross Output Inland Deliveries Refinery Crude Oil Primary Products Receipts Recycled Products Imports Interproduct Transfers Stock Change


16 Deliveries by Sector Table 3 Deliveries by sector

17 Table 3: Gross Deliveries by Sector Transformation Electricity Heat Other Transformation e.g. GTL Energy Sector Energy Sector Industries e.g. Oil & Gas Extraction Aviation Inland Deliveries Final Consumption Transport Road Rail Navigation Iron and Steel Industry Chemical/Petrochem. Construction Non-metallic minerals 13 other subsectors Other Residential Commercial Agriculture Fishing
18 Imports and Exports Table More than 100 Import origins and 100 Export destinations Physical flow (not customs flows) Crude Oil, NGL: country of origin Oil products: country of last consignment Transit trade not included
19 Annual Oil Questionnaire Why are oil statistics important? The IEA/Eurostat/UNECE oil questionnaire Data dissemination


20 Accessing Data Online Data Service Books


21 Accessing Data


22 Other IEA publications with oil data
23 Thank you
 Units 2) Tables 3) Checks +")
24 Exercise Preparation Filling in the oil questionnaire 1) Units 2) Tables 3) Checks + Technical bonus
25 1) Convert all the data in the same unit From barrels to kilo tonnes? Ask the industry for the number of barrels per ton Ex: barrels /7.3 bbl/t = t = 10kt From litres to barrels 1 barrel= 159 litres Divide by 159 Ex: litres /159 = barrels
26 2) Compile the data in a simple format Primary Oil Products Ex: Crude oil REFINERY Secondary Oil Products Ex: Diesel Table 1 Table 2a Table 3
27 Refining basics Input Output Refinery Fuel
28 Table 1 Where does the refinery intake come from? Crude Oil Indigenous production (+) 1 1,000 Receipts from other sources (+) 2 Backflows (+) 3 Products transferred (+) 4 Imports (Balance) (+) 5 0 Exports (Balance) (-) 6 0 Direct Use (-) 7 0 Stock changes (+) 8 0 Refinery intake (Calculated) (=) 9 1,000 Statistical difference (-) 10-1 Refinery intake (Observed) (=) 11 1,
29 Table 2a: Where do the oil products delivered to consumers come from? Gas/Diesel Primary product receipts (+) 1 0 Refinery gross output (+) Recycled products (+) 3 0 Refinery fuel (-) 4 0 Imports (Balance) (+) 5 4 Exports (Balance) (-) 6 0 International marine bunkers (-) 7 0 Interproduct transfers (+) 8 0 Products transferred (-) 9 0 Stock changes (+) 10 0 Gross inland deliveries (Calculated) (=) Statistical difference (-) 12 0 Gross inland deliveries (Observed) (=)
30 Table 3a and 3b Who consumes the oil products? Energy use Non-energy use Table 3a Table 3b Table3 Total gas/diesel oil Inland Demand (Total Consumption) Transformation Sector 2 0 Energy Sector 16 0 Total Final Consumption Transport Sector 26 0 Industry Sector Iron and steel 35 0 Chemical (incl.petrochemical) Other Sectors 48 0
31 Tables 3a and 3b Who consumes the oil products? 3a - energy Total gas/diesel oil Inland Demand (Total Consumption) Transformation Sector 2 0 Energy Sector 16 0 Total Final Consumption Transport Sector 26 0 Industry Sector Iron and steel 35 0 Chemical (incl.petrochemical) Other Sectors b non-energy Total gas/diesel oil Inland Demand (Total Consumption) Transformation Sector 2 0 Energy Sector 16 0 Total Final Consumption Transport Sector 26 0 Industry Sector Iron and steel 35 0 Chemical (incl.petrochemical) Other Sectors 48 0 Table 3 Total gas/diesel oil Inland Demand (Total Consumption) Transformation Sector 2 0 Energy Sector 16 0 Total Final Consumption Transport Sector 26 0 Industry Sector Iron and steel 35 0 Chemical (incl.petrochemical) Other Sectors a+3b=Table3
32 3) Double check the data Two major checks Is there a statistical difference? Statistical difference = Demand Supply What are the refinery losses? Refinery losses = Refinery Output Refinery input Statistical difference/supply<1% Refinery losses <0 or over 5% of refinery input
33 Automatic consistency checks DATA ENTRY MENU Control the integrity and coherence of your entries: Run the "Check data" program. Message Stock Change should = Opening Stock - Closing Stock Total Imports (Row 14) should = Total Imports (Row 101) Crude Oil Total Imports (Balance) (+) Total Exports (Balance) (-) 6 0 Direct Use (-) 7 0 Stock Changes (National Territory) (+) 8 5 No data on imports by Origin in table 4 MEMO ITEMS: Refinery Losses 12 0 STOCK LEVELS: Opening Stock Level (National Territory) Closing Stock Level (National Territory) Stock change =
34 Resources and contacts
Annual Oil Statistics
 Annual Oil Statistics Oil Questionnaire Overview Energy Statistics Training International Energy Agency Ana-Luisa Sao Marcos Annual Oil Statistician Share of oil in Total Primary Energy Supply share of
The Oil Questionnaire
 The Oil Questionnaire TARES/IEA Energy Statistics Training Cairo, Oct. 20-23, 2014 Pierre Boileau International Energy Agency OECD/IEA 2010 Presentation overview Introduction Collecting data from different
I.R. IRAN JODI OIL & JODI GAS
 I.R. IRAN JODI OIL & JODI GAS Data source for JODI-Oil questionnaire Crude oil NGL Other Total (1)+(2)+(3) (1) (2) (3) (4) + Production (NIOC)-Daily + From other sources Not Available + Imports Not Applicable
The IEA oil data system
 The IEA oil data system Joint Rosstat- IEA Energy statistics workshop Moscow, Russia 14-17 February 2012 Mieke Reece Oil and Gas Statistics IEA Energy Data Centre OECD/IEA 2010 Timeliness The IEA Oil Data
Annex 2 Petroleum Products Sales Questionnaire Definitions
 Annex 2 Petroleum Products Sales Questionnaire Definitions Definition of Fuels 1. Liquefied Petroleum Gas or LPG LPG refers to liquefied propane (C3H8) and butane (C4Hl0) or mixtures of both. Commercial
ANNUAL STATISTICAL SUPPLEMENT
 ANNUAL STATISTICAL SUPPLEMENT with 2016 data 2017 Edition This Statistical Supplement has been prepared to provide a longer historical perspective for the oil demand, supply, trade, stocks, prices and
ANNUAL STATISTICAL SUPPLEMENT
 ANNUAL STATISTICAL SUPPLEMENT with 2008 data 2009 Edition This Statistical Supplement has been prepared to provide a longer historical perspective for the oil demand, supply, trade, stocks, prices and
Energy Statistics in Malaysia. Workshop on Energy Statistics for ASEAN Countries November 2017 Kuala Lumpur, Malaysia
 Energy Statistics in Malaysia Workshop on Energy Statistics for ASEAN Countries 21 23 November 2017 Kuala Lumpur, Malaysia Outline Background Energy in Malaysia Standard Operating Procedures Data Collection
Petroleum Planning & Analysis Cell
 MONTHLY REPORT ON INDIGENOUS CRUDE OIL PRODUCTION, IMPORT AND PROCESSING & PRODUCTION, IMPORT AND EXPORT OF PETROLEUM PRODUCTS May 2018 Petroleum Planning & Analysis Cell (Ministry of Petroleum & Natural
EUROSTAT INTERNATIONAL ENERGY AGENCY ORGANISATION FOR ECONOMIC CO-OPERATION AND DEVELOPMENT
 EUROSTAT INTERNATIONAL ENERGY AGENCY ORGANISATION FOR ECONOMIC CO-OPERATION AND DEVELOPMENT Paris, drafted: March 2012 - Or. English Ver 2012.1 Attached is the Monthly Oil and Gas questionnaire, which
The Extended JODI Oil Questionnaire
 10 th Regional JODI Training Workshop 23-25 November 2014, Doha, Qatar The Extended JODI Oil Questionnaire Agnieszka Kościelniak International Energy Agency In JODI Oil - Simplified Primary Secondary Out
1 E NERGY 1-2 STEP BY STEP CALCULATIONS 4 OF 16 MANUFACTURING INDUSTRIES AND CONSTRUCTION STEP 4 STEP 5 STEP 6. Carbon Stored (Gg C) (a)
 (a)") SUB CO 2 FROM FUEL COMBUSTION BY SOURCE CATEGORIES (TIER I) 4 OF 16 MANUFACTURING INDUSTRIES AND CONSTRUCTION STEP 4 STEP 5 STEP 6 G H I J K L Manufacturing Industries and Construction (a) (a) Net Carbon
SUB CO 2 FROM FUEL COMBUSTION BY SOURCE CATEGORIES (TIER I) 4 OF 16 MANUFACTURING INDUSTRIES AND CONSTRUCTION STEP 4 STEP 5 STEP 6 G H I J K L Manufacturing Industries and Construction (a) (a) Net Carbon
Petroleum Planning & Analysis Cell
 MONTHLY REPORT ON INDIGENOUS CRUDE OIL PRODUCTION, IMPORT AND PROCESSING & PRODUCTION, IMPORT AND EXPORT OF PETROLEUM PRODUCTS September 2018 Petroleum Planning & Analysis Cell (Ministry of Petroleum &
Petroleum Planning & Analysis Cell
 MONTHLY REPORT ON INDIGENOUS CRUDE OIL PRODUCTION, IMPORT AND PROCESSING & PRODUCTION, IMPORT AND EXPORT OF PETROLEUM PRODUCTS February 2018 Petroleum Planning & Analysis Cell (Ministry of Petroleum &
World Oil Outlook A Perspective from OPEC
 World Oil Outlook A Perspective from OPEC Dr. Fuad Siala OPEC Secretariat Transport, Energy & Fuels Working Together for a Sustainable Future Brussels, Belgium May 8-1, 27 Energy demand by fuel type 18
Petroleum Planning & Analysis Cell
 MONTHLY REPORT ON INDIGENOUS CRUDE OIL PRODUCTION, IMPORT AND PROCESSING & PRODUCTION, IMPORT AND EXPORT OF PETROLEUM PRODUCTS November 2017 Petroleum Planning & Analysis Cell (Ministry of Petroleum &
Methodology and specifications guide China Oil Analytics
 Methodology and specifications guide China Oil Analytics Latest update: March 2018 Scope of service 2 Contact us 2 Frequency of publication 2 Frequency of data updates 2 Data and analysis sources 2 Forecasting
Market Report Series: Oil 2018 Analysis & Forecasts to Energy Community 10 th Oil Forum, Belgrade, 25 September 2018
 Market Report Series: Oil 218 Analysis & Forecasts to 223 Energy Community 1 th Oil Forum, Belgrade, 25 September 218 Short term update: crude prices (excl. WTI) up strongly Aug/Sep $/bbl 8 Benchmark Crude
Regional Energy Trade and Refining Industry in Northeast Asia
 15 th Northeast Asia Economic Forum 5-7 September 2006, Khabarovsk Russia Regional Energy Trade and Refining Industry in Northeast Asia Kensuke Kanekiyo Managing Director The Institute of Energy Economics,
What is the impact of changing patterns in energy markets on EU competitiveness? A refining industry perspective
 What is the impact of changing patterns in energy markets on EU competitiveness? A refining industry perspective Energy transition: A multifaceted Challenge for Europe 1 st Symposium, Brussels, 30 April
Table 1: World Oil Supply And Demand
 INTERNATIONAL ENERGY AGENCY - OIL MARKET REPORT TABLES Table 1 WORLD OIL SUPPLY AND DEMAND Table 1: World Oil Supply And Demand (million barrels per day) TABLES 2012 2013 1Q14 2Q14 3Q14 4Q14 2014 1Q15
Chemistry for the gifted and talented 33
 33 Student worksheet: CDROM index 17SW Discussion of answers: CDROM index 17DA Topics The fractions of crude oil, their uses and range of carbon chain length. Level Able students in the 14 16 age range.
SUPPLY CHAIN PERSPECTIVE
 SUPPLY CHAIN PERSPECTIVE FUEL Overview Australia s economy is built on key industries that rely heavily on fuel consumption. This report deals with fuel as it is processed from crude oil to refined petroleum
GLOBAL INTEGRATION AND CARBON FLOW IN EU AND REST OF THE WORLD: A 2-REGIONAL INPUT-OUTPUT FRAMEWORK
 GLOBAL INTEGRATION AND CARBON FLOW IN EU AND REST OF THE WORLD: A 2-REGIONAL INPUT-OUTPUT FRAMEWORK Amarendra Sahoo, Arjan de Koning, Reinout Heijungs Institute of Environmental Sciences (CML) Leiden University
Table 1 WORLD OIL SUPPLY AND DEMAND (million barrels per day)
") INTERNATIONAL ENERGY AGENCY - OIL MARKET REPORT TABLES TABLES Table 1 WORLD OIL SUPPLY AND DEMAND (million barrels per day) 2011 2012 1Q13 2Q13 3Q13 4Q13 2013 1Q14 2Q14 3Q14 4Q14 2014 1Q15 2Q15 3Q15 4Q15
INTERNATIONAL ENERGY AGENCY - OIL MARKET REPORT TABLES TABLES Table 1 WORLD OIL SUPPLY AND DEMAND (million barrels per day) 2011 2012 1Q13 2Q13 3Q13 4Q13 2013 1Q14 2Q14 3Q14 4Q14 2014 1Q15 2Q15 3Q15 4Q15
REFINED PETROLEUM PRODUCTS
 Historical Copy.1 REFINED PETROLEUM PRODUCTS APRIL, 1958 L I DOMINION BUREAU OF STATISTICS 0V,efWp,TM OT THE Published by A u!hori!y of The Honourable Gordon Churchill, Minister of Trade and Commerce DOMINION
Development of the CONCAWE SCEDs Arlean Rohde, CONCAWE
 Development of the CONCAWE SCEDs Arlean Rohde, CONCAWE ENES4, Helsinki, 16-17 May 2013 Outline What are petroleum substances? Which petroleum substances are sold for consumer uses? And what do these uses
REFINED PETROLEUM PRODUCTS
 I. CATALOGUE No. 45004 MONTHLY Histarical File Copy CAN A PA REFINED PETROLEUM PRODUCTS MARCH 1965 iit.mlau OF STA1STICS JUU!'.VcOPERTy OF TME USKARY Published by Authority of The Minister of Trade and
Downstream Petroleum Sector The Growing Prominence of Asian Refining
 Downstream Petroleum Sector The Growing Prominence of Asian Refining Mr. Fahad Al-Dihani Deputy CEO,MAA Refinery, Kuwait National Petroleum Company-Kuwait Outline.. Global refining trends Kuwait s Position
OCTANE THE NEW ECONOMICS OF. What Drives the Cost of Octane and Why Octane Costs Have Risen Since 2012 T. J. HIGGINS. A Report By:
 THE NEW ECONOMICS OF OCTANE What Drives the Cost of Octane and Why Octane Costs Have Risen Since 2012 A Report By: T. J. HIGGINS Contents Foreword... 1 1. Executive Summary... 2 2. Tracking the Changing
Statistical Data in Japan
 Statistical Data in Japan Trends in LP Gas Supply Patterns 20,000 18,832 18,198 18,140 17,905 18,079 17,454 7454 Domestic Production 25.9% 74.1% Import Ratio of Import and Domestic Production 20,000 1,000
Once a waste of lamp oil production
 Refinery All processes and activities described so far happened on the upstream side. he next step to convert crude to e.g. gasoline is happening on the downstream side in refineries. olie 1 Once a waste
New York Energy Forum
 Presentation at the New York Energy Forum 30 June 2014 Antoine Halff The oil market at a junction Balances loosen up on paper but must be seen in perspective The unconventional supply revolution enters
1 The diagram shows the separation of petroleum into fractions. gasoline. petroleum Z. bitumen. What could X, Y and Z represent?
 1 The diagram shows the separation of petroleum into fractions. gasoline X Y petroleum Z bitumen What could X, Y and Z represent? 2 What is not the correct use for the fraction named? name of fraction
Canada s Refining Industry Sector Performance Report
 Canada s Refining Industry 217 Sector Performance Report The Canadian Fuels Association represents the industry that produces, distributes and markets petroleum products in Canada including 95 percent
ISSN Statistical books. Energy. Yearly statistics edition
 ISSN 1830-7833 Statistical books Energy Yearly statistics 2006 2008 edition Statistical books Energy Yearly statistics 2006 2008 edition Europe Direct is a service to help you find answers to your questions
EUROPEAN COMMITTEE UNDER THE GOVERNMENT OF THE REPUBLIC LITHUANIA. September 5, 2001 Final report summary
 EUROPEAN COMMITTEE UNDER THE GOVERNMENT OF THE REPUBLIC LITHUANIA Evaluation of consequences of Council Directive 98/93/EC amending Directive 68/414/EEC imposing an obligation on Member States of the EEC
EURONAV TALKS IMO 2020 FROM THE VIEW OF A SHIPOWNER JUNE
 EURONAV TALKS IMO 2020 FROM THE VIEW OF A SHIPOWNER JUNE 2018 1 IMO 2020 2 % weight permitted WHAT IS IMO 2020 I HAVE SEEN ONE BEFORE.BUT NEVER THIS BIG Hill 4.5% Cliff 4.0% 3.5% 3.0% Open Seas 2.5% 2.0%
1 E NERGY. Data sources. Methodology. Completing the Worksheet
 1 E NERGY Operations of aircraft are divided into two parts: The Landing/Take-Off (LTO) cycle 4 which includes all activities near the airport that take place under the altitude of 914 metres (3000 feet).
Table 1 WORLD OIL SUPPLY AND DEMAND (million barrels per day)
") INTERNATIONAL ENERGY AGENCY - OIL MARKET REPORT TABLES Table 1 WORLD OIL SUPPLY AND DEMAND (million barrels per day) 2004 2005 1Q06 2Q06 3Q06 4Q06 2006 1Q07 2Q07 3Q07 4Q07 2007 1Q08 2Q08 3Q08 4Q08 2008
INTERNATIONAL ENERGY AGENCY - OIL MARKET REPORT TABLES Table 1 WORLD OIL SUPPLY AND DEMAND (million barrels per day) 2004 2005 1Q06 2Q06 3Q06 4Q06 2006 1Q07 2Q07 3Q07 4Q07 2007 1Q08 2Q08 3Q08 4Q08 2008
Table 1 TABLES INTERNATIONAL ENERGY AGENCY OIL MARKET REPORT 15 MAY
 INTERNATIONAL ENERGY AGENCY OIL MARKET REPORT TABLES Table 1 Table WORLD 1 - World OIL SUPPLY Oil Supply AND DEMAND and Demand (million barrels per day) 2010 2011 1Q12 2Q12 3Q12 4Q12 2012 1Q13 2Q13 3Q13
REFINED PETROLEUM PRODUCTS JUNE 1964
 S CATALOGUE No. 45004 MONTNLY Irkal File Copy ' CANADA REFINED PETROLEUM PRODUCTS JUNE 1964 Published by Aufhordy of The Minister of Trade and Commerce DOMINION BUREAU OF STATISTICS Industry Division September
REFINED PETROLEUM PRODUCTS
 0 CATALOGUE No. Historical File Copy 45004 * MONTHLY 6 zo (:.\ N.\ 1). REFINED PETROLEUM PRODUCTS NOVEMBER, 1958 I LOMiNION BUREAU. OF STATISTICS :CI r9 OF THE kary Published by Authority of The Honourable
OPEC PRIMARY ENERGY CONSUMPTION IN 2005 (1)
") CHAPTER 4 I n 1384, political tensions in the Middle East and some oil-producing countries, sabotage in Iraq s oil industry and speculation in the market raised oil prices incrementally. As of the beginning
CHAPTER 4 I n 1384, political tensions in the Middle East and some oil-producing countries, sabotage in Iraq s oil industry and speculation in the market raised oil prices incrementally. As of the beginning
REFINED PETROLEUM PRODUCTS MAY 1964
 CATALOGUE No. 45004 S... MONTHLY Historical File Copy,' CANADA REFINED PETROLEUM PRODUCTS MAY 1964 5ANu OF STAllS' (C UG 6 4 PROPCJ( OF THE LIaRARY Published by Authority of The Minister of Trade and Commerce
Global Refining: Fueling Profitability in the Turbulent Times Ahead. Sponsored by:
 Global Refining: Fueling Profitability in the Turbulent Times Ahead Sponsored by: The Outlook for Energy: A View to 24 Roland L. Moreau ExxonMobil Upstream Research Company Hart Energy Breakfast Club February
WORLD OIL SUPPLY AND DEMAND (million barrels per day)
") INTERNATIONAL ENERGY AGENCY OIL MARKET REPORT TABLES TABLES Table 1 WORLD OIL SUPPLY AND DEMAND (million barrels per day) 2005 2006 1Q07 2Q07 3Q07 4Q07 2007 1Q08 2Q08 3Q08 4Q08 2008 1Q09 2Q09 3Q09 4Q09
INTERNATIONAL ENERGY AGENCY OIL MARKET REPORT TABLES TABLES Table 1 WORLD OIL SUPPLY AND DEMAND (million barrels per day) 2005 2006 1Q07 2Q07 3Q07 4Q07 2007 1Q08 2Q08 3Q08 4Q08 2008 1Q09 2Q09 3Q09 4Q09
S t a t i s t i c a l b o o k s. Energy. Yearly statistics edition
 S t a t i s t i c a l b o o k s Energy Yearly statistics 2005 2007 edition EuropEan Commission Europe Direct is a service to help you ind answers to your questions about the European Union Freephone number
Oil and Gas Projects in Mexico and Expectations for Japanese Technologies
 JOGMEC Techno Forum 2013 PEMEX Exploración y Producción Subdirección de Distribución y Comercialización Gerencia De Operaciones Oil and Gas Projects in Mexico and Expectations for Japanese Technologies
Frequently Asked Questions Style Guide. Developed by E-WRITE ewriteonline.com For the Energy Information Administration eia.doe.
 Frequently Asked Questions Style Guide Developed by E-WRITE ewriteonline.com For the Energy Information Administration eia.doe.gov November 2006 1. Answer the question completely. Make sure your answer
An Overview on Pakistan Refining Industry
 An Overview on Pakistan Refining Industry May 2018 Oil 000' mln tonnes World Crude Oil Reserves 120,000 240,000 Largely sustained level of reserves 90,000 225,000 Middle east Contributes ~48% 60,000 210,000
A summary of national and global energy indicators. FEDERAL RESERVE BANK of KANSAS CITY
 THE U.S. Energy DATABOOK A summary of national and global energy indicators JULY 1, 17 FEDERAL RESERVE BANK of KANSAS CITY SUMMARY OF CURRENT ENERGY CONDITIONS The number of total active drilling rigs
REFINED PETROLEUM PRODUCTS
 4 5 REFINED PETROLEUM PRODUCTS OCTOBER, 1956 OF BUREAU MR 6 1957 A. Published by Authority of The Right Honourable C. D. Howe, Minister of Trade and Commerce DOMINION BUREAU OF STATISTICS Industry and
The Outlook for Energy: A View to 2040
 The Outlook for Energy: A View to 24 Todd Onderdonk June 213 This presentation includes forward-looking statements. Actual future conditions (including economic conditions, energy demand, and energy supply)
Analyst Presentation 1Q 2008 Results
 Analyst Presentation 1Q 2008 Results 0 Contents Section 1: Section 2: Section 3: Section 4: Section 5: Company Overview IPO Update Operating Performance Consolidated Financial Performance Dividend Update
Mini refinery feasibility study
 Mini refinery feasibility study Introduction The first part of any study into a mini-refinery application is an initial assessment of its economic feasibility. This requires an understanding of what a
14.2 Fuels. Question Paper. Subject Chemistry (0620) Cambridge International Examinations (CIE) Organic Chemistry A* A B C D E U
 Cambridge International Examinations (CIE) Organic Chemistry A* A B C D E U") Save My Exams! The ome of Revision For more awesome GSE and level resources, visit us at www.savemyexams.co.uk/ 14.2 Fuels Question Paper Level IGSE Subject hemistry (0620) Exam oard ambridge International
Save My Exams! The ome of Revision For more awesome GSE and level resources, visit us at www.savemyexams.co.uk/ 14.2 Fuels Question Paper Level IGSE Subject hemistry (0620) Exam oard ambridge International
CHEMSYSTEMS. Report Abstract. Petrochemical Market Dynamics Feedstocks
 CHEMSYSTEMS PPE PROGRAM Report Abstract Petrochemical Market Dynamics Feedstocks Petrochemical feedstocks industry overview, crude oil, natural gas, coal, biological hydrocarbons, olefins, aromatics, methane
ALBERTA CARBON LEVY. Impact of Producers, Marketers and Users of Fuel. December 15, 2016 Craig McDougall, QC / Peter Mitchell, CA Felesky Flynn LLP
 ALBERTA CARBON LEVY Impact of Producers, Marketers and Users of Fuel December 15, 2016 Craig McDougall, QC / Peter Mitchell, CA Felesky Flynn LLP ALBERTA CARBON LEVY Effective January 1, 2017 $20 per tonne
AL BADI TRADING OIL & GAS PRODUCTS LLC
 OIL & GAS PRODUCTS LLC AB TRADING COMPANY PROFILE WWW.ALBADIGROUP.COM 2018 Contents 03 Mission & Vision BUSINESS MODEL 04 Chairman s Message BUSINESS ACTIVITIES 05 PRODUCTS 06 PETROLEUM ACTIVITIES 07 TRADING
Part 2 ENERGY SUPPLY SECURITY 2014
 ENERGY SUPPLY SECURITY 2014 Part 2 The following member country profile is an excerpt from Chapter 4 of the publication Energy Supply Security 2014 and is not intended as a stand-alone publication. CHAPTER
Thai Experience on Energy Taxation
 The 5 th IMF-Japan High-Level Tax Conference for Asian Countries Thai Experience on Energy Taxation Dr. Warotai Kosolpisitkul Director of Tax Policy Bureau Fiscal Policy Office, Ministry of Finance 21
Challenges and Opportunities in Managing CO 2 in Petroleum Refining
 Challenges and Opportunities in Managing CO 2 in Petroleum Refining Theresa J. Hochhalter ExxonMobil Research & Engineering Fairfax, VA GCEP Workshop on Carbon Management in Manufacturing Industries STANFORD
As a result, the share of US in world industrial production should fall from 19.4% in 2012 to 18.5% by 2016 and decline to 17.6% by 2021.
 : Industry Overview GDP is expected to rise by 2.2% in 212 and expand by 2.1% in 213. Over the next 1 years to 221, GDP is predicted to grow on average by 2.8% a year. Manufacturing output growth is forecast
Market Report Series Oil 2018
 Market Report Series Oil 218 Norwegian Ministry of Energy, 17 April 218 Neil Atkinson, Head of Oil Industry and Markets Division Toril Bosoni, Senior Oil Market Analyst, Oil Industry and Markets Division
Pakistan Refining Industry An Overview
 Pakistan Refining Industry An Overview October 2016 Oil World Crude Oil Reserves Largely sustained level of reserves Largest Region Contributes 47% (2014: 47.2%) Global proven oil reserves in 2015 fell
CUSTOMS TARIFF - SCHEDULE. Chapter 27 MINERAL FUELS, MINERAL OILS AND PRODUCTS OF THEIR DISTILLATION; BITUMINOUS SUBSTANCES; MINERAL WAXES
 CUSTOMS TARIFF - SCHEDULE 27 - i Chapter 27 MINERAL FUELS, MINERAL OILS AND PRODUCTS OF THEIR DISTILLATION; BITUMINOUS SUBSTANCES; MINERAL WAXES Notes. 1. This Chapter does not cover: (a) Separate chemically
Market Report Series Oil 2018 Analysis and Forecasts to Columbia University Centre on Global Energy Policy, New York, May 22 nd 2018
 Market Report Series Oil 218 Analysis and Forecasts to 223 Columbia University Centre on Global Energy Policy, New York, May 22 nd 218 Robust global oil demand growth to 223 1.8 1.6 1.4 1.2 1..8.6.4.2.
Solvent Deasphalting Conversion Enabler
 Kevin Whitehead Solvent Deasphalting Conversion Enabler 5 th December 2017 Bottom of the Barrel Workshop NIORDC, Tehran 2017 UOP Limited Solvent Deasphalting (SDA) 1 Natural Gas Refinery Fuel Gas Hydrogen
The Petrochemical Industry From Middle Eastern Perspective?
 The Petrochemical Industry From Middle Eastern Perspective? Hydrocarbon Journey in Kuwait 1946 ENTERING CRUDE EXPORT MARKET 1949 FIRST REFINERY COMMISSIONED 1938 1 st COMMERCIAL OIL DISCOVERY 1963 AMMONIA
Conversion Processes 1. THERMAL PROCESSES 2. CATALYTIC PROCESSES
 Conversion Processes 1. THERMAL PROCESSES 2. CATALYTIC PROCESSES 1 Physical and chemical processes Physical Thermal Chemical Catalytic Distillation Solvent extraction Propane deasphalting Solvent dewaxing
VTTI. Storage Markets : Our Perspective. StocExpo Europe March Onur Capan: Market Intelligence
 VTTI Storage Markets : Our Perspective Onur Capan: Market Intelligence StocExpo Europe March 2017 VTTI track record at its 10 th anniversary VTTI has grown in 10 years to be one of the largest global independent
Follow-up briefing to the Portfolio Committee on Trade and Industry on beneficiation
 Follow-up briefing to the Portfolio Committee on Trade and Industry on beneficiation 24 October 2014 Presentation overview Our understanding of beneficiation Polymer business briefing Conclusion Sasol
Co-Processing of Green Crude in Existing Petroleum Refineries. Algae Biomass Summit 1 October
 Co-Processing of Green Crude in Existing Petroleum Refineries Algae Biomass Summit 1 October - 2014 1 Overview of Sapphire s process for making algae-derived fuel 1 Strain development 2 Cultivation module
Fundamentals of Petroleum Refining Refinery Products. Lecturers: assistant teachers Kirgina Maria Vladimirovna Belinskaya Natalia Sergeevna
 Fundamentals of Petroleum Refining Refinery Products Lecturers: assistant teachers Kirgina Maria Vladimirovna Belinskaya Natalia Sergeevna 1 Refinery Products Composition There are specifications for over
BELGIAN PETROLEUM FEDERATION. Quel avenir pour l approvisionnement énergétique en Belgique? La vision vue du secteur pétrolier
 1 BELGIAN PETROLEUM FEDERATION Quel avenir pour l approvisionnement énergétique en Belgique? La vision vue du secteur pétrolier JP VAN DIJK 28 octobre 2018 Belgian Petroleum Federation (BPF) BPF represents
EST technology: an advanced way to upgrade the bottom of the barrel G. Rispoli
 EST technology: an advanced way to upgrade the bottom of the barrel G. Rispoli OMC 2015 WORKSHOP: ADVANCED PROVEN TECHNOLOGIES INCREASE PRODUCTIVITY QUALITY, SAFETY AND SECURITY Ravenna, 26th March 2015
MARANTA PETROLEUM LTD October 2018
 MARANTA PETROLEUM LTD http://www.marantaoil.com October 2018 Agenda About MARANTA PETROLEUM LTD Our Services 1- Global Trade 2- Storage 3- Transport 4- Marketing Our Products Cooperation and Collaboration
Sasol Limited Group Production and sales metrics for the year ended 30 June
 and sales metrics for the year ended 30 June % change Full year Full year Full year Mining 2018 vs 2017 2018 2017 2016 Saleable production¹ mm tons 3 37,2 36,0 40,3 mm tons (16) 6,7 8,0 5,0 Energy mm tons
2016 Annual Statistical Bulletin. For further enquires and comments, please contact us at: Website:
 2016 Annual Statistical Bulletin For further enquires and comments, please contact us at: E-mail: gmis.cpdd@nnpcgroup.com Website: www.nnpcgroup.com D I S C L A I M E R i NNPC ASB 2016 1st Edition This
REFORMATE Crude Condensate Naphtha Ethane Reformate
 REFORMATE Crude The Crude Overview gives a summary of the daily price movements of the benchmark WTI (West Texas Intermediate) and Brent futures contracts on the NYMEX and IPE exchanges, detailing any
Monthly Petroleum Statistics
 AUGUST 2015 Vol. XXVII No. 8 Monthly Petroleum Statistics SUBDIECCIÓN DE DESEMPEÑO DEL NEGOCIO AV. MAINA NACIONAL 329 GEENCIA DE INDICADOES OPEATIVOS Y DEL NEGOCIO PISO 31 TOE EJECUTIVA 11311 MÉXICO D.
Worldwide Demand for Crude Oil & Refined Products: Refinery Business Objectives: Fundamental Qualities of Oil:
 6HFWLRQ )DFWRUV'ULYLQJ &UXGH2LO3ULFHV +RZWKH)DFWRUV $IIHFW&KDG V 3ULFHV &RQWH[W0DUNHWLQJ&KDG V2LO T he Project has now shipped over 50 million barrels of Chadian crude oil to market and the results so
ARA TT Market Projections
 StocExpo Rotterdam Conference 2017 ARA TT Market Projections www.pjk-international.com www.tankterminals.com Tank Terminal Market Research ir. Patrick Kulsen, MSc. B. Mail: patrick.kulsen@pjk-international.com
Regional Refining Outlook
 Regional Refining Outlook Implications for Crude Demand Platts Crude Summit 15 May 213 David Wech JBC Energy GmbH 13 th May 213 Research - Energy Studies - Consulting - Training Disclaimer All statements
Oil & Gas. From exploration to distribution. Week 3 V19 Refining Processes (Part 1) Jean-Luc Monsavoir. W3V19 - Refining Processes1 p.
 Jean-Luc Monsavoir. W3V19 - Refining Processes1 p.") Oil & Gas From exploration to distribution Week 3 V19 Refining Processes (Part 1) Jean-Luc Monsavoir W3V19 - Refining Processes1 p. 1 Crude Oil Origins and Composition The objective of refining, petrochemical
Oil & Gas From exploration to distribution Week 3 V19 Refining Processes (Part 1) Jean-Luc Monsavoir W3V19 - Refining Processes1 p. 1 Crude Oil Origins and Composition The objective of refining, petrochemical
Refining at NIS, Bottom of the Barrel Project
 Refining at NIS, Bottom of the Barrel Project Construction of a delayed coking unit at the Pančevo Refinery November 6 th, 2017 Andrei Tuchnin First Deputy CEO for Refining & Marketing Objective The purpose
Forecasting of Russian economy. Energy sector model
 Forecasting of Russian economy Energy sector model Alexandria September, 2014 Energy Sector in Russian Economy Energy sector of Russian economy Produces 14,2% of GDP Forms 66,5% of Russian exports (33%
OIL INFORMATION DOCUMENTATION FOR BEYOND 2020 FILES
 OIL INFORMATION: BEYOND 2020 DOCUMENTATION (2011 Edition) - 1 OIL INFORMATION DOCUMENTATION FOR BEYOND 2020 FILES OIL INFORMATION: BEYOND 2020 DOCUMENTATION (2011 Edition) - 3 TABLE OF CONTENTS PART I:
CONVERSION FACTORS. xix
 CONVERSION FACTORS The data which have been supplied by the countries in original units are converted to the common unit, terajoules (TJ), by using standard conversion factors or, in the case of solids,
Table 16 Refinery distillation capacity, throughput and output Thousand metric tons
 Table 16 Refinery distillation capacity, throughput and output Table Notes Output is equal to the sum of production from refineries for aviation gasoline, bitumen, gas/diesel oil, ethane, feedstocks, gasoline-type
HPCL-Mittal Energy Limited
 Energising a Brighter Tomorrow HPCL-Mittal Energy Limited Corporate Profile Company Overview Hindustan Petroleum Corporation Ltd Mittal Energy Investments Pte Ltd, Singapore 49% 49% HPCL A Navratna Public
Methodology. Supply. Demand
 Methodology Supply Demand Tipping the Scale 1 Overview Latin America and the Caribbean, a major petroleum product importing region, provides an important counterbalance to surpluses in refined product
Oil and gas prices down off 2008 highs
 Oil and gas prices down off 28 highs $ US$ per per barrel barrel US$ $ per thousand cubic feet 16 9 14 8 12 7 Natural gas (wellhead) 6 1 (Right) 5 8 4 6 3 4 2 Crude oil 2 (Left) 1 198 1985 199 1995 2 25
Lecture 3: Petroleum Refining Overview
 Lecture 3: Petroleum Refining Overview In this lecture, we present a brief overview of the petroleum refining, a prominent process technology in process engineering. 3.1 Crude oil Crude oil is a multicomponent
CUSTOMS TARIFF - SCHEDULE V - 1
 V - 1 Section V MINERAL PRODUCTS 27 - i Chapter 27 MINERAL FUELS, MINERAL OILS AND PRODUCTS OF THEIR DISTILLATION; BITUMINOUS SUBSTANCES; MINERAL WAXES Notes. 1. This Chapter does not cover: (a) Separate
Modernization of Libyan Oil Refineries and Petrochemical Plants
 Modernization of Libyan Oil Refineries and Petrochemical Plants Presentation Contents 1. Introduction 2. Challenges Facing the Existing Libyan Oil refineries and Petrochemical Plants. 3. Refining and Petrochemical
Table 16 Refinery distillation capacity, throughput and output Thousand metric tons
 Million metric tons Table 16 Refinery distillation capacity, throughput and output Table Notes Output is equal to the sum of production from refineries for aviation gasoline, bitumen, gas/diesel oil, ethane,
Like a Box of Chocolates The Condensate Dilemma. 3rd Annual NGLs Forum
 Like a Box of Chocolates The Condensate Dilemma 3rd Annual NGLs Forum E. Russell Braziel RBN Energy, LLC September 23, 2013 Tsunami of Condensates Mb/d 1,600 1,400 1,200 1,000 800 600 400 200 0» Historically
OUTLINING STORAGE REGIONALLY IN AFRICA How much is sufficient and well-linked storage key to security of supply and competitive pricing?
 Platts African Refining Summit 2014 OUTLINING STORAGE REGIONALLY IN AFRICA How much is sufficient and well-linked storage key to security of supply and competitive pricing? - by Gabriel Ogbechie, Managing