2016 Annual Statistical Bulletin. For further enquires and comments, please contact us at: Website:
|
|
|
- Dustin Oswald Washington
- 5 years ago
- Views:
Transcription


1 2016 Annual Statistical Bulletin For further enquires and comments, please contact us at: Website:
2 D I S C L A I M E R i NNPC ASB st Edition This publication presents information on the oil and gas industry. Its content reflects individual as well as general analysis and trend of activities that characterized the industry within the country for the year Although NNPC endeavours to ensure accuracy of information in these documents, it cannot guarantee 100% accuracy nor can it be held liable for errors that may occur. Users are to note that use of any information herein is purely at their discretion.
3 ii TABLE OF CONTENTS Page No Report and Analysis iii List of Tables Table 1: Proven Crude Oil and Natural Gas Reserves 1 Table 2.0 : Seismic Activities Table 2.01 : Drilling Summary by Company Table 3.0 : Summary of Crude Oil Field Production by Companies Table 3.01 : Monthly Crude Oil Field Production By Companies Table 4.0 : Terminal Crude Oil Production Table 4.01 : Monthly Terminal Crude Oil Production by Companies Table 4.02 : Monthly Terminal Crude Oil Production by Streams.. 6 Table 5.0 : 10 Year Crude Oil Production by Companies.. 7 Table 5.01 : 10 Year Monthly Crude Oil Production. 8 Table 5.02 : 10 Year Crude Oil Production by Regime... 8 Table 6 : Crude Oil Lifting (Domestic & Export)... 9 Table 7 : Crude Oil Exports by Destination Table 8 : Crude Oil Lifting by Accounts Types.. 11 Table 9 : 10 Year Crude Oil Export Table 10 : 10 Year Crude Oil Delivery to local Refineries Table 11 : 10 Year Crude Oil Export by Region Table 12 : Gas Production and Utilization Table 13.0: Monthly Gas Production verse Flared 14 Table 13.01: 10 Year Gas Production and Utilization. 15 Table 14:0 National Natural Gas Liquid (NGL) Production and Export Table 14.01: Mobile Natural Gas Liquid (NGL) Production and Export Table 14.02: Chevron Natural Gas Liquid (NGL) Production and Export Table : NLNG Natural Gas Liquid (NGL) Production and Export Table 15.0 : Quarterly Domestic Refining Crude Oil Balance. 18 Table : Domestic Refining Crude Oil Balance Table : Monthly Domestic Refining Crude Oil Receipt Table : Domestic Refining Crude Oil Processed Table : 10 Year Domestic Crude Oil Refining.. 19 Table 16.0 : Domestic Refining Capacity Utilization (%) Table : 10 Year Domestic Refining Capacity Utilization (%).. 20 Table 17.0 : Monthly Domestic Product Yield Table : 10 Year Domestic Major Product Yield Table 18.0 : Domestic Production and Evacuation Table 19.0 : Domestic Refining Fuel and Loss Statistics Table 20.0 : Petroleum Products Distribution by NNPC Retail Ltd Table : Petroleum Products Distribution by Zones Table : 10 Year Average Daily Petroleum Product Distribution.. 22 Table 21.0 : PPMC Products Sales Table : 10 Year PPMC Products Sales Table 22.0 : 10 Year PPMC Products Import Table 23.0 : PPMC s Products Export Table : 10 Year PPMC s Products Exports Table 24 : 10 Year Pipeline Products Loss Table 25: 10 Year Pipeline Incidences Table 26 : 10 Year Fire Out-Break Incidences Table 27: 5 Year Pipeline Crude Oil Loss. 24 Petroleum Products Distribution Zones in Nigeria.. 25 Glossary of Terms and Abbreviations.. 26

. A total of Seventy Four (74) wells were drilled. Table 2.01 gives a summary of drilling activities during the year.")
 of Natural Gas production was reported by Forty One (41) Companies.")
4 iii GENERAL NOTES This report reflects the activities of the Nigerian National Petroleum Corporation (NNPC) in year National and other figures captured are used to aid statistical analysis. Much of the data reported was sourced from non- NNPC companies. A comprehensive list of these companies is indicated in the Appendix to this document. Some tables may be subject to further reconciliation. Users should note the comments on each table for completeness EXPLORATION ACTIVITIES A total of sq. kms of 3D Seismic data was acquired while 8,156.0 sq kms was processed/reprocessed (see Table 2.0). A total of Seventy Four (74) wells were drilled. Table 2.01 gives a summary of drilling activities during the year. CRUDE OIL AND GAS PRODUCTION Total crude oil and condensate production for the year was 669,997,933 barrels giving a daily average of 1.83mmb/pd (Table 4.0). This is lower than the previous year s by 13.3%. In the gas sector, a total of 2, Billion Standard Cubic Feet (BSCF) of Natural Gas production was reported by Forty One (41) Companies. This shows a decrease of 5.19% when compared with 2015 production. Of the quantity produced, 2, BSCF (88.75%) was utilized, while BSCF (11.25%) was flared. CRUDE OIL LIFTING A total of 668,163,617.0 barrels (1.83 million barrels per day) of crude oil and condensate was lifted for domestic and export purposes, showing a decrease of 14.39% against year Of the total quantity, NNPC and NPDC lifted 255,418,045 barrels (38.23%), averaging 697, barrels per day for both domestic utilization and export. The breakdown of the NNPC lifting is shown on Table 8. UPSTREAM LIQUID GAS PRODUCTION AND EXPORT Total Natural Gas Liquid (NGL) produced in 2016 was 2,835,361 Metric Tons, reported by Mobil, Chevron and NLNG Companies. A total of 1,031,187 Metric Tons was lifted. The lifting was for NNPC, Mobil, and Chevron equity shares. While there was no NLNG Lifting /export for NNPC, proceeds were paid in dividend. (Table 13 & 14). Crude Oil and Condensate Production Gas Production Vs Flared Crude Oil and Condensate Lifting NNPC Liftings by Account Type GM ERDM CP&S: Tel nathaniel.olaoye@nnpcgroup.com
 into various petroleum products. The total production output by the refineries was 2,920,894.00 metric tons of various petroleum products.")

 and Naphtha worth about N15.")
5 iv REFINING The local refineries received a total of 32,720, barrels (4,423,312 mt) of (dry) crude oil, condensate and slops and processed 22,509, barrels (3,042,321 mt) into various petroleum products. The total production output by the refineries was 2,920, metric tons of various petroleum products. The combined average refining capacity utilization for year 2016 was 13.82% as against 4.92% in the previous year. PRODUCTS MOVEMENT PPMC evacuated 2,735, mt of petroleum products from the refineries and it also imported 8,320, mt of PMS and HHK for distribution through Offshore Processing Agreement (OPA), Direct Supply, Direct Purchase (DSDP) arrangements and On-Spot delivery. PPMC sold a total of billion liters of various grades of petroleum products through depots and coastal lifting. During the year, million liters of Low Pour Fuel Oil (LPFO) and Naphtha worth about N15.73 billion was exported. A total of 22, million liters of petroleum products was distributed nationally giving an average daily consumption of million litres of PMS, million litres of AGO, 2.51 million litres of HHK, 1.46 million litres of ATK, 0.23 million litres of Fuel Oil and 0.09 million litres of LPG. Out of the total volume distributed, NNPC Retail outlets handled 1, million litres which is slightly above 7% of total volume. INCIDENCES Pipeline vandalism dropped by 8.58% below the previous year. A total of 2,589 line breaks was reported on NNPC pipelines out of which 2,534 was as a result of vandalism, while 55 cases were due to system deterioration like rupture, resulting in a loss of thousand mt of petroleum products worth about N12.36 billion. Also 0.74 million barrels of Crude oil worth about N9, million was lost in the same period. 23 cases of fire incidents were recorded during the year Refining Capacity Utilization Finished Products from Refineries Petroleum Products Distribution (NNPC Retail) Domestic Petroleum Products Sales by PPMC Pipeline Breaks GM ERDM CP&S: Tel nathaniel.olaoye@nnpcgroup.com

 Table 2.")
6 Table 1.0 Proven Crude Oil and Natural Gas Reserves 1 Table 2.0 Seismic Activities (Data Acquisition, Processing / Reprocessing) Table 2.01 Drilling Summary by Company FIGURES WERE NOT AVAILABLE AS AT THE TIME OF THIS REPORT
 NOTE: Data from some Coys (Independent and Marginal Fields) were not ready at the")
7 2 Table 3.0 Summary Crude Oil Field Production by Company (Non-fiscalised) NOTE: Data from some Coys (Independent and Marginal Fields) were not ready at the time of this report. Also, the figures are primary data (not fiscalised) and therefore might not completely tally with figures in Table 4
 NOTE: Data from")

8 3 Table 3.01 Monthly Crude Oil Production by Company (bbls) NOTE: Data from some Coys (Independent and Marginal Fields) were not ready at the time of this report. Also, the figures are primary data (not fiscalised) and therefore might not completely tally with figures in Table 4


9 Table 4.0 Terminal Crude Oil Production 4

10 Table 4.01 Monthly Terminal Crude Oil Production by Company (bbls) 5

11 Table 4.02 Monthly Terminal Crude Oil Production by Stream (barrels) 6

12 Table Year Crude Oil Production by Company (bbls) 7


13 Table Year Monthly Crude Oil Production (bbls) 8 Table Year Crude Oil Production by Regime (bbls)
 9 Further")

14 Table 6 Crude Oil Liftings (bbls) 9 Further details on lifting's by account type is given on table 8.
 10")
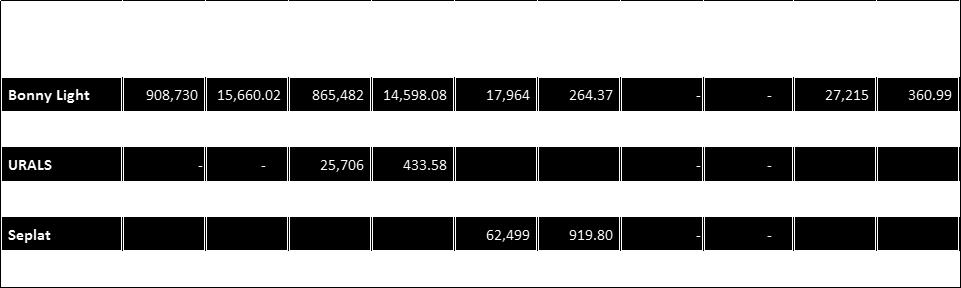
15 Table 7 Crude Oil Exports (bbls) 10


16 Table 8 Crude Oil Liftings by Accounts Types (bbls) 11 Table 9 10 Year Crude Oil Export (bbls)


17 Table Year Crude Oil Delivery to Local Refineries (bbls) 12 Table Year Crude Oil Export by Region (bbls)
")
18 Table 12 Gas Production and Utilization (mscf) 13


19 Table 13.0 Monthly Gas Production and flared (mscf) 14


20 Table Year Gas Production and Utilization (mscf) 15 Table 14.0 National Natural Gas Liquid (NGL) Production and Liftings (mt)
")
")
21 Table Mobil s Natural Gas Liquid (NGL) Production and Liftings (mt) 16 Table Chevron s Liquefied Petroleum Gas (LPG) Production and Liftings (mt)
")
22 Table NLNG s Natural Gas Liquid (NGL) Production and Export (mt) 17
")

23 18 Table 15 Quarterly Domestic Refining (Crude Oil Balance) Table Domestic Refining Crude oil Balance (Metric Tons)

 04 10 - Year Domestic Crude")
24 Table Monthly Domestic Refining Crude Oil Receipt (barrels) 19 Table Domestic Refining Crude Oil Processed (bbls) Table Year Domestic Crude Oil Refining (barrels)


25 Table 16.0 Domestic Refining Capacity Utilization (%) 20 Table Year Domestic Refining Capacity Utilization (%) Table 17.0 Monthly Domestic Product Yield (Metric Tons) Table Year Domestic Major Product Yield (Metric Tons)


26 Table 18.0 Domestic Production and Evacuation (Metric Tons) 21 Table 19.0 Domestic Refining Fuel and Loss Statistics Table 20.0 Petroleum Products Distribution by NNPC Retail Ltd. ( 000 liters)


27 Table Petroleum Products Distribution (liters) 22 Table Year Average Daily Petroleum Products Distribution ( 000 liters) Table 21.0 PPMC s Domestic Products Sales ( 000 liters)


")


28 Table Year PPMC s Domestic Products Sales ( 000 liters) 23 Table Year PPMC s Products Import (Metric Tons) Table 23.0 PPMC s Products Export Table Year PPMC s Products Export ( 000 liters)


29 Table Year Pipeline Products Loss 24 Table Year Pipeline Incidences Table Year Fire Out-Break Incidences Table Year Pipeline Crude Oil Loss


30 Petroleum Products Distribution Zones in Nigeria 25 Glossary of Terms and Abbreviations GM ERDM CP&S: Tel

31 GM ERDM CP&S: Tel
$1.93bn m NNPC. Barrels JANUARY $320.7m $156.2m $183.4m. 5.4m barrels. 6.1m barrels
 How much Crude Oil did Nigeria sell in February, How Much Revenue was made from the sale Crude Oil? 66.68m Barrels $ $1.93bn JANUARY barrels (Domestic) 5.4m barrels (Export) 6.1m barrels FIRS (PSC) 1m
MONTHLY PETROLEUM INFORMATION 2011 June Statistical Highlights
 MONTHLY PETROLEUM INFORMATION 2011 June Statistical Highlights For further enquires and comments, please contact us at: Website: www.nnpcgroup.com CORPORATE PLANNING & DEVELOPMENT DIVISION (CPDD) Disclaimer
NNPC. Monthly Report. Financial and Operations Report
 NNPC Monthly Report Financial and Operations Report October 217 Disclaimer This publication presents information on the Nigerian oil and gas industry. Its content reflects individual as well as general
NNPC. Monthly Report. Financial and Operations Report
 NNPC Monthly Report Financial and Operations Report January 218 Disclaimer This publication presents information on the Nigerian oil and gas industry. Its content reflects individual as well as general
Selected Petroleum Statistics: Oil and Gas Production, Drilling and Development ( )
") Selected Petroleum Statistics: Oil and Gas Production, Drilling and Development (2012-2016) Report Date: August 2017 Contents Executive Summary 1 Selected Petroleum Statistics: Oil and Development 2012-2016
Selected Petroleum Statistics: Oil and Gas Production, Drilling and Development (2012-2016) Report Date: August 2017 Contents Executive Summary 1 Selected Petroleum Statistics: Oil and Development 2012-2016
OUTLINING STORAGE REGIONALLY IN AFRICA How much is sufficient and well-linked storage key to security of supply and competitive pricing?
 Platts African Refining Summit 2014 OUTLINING STORAGE REGIONALLY IN AFRICA How much is sufficient and well-linked storage key to security of supply and competitive pricing? - by Gabriel Ogbechie, Managing
OCTANE THE NEW ECONOMICS OF. What Drives the Cost of Octane and Why Octane Costs Have Risen Since 2012 T. J. HIGGINS. A Report By:
 THE NEW ECONOMICS OF OCTANE What Drives the Cost of Octane and Why Octane Costs Have Risen Since 2012 A Report By: T. J. HIGGINS Contents Foreword... 1 1. Executive Summary... 2 2. Tracking the Changing
1. Introduction Regional Analysis...4
 Table of Contents i Table of Contents 1. Introduction...1 1.1 Opportunities for international manufacturers...1 1.2 Objectives and structure of this report...2 2. Regional Analysis...4 2.1 Description
Oil and gas prices down off 2008 highs
 Oil and gas prices down off 28 highs $ US$ per per barrel barrel US$ $ per thousand cubic feet 16 9 14 8 12 7 Natural gas (wellhead) 6 1 (Right) 5 8 4 6 3 4 2 Crude oil 2 (Left) 1 198 1985 199 1995 2 25
ANNUAL STATISTICAL SUPPLEMENT
 ANNUAL STATISTICAL SUPPLEMENT with 2008 data 2009 Edition This Statistical Supplement has been prepared to provide a longer historical perspective for the oil demand, supply, trade, stocks, prices and
global and domestic operations
 12 Annual Review 2016 global and domestic operations Saudi Aramco headquarters Saudi Aramco refinery (4) terminal (9) bulk plant (24) joint venture refinery Saudi Aramco Base Oil Company (LUBEREF) Power
A summary of national and global energy indicators. FEDERAL RESERVE BANK of KANSAS CITY
 THE U.S. Energy DATABOOK A summary of national and global energy indicators JULY 1, 17 FEDERAL RESERVE BANK of KANSAS CITY SUMMARY OF CURRENT ENERGY CONDITIONS The number of total active drilling rigs
Sasol Limited Group Production and sales metrics for the year ended 30 June
 and sales metrics for the year ended 30 June % change Full year Full year Full year Mining 2018 vs 2017 2018 2017 2016 Saleable production¹ mm tons 3 37,2 36,0 40,3 mm tons (16) 6,7 8,0 5,0 Energy mm tons
UK Continental Shelf (UKCS) Oil and Gas Production and the UK Economy. Mike Earp
 Oil and Gas Production and the UK Economy. Mike Earp") UK Continental Shelf (UKCS) Oil and Gas Production and the UK Economy Mike Earp 15 June 215 Outline Production and Reserves Expenditure, Income and Taxation Gross Value Added Trade Recent Production History
UK Continental Shelf (UKCS) Oil and Gas Production and the UK Economy Mike Earp 15 June 215 Outline Production and Reserves Expenditure, Income and Taxation Gross Value Added Trade Recent Production History
Pakistan Refining Industry An Overview
 Pakistan Refining Industry An Overview October 2016 Oil World Crude Oil Reserves Largely sustained level of reserves Largest Region Contributes 47% (2014: 47.2%) Global proven oil reserves in 2015 fell
ANNUAL STATISTICAL SUPPLEMENT
 ANNUAL STATISTICAL SUPPLEMENT with 2016 data 2017 Edition This Statistical Supplement has been prepared to provide a longer historical perspective for the oil demand, supply, trade, stocks, prices and
January 2018 Monthly Update North Dakota Pipeline Authority Justin J. Kringstad January 16, 2018
 January 2018 Monthly Update North Dakota Pipeline Authority Justin J. Kringstad January 16, 2018 US Williston Basin Oil Production - 2017 JJ Kringstad - North Dakota Pipeline Authority 2 Monthly Production
2015 Interim Results Announcement
 China Petroleum & Chemical Corporation 2015 Interim Results Announcement August 27, 2015 Hong Kong Cautionary Statement This presentation and the presentation materials distributed herein include forward-looking
2010 Interim Results Presentation. August 23, 2010 Hong Kong
 Sinopec Corp. 21 Interim Results Presentation August 23, 21 Hong Kong Disclaimer i This presentation and the presentation materials distributed herein include forwardlooking statements. All statements,
1. Introduction 2. Current Status of the Nigerian Oil. 1. Oil Industry Profile 2. Gas Industry Profile 3. Comparisons with Some Other.
 * PATHWAYS TO GROWTH From the inside pages: The bottom-line is that, if the refineries of NNPC are to operate sustainably at maximum capacity, it is imperative that they be granted a minimum level of autonomy
3Q 2016 Analyst Presentation
 3Q 2016 Analyst Presentation November 18, 2016 This presentation includes forward-looking statements. Actual future conditions (including economic conditions, energy demand, and energy supply) could differ
Sinopec Corp. Q Results Announcement. 29 October 2010
 Sinopec Corp. Q3 2010 Results Announcement 29 October 2010 Disclaimer i As required by the CSRC, financial statements of the third quarter of Sinopec Corp. (the Company ) were prepared under PRC Accounting
Industrial Commission Update. Justin J Kringstad Geological Engineer Director North Dakota Pipeline Authority
 Industrial Commission Update Justin J Kringstad Geological Engineer Director North Dakota Pipeline Authority January 24, 2018 US Williston Basin Oil Production - 2017 JJ Kringstad - North Dakota Pipeline
Operating Results Q Asian Insulators Public Company Limited
 Operating Results Q2-2010 Asian Insulators Public Company Limited 254 Seri Thai Road, Kannayaow, Bangkok 10230 Thailand http://www.asianinsulators.com Tel. (66) 0-2517-1451 Fax. (66) 0-2517-1465 E-mail
I.R. IRAN JODI OIL & JODI GAS
 I.R. IRAN JODI OIL & JODI GAS Data source for JODI-Oil questionnaire Crude oil NGL Other Total (1)+(2)+(3) (1) (2) (3) (4) + Production (NIOC)-Daily + From other sources Not Available + Imports Not Applicable
Downstream & Chemicals
 Downstream & Chemicals Pierre Breber Executive Vice President 017 Chevron Corporation Downstream portfolio Fuels refining & marketing Integrated value chains Lubricants & additives Globally positioned
B A K E R & O B R I E N
 B A K E R & O B R I E N I N C O R P O R A T E D Q3 : U. S. Refining Margins Remain Robust Special Topic: Domestic Light Oil Processing in the U.S. Gulf Coast Have We Hit the Limit? Houston, October 30,
Russian Petroleum Products (Limited Soft Offer) (Valid For 5 Days from the Day of Reception)
 (Valid For 5 Days from the Day of Reception)") SCO Code Reference: 2013/WGG/D2/JetFuel/Mazut/LPG/180/380/25k-150KMT 1 Russian Petroleum Products (Limited Soft Offer) (Valid For 5 Days from the Day of Reception) We, The Wright Global Group, LLC (WGG)
SCO Code Reference: 2013/WGG/D2/JetFuel/Mazut/LPG/180/380/25k-150KMT 1 Russian Petroleum Products (Limited Soft Offer) (Valid For 5 Days from the Day of Reception) We, The Wright Global Group, LLC (WGG)
Nove b m er 21, Yun K Kan g Jessie i Y Yoh
 Energy for tomorrow November 21, 2008 Yun Kang Jessie Yoh Industry Overview Company Overview Thesis Analysis Risks Q & A AGENDA WHY CONOCO? Leader in refining process provides natural hedge against falling
CONTENT. Introduction. INA Group at a glance. Overview of 2017 results. Core businesses. Exploration and Production. Refining and Marketing
 Company profile CONTENT Introduction 1 INA Group at a glance 2 Overview of 2017 results 4 Core businesses 6 Exploration and Production 6 Refining and Marketing 8 Consumer Services and Retail 10 Corporate
Methodology and specifications guide China Oil Analytics
 Methodology and specifications guide China Oil Analytics Latest update: March 2018 Scope of service 2 Contact us 2 Frequency of publication 2 Frequency of data updates 2 Data and analysis sources 2 Forecasting
Sales of Fossil Fuels Produced from Federal and Indian Lands, FY 2003 through FY 2013
 Sales of Fossil Fuels Produced from Federal and Indian Lands, FY 2003 through FY 2013 June 2014 Independent Statistics & Analysis www.eia.gov U.S. Department of Energy Washington, DC 20585 This report
Sinopec Corp s Net Profit for 9M 2018 Surges 52.7% Y-o-Y to RMB 60.1 billion
 Sinopec Corp s Net Profit for 9M 2018 Surges 52.7% Y-o-Y to RMB 60.1 billion Improved Performance in Four Core Business Segments with Remarkable Cost Savings and Efficiency Enhancement (30 October 2018,
Presentation to SANEC Technology as the core to progress. March 2014 Henk Dijkgraaf Berthold Breman
 Presentation to SANEC Technology as the core to progress March 2014 Henk Dijkgraaf Berthold Breman sasol at a glance An integrated energy and chemicals company with 33,000 employees worldwide The world
TANK BARGE OPPORTUNITIES RELATED TO CRUDE OIL PRODUCTION & MOVEMENT
 TANK BARGE OPPORTUNITIES RELATED TO CRUDE OIL PRODUCTION & MOVEMENT Third Edition A SPECIAL INDUSTRY STUDY Prepared by: November 2014 775 Ridge Lake Boulevard, Suite 400 ~ Memphis, Tennessee 38120-9403
2015 Annual Results Announcement
 China Petroleum & Chemical Corporation 2015 Annual Results Announcement March 30, 2016 Hong Kong Disclaimer This presentation and the presentation materials distributed herein include forward-looking statements.
PETROBRAS ARGENTINA S.A.
 PETROBRAS ARGENTINA S.A. Second Quarter 2015 Results Buenos Aires, July 30, 2015 Petrobras Argentina S.A. (Buenos Aires: PESA NYSE: PZE) announces the results for the second quarter ended June 30, 2015.
1H 2003 Financial Results (US GAAP)
") 1H 2003 Financial Results (US GAAP) October 2003 Crude Oil Production Growth bpd 1.52 1.50 1.48 1.46 1.44 1.42 1.40 Jan- 03 Daily crude production Feb- 03 Mar- 03 Apr- 03 May- 03 Jun- 03 Crude oil production*
1H 2003 Financial Results (US GAAP) October 2003 Crude Oil Production Growth bpd 1.52 1.50 1.48 1.46 1.44 1.42 1.40 Jan- 03 Daily crude production Feb- 03 Mar- 03 Apr- 03 May- 03 Jun- 03 Crude oil production*
ASPHALT SUPPLY IN A VOLATILE OIL WORLD
 ASPHALT SUPPLY IN A VOLATILE OIL WORLD Bill Haverland ConocoPhillips Baxter Burns Ergon CRUDE OIL SUPPLY A WORLD LOOK Crude Oil Supply (2006) World Crude Oil Production Millions of Barrels Per Day FSU/E.
Financial Results 4 th Quarter, 2007
 February 29, 2008 Financial Results 4 th Quarter, 2007 1/32 Content 2007 Operating and Financial Highlights 4Q07 Main Highlights Upstream Downstream International Trade Financial Results Other Relevant
OPEC PRIMARY ENERGY CONSUMPTION IN 2005 (1)
") CHAPTER 4 I n 1384, political tensions in the Middle East and some oil-producing countries, sabotage in Iraq s oil industry and speculation in the market raised oil prices incrementally. As of the beginning
CHAPTER 4 I n 1384, political tensions in the Middle East and some oil-producing countries, sabotage in Iraq s oil industry and speculation in the market raised oil prices incrementally. As of the beginning
Analyst Presentation 1Q 2008 Results
 Analyst Presentation 1Q 2008 Results 0 Contents Section 1: Section 2: Section 3: Section 4: Section 5: Company Overview IPO Update Operating Performance Consolidated Financial Performance Dividend Update
Downstream Petroleum Sector The Growing Prominence of Asian Refining
 Downstream Petroleum Sector The Growing Prominence of Asian Refining Mr. Fahad Al-Dihani Deputy CEO,MAA Refinery, Kuwait National Petroleum Company-Kuwait Outline.. Global refining trends Kuwait s Position
OIL SUPPLY / DEMAND REPORT OIL SUPPLY/DEMAND REPORT FY 2016
 OIL SUPPLY / DEMAND REPORT OIL SUPPLY/DEMAND REPORT FY 2016 SUPPLY Inventory December 2016 actual crudes and petroleum products inventory closed at 20,742 thousand barrels (MB) or 51-day supply equivalent;
Fuel Focus. Understanding Gasoline Markets in Canada and Economic Drivers Influencing Prices. Volume 10, Issue 4
 Fuel Focus Understanding Gasoline Markets in Canada and Economic Drivers Influencing Prices Volume 1, Issue 4 March, Copies of this publication may be obtained free of charge from: Natural Resources Canada
An Overview on Pakistan Refining Industry
 An Overview on Pakistan Refining Industry May 2018 Oil 000' mln tonnes World Crude Oil Reserves 120,000 240,000 Largely sustained level of reserves 90,000 225,000 Middle east Contributes ~48% 60,000 210,000
Emerging Trends in Petroleum Markets
 Emerging Trends in Petroleum Markets For Defense Logistics Agency, Worldwide Energy Conference Washington, D.C. By T. Mason Hamilton, Petroleum Markets Analyst U.S. Energy Information Administration Independent
1997 SECOND QUARTER REPORT
 28 July 1997 1997 SECOND QUARTER REPORT Second Quarter Highlights: The following results were achieved compared with the 1996 second quarter: Sales revenue increased by 4.0% to $194.9 million Sales volume
Petroleum Planning & Analysis Cell
 MONTHLY REPORT ON INDIGENOUS CRUDE OIL PRODUCTION, IMPORT AND PROCESSING & PRODUCTION, IMPORT AND EXPORT OF PETROLEUM PRODUCTS September 2018 Petroleum Planning & Analysis Cell (Ministry of Petroleum &
Annual Oil Questionnaire Overview. Joint IEA, ESCWA and RCREEE National Workshop on Energy Statistics Cairo, Egypt 27 April 01 May 2014
 Annual Oil Questionnaire Overview Joint IEA, ESCWA and RCREEE National Workshop on Energy Statistics Cairo, Egypt 27 April 01 May 2014 Annual Oil Questionnaire Why are oil statistics important? The IEA/Eurostat/UNECE
Oil & natural gas extraction data
 1 2 3 4 5 6 7 8 9 10 11 12 13 14 15 16 17 19 20 21 22 23 24 26 27 28 29 30 31 32 33 34 35 36 37 38 39 40 41 42 43 44 45 46 47 48 49 50 51 52 53 54 55 56 57 58 59 60 61 62 63 64 65 66 67 68 69 70 71 72
Environmental Expenditures. by the U.S. Oil and Natural Gas Industry
 Environmental Expenditures by the U.S. Oil and Natural Gas Industry 990 207 The industry has spent $,045 on the environment for every man, woman and child in the United States. About This Report Expenditures
Ready Reckoner Snapshot of India s Oil & Gas data March, 2014 Petroleum Planning & Analysis Cell
 Ready Reckoner Snapshot of India s Oil & Gas data March, 2014 Petroleum Planning & Analysis Cell (Ministry of Petroleum & Natural Gas) 0 Index of Tables Table Description Page 1. Selected Indicators of
Burnaby Terminal Facility Overview
 Burnaby Terminal Facility Overview February 24, 2016 Presenter: Richard Spence Table of Contents Topic Slide No. Terminal Information 3 Organizational Structure 4 Terminal Layout 5 Terminal Information
The Alliance October 23, 2008
 The Alliance October 23, 2008 Energy Security Erec Isaacson Vice President, Commercial Assets ConocoPhillips Alaska, Inc. Cautionary Statement FOR THE PURPOSES OF THE SAFE HARBOR PROVISIONS OF THE PRIVATE
RESULTS FOR Q ANALYST TELECONFERENCE
 RESULTS FOR Q4 216 ANALYST TELECONFERENCE Market 1 2 Operation Financials 3 Market 1 216 Fourth Quarter Market Conditions Product Market Crude Oil Postponed Maintenances Started to take place High Agricultural
Hubungi Kami : Study on Prospect and Market Opportunity of OIL & NATURAL GAS in Indonesia, Please send us. copy(ies) Position :
 Position :") Hubungi Kami 021 31930 108 021 31930 109 021 31930 070 marketing@cdmione.com T he glory period of Indonesian oil industry occurred in 1977 1992 with average production of 1.5 million barrels per day. The
Hubungi Kami 021 31930 108 021 31930 109 021 31930 070 marketing@cdmione.com T he glory period of Indonesian oil industry occurred in 1977 1992 with average production of 1.5 million barrels per day. The
PAKISTAN ENERGY CONFERENCE 2016
 PAKISTAN ENERGY CONFERENCE 2016 PAKISTAN ENERGY MIX Pakistan s Annual GDP growth 4.2% in 2014-15 Pakistan s Energy Mix During FY14-15 Hydro, Nuclear & Others, 13.40% Coal, 5.40% LPG, 0.50% Gas, 46.30%
North American Energy Roundtable: Panel 1
 University of Nevada, Las Vegas Digital Scholarship@UNLV North American Energy Roundtable North American Energy Roundtable Mar 27th, 8:45 AM - 10:00 AM North American Energy Roundtable: Panel 1 Ricardo
Petroleum Planning & Analysis Cell
 MONTHLY REPORT ON INDIGENOUS CRUDE OIL PRODUCTION, IMPORT AND PROCESSING & PRODUCTION, IMPORT AND EXPORT OF PETROLEUM PRODUCTS May 2018 Petroleum Planning & Analysis Cell (Ministry of Petroleum & Natural
Fuel Focus. Understanding Gasoline Markets in Canada and Economic Drivers Influencing Prices. Issue 24, Volume 8
 Fuel Focus Understanding Gasoline Markets in Canada and Economic Drivers Influencing Prices Issue 24, Volume 8 December, Copies of this publication may be obtained free of charge from: Natural Resources
Oil and Gas Law in Nigeria simplified
 Oil and Gas Law in Nigeria simplified Yinka Omorogbe MALTHQUSE PRESS LTD Lagos, Benin, Ibadan, Jos, Oxford Contents Topic I: Introduction to the course Introduction Petroleum The importance of petroleum
2. Regional Analysis... 4
 Sub-Saharan Africa Oil and Gas and Opportunities for Manufacturing Suppliers 目次 Introduction... 1 1.1 Opportunities for international manufacturers... 1 1.2 Objectives and structure of this report... 2
Continued strong performance in key businesses
 Continued strong performance in key businesses SECOND QUARTER PRELIMINARY RESULTS August 9, Disclaimer "This presentation and the associated slides and discussion contain forward-looking statements. These
Annual Oil Statistics
 Annual Oil Statistics Oil Questionnaire Overview Energy Statistics Training International Energy Agency Ana-Luisa Sao Marcos Annual Oil Statistician Share of oil in Total Primary Energy Supply share of
Financial Highlights:
 Sinopec Achieves Operating Profit RMB35.1 Billion in 1H2016 Integrated Value Chain Exerts Greater Benefits, Downstream Businesses Ensures Profit Stability (28 August 2016, Beijing, China) China Petroleum
PETROBRAS ARGENTINA S.A.
 PETROBRAS ARGENTINA S.A. Fiscal Year 2014 Results Buenos Aires, February 4, 2015 Petrobras Argentina S.A. (Buenos Aires: PESA NYSE: PZE) announces the results for fiscal year ended December 31, 2014. Petrobras
PETRÓLEOS MEXICANOS 3_ PEMEX Anuario Estadístico 2005
 PETRÓLEOS MEXICANOS 3_PEMEX Anuario Estaístico 2005 SUMMARY OF OPERATING STATISTICS Change 2004 over 2003 1994 1995 1996 1997 1998 1999 2000 2001 2002 2003 2004 (%) Prouction (thousan barrels aily) Liqui
For Region 5 and Region 7 Regional Response Teams Meeting April 22, 2015 St. Charles, Missouri via video/teleconference
 For Region 5 and Region 7 Regional Response Teams Meeting St. Charles, Missouri via video/teleconference By Grant Nülle, Upstream Oil & Gas Economist, Exploration and Production Analysis Team U.S. Energy
AN ECONOMIC AND ENVIRONMENTAL ASSESSMENT OF EASTERN CANADIAN CRUDE OIL IMPORTS
 Study No. 167 CANADIAN ENERGY RESEARCH INSTITUTE AN ECONOMIC AND ENVIRONMENTAL ASSESSMENT OF EASTERN CANADIAN CRUDE OIL IMPORTS Canadian Energy Research Institute Relevant Independent Objective An Economic
1. Introduction and Summary
 Calculating Gasoline RVP Seasonal Change Giveaway Economics 1. Introduction and Summary A. Barsamian, L.E. Curcio Refinery Automation Institute, LLC Tel: +1-973-644-2270 Email: jabarsa@refautom.com US
Chemical and Petrochemical Opportunities in Iran
 Chemical and Petrochemical Opportunities in Iran by Mohammad Reza Ghasemian Managing Director of Chemicalways LLC. Greece Oct 2015 In cooperation with Best Land to produce Petrochemicals in ME Natural
Cosmo Oil Co., Ltd. Presentation on Results for First Quarter of Fiscal 2012 August 2, 2012 Director: Satoshi Miyamoto
 Cosmo Oil Co., Ltd. Presentation on Results for First Quarter of Fiscal 2012 August 2, 2012 Director: Satoshi Miyamoto Copyright 2012 COSMO OIL CO.,LTD. All Rights Reserved. Key Points of Financial Results
SUPPLY CHAIN PERSPECTIVE
 SUPPLY CHAIN PERSPECTIVE FUEL Overview Australia s economy is built on key industries that rely heavily on fuel consumption. This report deals with fuel as it is processed from crude oil to refined petroleum
Ministry of Petroleum & Minerals SUDAN. Oil and Gas Current and Future Projects and Plan
 Ministry of Petroleum & Minerals SUDAN Oil and Gas Current and Future Projects and Plan Mr. Adil Abbkar Abdalla Oil Exploration & Production Authority Ministry of Petroleum & Minerals SUDAN 1 1 Outlines
Canada s Refining Industry Sector Performance Report
 Canada s Refining Industry 217 Sector Performance Report The Canadian Fuels Association represents the industry that produces, distributes and markets petroleum products in Canada including 95 percent
INA Group - Results and activities in 2017
 INA Group - Results and activities in Zagreb, February 2018 INA GROUP: HIGHER EBITDA REFLECTS IMPROVED PRICE ENVIRONMENT AND INTERNAL EFFICIENCY IMPROVEMENTS INA Group performance Financial indicators
KIRBY CORPORATION ANNOUNCES 2017 FIRST QUARTER RESULTS first quarter earnings per share of $0.51 compared with $0.71 in the 2016 first quarter
 KIRBY CORPORATION FOR IMMEDIATE RELEASE Contact: Brian Carey 713-435-1413 KIRBY CORPORATION ANNOUNCES 2017 FIRST QUARTER RESULTS 2017 first quarter earnings per share of $0.51 compared with $0.71 in the
World crude oil exports by country, thousand barrels daily
 World crude oil exports by country, 2002 thousand barrels daily Saudi Arabia 5 285 Former USSR 3 940 Norway 3 113 Iran 2 094 Nigeria 1 798 United Kingdom 1 746 Mexico 1 715 United Arab Emirates 1 614 Venezuela
Downstream & Chemicals
 Downstream & Chemicals Mark Nelson Executive Vice President Downstream & chemicals portfolio Fuels refining & marketing Focused, regional optimization Petrochemicals Advantaged feed, scale and technology
American Petroleum Institute Dickinson Chapter. Justin J Kringstad Geological Engineer Director North Dakota Pipeline Authority
 American Petroleum Institute Dickinson Chapter Justin J Kringstad Geological Engineer Director North Dakota Pipeline Authority February 27, 2018 JJ Kringstad - North Dakota Pipeline Authority 2 Presentation
CONSOLIDATED FINANCIAL RESULTS OF THE UNIMOT GROUP 3Q 2017
 CONSOLIDATED FINANCIAL RESULTS OF THE UNIMOT GROUP 3Q 2017 1 PRESENTATION AGENDA Key 3Q 2017 events Financial results of the UNIMOT Group Market overview Business segments New projects Financial indicators
Pacific Fuel Price Monitor
 Pacific Fuel Price Monitor APRIL JUNE 2014 (Q2 2014) WHAT S INSIDE 1. Pacific fuel price monitor at a glance 2. Regional retail fuel prices (including taxes and duty) 3. Unleaded motor gasoline (mogas)
Weekly Statistical Bulletin
 API 1220 L Street, NW Washington, DC 20005 Weekly Statistical Bulletin STATISTICS DEPARTMENT Volume: 93 Number: 35 Week Ending: August 31, 2012 SUMMARY (In thousands of 42-gallon barrels per day, except
Petroleum Planning & Analysis Cell
 MONTHLY REPORT ON INDIGENOUS CRUDE OIL PRODUCTION, IMPORT AND PROCESSING & PRODUCTION, IMPORT AND EXPORT OF PETROLEUM PRODUCTS November 2017 Petroleum Planning & Analysis Cell (Ministry of Petroleum &
Global Aluminum-Nickel Catalyst Market (By Type, By End- Use Industry, By Region, By Country): Opportunities and Forecasts ( )
: Opportunities and Forecasts ( )") Global Aluminum-Nickel Catalyst Market (By Type, By End- Use Industry, By Region, By Country): Opportunities and Forecasts (2016-2021) By Type (Activated and Non-Activated) By End-User Industry (Refinery,
Global Aluminum-Nickel Catalyst Market (By Type, By End- Use Industry, By Region, By Country): Opportunities and Forecasts (2016-2021) By Type (Activated and Non-Activated) By End-User Industry (Refinery,
24 July Fuel Quality Review Marsden Jacob. Dear Sir or Madam
 IOR ENERGY PTY LTD ABN: 60 010 504 444 39 Byron Street Bulimba Brisbane 4171 Australia Telephone: (61) 7 3895 4444 Facsimile: (61) 7 3395 7902 Email: mail@ior.com.au 24 July 2015 Fuel Quality Review Marsden
Shareholders Agreement 49% RIPIANO HOLDING LTD 99% License holder of Sosnovskoe oil field Yuzhno-Tyebukskoe oil field
 March 2015 Corporate structure British Virgin Islands KARAVADOS LTD Shareholders Agreement PETROGRAND AB 100% Sweden SONOYTA LTD Cyprus 51% 49% Cyprus RIPIANO HOLDING LTD 100% 1% DINYU LLC 99% CNPSEI LLC
Statistical Data in Japan
 Statistical Data in Japan Trends in LP Gas Supply Patterns 20,000 18,832 18,198 18,140 17,905 18,079 17,454 7454 Domestic Production 25.9% 74.1% Import Ratio of Import and Domestic Production 20,000 1,000
INTRODUCTION Enabling Iran s Future Through Partnership and Technology
 UOP Olefins Seminar; Efficient Monetization of Natural Gas and LPG UOP Limited Nigel Orchard December 2016 INTRODUCTION Enabling Iran s Future Through Partnership and Technology UOP Creates Knowledge for
The Impact on Québec s Budget Balance
 ISSN 1715-2682 Volume 1, no. 2 August 17, 2005 Higher Fuel Prices The Impact on Québec s Budget Balance Summary 1. The increase in the price of gasoline at the pump since 1999 is due primarily to the soaring
The Petrochemical Industry From Middle Eastern Perspective?
 The Petrochemical Industry From Middle Eastern Perspective? Hydrocarbon Journey in Kuwait 1946 ENTERING CRUDE EXPORT MARKET 1949 FIRST REFINERY COMMISSIONED 1938 1 st COMMERCIAL OIL DISCOVERY 1963 AMMONIA
Ready Reckoner Snapshot of India s Oil & Gas data July, 2014 Petroleum Planning & Analysis Cell
 Ready Reckoner Snapshot of India s Oil & Gas data July, 2014 Petroleum Planning & Analysis Cell (Ministry of Petroleum & Natural Gas) 0 Index of Tables Table Description Page Highlights 2 1. Selected Indicators
Q Analyst Teleconference. 9 August 2018
 9 August 218 Disclaimer This presentation contains forward-looking statements that reflect the Company management s current views with respect to certain future events. Although it is believed that the
refining PEMEX S business unit dedicated to the REFINING of crude oil
 refining REFINERY PRODUCTION (thousands barrels per day) 2002 Gasolines 398 Fuel Oil 450 Diesel 267 Jet Fuel 57 DOMESTIC SALE (thousands barrels per day) 2002 Gasolines 566 Fuel Oil 406 Diesel 271 Jet
Contents At a Glance. Key Figures. Domestic Operations. International Operations. Saudi Aramco by the Numbers
 FACTS & FIGURES '09 Contents 02 Key Figures 04 2009 At a Glance 11 Domestic Operations 12 International Operations 14 Saudi Aramco by the Numbers Copyright 2010, Saudi Aramco. All rights reserved. Saudi
02/02/2011
 www.fundamentalpetroleumtrends.com 2/2/211 WEEKLY GASOLINE FUNDAMENTAL-PRICE-BASIS OUTLOOK A Fundamental Petroleum Trends Weekly Report Lehi German Tel: 816..98 www.fundamentalpetroleumtrends.com Wednesday,
Market Report Series: Oil 2018 Analysis & Forecasts to Energy Community 10 th Oil Forum, Belgrade, 25 September 2018
 Market Report Series: Oil 218 Analysis & Forecasts to 223 Energy Community 1 th Oil Forum, Belgrade, 25 September 218 Short term update: crude prices (excl. WTI) up strongly Aug/Sep $/bbl 8 Benchmark Crude
9M 2003 Financial Results (US GAAP)
") 9M Financial Results (US GAAP) January 2004 LUKOIL Group Crude Oil Production* mln tonnes 82 80 78 76 74 72 70 68 66 64 Crude oil production 3.2 5.5 3.9 76.8 70.3 71.3 2001 Production by subsidiaries Share
9M Financial Results (US GAAP) January 2004 LUKOIL Group Crude Oil Production* mln tonnes 82 80 78 76 74 72 70 68 66 64 Crude oil production 3.2 5.5 3.9 76.8 70.3 71.3 2001 Production by subsidiaries Share
ASTRA AGRO LESTARI PT (AALI IJ) BHINNEKA INVESTMENT GROUP
 BHINNEKA INVESTMENT GROUP") 1-Nov-16 1-Dec-16 1-Jan-17 1-Feb-17 1-Mar-17 1-Apr-17 1-May-17 1-Jun-17 1-Jul-17 1-Aug-17 1-Sep-17 1-Oct-17 ASTRA AGRO LESTARI PT (AALI IJ) BHINNEKA INVESTMENT GROUP PT Astra Agro Lestari Tbk operates
1-Nov-16 1-Dec-16 1-Jan-17 1-Feb-17 1-Mar-17 1-Apr-17 1-May-17 1-Jun-17 1-Jul-17 1-Aug-17 1-Sep-17 1-Oct-17 ASTRA AGRO LESTARI PT (AALI IJ) BHINNEKA INVESTMENT GROUP PT Astra Agro Lestari Tbk operates