Annual Oil Statistics
|
|
|
- Darleen Daniel
- 5 years ago
- Views:
Transcription

1 Annual Oil Statistics Oil Questionnaire Overview Energy Statistics Training International Energy Agency Ana-Luisa Sao Marcos Annual Oil Statistician

2 Share of oil in Total Primary Energy Supply share of oil in TPES remains the biggest
3 Oil Questionnaire Collecting Reporting Disseminating
4 Annual Oil Questionnaire Collecting the Data from Different Sources IEA Processing Data Verification of the questionnaire Disseminating Data


5 Data Collection Cycle Year Year+1 Year+2 DATA COLLECTION PROCESS DATA PUB COUNTRY IEA x34
6 Collecting Data National Authority
7 Multiple Companies National Authority IEA/ESTAT/UNSD
8 Annual Oil Questionnaire Collecting the Data from Different Sources IEA Processing Data Verification of the questionnaire Disseminating Data
9 Table 1 Questionnaire Structure Table 2A & 2B Table 3

10 Year & Country Table 1 Supply of Crude Oil, NGL, Refinery Feedstocks, Additives and Others
11 Table 1 1. Crude Oil A mineral oil of natural origin comprising a mixture of hydrocarbons and associated impurities. It exists in the liquid phase under normal surface temperature and pressure and its physical characteristics. 2. Natural Gas Liquids (NGL) Liquid or liquefied hydrocarbons recovered from natural gas in separation facilities or gas processing plants. 3. Refinery Feedstocks Processed oil destined for further processing. 4. Additives/Oxygenates Non-hydrocarbon compounds added to or blended to modify fuel properties. 5. Other Hydrocarbons Synthetic crude oil.

12 Crude, NGL & Feedstocks Flows From Other Sources Exports Direct Use Stock Change Production Refinery Imports Backflows from Petrochemical Industry Products Transferred
13 Table 2A and 2B Table 2A & 2B

14 Table 2A Supply of Finished Products
15 Supply of Finished Products IEA data collection Refinery Gas Ethane LPG Naphtha Motor Gasoline Aviation Gasoline Gasoline Type Jet Fuel Kerosene Type Jet Fuel Other Kerosene Gas/Diesel Oil Fuel Oil White Spirit and SBP Lubricants Bitumen Paraffin Waxes Petroleum Coke Other Oil Products Lighter molecules Transport Diesel Heating and Other Gasoil Low Sulphur Fuel Oil High Sulphur Fuel Oil Heavier molecules


16 Oil Product Flow Chart Refinery Fuel International Marine Bunkers Exports Products Transferred Gross Output Inland Deliveries Refinery Crude Oil Primary Products Receipts Recycled Products Imports Interproduct Transfers Stock Change


17 Table 2B: Petrochemical Flows Refinery INLAND DELIVERY Petrochemical plant Fertilisers Plastics Feedstock - Ethane - Naphtha - LPG - Gas/Diesel Oil - Other Non Energy Use Synthetic rubber and fiber Pesticides PETROCHEMICAL BACKFLOWS (e.g. pyrolysis gasoline)

18 Table 3 Table 3
19 Table 3: Gross Deliveries by Sector Transformation Sector Energy Sector Distribution Loss Transport Sector Gross Inland Deliveries Total Final Consumption Industry Sector Residential Commercial Agriculture Fishing Etc
20 Transformation & Energy Sectors GROSS INLAND DELIVERIES (1) TOTAL TRANSFORMATION SECTOR Main Activity Producer Electricity Plants (2) Autoproducer Electricity Plants (3) Main Activity Producer CHP Plants (2) Autoproducer CHP Plants (3) Main Activity Producer Heat Plants (2) Autoproducer Heat Plants (3) Gas Works (Transformation) Blended Natural Gas Coke Ovens (Transformation) Blast Furnaces Petrochemical Industry Patent Fuel Plants Non Specified (Transformation) TOTAL ENERGY SECTOR Coal Mines Oil and Gas Extraction Coke Ovens (Energy) Blast Furnaces Gas Works (Energy) Power Plants Non Specified (Energy) Quantities of fuel that will be use to produce another energy form Main activity producers: all fuel used for all production Autoproducers: all fuel used for all electricity produced and fuel used for heat sold only Quantities of fuel that will be consumed to support the oil and gas extraction or the transformation activity Distribution Losses
21 Final Consumption FINAL CONSUMPTION TOTAL TRANSPORT SECTOR International Aviation Domestic Aviation Road Rail Domestic Navigation Pipeline Transport Non Specified (Transport) TOTAL INDUSTRY SECTOR Iron and Steel Chemical (incl. Petrochemical) Non Ferrous Metals Non Metallic Mineral Products Transportation Equipment Machinery Mining and Quarrying Food, Beverages and Tobacco Pulp, Paper and Printing Wood and Wood Products Construction Textiles and Leather Non Specified (Industry) TOTAL OTHER SECTORS Commerce - Public Services Residential Agriculture/Forestry Fishing Non Specified (Other) Oil used for transport activity, regardless of the sector Breakdown International / Domestic Aviation is very important for the CO 2 calculation Oil used in support of primary activities Includes oil consumed for autoproducer heat that is not sold ISIC Oil used in other sectors Agriculture includes non-highway use in tractors
22 Gross Deliveries Gross Inland Deliveries Non- Energy Use
23 Of Which: Non-Energy Use is already included in Gross Deliveries Naphtha Gas / Diesel Oil Lubricant Bitumen Other Products Inland Demand Transf Energy Non-Energy Use Transport Industry Chemical Others Non- Energy Use Transport 300 Industry Chemical Others 10
24 Table 4 and 5 Table 4 Country of Origin for 102 countries Table 5 Country of Destination for 94 countries Crude Oil, NGL, Additives: country of ultimate origin Refinery Feedstocks, Other Hydrocarbons: country of last consignment
25 Annual Oil Questionnaire Collecting the Data from Different Sources IEA Processing Data Verification of the questionnaire (brief overview) Disseminating Data
26 Verification of the questionnaire Data are loaded into IEA databases and verified Arithmetically Aggregates LS Fuel Oil + HS Fuel Oil = Fuel Oil Stock Change = Opening - Closing stock levels No breaks in stock levels Opening = Closing of Previous Year Internal consistency e.g. Total imports by origin = Imports on Supply report Comparison with National Publications
27 Gross Refinery Output Indigenous Production (+) 1 Other Sources (+) 2 Backflows from Petrochemical Industry (2) (+) 3 Products Transferred (3) (+) 4 Total Imports (4) (+) 5 Total Exports (5) (-) 6 Direct Use (includes transfers to consumption) (6) (-) 7 Stock Change (+ or -) (7) (+) 8 REFINERY INTAKE (Calculated) (sum of 1 to 8) (=) 9 Statistical Difference (+ or -) (9 minus 11) (-) 10 REFINERY INTAKE (Observed) (=) 11 MEMO ITEMS: Table 1 Refinery Losses 12 Crude Oil Natural Gas Liquids Refinery Feedstocks Additives (1)/ Oxygenates Of which Biofuels (1) Other Hydrocarbons TOTAL (A to F, excl. E) A B C D E F G Table 2A Primary Product Receipts (2) (+) 1 Gross Refinery Output (3) (including refinery fuel) (+) 2 Recycled Products (+) 3 Refinery Fuel (-) 4 Total Imports (4) (+) 5 Total Exports (5) (-) 6 Intl. Marine Bunkers (-) 7 Interproduct Transfers (6) (+ or -) (+) 8 Products Transferred (7) (-) 9 Stock Change (+ or -) (8) (+) 10 GROSS INLAND DELIVERIES (Calculated) (=) 11 Statistical Difference (9) (-) 12 GROSS INLAND DELIVERIES (Observed) (=) 13 TOTAL (A to W excl. H,N) X Gr. Ref. Output Ref. Intake Ref. Losses 200
28 Table 2A Table 1 Table 3 Direct Use/ Primary Product Receipts Crude Oil Addit./ Oxygen. Motor Gasoline Indigenous Production Imports Exports 600 Direct Use Stock Change NGL Ethane LPG Refinery Intake Primary Product Receipts Interproduct Transfers Gross Inland Deliveries Inland Demand Public Electricity Plants Road Sector Chemical Sector
29 Total Imports and Exports Table 1 Indigenous Production (+) 1 Other Sources (+) 2 Backflows from Petrochemical Industry (2) (+) 3 Products Transferred (3) (+) 4 Total Imports (4) (+) 5 Total Exports (5) (-) 6 Direct Use (includes transfers to consumption) (6) (-) 7 Stock Change (+ or -) (7) (+) 8 REFINERY INTAKE (Calculated) (sum of 1 to 8) (=) 9 Statistical Difference (+ or -) (9 minus 11) (-) 10 REFINERY INTAKE (Observed) (=) 11 Crude Oil Natural Gas Liquids Refinery Feedstocks Additives (1)/ Oxygenates Of which Biofuels (1) Other Hydrocarbons TOTAL (A to F, excl. E) A B C D E F G Table 4: Imports by Origin row 104 Table 5: Exports by Destination row 104 Crude Oil, NGL, Additives: country of ultimate origin Refinery Feedstocks, Other Hydrocarbons: country of last consignment
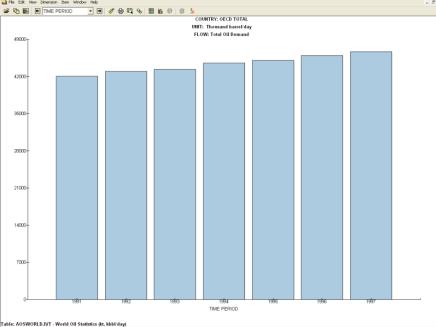
30 kilo tonnes Intra-fuel comparison 445 Electricity vs. oil inputs into electricity plants AOS ELE Year
31 Main Problems Timeliness Breaks in time series Statistical Differences Negative Refinery Losses Trade (submissions sometimes very different from one country to another) Inconsistencies between Questionnaires
32 oct.-07 janv.-08 avr.-08 juil.-08 oct.-08 janv.-09 avr.-09 juil.-09 oct.-09 janv.-10 avr.-10 juil.-10 oct.-10 janv.-11 avr.-11 kilo tonnes Breaks in time series Crude Oil Stock

33 Inconsistency between AOS & MOS
34 Annual Oil Questionnaire Collecting the Data from Different Sources IEA Processing Data Verification of the questionnaire Disseminating Data

35 Accessing Oil Information


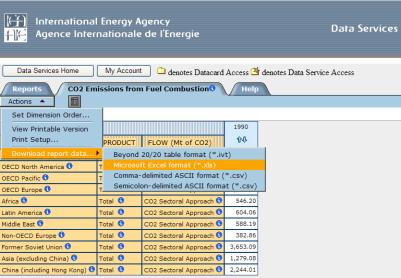
36 Accessing the Data Data Service Book
37 Thank you Tianlai Xu
Annual Oil Questionnaire Overview. Joint IEA, ESCWA and RCREEE National Workshop on Energy Statistics Cairo, Egypt 27 April 01 May 2014
 Annual Oil Questionnaire Overview Joint IEA, ESCWA and RCREEE National Workshop on Energy Statistics Cairo, Egypt 27 April 01 May 2014 Annual Oil Questionnaire Why are oil statistics important? The IEA/Eurostat/UNECE
The Oil Questionnaire
 The Oil Questionnaire TARES/IEA Energy Statistics Training Cairo, Oct. 20-23, 2014 Pierre Boileau International Energy Agency OECD/IEA 2010 Presentation overview Introduction Collecting data from different
The IEA oil data system
 The IEA oil data system Joint Rosstat- IEA Energy statistics workshop Moscow, Russia 14-17 February 2012 Mieke Reece Oil and Gas Statistics IEA Energy Data Centre OECD/IEA 2010 Timeliness The IEA Oil Data
Annex 2 Petroleum Products Sales Questionnaire Definitions
 Annex 2 Petroleum Products Sales Questionnaire Definitions Definition of Fuels 1. Liquefied Petroleum Gas or LPG LPG refers to liquefied propane (C3H8) and butane (C4Hl0) or mixtures of both. Commercial
I.R. IRAN JODI OIL & JODI GAS
 I.R. IRAN JODI OIL & JODI GAS Data source for JODI-Oil questionnaire Crude oil NGL Other Total (1)+(2)+(3) (1) (2) (3) (4) + Production (NIOC)-Daily + From other sources Not Available + Imports Not Applicable
1 E NERGY 1-2 STEP BY STEP CALCULATIONS 4 OF 16 MANUFACTURING INDUSTRIES AND CONSTRUCTION STEP 4 STEP 5 STEP 6. Carbon Stored (Gg C) (a)
 (a)") SUB CO 2 FROM FUEL COMBUSTION BY SOURCE CATEGORIES (TIER I) 4 OF 16 MANUFACTURING INDUSTRIES AND CONSTRUCTION STEP 4 STEP 5 STEP 6 G H I J K L Manufacturing Industries and Construction (a) (a) Net Carbon
SUB CO 2 FROM FUEL COMBUSTION BY SOURCE CATEGORIES (TIER I) 4 OF 16 MANUFACTURING INDUSTRIES AND CONSTRUCTION STEP 4 STEP 5 STEP 6 G H I J K L Manufacturing Industries and Construction (a) (a) Net Carbon
The Extended JODI Oil Questionnaire
 10 th Regional JODI Training Workshop 23-25 November 2014, Doha, Qatar The Extended JODI Oil Questionnaire Agnieszka Kościelniak International Energy Agency In JODI Oil - Simplified Primary Secondary Out
EUROSTAT INTERNATIONAL ENERGY AGENCY ORGANISATION FOR ECONOMIC CO-OPERATION AND DEVELOPMENT
 EUROSTAT INTERNATIONAL ENERGY AGENCY ORGANISATION FOR ECONOMIC CO-OPERATION AND DEVELOPMENT Paris, drafted: March 2012 - Or. English Ver 2012.1 Attached is the Monthly Oil and Gas questionnaire, which
ISSN Statistical books. Energy. Yearly statistics edition
 ISSN 1830-7833 Statistical books Energy Yearly statistics 2006 2008 edition Statistical books Energy Yearly statistics 2006 2008 edition Europe Direct is a service to help you find answers to your questions
As a result, the share of US in world industrial production should fall from 19.4% in 2012 to 18.5% by 2016 and decline to 17.6% by 2021.
 : Industry Overview GDP is expected to rise by 2.2% in 212 and expand by 2.1% in 213. Over the next 1 years to 221, GDP is predicted to grow on average by 2.8% a year. Manufacturing output growth is forecast
Energy Statistics in Malaysia. Workshop on Energy Statistics for ASEAN Countries November 2017 Kuala Lumpur, Malaysia
 Energy Statistics in Malaysia Workshop on Energy Statistics for ASEAN Countries 21 23 November 2017 Kuala Lumpur, Malaysia Outline Background Energy in Malaysia Standard Operating Procedures Data Collection
ANNUAL STATISTICAL SUPPLEMENT
 ANNUAL STATISTICAL SUPPLEMENT with 2016 data 2017 Edition This Statistical Supplement has been prepared to provide a longer historical perspective for the oil demand, supply, trade, stocks, prices and
S t a t i s t i c a l b o o k s. Energy. Yearly statistics edition
 S t a t i s t i c a l b o o k s Energy Yearly statistics 2005 2007 edition EuropEan Commission Europe Direct is a service to help you ind answers to your questions about the European Union Freephone number
Table 1 WORLD OIL SUPPLY AND DEMAND (million barrels per day)
") INTERNATIONAL ENERGY AGENCY - OIL MARKET REPORT TABLES TABLES Table 1 WORLD OIL SUPPLY AND DEMAND (million barrels per day) 2011 2012 1Q13 2Q13 3Q13 4Q13 2013 1Q14 2Q14 3Q14 4Q14 2014 1Q15 2Q15 3Q15 4Q15
INTERNATIONAL ENERGY AGENCY - OIL MARKET REPORT TABLES TABLES Table 1 WORLD OIL SUPPLY AND DEMAND (million barrels per day) 2011 2012 1Q13 2Q13 3Q13 4Q13 2013 1Q14 2Q14 3Q14 4Q14 2014 1Q15 2Q15 3Q15 4Q15
Table 1: World Oil Supply And Demand
 INTERNATIONAL ENERGY AGENCY - OIL MARKET REPORT TABLES Table 1 WORLD OIL SUPPLY AND DEMAND Table 1: World Oil Supply And Demand (million barrels per day) TABLES 2012 2013 1Q14 2Q14 3Q14 4Q14 2014 1Q15
Monthly Report on the Corporate Goods Price Index ( Preliminary Figures for June 2014 )
") Research and Statistics Department Bank of Japan Report on the Corporate Goods Price The Producer Price rose 0.2 percent from the previous. The Export Price (contract currency ) fell 0.1 percent from the
Research and Statistics Department Bank of Japan Report on the Corporate Goods Price The Producer Price rose 0.2 percent from the previous. The Export Price (contract currency ) fell 0.1 percent from the
1 The diagram shows the separation of petroleum into fractions. gasoline. petroleum Z. bitumen. What could X, Y and Z represent?
 1 The diagram shows the separation of petroleum into fractions. gasoline X Y petroleum Z bitumen What could X, Y and Z represent? 2 What is not the correct use for the fraction named? name of fraction
Table 8. Gross Domestic Product by Industrial Origin at Current Market Prices, (Rp. Billion)
") Table 8. Gross Domestic Product by Industrial Origin at Current Market Prices, 1997-2003 1. Agriculture, Forestry & Fishery 101,009 172,828 215,687 217,898 246,298 281,325 76,693 74,437 77,305 a. Farm
Table 8. Gross Domestic Product by Industrial Origin at Current Market Prices, 1997-2003 1. Agriculture, Forestry & Fishery 101,009 172,828 215,687 217,898 246,298 281,325 76,693 74,437 77,305 a. Farm
Table 1 WORLD OIL SUPPLY AND DEMAND (million barrels per day)
") INTERNATIONAL ENERGY AGENCY - OIL MARKET REPORT TABLES Table 1 WORLD OIL SUPPLY AND DEMAND (million barrels per day) 2004 2005 1Q06 2Q06 3Q06 4Q06 2006 1Q07 2Q07 3Q07 4Q07 2007 1Q08 2Q08 3Q08 4Q08 2008
INTERNATIONAL ENERGY AGENCY - OIL MARKET REPORT TABLES Table 1 WORLD OIL SUPPLY AND DEMAND (million barrels per day) 2004 2005 1Q06 2Q06 3Q06 4Q06 2006 1Q07 2Q07 3Q07 4Q07 2007 1Q08 2Q08 3Q08 4Q08 2008
ANNUAL STATISTICAL SUPPLEMENT
 ANNUAL STATISTICAL SUPPLEMENT with 2008 data 2009 Edition This Statistical Supplement has been prepared to provide a longer historical perspective for the oil demand, supply, trade, stocks, prices and
Petroleum Planning & Analysis Cell
 MONTHLY REPORT ON INDIGENOUS CRUDE OIL PRODUCTION, IMPORT AND PROCESSING & PRODUCTION, IMPORT AND EXPORT OF PETROLEUM PRODUCTS May 2018 Petroleum Planning & Analysis Cell (Ministry of Petroleum & Natural
CDP Technical Note: Fuel definitions. Climate Change Questionnaire 2018
 CDP Technical Note: Fuel definitions Climate Change Questionnaire 2018 Contents Introduction... 4 Solid fossil fuels... 5 Anthracite... 5 Asphalt... 5 Bitumen... 5 Bituminous coal... 5 Brown coal... 5
Monthly Report on the Corporate Goods Price Index ( Preliminary Figures for April 2014 )
") Research and Statistics Department Bank of Japan Report on the Corporate Goods Price The Domestic Corporate Goods Price rose 2.8 percent from the previous. The Export Price (contract currency ) fell 0.1
Research and Statistics Department Bank of Japan Report on the Corporate Goods Price The Domestic Corporate Goods Price rose 2.8 percent from the previous. The Export Price (contract currency ) fell 0.1
Table 1 TABLES INTERNATIONAL ENERGY AGENCY OIL MARKET REPORT 15 MAY
 INTERNATIONAL ENERGY AGENCY OIL MARKET REPORT TABLES Table 1 Table WORLD 1 - World OIL SUPPLY Oil Supply AND DEMAND and Demand (million barrels per day) 2010 2011 1Q12 2Q12 3Q12 4Q12 2012 1Q13 2Q13 3Q13
Petroleum Planning & Analysis Cell
 MONTHLY REPORT ON INDIGENOUS CRUDE OIL PRODUCTION, IMPORT AND PROCESSING & PRODUCTION, IMPORT AND EXPORT OF PETROLEUM PRODUCTS September 2018 Petroleum Planning & Analysis Cell (Ministry of Petroleum &
AL BADI TRADING OIL & GAS PRODUCTS LLC
 OIL & GAS PRODUCTS LLC AB TRADING COMPANY PROFILE WWW.ALBADIGROUP.COM 2018 Contents 03 Mission & Vision BUSINESS MODEL 04 Chairman s Message BUSINESS ACTIVITIES 05 PRODUCTS 06 PETROLEUM ACTIVITIES 07 TRADING
Monthly Report on the Corporate Goods Price Index ( Preliminary Figures for May 2018 )
") Research and Statistics Department Bank of Japan Report on the Corporate Goods Price Index The Producer Price Index rose 0.6 percent from the previous. The Export Price Index (contract currency ) rose
Research and Statistics Department Bank of Japan Report on the Corporate Goods Price Index The Producer Price Index rose 0.6 percent from the previous. The Export Price Index (contract currency ) rose
Monthly Report on the Corporate Goods Price Index ( Preliminary Figures for August 2014 )
") Research and Statistics Department Bank of Japan Report on the Corporate Goods Price The Producer Price fell 0.2 percent from the previous. The Export Price (contract currency ) rose 0.1 percent from the
Research and Statistics Department Bank of Japan Report on the Corporate Goods Price The Producer Price fell 0.2 percent from the previous. The Export Price (contract currency ) rose 0.1 percent from the
Fundamentals of Petroleum Refining Refinery Products. Lecturers: assistant teachers Kirgina Maria Vladimirovna Belinskaya Natalia Sergeevna
 Fundamentals of Petroleum Refining Refinery Products Lecturers: assistant teachers Kirgina Maria Vladimirovna Belinskaya Natalia Sergeevna 1 Refinery Products Composition There are specifications for over
World Oil Outlook A Perspective from OPEC
 World Oil Outlook A Perspective from OPEC Dr. Fuad Siala OPEC Secretariat Transport, Energy & Fuels Working Together for a Sustainable Future Brussels, Belgium May 8-1, 27 Energy demand by fuel type 18
WORLD OIL SUPPLY AND DEMAND (million barrels per day)
") INTERNATIONAL ENERGY AGENCY OIL MARKET REPORT TABLES TABLES Table 1 WORLD OIL SUPPLY AND DEMAND (million barrels per day) 2005 2006 1Q07 2Q07 3Q07 4Q07 2007 1Q08 2Q08 3Q08 4Q08 2008 1Q09 2Q09 3Q09 4Q09
INTERNATIONAL ENERGY AGENCY OIL MARKET REPORT TABLES TABLES Table 1 WORLD OIL SUPPLY AND DEMAND (million barrels per day) 2005 2006 1Q07 2Q07 3Q07 4Q07 2007 1Q08 2Q08 3Q08 4Q08 2008 1Q09 2Q09 3Q09 4Q09
Monthly Report on the Corporate Goods Price Index ( Preliminary Figures for November 2017 )
") Research and Statistics Department Bank of Japan Report on the Corporate Goods Price Index The Producer Price Index rose 0.4 percent from the previous. The Export Price Index (contract currency ) rose
Research and Statistics Department Bank of Japan Report on the Corporate Goods Price Index The Producer Price Index rose 0.4 percent from the previous. The Export Price Index (contract currency ) rose
Monthly Report on the Corporate Goods Price Index ( Preliminary Figures for July 2015 )
") Research and Statistics Department Bank of Japan Report on the Corporate Goods Price The Producer Price fell 0.2 percent from the previous. The index excluding extra charges for summer electricity fell
Research and Statistics Department Bank of Japan Report on the Corporate Goods Price The Producer Price fell 0.2 percent from the previous. The index excluding extra charges for summer electricity fell
CUSTOMS TARIFF - SCHEDULE. Chapter 27 MINERAL FUELS, MINERAL OILS AND PRODUCTS OF THEIR DISTILLATION; BITUMINOUS SUBSTANCES; MINERAL WAXES
 CUSTOMS TARIFF - SCHEDULE 27 - i Chapter 27 MINERAL FUELS, MINERAL OILS AND PRODUCTS OF THEIR DISTILLATION; BITUMINOUS SUBSTANCES; MINERAL WAXES Notes. 1. This Chapter does not cover: (a) Separate chemically
Gross Domestic Product 2014 Q4
 REPUBLIC OF RWANDA NATIONAL INSTITUTE OF STATISTICS OF RWANDA P.O.Box 6139 KIGALI - RWANDA Gross Domestic Product 2014 Q4 March 2015 I. Gross Domestic Product and its structure In the fourth quarter of
Harmonisation of Definitions of Energy Products and Flows
 Harmonisation of Definitions of Energy Products and Flows ON PRODUCTS IEA, Paris, 28-30 October 2008 Hierarchy of Products Coal Hard coal Anthracite Bituminous coal Coking coal Other bituminous coal Brown
Petroleum Planning & Analysis Cell
 MONTHLY REPORT ON INDIGENOUS CRUDE OIL PRODUCTION, IMPORT AND PROCESSING & PRODUCTION, IMPORT AND EXPORT OF PETROLEUM PRODUCTS February 2018 Petroleum Planning & Analysis Cell (Ministry of Petroleum &
Self-Assessor Carbon Levy Remitter Return INSTRUCTION GUIDE Climate Leadership Act
 Self-Assessor Carbon Levy Remitter Return INSTRUCTION GUIDE Climate Leadership Act Pursuant to the Climate Leadership Act, the Alberta carbon levy is effective January 1, 2017. Who Must Complete This Return
Monthly Report on the Corporate Goods Price Index ( Preliminary Figures for November 2018 )
") Research and Statistics Department Bank of Japan Report on the Corporate Goods Price Index The Producer Price Index fell 0.3 percent from the previous. The Export Price Index (contract currency ) fell
Research and Statistics Department Bank of Japan Report on the Corporate Goods Price Index The Producer Price Index fell 0.3 percent from the previous. The Export Price Index (contract currency ) fell
Monthly Report on the Corporate Goods Price Index ( Preliminary Figures for October 2014 )
") Research and Statistics Department Bank of Japan Report on the Corporate Goods Price The fell 0.8 percent from the previous. The index excluding extra charges for summer electricity fell 0.6 percent from
Research and Statistics Department Bank of Japan Report on the Corporate Goods Price The fell 0.8 percent from the previous. The index excluding extra charges for summer electricity fell 0.6 percent from
Monthly Report on the Corporate Goods Price Index ( Preliminary Figures for October 2017 )
") Research and Statistics Department Bank of Japan Report on the Corporate Goods Price Index FOR RELEASE 8:50 A.M. Monday, November 13, 2017 The Producer Price Index rose 0.3 percent from the previous. The
Research and Statistics Department Bank of Japan Report on the Corporate Goods Price Index FOR RELEASE 8:50 A.M. Monday, November 13, 2017 The Producer Price Index rose 0.3 percent from the previous. The
European Union, Trade in goods with Brazil
 European Union, Trade in goods with Brazil Table of Contents pg - Key Figures 2 - / 2017 2 - - AMA/NAMA product Groups 2 - - SITC product Groups 2 - - Top 5 - HS sections 2 - - Top 5 - SITC sections 2
Monthly Report on the Corporate Goods Price Index ( Preliminary Figures for January 2019 )
") Research and Statistics Department Bank of Japan Report on the Corporate Goods Price Index The Producer Price Index fell 0.6 percent from the previous. The Export Price Index (contract currency ) fell
Research and Statistics Department Bank of Japan Report on the Corporate Goods Price Index The Producer Price Index fell 0.6 percent from the previous. The Export Price Index (contract currency ) fell
European Union, Trade in goods with Israel
 Union, Trade in goods with Israel Table of Contents pg Union, Trade with Israel - Key Figures 2 - / 2017 2 - - AMA/NAMA product Groups 2 - - SITC product Groups 2 - - Top 5 - HS sections 2 - - Top 5 -
European Union, Trade in goods with Chile
 Union, Trade in goods with Chile Table of Contents pg Union, Trade with Chile - Key Figures 2 - / 2018 2 - - AMA/NAMA product Groups 2 - - SITC product Groups 2 - - Top 5 - HS sections 2 - - Top 5 - SITC
REFORMATE Crude Condensate Naphtha Ethane Reformate
 REFORMATE Crude The Crude Overview gives a summary of the daily price movements of the benchmark WTI (West Texas Intermediate) and Brent futures contracts on the NYMEX and IPE exchanges, detailing any
European Union, Trade in goods with Colombia
 Union, Trade in goods with Colombia Table of Contents pg Union, Trade with Colombia - Key Figures 2 - / 2015 2 - - AMA/NAMA product Groups 2 - - SITC product Groups 2 - - Top 5 - HS sections 2 - - Top
European Union, Trade in goods with Central America 6
 European Union, Trade in goods with Central America 6 Central America 6 Costa Rica, El Salvador, Guatemala, Honduras, Nicaragua, Panama Table of Contents pg - Key Figures 2 - / 2017 2 - - AMA/NAMA product
Monthly Report on the Corporate Goods Price Index ( Preliminary Figures for September 2017 )
") Research and Statistics Department Bank of Japan Report on the Corporate Goods Price Index The Producer Price Index rose 0.2 percent from the previous. The Export Price Index (contract currency ) rose
Research and Statistics Department Bank of Japan Report on the Corporate Goods Price Index The Producer Price Index rose 0.2 percent from the previous. The Export Price Index (contract currency ) rose
European Union, Trade in goods with Belarus
 Union, Trade in goods with Belarus Table of Contents pg Union, Trade with Belarus - Key Figures 2 - / 2017 2 - - AMA/NAMA product Groups 2 - - SITC product Groups 2 - - Top 5 - HS sections 2 - - Top 5
14.2 Fuels. Question Paper. Subject Chemistry (0620) Cambridge International Examinations (CIE) Organic Chemistry A* A B C D E U
 Cambridge International Examinations (CIE) Organic Chemistry A* A B C D E U") Save My Exams! The ome of Revision For more awesome GSE and level resources, visit us at www.savemyexams.co.uk/ 14.2 Fuels Question Paper Level IGSE Subject hemistry (0620) Exam oard ambridge International
Save My Exams! The ome of Revision For more awesome GSE and level resources, visit us at www.savemyexams.co.uk/ 14.2 Fuels Question Paper Level IGSE Subject hemistry (0620) Exam oard ambridge International
European Union, Trade in goods with New Zealand
 Union, Trade in goods with New Zealand Table of Contents pg Union, Trade with New Zealand - Key Figures 2 - / 2018 2 - - AMA/NAMA product Groups 2 - - SITC product Groups 2 - - Top 5 - HS sections 2 -
Monthly Report on the Corporate Goods Price Index ( Preliminary Figures for June 2018 )
") Research and Statistics Department Bank of Japan Report on the Corporate Goods Price Index The Producer Price Index rose 0.2 percent from the previous. The Export Price Index (contract currency ) was und
Research and Statistics Department Bank of Japan Report on the Corporate Goods Price Index The Producer Price Index rose 0.2 percent from the previous. The Export Price Index (contract currency ) was und
European Union, Trade in goods with Panama
 Union, Trade in goods with Panama Table of Contents pg Union, Trade with Panama - Key Figures 2 - / 2015 2 - - AMA/NAMA product Groups 2 - - SITC product Groups 2 - - Top 5 - HS sections 2 - - Top 5 -
European Union, Trade in goods with Malaysia
 European Union, Trade in goods with Malaysia Table of Contents pg - Key Figures 2 - / 2017 2 - - AMA/NAMA product Groups 2 - - SITC product Groups 2 - - Top 5 - HS sections 2 - - Top 5 - SITC sections
European Union, Trade in goods with Kuwait
 European Union, Trade in goods with Kuwait Table of Contents pg - Key Figures 2 - / 2017 2 - - AMA/NAMA product Groups 2 - - SITC product Groups 2 - - Top 5 - HS sections 2 - - Top 5 - SITC sections 2
European Union, Trade in goods with Peru
 European Union, Trade in goods with Peru Table of Contents pg - Key Figures 2 - / 2017 2 - - AMA/NAMA product Groups 2 - - SITC product Groups 2 - - Top 5 - HS sections 2 - - Top 5 - SITC sections 2 -
CUSTOMS TARIFF - SCHEDULE V - 1
 V - 1 Section V MINERAL PRODUCTS 27 - i Chapter 27 MINERAL FUELS, MINERAL OILS AND PRODUCTS OF THEIR DISTILLATION; BITUMINOUS SUBSTANCES; MINERAL WAXES Notes. 1. This Chapter does not cover: (a) Separate
European Union, Trade in goods with Tunisia
 European Union, Trade in goods with Tunisia Table of Contents pg - Key Figures 2 - / 2017 2 - - AMA/NAMA product Groups 2 - - SITC product Groups 2 - - Top 5 - HS sections 2 - - Top 5 - SITC sections 2
Petroleum Planning & Analysis Cell
 MONTHLY REPORT ON INDIGENOUS CRUDE OIL PRODUCTION, IMPORT AND PROCESSING & PRODUCTION, IMPORT AND EXPORT OF PETROLEUM PRODUCTS November 2017 Petroleum Planning & Analysis Cell (Ministry of Petroleum &
European Union, Trade in goods with Andean community 4
 European Union, Trade in goods with Andean community 4 Andean community 4 Bolivia, Colombia, Ecuador, Peru Table of Contents pg - Key Figures 2 - / 2017 2 - - AMA/NAMA product Groups 2 - - SITC product
European Union, Trade in goods with Senegal
 European Union, Trade in goods with Senegal Table of Contents pg - Key Figures 2 - / 2017 2 - - AMA/NAMA product Groups 2 - - SITC product Groups 2 - - Top 5 - HS sections 2 - - Top 5 - SITC sections 2
European Union, Trade in goods with Jordan
 European Union, Trade in goods with Jordan Table of Contents pg - Key Figures 2 - / 2017 2 - - AMA/NAMA product Groups 2 - - SITC product Groups 2 - - Top 5 - HS sections 2 - - Top 5 - SITC sections 2
Refinery Maze Student Guide
 Refinery Maze Student Guide Petroleum Refining Student Text Distillation In its crude form, petroleum is of little use to us. To make it into products we know and use, petroleum must be refined or separated
CONVERSION FACTORS. xix
 CONVERSION FACTORS The data which have been supplied by the countries in original units are converted to the common unit, terajoules (TJ), by using standard conversion factors or, in the case of solids,
Monthly Report on the Corporate Goods Price Index ( Preliminary Figures for February 2018 )
") Research and Statistics Department Bank of Japan Report on the Corporate Goods Price Index The Producer Price Index was und from the previous. The Export Price Index (contract currency ) rose 0.4 percent
Research and Statistics Department Bank of Japan Report on the Corporate Goods Price Index The Producer Price Index was und from the previous. The Export Price Index (contract currency ) rose 0.4 percent
European Union, Trade in goods with Venezuela
 European Union, Trade in goods with Venezuela Table of Contents pg - Key Figures 2 - / 2017 2 - - AMA/NAMA product Groups 2 - - SITC product Groups 2 - - Top 5 - HS sections 2 - - Top 5 - SITC sections
OIL INFORMATION DOCUMENTATION FOR BEYOND 2020 FILES
 OIL INFORMATION: BEYOND 2020 DOCUMENTATION - 1 OIL INFORMATION DOCUMENTATION FOR BEYOND 2020 FILES OIL INFORMATION: BEYOND 2020 DOCUMENTATION - I.3 TABLE OF CONTENTS PART I: SOURCES AND DEFINITIONS 1.
1 E NERGY. Data sources. Methodology. Completing the Worksheet
 1 E NERGY Operations of aircraft are divided into two parts: The Landing/Take-Off (LTO) cycle 4 which includes all activities near the airport that take place under the altitude of 914 metres (3000 feet).
OIL INFORMATION DOCUMENTATION FOR BEYOND 2020 FILES
 OIL INFORMATION: BEYOND 2020 DOCUMENTATION (2011 Edition) - 1 OIL INFORMATION DOCUMENTATION FOR BEYOND 2020 FILES OIL INFORMATION: BEYOND 2020 DOCUMENTATION (2011 Edition) - 3 TABLE OF CONTENTS PART I:
Methodology and specifications guide China Oil Analytics
 Methodology and specifications guide China Oil Analytics Latest update: March 2018 Scope of service 2 Contact us 2 Frequency of publication 2 Frequency of data updates 2 Data and analysis sources 2 Forecasting
DUBLIN PORT COMPANY PORT CHARGES GOODS. Operative: 1st January 2016
 DUBLIN PORT COMPANY PORT CHARGES ON GOODS Operative: 1st January 2016 GOODS RATES 1. The rates shown apply to all goods shipped, transhipped or unshipped. 2. Re-Exports In the case of Goods arriving at
Once a waste of lamp oil production
 Refinery All processes and activities described so far happened on the upstream side. he next step to convert crude to e.g. gasoline is happening on the downstream side in refineries. olie 1 Once a waste
GASOLINE TAX INFORMATION BULLETIN
 DEPARTMENT OF FINANCE TAX ADMINISTRATION DIVISION Bulletin No. RAA-GAS-002 Issue Date: May 5, 2017 GASOLINE TAX INFORMATION BULLETIN The Revenue Administration Act (RAA) imposes a tax upon gasoline consumed
REFINED PETROLEUM PRODUCTS JUNE 1964
 S CATALOGUE No. 45004 MONTNLY Irkal File Copy ' CANADA REFINED PETROLEUM PRODUCTS JUNE 1964 Published by Aufhordy of The Minister of Trade and Commerce DOMINION BUREAU OF STATISTICS Industry Division September
Conversion Processes 1. THERMAL PROCESSES 2. CATALYTIC PROCESSES
 Conversion Processes 1. THERMAL PROCESSES 2. CATALYTIC PROCESSES 1 Physical and chemical processes Physical Thermal Chemical Catalytic Distillation Solvent extraction Propane deasphalting Solvent dewaxing
Fig:1.1[15] Fig.1.2 Distribution of world energy resources. (From World Energy Outlook 2005, International Energy Agency.)[16,17]
![Fig:1.1[15] Fig.1.2 Distribution of world energy resources. (From World Energy Outlook 2005, International Energy Agency.)[16,17]](/thumbs/89/100738047.jpg "Fig:1.1[15] Fig.1.2 Distribution of world energy resources. (From World Energy Outlook 2005, International Energy Agency.)[16,17]") Introduction :Composition of petroleum,laboratory tests,refinery feedstocks and products Fig:1.1[15] Fig.1.2 Distribution of world energy resources. (From World Energy Outlook 2005, International Energy
Introduction :Composition of petroleum,laboratory tests,refinery feedstocks and products Fig:1.1[15] Fig.1.2 Distribution of world energy resources. (From World Energy Outlook 2005, International Energy
European Union, Trade in goods with ACP - Caribbean Countries
 Union, Trade in goods with ACP - Caribbean Countries ACP - Caribbean Countries Antigua and Barbuda, Bahamas, Barbados, Belize, Cuba, Dominica, Dominican Republic, Grenada, Guyana, Haiti, Jamaica, St Kitts
REFINED PETROLEUM PRODUCTS MAY 1964
 CATALOGUE No. 45004 S... MONTHLY Historical File Copy,' CANADA REFINED PETROLEUM PRODUCTS MAY 1964 5ANu OF STAllS' (C UG 6 4 PROPCJ( OF THE LIaRARY Published by Authority of The Minister of Trade and Commerce
European Union, Trade in goods with ACP - Caribbean Countries
 European Union, Trade in goods with ACP - Caribbean Countries ACP - Caribbean Countries Antigua and Barbuda, Bahamas, Barbados, Belize, Cuba, Dominica, Dominican Republic, Grenada, Guyana, Haiti, Jamaica,
REFINED PETROLEUM PRODUCTS
 Historical Copy.1 REFINED PETROLEUM PRODUCTS APRIL, 1958 L I DOMINION BUREAU OF STATISTICS 0V,efWp,TM OT THE Published by A u!hori!y of The Honourable Gordon Churchill, Minister of Trade and Commerce DOMINION
Monthly Report on the Corporate Goods Price Index ( Preliminary Figures for July 2018 )
") Research and Statistics Department Bank of Japan Report on the Corporate Goods Price FOR RELEASE 8:50 A.M. Friday, August 10, 2018 The Producer Price rose 0.5 percent from the previous. The index excluding
Research and Statistics Department Bank of Japan Report on the Corporate Goods Price FOR RELEASE 8:50 A.M. Friday, August 10, 2018 The Producer Price rose 0.5 percent from the previous. The index excluding
GLOBAL INTEGRATION AND CARBON FLOW IN EU AND REST OF THE WORLD: A 2-REGIONAL INPUT-OUTPUT FRAMEWORK
 GLOBAL INTEGRATION AND CARBON FLOW IN EU AND REST OF THE WORLD: A 2-REGIONAL INPUT-OUTPUT FRAMEWORK Amarendra Sahoo, Arjan de Koning, Reinout Heijungs Institute of Environmental Sciences (CML) Leiden University
REFINED PETROLEUM PRODUCTS
 I. CATALOGUE No. 45004 MONTHLY Histarical File Copy CAN A PA REFINED PETROLEUM PRODUCTS MARCH 1965 iit.mlau OF STA1STICS JUU!'.VcOPERTy OF TME USKARY Published by Authority of The Minister of Trade and
PRESENTATION TO FOURTH IEA-IEF-OPEC SYMPOSIUM ON ENERGY OUTLOOKS
 PRESENTATION TO FOURTH IEA-IEF-OPEC SYMPOSIUM ON ENERGY OUTLOOKS Nathalie BRUNELLE Senior VP Strategy, Development, Research Refining & Chemicals January 22, 214 Riyadh, Saudi Arabia janv.-7 juin-7 nov.-7
CHEMSYSTEMS. Report Abstract. Petrochemical Market Dynamics Feedstocks
 CHEMSYSTEMS PPE PROGRAM Report Abstract Petrochemical Market Dynamics Feedstocks Petrochemical feedstocks industry overview, crude oil, natural gas, coal, biological hydrocarbons, olefins, aromatics, methane
REFINED PETROLEUM PRODUCTS
 0 CATALOGUE No. Historical File Copy 45004 * MONTHLY 6 zo (:.\ N.\ 1). REFINED PETROLEUM PRODUCTS NOVEMBER, 1958 I LOMiNION BUREAU. OF STATISTICS :CI r9 OF THE kary Published by Authority of The Honourable
Lecture 3: Petroleum Refining Overview
 Lecture 3: Petroleum Refining Overview In this lecture, we present a brief overview of the petroleum refining, a prominent process technology in process engineering. 3.1 Crude oil Crude oil is a multicomponent
Market Report Series: Oil 2018 Analysis & Forecasts to Energy Community 10 th Oil Forum, Belgrade, 25 September 2018
 Market Report Series: Oil 218 Analysis & Forecasts to 223 Energy Community 1 th Oil Forum, Belgrade, 25 September 218 Short term update: crude prices (excl. WTI) up strongly Aug/Sep $/bbl 8 Benchmark Crude
Follow-up briefing to the Portfolio Committee on Trade and Industry on beneficiation
 Follow-up briefing to the Portfolio Committee on Trade and Industry on beneficiation 24 October 2014 Presentation overview Our understanding of beneficiation Polymer business briefing Conclusion Sasol
For immediate release, Wednesday, December 15, 1954 ' " " "... "-;rr?a... December 15, 195*... : V.. ^ ' * ' - :_«iies»i*dbxbsawfagr
 w fuec-^ff FIL;>. '.... CEC 17 1954 BOARD OF GOVERNORS QPTBE FfiBBRti, RESERVE SYSTEM For immediate release, Wednesday, December 15, 1954 ' " " "... "-;rr?a..... December 15, 195*.... : V.. ^ ' * ' - :_«iies»i*dbxbsawfagr
Regional Energy Trade and Refining Industry in Northeast Asia
 15 th Northeast Asia Economic Forum 5-7 September 2006, Khabarovsk Russia Regional Energy Trade and Refining Industry in Northeast Asia Kensuke Kanekiyo Managing Director The Institute of Energy Economics,
REFINED PETROLEUM PRODUCTS
 4 5 REFINED PETROLEUM PRODUCTS OCTOBER, 1956 OF BUREAU MR 6 1957 A. Published by Authority of The Right Honourable C. D. Howe, Minister of Trade and Commerce DOMINION BUREAU OF STATISTICS Industry and
release press G.12.3' For immediate release May 15, 1964 BUSINESS INDEXES average =
 FEDERAL l E S E R V E press release G.1.3' For immediate release May 15, 1964 BUSINESS INDEXES 1957-59 average = 100 Seasonally 140 adjusted 140 BUS INESS EQUIPMENT / y 10 ^/CONSUW ER GOODS 10 110-110
f Dec. F E D E R A-L Nov T 1 Not 1965 DJan For immediate release February 15, 1965 BUSINESS INDEXES average = 100 Setisonallv 1965
 statistical F E D E R A-L release For immediate release February 15, Seasonally adjusted 160 BUSINESS INDEXES 1957-59 average = 100 si TOT AL INDEX y MATEr* MALS I 1960 1961 1962 1960 1961 1962 Series
Products Methodology. September 2013
 Products Methodology September 2013 Gasoline Gasolines are a blend of light hydrocarbons for use as a motor fuel. Quality specifications vary between regions due to climate and environmental requirements,
SUPPLY CHAIN PERSPECTIVE
 SUPPLY CHAIN PERSPECTIVE FUEL Overview Australia s economy is built on key industries that rely heavily on fuel consumption. This report deals with fuel as it is processed from crude oil to refined petroleum
ALBERTA CARBON LEVY. Impact of Producers, Marketers and Users of Fuel. December 15, 2016 Craig McDougall, QC / Peter Mitchell, CA Felesky Flynn LLP
 ALBERTA CARBON LEVY Impact of Producers, Marketers and Users of Fuel December 15, 2016 Craig McDougall, QC / Peter Mitchell, CA Felesky Flynn LLP ALBERTA CARBON LEVY Effective January 1, 2017 $20 per tonne
BOARD OF GOVERNORS OF THE FEDERAL RESEliVESYSTEM. For immediate release, Monday,May 16, BUSINESS INDEXES average = 100
 BOARD OF GOVERNORS OF THE FEDERAL RESEliVESYSTEM -y^ For immediate release, Monday,May 16, 1955 G.12.3 May 16, 1955 BUSINESS INDEXES 1947-49 average = 100 Seasonally adjusted Unadjusted 1955 1??4 papr.
CHAPTER 2 REFINERY FEED STREAMS: STREAMS FROM THE ATMOSPHERIC AND VACUUM TOWERS
 CHAPTER 2 REFINERY FEED STREAMS: STREAMS FROM THE ATMOSPHERIC AND VACUUM TOWERS About This Chapter The previous chapter introduced crude oil as a mixture of compounds. The characteristics of these compounds