Energy Statistics in Malaysia. Workshop on Energy Statistics for ASEAN Countries November 2017 Kuala Lumpur, Malaysia
|
|
|
- Curtis Osborne
- 6 years ago
- Views:
Transcription
1 Energy Statistics in Malaysia Workshop on Energy Statistics for ASEAN Countries November 2017 Kuala Lumpur, Malaysia
2 Outline Background Energy in Malaysia Standard Operating Procedures Data Collection Data Dissemination Way Forward
3 Background In 2010, Energy Commission of Malaysia (EC) has been mandated by Ministry of Energy, Green Technology and Water (MEGTW) to be the focal point for energy data and statistics in the country. EC are responsible to prepare and publish National Energy Balance publication EC are responsible to give feedback by local and international parties related to energy data and statistics

4 Energy in Malaysia


5 Energy in Malaysia

6 Energy in Malaysia Average Annual Growth Rate per year from 1990 until 2015: a. GDP at 5.7% b. Primary Energy Supply at 5.9% c. Final Energy Consumption at 5.6%
7 Energy in Malaysia Average Annual Growth Rate per year from 1990 until 2015: a. Coal and Coke at 10.8% b. Natural Gas at 7.3% c. Hydropower at 5.6% d. Crude Oil, Petroleum Products and Others at 3.6%

8 Energy in Malaysia Average Annual Growth Rate per year from 1990 until 2015: a. Non-Energy Use at 8.1% b. Residential and Commercial at 6.4% c. Transport at 6.1% d. Industrial at 4.0%
9 Energy in Malaysia Average Annual Growth Rate per year from 1990 until 2015: a. Natural Gas at 9.2% b. Electricity at 7.9% c. Coal and Coke at 5.1% d. Petroleum Products and Others at 4.4%

10 Standard Operating Procedures
11 Data Collection Currently, about 70 data providers Divided into fuel types ; oil, gas, electricity and coal In quarterly basis based on region Questionnaire based on energy balance format Collected via online, , fax and postage Primary and secondary sources Common unit of measurement based on fuel types

12 Data Collection
, www.meih.st.gov.")

13 Data Collection: Online Type in the URL for MEIH Portal in the address bar of the internet Browser (Internet Explorer / Mozilla Firefox / Chrome), Another option is to go to the official website of Suruhanjaya Tenaga, Click on the MEIH icon located in the main page. Or go to official website of Ministry of Energy, Green Technology and Water, Click on the Malaysia Energy Information Hub link at the main page.
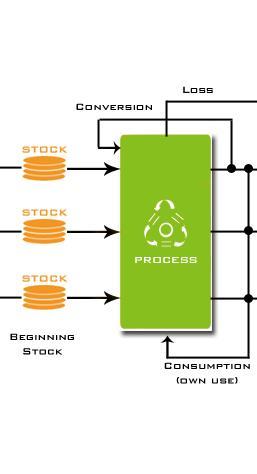
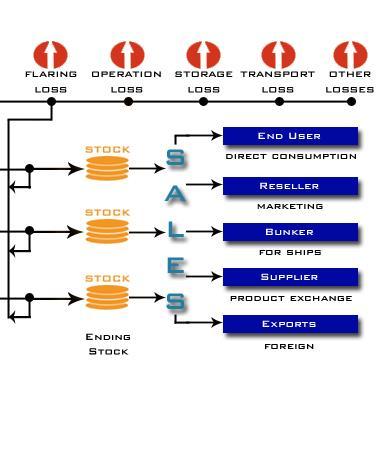
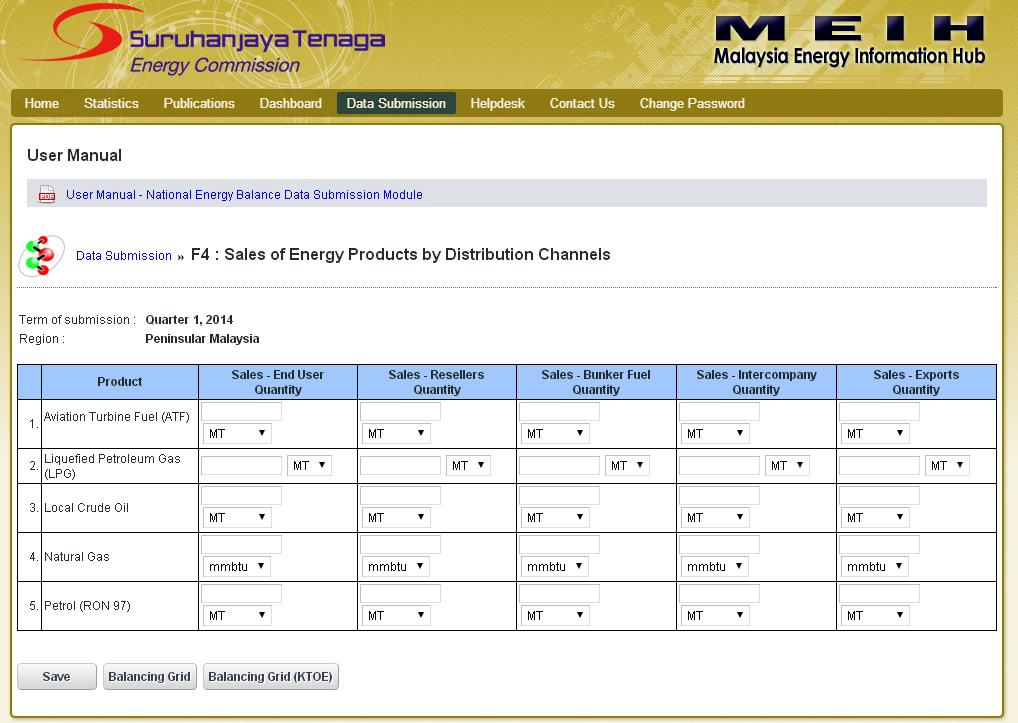
14 Data Collection: Online Forms Form Description Parameters/Fields F1 Stock of Energy Products Open Stock Closing Stock F2 Energy Intake into Plant/Process/Operation Local Purchase Production Supply/Electricity Generation Foreign Imports F3 Energy Own Consumption and Conversion/Operations Own Use/Electricity Own Use Conversion Process F4 Sales of Energy Products by Dsitribution Channels Sales End User Sales Reseller Sales Bunker Sales Intercompany Sales Exports F5 Losses of Energy Products Loss Flaring Loss Storage Loss Operations Loss Others Loss Transportation 1. Residential/Domestic Retail - Residential Public Lighting 2. Commerical Retail - Commercial Wholesale & Retail (Hotel / Complexes) Real Estate & Services Government & Military 3. Agriculture Agriculture & Livestock 4. Non Engery Non Energy Use 5. Industrial Retail - Industry Forestry & Logging Fishing Mining & Quarry Construction Refining Ceramic Food, Beverage & Tobacco Glass & Glass Products Rubber, Plastic & Non Metalic Wood & Furniture Textile Apparel & Leather Power Generation Brick Cement Iron, Steel & Metal Pulp, Paper Products & Printing Chemical & Petrochemical Other Oil Companies General Manufacturing (Others) 6. Transportation Retail - Transportation Road Rail Air Inland Water 7. Utility Utility Generation - TNB Utility Generation - SESCO Utility Generation - SEB Utility Generation - Others 8. Bunker International Shipping
15 Data Collection: Online No Product Name Product Description No Product Name Product Description No Product Name Product Description 1 A TF & A v Gas A TF (A viation Turbine Fuel) 38 Electricity Electricity 75 Light Detergent Feedstock 2 A viation Gas (A VGas) 39 Fuel Oil Fuel Oil Bunker 76 Liquid Lubricants 3 DPK (Dual Purpose Kerosene) 40 Fuel Oil 77 MTBE 4 Coal & Coke Brown Coal Coke 41 Fuel Oil - Cogen 78 Naptha 5 Bituminuous Coal 42 Fuel Oil - Thermal - Steam 79 Oil Slops 6 Charcoal 43 Fuel Oil - Thermal - Utility sets 80 Other Lubes 7 Coal - Thermal - Steam 44 Fuel Oil (other than Residual) 81 Petroleum Solvent (Others) 8 Coke (Semi Coke) 45 Residual Fuel Oil 82 Platformate / Reformate 9 Fuel Wood 46 Fuel Oil (LSWR) 83 Petroleum Jelly 10 Graphite 47 Hydro Power Elect - Hydro - Major 84 Solid Lubricants 11 Gas Coke 48 Elect - Hydro - Mini 85 Other Waxes 12 Lignite (Brown Coal) 49 Kerosene Regular Kerosene 86 Petroleum Waxes 13 Lignite Briquettes 50 Liqufied Natural Gas LNG Liquiefied Natural Gas 87 Waxy Raffinates 14 Other Coal 51 LPG LPG Liquiefied Petroleum Gas 88 Others Local Condensate 15 Peat 52 Motor Petrol Mogas (Others) 89 Crude Residuum 16 Pattern Fuel Briquettes 53 Mogas (w Naptha L 92 RON) 90 Foreign Condensates 17 Petroleum Coke 54 Mogas (w Naptha UL 92 RON) 91 Residuee (FE) 18 Retort Carbon 55 Mogas (w Naptha UL 97 RON) 92 Slops Reprocessed 19 Semi Coke 56 Mogas (wout Naptha L 92 RON) 93 Private Licencee Fossil Elect - Private Licensee - Diesel 20 Co-Generation Fossil Elect - Cogen - Diesel 57 Mogas (wout Naptha UL 92 RON) 94 Elect - Private Licencee - Natgas 21 Elect - Cogen - Fuel Oil 58 Mogas (wout Naptha UL 97 RON) 95 Private Licencee Renewable Elect - Private Licencee - Biomass 22 Elect - Cogen - Natgas 59 Natural Gas Butane 96 Refinery Gas Flared Gas 23 Co-Generation Renewable Elect - Cogen - Biomass 60 Ethane 97 Refinery Gas 24 Elect - Cogen - Palm Oil 61 Methane 98 Solar Elect - Solar 25 Crude Oil Local Crude Oil 62 Natural Gas Fuel 99 Thermal Elect - Thermal - Combined Cycle - Diesel 26 Other Foreign Crude Oil 63 Natural Gas 100 Elect - Thermal - Combined Cycle - Natgas 27 West A sian Crude Oil 64 NatGas - Thermal - Combined Cycle 101 Elect - Thermal - Geothermal 28 Diesel Diesel Oil Bunker 65 NatGas - Cogen 102 Elect - Thermal - Steam - Biomass 29 Diesel Oil 66 NatGas - Thermal - Open Cycle 103 Elect - Thermal - OpenCycle - Diesel 30 Diesel - Cogen 67 NatGas - Private Licencee 104 Elect - Thermal - OpenCycle - Natgas 31 Diesel - Thermal - Open Cycle 68 NatGas - Thermal - Steam 105 Elect - Thermal - Steam - Coal 32 Diesel - Private Licencee 69 Propane 106 Elect - Thermal - Steam - Diesel 33 Diesel - Thermal - Steam 70 Non Energy Bitumen / A sphalt / Mexphalte 107 Elect - Thermal - Steam - Fuel Oil 34 Diesel - Thermal - Utility Sets 71 Bitumen Mastics 108 Elect - Thermal - Steam - Natgas 35 Gas Oil 72 Heavy Detergent Feedstock 109 Elect - Thermal - Utility Sets - Diesel 36 High Speed Diesel Fuel 73 White/ Industrial Spirit 110 Wind Turbine Elect - Wind Turbine Lubes / Grease

16 Data Collection: Online

17 Data Collection: Online

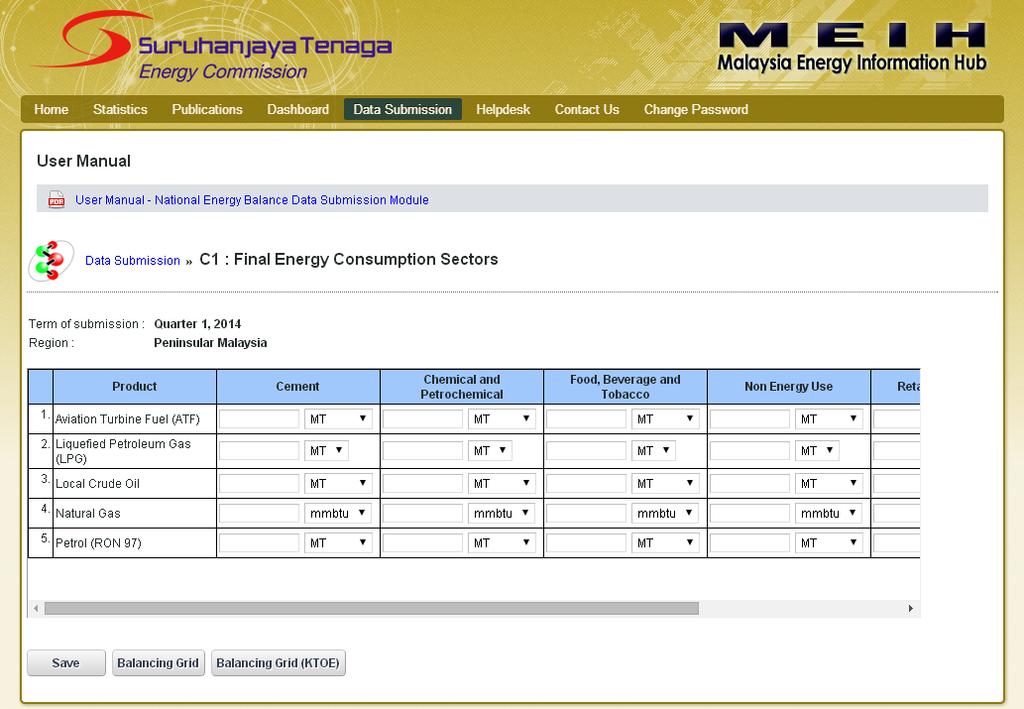
18 Data Collection: Online


19 Data Dissemination Publication Online Mobile Apps


20 Other Publications
21 Way Forward Energy Survey We already conducted energy survey for Manufacturing, Residential and Commercial sectors We will conducting energy survey for Transportation sector in 2018 New Data in National Energy Balance (Proposal) GHG Inventory Data for Energy Sector Final Energy Consumption data by States in Malaysia Energy Outlook
22 Thank You SURUHANJAYA TENAGA (ENERGY COMMISSION) No. 12, Jalan Tun Hussein, Precinct 2, Putrajaya, Malaysia Tel: (03) Fax: (03)
Annual Oil Questionnaire Overview. Joint IEA, ESCWA and RCREEE National Workshop on Energy Statistics Cairo, Egypt 27 April 01 May 2014
 Annual Oil Questionnaire Overview Joint IEA, ESCWA and RCREEE National Workshop on Energy Statistics Cairo, Egypt 27 April 01 May 2014 Annual Oil Questionnaire Why are oil statistics important? The IEA/Eurostat/UNECE
Annex 2 Petroleum Products Sales Questionnaire Definitions
 Annex 2 Petroleum Products Sales Questionnaire Definitions Definition of Fuels 1. Liquefied Petroleum Gas or LPG LPG refers to liquefied propane (C3H8) and butane (C4Hl0) or mixtures of both. Commercial
Annual Oil Statistics
 Annual Oil Statistics Oil Questionnaire Overview Energy Statistics Training International Energy Agency Ana-Luisa Sao Marcos Annual Oil Statistician Share of oil in Total Primary Energy Supply share of
Table 8. Gross Domestic Product by Industrial Origin at Current Market Prices, (Rp. Billion)
") Table 8. Gross Domestic Product by Industrial Origin at Current Market Prices, 1997-2003 1. Agriculture, Forestry & Fishery 101,009 172,828 215,687 217,898 246,298 281,325 76,693 74,437 77,305 a. Farm
Table 8. Gross Domestic Product by Industrial Origin at Current Market Prices, 1997-2003 1. Agriculture, Forestry & Fishery 101,009 172,828 215,687 217,898 246,298 281,325 76,693 74,437 77,305 a. Farm
The Oil Questionnaire
 The Oil Questionnaire TARES/IEA Energy Statistics Training Cairo, Oct. 20-23, 2014 Pierre Boileau International Energy Agency OECD/IEA 2010 Presentation overview Introduction Collecting data from different
Gross Domestic Product 2014 Q4
 REPUBLIC OF RWANDA NATIONAL INSTITUTE OF STATISTICS OF RWANDA P.O.Box 6139 KIGALI - RWANDA Gross Domestic Product 2014 Q4 March 2015 I. Gross Domestic Product and its structure In the fourth quarter of
As a result, the share of US in world industrial production should fall from 19.4% in 2012 to 18.5% by 2016 and decline to 17.6% by 2021.
 : Industry Overview GDP is expected to rise by 2.2% in 212 and expand by 2.1% in 213. Over the next 1 years to 221, GDP is predicted to grow on average by 2.8% a year. Manufacturing output growth is forecast
Petroleum Planning & Analysis Cell
 MONTHLY REPORT ON INDIGENOUS CRUDE OIL PRODUCTION, IMPORT AND PROCESSING & PRODUCTION, IMPORT AND EXPORT OF PETROLEUM PRODUCTS May 2018 Petroleum Planning & Analysis Cell (Ministry of Petroleum & Natural
CUSTOMS TARIFF - SCHEDULE V - 1
 V - 1 Section V MINERAL PRODUCTS 27 - i Chapter 27 MINERAL FUELS, MINERAL OILS AND PRODUCTS OF THEIR DISTILLATION; BITUMINOUS SUBSTANCES; MINERAL WAXES Notes. 1. This Chapter does not cover: (a) Separate
Methodology and specifications guide China Oil Analytics
 Methodology and specifications guide China Oil Analytics Latest update: March 2018 Scope of service 2 Contact us 2 Frequency of publication 2 Frequency of data updates 2 Data and analysis sources 2 Forecasting
CUSTOMS TARIFF - SCHEDULE. Chapter 27 MINERAL FUELS, MINERAL OILS AND PRODUCTS OF THEIR DISTILLATION; BITUMINOUS SUBSTANCES; MINERAL WAXES
 CUSTOMS TARIFF - SCHEDULE 27 - i Chapter 27 MINERAL FUELS, MINERAL OILS AND PRODUCTS OF THEIR DISTILLATION; BITUMINOUS SUBSTANCES; MINERAL WAXES Notes. 1. This Chapter does not cover: (a) Separate chemically
Petroleum Planning & Analysis Cell
 MONTHLY REPORT ON INDIGENOUS CRUDE OIL PRODUCTION, IMPORT AND PROCESSING & PRODUCTION, IMPORT AND EXPORT OF PETROLEUM PRODUCTS September 2018 Petroleum Planning & Analysis Cell (Ministry of Petroleum &
ALBERTA CARBON LEVY. Impact of Producers, Marketers and Users of Fuel. December 15, 2016 Craig McDougall, QC / Peter Mitchell, CA Felesky Flynn LLP
 ALBERTA CARBON LEVY Impact of Producers, Marketers and Users of Fuel December 15, 2016 Craig McDougall, QC / Peter Mitchell, CA Felesky Flynn LLP ALBERTA CARBON LEVY Effective January 1, 2017 $20 per tonne
Petroleum Planning & Analysis Cell
 MONTHLY REPORT ON INDIGENOUS CRUDE OIL PRODUCTION, IMPORT AND PROCESSING & PRODUCTION, IMPORT AND EXPORT OF PETROLEUM PRODUCTS November 2017 Petroleum Planning & Analysis Cell (Ministry of Petroleum &
S t a t i s t i c a l b o o k s. Energy. Yearly statistics edition
 S t a t i s t i c a l b o o k s Energy Yearly statistics 2005 2007 edition EuropEan Commission Europe Direct is a service to help you ind answers to your questions about the European Union Freephone number
Petroleum Planning & Analysis Cell
 MONTHLY REPORT ON INDIGENOUS CRUDE OIL PRODUCTION, IMPORT AND PROCESSING & PRODUCTION, IMPORT AND EXPORT OF PETROLEUM PRODUCTS February 2018 Petroleum Planning & Analysis Cell (Ministry of Petroleum &
I.R. IRAN JODI OIL & JODI GAS
 I.R. IRAN JODI OIL & JODI GAS Data source for JODI-Oil questionnaire Crude oil NGL Other Total (1)+(2)+(3) (1) (2) (3) (4) + Production (NIOC)-Daily + From other sources Not Available + Imports Not Applicable
1 E NERGY 1-2 STEP BY STEP CALCULATIONS 4 OF 16 MANUFACTURING INDUSTRIES AND CONSTRUCTION STEP 4 STEP 5 STEP 6. Carbon Stored (Gg C) (a)
 (a)") SUB CO 2 FROM FUEL COMBUSTION BY SOURCE CATEGORIES (TIER I) 4 OF 16 MANUFACTURING INDUSTRIES AND CONSTRUCTION STEP 4 STEP 5 STEP 6 G H I J K L Manufacturing Industries and Construction (a) (a) Net Carbon
SUB CO 2 FROM FUEL COMBUSTION BY SOURCE CATEGORIES (TIER I) 4 OF 16 MANUFACTURING INDUSTRIES AND CONSTRUCTION STEP 4 STEP 5 STEP 6 G H I J K L Manufacturing Industries and Construction (a) (a) Net Carbon
ISSN Statistical books. Energy. Yearly statistics edition
 ISSN 1830-7833 Statistical books Energy Yearly statistics 2006 2008 edition Statistical books Energy Yearly statistics 2006 2008 edition Europe Direct is a service to help you find answers to your questions
Statistical Data in Japan
 Statistical Data in Japan Trends in LP Gas Supply Patterns 20,000 18,832 18,198 18,140 17,905 18,079 17,454 7454 Domestic Production 25.9% 74.1% Import Ratio of Import and Domestic Production 20,000 1,000
The IEA oil data system
 The IEA oil data system Joint Rosstat- IEA Energy statistics workshop Moscow, Russia 14-17 February 2012 Mieke Reece Oil and Gas Statistics IEA Energy Data Centre OECD/IEA 2010 Timeliness The IEA Oil Data
SUPPLY CHAIN PERSPECTIVE
 SUPPLY CHAIN PERSPECTIVE FUEL Overview Australia s economy is built on key industries that rely heavily on fuel consumption. This report deals with fuel as it is processed from crude oil to refined petroleum
National accounts and balance of payments
 1. Danish economy 1998 to 2008 Figure 1 Real growth in GDP 4 3 2 1 0-1 -2 Per cent 98 00 02 04 06 08 For further information visit www.statbank.dk/nat02. Economic downturn in 2008 The economic growth was
Energy Efficiency and Greenhouse Gas Emission Intensity of Petroleum Products at U.S. Refineries
 Energy Efficiency and Greenhouse Gas Emission Intensity of Petroleum Products at U.S. Refineries Amgad Elgowainy, a Jeongwoo Han, a Hao Cai, a Michael Wang, a Grant S. Forman, b Vincent B. DiVita c a Systems
ECONOMIC SURVEY STATISTICAL APPENDIX
 ECONOMIC SURVEY 2017-18 STATISTICAL APPENDIX STATISTICAL APPENDIX : ECONOMIC SURVEY 2017-18 PAGE 1 National Income and Production 1.1 Gross National Income and Net National Income... A1-A2 1.2 Annual
1 E NERGY. Data sources. Methodology. Completing the Worksheet
 1 E NERGY Operations of aircraft are divided into two parts: The Landing/Take-Off (LTO) cycle 4 which includes all activities near the airport that take place under the altitude of 914 metres (3000 feet).
BUREAU OF Statistics Yukon Energy Facts
 BUREAU OF Statistics Yukon Energy Facts Electricity Generation YUKON ELECTRICAL COMPANY YUKON ENERGY CORPORATION YUKON TOTAL HYDRO THERMAL HYDRO THERMAL WIND HYDRO THERMAL WIND (MW.h) (MW.h) (MW.h) 26
Self-Assessor Carbon Levy Remitter Return INSTRUCTION GUIDE Climate Leadership Act
 Self-Assessor Carbon Levy Remitter Return INSTRUCTION GUIDE Climate Leadership Act Pursuant to the Climate Leadership Act, the Alberta carbon levy is effective January 1, 2017. Who Must Complete This Return
Refining Technology in the Petroleum, Metals and Bioprocesses Industries
 Refining Technology in the Petroleum, Metals and Bioprocesses Industries Brenno C. Menezes Postdoc, email: brennocm@usp.br University of São Paulo São Paulo, SP, BR Lecture 1 São Paulo, Feb 22 nd, 2018
Downstream Petroleum Sector The Growing Prominence of Asian Refining
 Downstream Petroleum Sector The Growing Prominence of Asian Refining Mr. Fahad Al-Dihani Deputy CEO,MAA Refinery, Kuwait National Petroleum Company-Kuwait Outline.. Global refining trends Kuwait s Position
BRUNEI DARUSSALAM STATISTICAL APPENDIX. International Monetary Fund Washington, D.C. IMF Country Report No. 15/146. June 2015
 June 2015 IMF Country Report No. 15/146 BRUNEI DARUSSALAM STATISTICAL APPENDIX This Statistical Appendix on Brunei Darussalam was prepared by a staff team of the International Monetary Fund. It is based
Yusep K Caryana R & D Center for Oil and Gas Technology LEMIGAS, Indonesia
 Yusep K Caryana R & D Center for Oil and Gas Technology LEMIGAS, Indonesia JPEC 6 TH ASIAN PETROLEUM TECHNOLOGY SYMPOSIUM CEBU, PHILIPPINES, 29 31 JANUARY 2008 Yusep K Caryana, Lemigas - Roadmap To Clean
Table 1 ANTIGUA AND BARBUDA: MAIN ECONOMIC INDICATORS
 Antigua Tables 2006 1 Main Indicators 03/11/2006 08:05 AM Table 1 ANTIGUA AND BARBUDA: MAIN ECONOMIC INDICATORS 1996 1997 1998 1999 2000 2001 2002 2003 2004 2005 a/ Annual growth rates b/ Gross domestic
SECTION 3: NATIONAL ACCOUNTS
 SECTION 3: NATIONAL ACCOUNTS TABLE 28: PROVISIONAL ESTIMATE OF GDP AT CURRENT PRICES BY INDUSTRY(T$'000) Industry 1993 94 1994 95 1995 96 1996 97 1997 98 1998 99 1999 00 2000 01 2001-02 2002-03 2003-04p
BRUNEI DARUSSALAM. Copies of this report are available to the public from
 IMF Country Report No. 16/310 September 2016 BRUNEI DARUSSALAM STATISTICAL APPENDIX This Statistical Appendix on Brunei Darussalam was prepared by a staff team of the International Monetary Fund. It is
CHAPTER 27 MINERAL FUELS, MINERAL OILS AND PRODUCTS OF THEIR DISTILLATION; BITUMINOUS SUBSTANCES; MINERAL WAXES
 CHAPTER 27 MINERAL FUELS, MINERAL OILS AND PRODUCTS OF THEIR DISTILLATION; BITUMINOUS SUBSTANCES; MINERAL WAXES NOTES: 1. This Chapter does not cover: (a) Separate chemically defined organic compounds
Canada s Refining Industry Sector Performance Report
 Canada s Refining Industry 217 Sector Performance Report The Canadian Fuels Association represents the industry that produces, distributes and markets petroleum products in Canada including 95 percent
Statistical tables S 0. Money and banking. Capital market. National financial account. Public finance
 Statistical tables Money and banking Page S : Liabilities... 2 : Assets... 3 Corporation for Public Deposits: Liabilities... 4 Corporation for Public Deposits: Assets... 5 Banks: Liabilities... 6 7 Banks:
Money and banking. Flow of funds for the first quarter
 Statistical tables Money and banking Page S South African Reserve Bank: Liabilities... 2 South African Reserve Bank: Assets... 3 Corporation for Public Deposits: Liabilities... 4 Corporation for Public
Mini refinery feasibility study
 Mini refinery feasibility study Introduction The first part of any study into a mini-refinery application is an initial assessment of its economic feasibility. This requires an understanding of what a
Abstract Process Economics Program Report 222 PETROLEUM INDUSTRY OUTLOOK (July 1999)
") Abstract Process Economics Program Report 222 PETROLEUM INDUSTRY OUTLOOK (July 1999) Global energy demand is rising, with fossil fuels oil, natural gas, and coal continuing to provide more than 90% of
Abstract Process Economics Program Report 222 PETROLEUM INDUSTRY OUTLOOK (July 1999) Global energy demand is rising, with fossil fuels oil, natural gas, and coal continuing to provide more than 90% of
CDP Technical Note: Fuel definitions. Climate Change Questionnaire 2018
 CDP Technical Note: Fuel definitions Climate Change Questionnaire 2018 Contents Introduction... 4 Solid fossil fuels... 5 Anthracite... 5 Asphalt... 5 Bitumen... 5 Bituminous coal... 5 Brown coal... 5
Schedule of Accreditation issued by United Kingdom Accreditation Service 2 Pine Trees, Chertsey Lane, Staines-upon-Thames, TW18 3HR, UK
 2 Pine Trees, Chertsey Lane, Staines-upon-Thames, TW18 3HR, UK Accredited to ISO/IEC 17021-1:2015 to provide environmental Cobra Court 1 Blackmore Road Stretford Manchester M32 0QY Contact: Mr S Stubley
Dr Ahmad Fauzi Puasa Deputy Director, Malaysia Institute Economic Research Kuala Lumpur Maritime Park & Spa Resort, Krabi, Thailand 29 August, 2013
 ASIA PALM OIL CONFERENCE (APOC) 2013: INNOVATING THAILAND S PALM OIL INDUSTRY World Economic Uncertainty Affect the World Palm Oil Industry Dr Ahmad Fauzi Puasa Deputy Director, Malaysia Institute Economic
CONVERSION FACTORS. xix
 CONVERSION FACTORS The data which have been supplied by the countries in original units are converted to the common unit, terajoules (TJ), by using standard conversion factors or, in the case of solids,
ANNUAL STATISTICAL SUPPLEMENT
 ANNUAL STATISTICAL SUPPLEMENT with 2016 data 2017 Edition This Statistical Supplement has been prepared to provide a longer historical perspective for the oil demand, supply, trade, stocks, prices and
GROSS DOMESTIC PRODUCT
 STATISTICS BOTSWANA GROSS DOMESTIC PRODUCT GROSS DOMESTIC PRODUCT Second Quarter 2018 Copyrights 2018. Private Bag 0024 Botswana Tel: (267) 367 1300. Toll Free: 0800 600 200. Fax: (267) 395 2201. Email:
Conversion Processes 1. THERMAL PROCESSES 2. CATALYTIC PROCESSES
 Conversion Processes 1. THERMAL PROCESSES 2. CATALYTIC PROCESSES 1 Physical and chemical processes Physical Thermal Chemical Catalytic Distillation Solvent extraction Propane deasphalting Solvent dewaxing
 FUELS POLICY Presented at JARI Indonesia Roundtable 2008 www.migas.esdm.go.id Jakarta, 14 th February 2008 Outline 1. Framework of Fuels Supply and Utilization 2. National Energy Policy 3. Fuel Policy
Challenges and Opportunities in Managing CO 2 in Petroleum Refining
 Challenges and Opportunities in Managing CO 2 in Petroleum Refining Theresa J. Hochhalter ExxonMobil Research & Engineering Fairfax, VA GCEP Workshop on Carbon Management in Manufacturing Industries STANFORD
Regional statistics on entrepreneurial activity 2016
 Enterprises 2017 Regional statistics on entrepreneurial activity Establishments gross value of output grew in Half of the growth was generated in SMEs In, there were 357,000 enterprises operating in Finland.
Section 10. Renewable Energy
 Section 1. enewable Energy Sources. The Nation consumed 6.2 quadrillion Btu of renewable energy in 23, accounting for 6 percent 1 of total energy consumption during the year. At 2.8 quadrillion Btu, conventional
CHEMSYSTEMS. Report Abstract. Petrochemical Market Dynamics Feedstocks
 CHEMSYSTEMS PPE PROGRAM Report Abstract Petrochemical Market Dynamics Feedstocks Petrochemical feedstocks industry overview, crude oil, natural gas, coal, biological hydrocarbons, olefins, aromatics, methane
What is the impact of changing patterns in energy markets on EU competitiveness? A refining industry perspective
 What is the impact of changing patterns in energy markets on EU competitiveness? A refining industry perspective Energy transition: A multifaceted Challenge for Europe 1 st Symposium, Brussels, 30 April
ANNUAL STATISTICAL SUPPLEMENT
 ANNUAL STATISTICAL SUPPLEMENT with 2008 data 2009 Edition This Statistical Supplement has been prepared to provide a longer historical perspective for the oil demand, supply, trade, stocks, prices and
Statistical tables S 0. Money and banking. Capital market. National financial account. Public finance
 Statistical tables Money and banking Page S South African Reserve Bank: Liabilities... 2 South African Reserve Bank: Assets... 3 Corporation for Public Deposits: Liabilities... 4 Corporation for Public
Fundamentals of Petroleum Refining Refinery Products. Lecturers: assistant teachers Kirgina Maria Vladimirovna Belinskaya Natalia Sergeevna
 Fundamentals of Petroleum Refining Refinery Products Lecturers: assistant teachers Kirgina Maria Vladimirovna Belinskaya Natalia Sergeevna 1 Refinery Products Composition There are specifications for over
, 2012 ARUBA. Contents. Available. 1 Real sector A 1.2B 1.6A 1.6B 1.7A 1.7B. 1.9 Utilities Oil refining
 CENTRALE C BANK B VAN ARUBA STATISTICAL TABLES Third QUARTER 2011 Last updated January 13, 2012 Contents 1 Real sector 1.1 Gross Domestic Product 1.2A Business Perception Results 1.2B Business Perception
Fundamentals of Petrochemical Industry
 Fundamentals of Petrochemical Industry Akil Sahiwala Marketing Manager Dow Polyurethanes The Dow Chemical Company AGENDA Petrochemical Value Chain Overview Feedstocks to the Industry Chemical Value Chains
Distillation process of Crude oil
 Distillation process of Crude oil Abdullah Al Ashraf; Abdullah Al Aftab 2012 Crude oil is a fossil fuel, it was made naturally from decaying plants and animals living in ancient seas millions of years
AALTO UNIVERSITY SCHOOL OF CHEMICAL TECHNOLOGY KE Introduction to biorefineries and biofuels
 AALTO UNIVERSITY SCHOOL OF CHEMICAL TECHNOLOGY KE-40.4120 Introduction to biorefineries and biofuels Assignment 11: Comparison of biofuels vs. fossil fuels Aino Siirala 309141 Assignment submitted 8.12.2013
The Outlook for Energy: A View to 2040
 The Outlook for Energy: A View to 24 Todd Onderdonk June 213 This presentation includes forward-looking statements. Actual future conditions (including economic conditions, energy demand, and energy supply)
THE A NONTECHNICAL GUIDE
 THE A NONTECHNICAL GUIDE Contents Preface xv 1 Origins of Oil and Gas 1 A Brief Overview 1 Subsea Burial 2 Hydrocarbon Generation within Source Rock 3 Migration to Reservoir Rock 5 Hydrocarbon Traps 6
Harmonized Tariff Schedule of the United States (2005) Annotated for Statistical Reporting Purposes
 Annotated for Statistical Reporting Purposes") CHAPTER 27 MINERAL FUELS, MINERAL OILS AND PRODUCTS OF THEIR DISTILLATION; BITUMINOUS SUBSTANCES; MINERAL WAXES 27-1 Notes 1. This chapter does not cover: (a) (b) Separate chemically defined organic compounds,
CHAPTER 27 MINERAL FUELS, MINERAL OILS AND PRODUCTS OF THEIR DISTILLATION; BITUMINOUS SUBSTANCES; MINERAL WAXES 27-1 Notes 1. This chapter does not cover: (a) (b) Separate chemically defined organic compounds,
Monthly Petroleum Statistics
 AUGUST 2015 Vol. XXVII No. 8 Monthly Petroleum Statistics SUBDIECCIÓN DE DESEMPEÑO DEL NEGOCIO AV. MAINA NACIONAL 329 GEENCIA DE INDICADOES OPEATIVOS Y DEL NEGOCIO PISO 31 TOE EJECUTIVA 11311 MÉXICO D.
Carbon Tax the Irish case
 January 25 th, 2017 Brussels, Belgium Carbon Tax the Irish case James Nix, Director of Green Budget Europe 1 Context Leadership by the Green Party Limited public opposition Government need for the income
ISCC s Risk based Certification Approach for Waste and Residues
 Exploring Export Opportunities for Waste and Residue-Based Raw Materials and Biofuels ISCC s Risk based Certification Approach for Waste and Residues Shanghai, 13 November 2017 Dr Norbert Schmitz, ISCC
Monthly Report on the Corporate Goods Price Index ( Preliminary Figures for November 2018 )
") Research and Statistics Department Bank of Japan Report on the Corporate Goods Price Index The Producer Price Index fell 0.3 percent from the previous. The Export Price Index (contract currency ) fell
Research and Statistics Department Bank of Japan Report on the Corporate Goods Price Index The Producer Price Index fell 0.3 percent from the previous. The Export Price Index (contract currency ) fell
B. SECTORAL TABLES 1. Energy
 Energy - Total CO 2 emissions from the reference approach and the sectoral approach (1999) B. SECTORAL TABLES 1. Energy CO 2 emissions from total fuel combustion Reference approach Sectoral approach Difference
Modernization of Libyan Oil Refineries and Petrochemical Plants
 Modernization of Libyan Oil Refineries and Petrochemical Plants Presentation Contents 1. Introduction 2. Challenges Facing the Existing Libyan Oil refineries and Petrochemical Plants. 3. Refining and Petrochemical
WHO IS PERTAMINA? AUGUST 2016
 WHO IS PERTAMINA? AUGUST 2016 Fact Sheet 1,2,3,5 Name: PT. Pertamina (Persero) Founded: August 1968 by the merger of Pertamin (est. 1961) and Permina (est. 1957) Company type: Government owned enterprise
Frequently Asked Questions Style Guide. Developed by E-WRITE ewriteonline.com For the Energy Information Administration eia.doe.
 Frequently Asked Questions Style Guide Developed by E-WRITE ewriteonline.com For the Energy Information Administration eia.doe.gov November 2006 1. Answer the question completely. Make sure your answer
DANIEL LEUCKX. Recent and proposed legislative developments. PLATTS, Middle Distillates 4 th Annual Conference. Policy Executive, EUROPIA
 DANIEL LEUCKX Policy Executive, EUROPIA Recent and proposed legislative developments PLATTS, Middle Distillates 4 th Annual Conference Agenda 1) About EUROPIA & CONCAWE 2) Recent and proposed legislative
STATISTICAL TABLES RELATING TO INCOME, EMPLOYMENT, AND PRODUCTION
 A P P E N D I X B STATISTICAL TABLES RELATING TO INCOME, EMPLOYMENT, AND PRODUCTION C O N T E N T S GDP, INCOME, PRICES, AND SELECTED INDICATORS Page B 1. Percent changes in real gross domestic product,
Monthly Report on the Corporate Goods Price Index ( Preliminary Figures for February 2018 )
") Research and Statistics Department Bank of Japan Report on the Corporate Goods Price Index The Producer Price Index was und from the previous. The Export Price Index (contract currency ) rose 0.4 percent
Research and Statistics Department Bank of Japan Report on the Corporate Goods Price Index The Producer Price Index was und from the previous. The Export Price Index (contract currency ) rose 0.4 percent
Investment Opportunities at POIC Lahad Datu
 Investment Opportunities at POIC Lahad Datu Bilson Kurus, Ph.D POIC Sabah Sdn Bhd International Joint Workshop on New Trends In Nano-Bio Technology 28 th November 2013, Hotel Le Meridien, Kota Kinabalu,
STATISTICS BOTSWANA. GROSS DOMESTIC PRODUCT First Quarter 2018
 STATISTICS BOTSWANA GROSS DOMESTIC PRODUCT First Quarter 2018 Copyrights 2018 Private Bag 0024, Gaborone. TOLL FREE NUMBER: 0800600200 Tel: ( +267) 367 1300Fax: ( +267) 395 2201 E-mail: info@statsbots.org.bw
Study of the Marketability of Oil Sands Products in Asian Countries
 Study of the Marketability of Oil Sands Products in Asian Countries Prepared For: Alberta Economic Development Prepared By: The Institute of Energy Economics, Japan IEEJ March 2007 List of Contents Executive
Agri.. Eng. R&D for Environmentally Friendly in Thailand. Viboon Thepent
 Agri.. Eng. R&D for Environmentally Friendly in Thailand Viboon Thepent Presentation Outlines Introduction Biomass energy Solar energy Wind energy Geothermal Energy Energy Conservation Program Conclusion
Effect of Biodiesel Production on Life-Cycle Greenhouse Gas Emissions and Energy Use for Canada
 Effect of Biodiesel Production on Life-Cycle Greenhouse Gas Emissions and Energy Use for Canada Brian G. McConkey 1, Stephen Smith 2, James Dyer 3, Ravinderpal Gil 2, Suren Kulshreshtha 4, Cecil Nagy 4,
Pacific Fuel Price Monitor
 Pacific Fuel Price Monitor APRIL JUNE 2014 (Q2 2014) WHAT S INSIDE 1. Pacific fuel price monitor at a glance 2. Regional retail fuel prices (including taxes and duty) 3. Unleaded motor gasoline (mogas)
Harmonisation of Definitions of Energy Products and Flows
 Harmonisation of Definitions of Energy Products and Flows ON PRODUCTS IEA, Paris, 28-30 October 2008 Hierarchy of Products Coal Hard coal Anthracite Bituminous coal Coking coal Other bituminous coal Brown
STATISTICAL TABLES REAL SECTOR SECOND QUARTER 2018 Last updated August 17, 2018
 CENTRALE BANK VAN ARUBA STATISTICAL TABLES REAL SECTOR SECOND QUARTER 2018 Last updated August 17, 2018 Contents 1 Real sector 1.1 Gross Domestic Product 1.2A Business Perception Results 1.2B Business
GHGENIUS LCA Model for Transportation Fuels
 GHGENIUS LCA Model for Transportation Fuels Don O Connor (S&T) 2 Consultants Inc. www.ghgenius.ca Agenda GHGenius Introduction Biofuels Results Key Inputs Analysis Gaps Model Background Based on a Lotus
US Shale Liquids Surge: Implications for the Crude Oil Value Chain
 US Shale Liquids Surge: Implications for the Crude Oil Value Chain Praveen Gunaseelan Vantage Point Advisors Matt Thundyil Transcend Solutions COQA Spring Meeting Houston March 2012 Transcend Solutions
Item
 Key Indicators for Asia and the Pacific 2010 POPULATION a Total population million; as of 1 July 18.17 18.55 18.93 19.33 19.73 20.14 20.56 20.99 21.42 21.87 22.32 22.79 23.30 23.82 24.36 24.91 25.47 26.04
TABLE OF CONTENTS 6 MEDIUM-TERM COAL MARKET REPORT 2012
 TABLE OF CONTENTS FOREWORD... 3 ACKNOWLEDGEMENTS... 5 EXECUTIVE SUMMARY... 12 Business as usual... 12 The winds of change... 12 US shale gas switches on coal in Europe... 13 From Beijing to New Delhi?...
Monthly Report on the Corporate Goods Price Index ( Preliminary Figures for November 2017 )
") Research and Statistics Department Bank of Japan Report on the Corporate Goods Price Index The Producer Price Index rose 0.4 percent from the previous. The Export Price Index (contract currency ) rose
Research and Statistics Department Bank of Japan Report on the Corporate Goods Price Index The Producer Price Index rose 0.4 percent from the previous. The Export Price Index (contract currency ) rose
Monthly Report on the Corporate Goods Price Index ( Preliminary Figures for September 2017 )
") Research and Statistics Department Bank of Japan Report on the Corporate Goods Price Index The Producer Price Index rose 0.2 percent from the previous. The Export Price Index (contract currency ) rose
Research and Statistics Department Bank of Japan Report on the Corporate Goods Price Index The Producer Price Index rose 0.2 percent from the previous. The Export Price Index (contract currency ) rose
Eni Slurry Technology:
 Eni Slurry Technology: An opportunity for refinery/petrochemical industry integration G. Rispoli Platts 2nd Annual European Petrochemicals Conference Dusseldorf, Germany (March 11-12, 2015) 1 2 EST: the
CURRENT AGRICULTURAL INDUSTRIAL REPORTS
 CURRENT AGRICULTURAL INDUSTRIAL REPORTS USDA Agricultural Outlook Forum Troy Joshua, Chief Environmental, Economics, and Demographics Branch 2/20/2015 10:26 AM 1 Objectives Discuss the history of the Current
Presentation Plan. 1. Introduction. 2. Licensing Procedure in EMRA. 3. Current Situation on Licences
 Licensing Procedure in Turkish Electricity Sector (General Framework and Current Status) Iskender Basat SAHIN Energy Expert - EMRA isahin@epdk.org.tr Ankara 22/01/2013 Licensing Procedure in Turkish Electricity
Monthly Report on the Corporate Goods Price Index ( Preliminary Figures for October 2017 )
") Research and Statistics Department Bank of Japan Report on the Corporate Goods Price Index FOR RELEASE 8:50 A.M. Monday, November 13, 2017 The Producer Price Index rose 0.3 percent from the previous. The
Research and Statistics Department Bank of Japan Report on the Corporate Goods Price Index FOR RELEASE 8:50 A.M. Monday, November 13, 2017 The Producer Price Index rose 0.3 percent from the previous. The
SDT: KINGDOM OF TONGA NATIONAL ACCOUNTS STATISTICS
 SDT: 35-13 Statistics Department P.O. Box 149, Nuku alofa Government of Tonga Telephone: (676) 23-300 / 23-913 Email: dept@stats.gov.to Website: www.spc.int/prism/tonga/ Price: T$25.00 1 1 2 3 4 5 6 7
Waste-based Feedstock for the Global Biofuel Market
 Waste-based Feedstock for the Global Biofuel Market Vasu R. Vasuthewan Eco Oils Group Singapore ISCC/ PRIMA Conference Plugging the West Coast Carbon short-the Coming Low Carbon Shortage and Need for Sustainability
THE MACHINERY INDUSTRY OF JAPAN 2009
 00 2010 THE MACHINERY INDUSTRY OF JAPAN 2009 CONTENTS 1. Recent Trends in the Machinery Industry 1-1. Production Trends... 1 1-2. Foreign Trade... 1 2. The Importance of the Machinery Sector in Japanese
The Future of Energy Intensive Industry
 The Future of Energy Intensive Industry Mike Fuge CEO Refining NZ 1 November 2018 1 KEY INFRASTRUCTURE ASSET Supplies 70% of the country s refined fuel products Operates the multi-product pipeline supplying
Uk Fuel Market Review Rac Foundation The Independent
 We have made it easy for you to find a PDF Ebooks without any digging. And by having access to our ebooks online or by storing it on your computer, you have convenient answers with uk fuel market review
is the 100-year global warming potential for CO2, equivalent to 1 tonnes CO2e.
 Methodology for Establishing Fuel-Specific Carbon Levies: The following steps outline the calculation methodology for fuel-specific carbon levies: 1. Obtain fuel specific emission factors from Environment
Monthly Report on the Corporate Goods Price Index ( Preliminary Figures for June 2014 )
") Research and Statistics Department Bank of Japan Report on the Corporate Goods Price The Producer Price rose 0.2 percent from the previous. The Export Price (contract currency ) fell 0.1 percent from the
Research and Statistics Department Bank of Japan Report on the Corporate Goods Price The Producer Price rose 0.2 percent from the previous. The Export Price (contract currency ) fell 0.1 percent from the