Huntington Power Plant. Notice of Intent. Submitted to the Utah Division of Air Quality And Prepared by
|
|
|
- Maryann Mathews
- 6 years ago
- Views:
Transcription
1 Huntington Power Plant Notice of Intent Submitted to the Utah Division of Air Quality And Prepared by 1407 West North Temple Salt Lake City, Utah April 11, 2008
2 1.0 Introduction PacifiCorp Energy proposes to add new air pollution control devices that will significantly lower unit-specific emissions for particulate matter (PM 10 ), sulfur dioxide (SO 2 ) and nitrogen oxides (NO X ) at the Huntington Power Plant located near Huntington, in Emery County, Utah. The installation of this pollution control equipment, along with planned maintenance activities in 2010, requires an analysis of the air quality impacts of the projects and submittal of this construction permit application to the Utah Division of Air Quality. Through this Notice of Intent application, PacifiCorp Energy is seeking to: Obtain an Approval Order for proposed Huntington Plant projects including the installation of new pollution control devices on Unit 1. Establish plantwide applicability limits for nitrogen oxides (NO X ) and sulfur dioxide (SO 2 ). The plantwide applicability limits (PALs) will allow the facility to conduct ongoing plant maintenance while ensuring the facility remains in compliance with New Source Review requirements. The requested PALs include: o Establishing a NO X PAL of 11,395.5 tons/year following completion of the Unit 1 low-no X project. o Establishing an SO 2 PAL of 5,260.2 tons/year following completion of the Unit 1 flue gas desulfurization system (SO 2 scrubber) upgrade projects. Obtain a lower particulate matter emission rate limit for Unit 1 following the completion of the fabric filter baghouse installation. The requested PM 10 limit includes: o Establishment of a Unit 1 PM 10 limit of 74 lb/hour following installation of the fabric filter baghouse. Obtain a lower NO X emission rate limit for Unit 1. The requested NO X limit includes: o Establishment of a Unit 1 NO X limit of 1,290 lb/hour (0.26 lb/mmbtu) on a 30- day rolling average following installation of the Unit 1 low-no X system. Obtain a lower SO 2 emission rate limit for Unit 1. The requested SO 2 limit includes: o Establishment of a Unit 1 SO 2 limit of 595 lb/hour (0.12 lb/mmbtu) on a 30-day rolling average basis following completion of the scrubber upgrade projects. Because the installation of the Unit 1 low-no X control systems may increase emissions of carbon monoxide, and because the emissions evaluation indicates that the future potential CO emissions increase is above the PSD significance threshold of 100 tons/year, PacifiCorp requests that a CO limit be established for Huntington Unit 1. The requested limit is based on carbon monoxide emission rates utilizing good combustion control methods on Unit 1 following the low-no X control system installation. The requested carbon monoxide limits include: 1
3 o Establishment of a Unit 1 CO limit of 1,686 lb/hour (0.34 lb/mmbtu) on a 30-day rolling average following completion of the Unit 1 low-no X control project. The planned Huntington pollution control equipment projects are identified in the following table: Table 1.0: Huntington Pollution Control Equipment Projects Unit 1 Replacement of the electrostatic precipitator with a fabric filter baghouse Upgrade of the flue gas desulfurization system (scrubber) to increase sulfur dioxide removal efficiency Installation of a low-no X control system 1.1 Existing Operations PacifiCorp owns and operates the Huntington Power Plant which consists of two 480 net MW (nominal) coal-fired electric generating units designated as Unit 1 and Unit 2. Unit 1 went into commercial operation in 1973 with Unit 2 commencing operation in The Huntington Power Plant is an existing major stationary source of air emissions under both the New Source Review and Title V programs. Units 1 and 2 each have a maximum boiler heat input rate of 4,960 MMBtu/hour. 1.2 Emissions Analysis The emission control projects proposed in this Notice of Intent permit application include the installation of a low-no X control system on Unit 1; an upgrade of the Unit 1 flue gas desulfurization system (scrubber); and the replacement of the existing Unit 1 electrostatic precipitator with a new fabric filter baghouse. These projects will result in an improved particulate matter removal rate, reduced SO 2 emission rate and reduced NO X emission rate for Unit 1. To establish a clear baseline for determining when PSD requirements may be triggered in the future, PacifiCorp is proposing to establish plantwide applicability limits for SO 2 and NO X that would limit plantwide emissions of these pollutants at the facility to the past actual baseline emissions as defined by the Environmental Protection Agency s (EPA) past actual to future actual emissions test. The plantwide applicability limits would be in addition to the new, lower unit-specific limits to be established as a result of adding the proposed air pollution control devices. Establishing plantwide limits for SO 2 and NO X will ensure that any proposed project will not cause an associated emissions increase of these specific pollutants. 2
4 1.3 Prevention of Significant Deterioration Review The Huntington Plant is located in an area classified as attainment for all criteria pollutants and is a listed PSD Source Category; therefore, the requirements of the federal PSD program, as administered by the Utah Division of Air Quality will apply to the projects specified in this Notice of Intent. As a result of the PSD review described in more detail below, PacifiCorp has concluded that there will not be a significant net emissions increase as defined in 40 CFR Part 52 for SO 2, NO X, PM 10, lead, hydrogen fluoride, sulfuric acid, or VOCs; therefore, a BACT review for these pollutants will not be required. PacifiCorp has included a BACT review for carbon monoxide. 1.4 Compliance with National Ambient Air Quality Standards for Class I and Class II Areas and NSPS The facility, after completing the planned projects, will continue to meet all National Ambient Air Quality Standards (NAAQS) and the Class I and Class II PSD increments in the vicinity of the plant. A dispersion modeling analysis has been performed for CO, which has the potential of a significant net emissions increase. Unit 1 will continue to meet the applicable New Source Performance Standards (NSPS) defined in the federal regulations at 40 CFR 60 Subpart D. 2.0 Project Description PacifiCorp plans to install pollution control equipment and implement other plant projects between September and December 2010 as reflected in the project timeline shown in Table 2.1. These projects are listed in Appendix A. The projects identified are based on current plans and may be refined as overhaul schedules and equipment status change. Additional information will be provided to the Utah Division of Air Quality as PacifiCorp further refines the project schedule and scope. The planned Huntington Plant projects are summarized as follows: Huntington Unit 1 Installation of a fabric filter baghouse to replace an existing electrostatic precipitator Upgrade of an existing flue gas desulfurization system (SO 2 scrubber) Installation of a boiler low-no X control system Plant projects listed in Appendix A 3
5 Table 2.1 contained on the following page identifies the planned Huntington Power Plant project schedule from 2008 through Table 2.1 includes major plant maintenance projects as well as pollution control equipment installations. 4
6 Table 2.1: Huntington Project Schedule January 1, 2008 January 1, 2009 January 1, 2010 January 1, 2011 January 1, 2012 January 1, 2013 January 1, 2014 January 1, 2015 April 1 October 1 April 1 October 1 April 1 October 1 April 1 October 1 April 1 October 1 April 1 October 1 April 1 October 1 July 1 July 1 July 1 July 1 July 1 July 1 July Huntington Unit 1 Outage: September 18 - November 22 Replace ESP with fabric filter baghouse Install low-no X control system Upgrade flue gas desulfurization system HP/IP/LP turbine upgrade Install submerged drag chain conveyor Boiler economizer replacement Boiler finishing superheater replacement Mercury controls Boiler rear reheater replacement Boiler waterwall nose arch replacement Boiler coutant slope replacement Boiler radiant low temperature reheater replacement (50% ) Boiler superheater platens partial replacement Boiler burner corner/transition tube replacement Replace four boiler sootblower waterwall panels Replace 1-7 feedwater heater Replace 1-6 feedwater heater Replace 1-2 feedwater heater Replace 1-1 feedwater heater Boiler feed pump turbine rotor replacement Coat circulating water line 5
7 3.0 List of Potential Air Emission Points and Air Contaminants Emissions Summary The Huntington Power Plant operates under Title V operating permit # and has incorporated all applicable requirements contained in Approval Order DAQE-AN dated March 30, 2005 and Approval Order DAQE-AN dated August 14, The facility s Title V permit identifies the facility s emission points and potential air contaminants. The existing permitted emissions points and potential air contaminants as identified in the facility s current Title V operating permit do not change as a result of these projects. 4.0 Evaluation of Historic and Future Emission Rates 4.1 Project Description This section presents the method for conducting various PSD evaluations, including: A determination of baseline actual emissions for SO 2, NO X, PM 10, CO, ozone (as non-methane VOCs), fluoride (as hydrogen fluoride), lead, and sulfuric acid. A determination of projected actual emissions of SO 2, NO X, PM 10, CO, VOCs, fluorides, lead, and sulfuric acid. A comparison between the CO, PM, VOCs, fluorides, lead, and sulfuric acid past actual baselines and future potential emissions to determine if PSD significance levels are triggered. This section also sets forth the proposed plantwide applicability limits for SO 2 and NO X. The evaluation of historic (baseline) and future potential pollutant emission rates are contained in Appendix B of this permit application. 4.2 Baseline Actual Emissions The pollutants of interest for this review are SO 2, NO X, PM 10, CO, VOCs, fluorides, lead, and sulfuric acid Calculation of Baseline Actual Emissions 40 CFR 52.21(b)(48)(i) describes baseline actual emissions for the Huntington Power Plant as follows: 6
8 Baseline actual emissions means the rate of emissions, in tons per year, of a regulated NSR pollutant, as determined in accordance with paragraphs (b)(48)(i) through (iv) of this section. (i) For any existing electric utility steam generating unit, baseline actual emissions means the average rate, in tons per year, at which the unit actually emitted the pollutant during any consecutive 24-month period selected by the owner or operator within the 5-year period immediately preceding when the owner or operator begins actual construction of the project. The Administrator shall allow the use of a different time period upon a determination that it is more representative of normal source operation. (a) The average rate shall include fugitive emissions to the extent quantifiable, and emissions associated with startups, shutdowns, and malfunctions. (b) The average rate shall be adjusted downward to exclude any noncompliant emissions that occurred while the source was operating above any emission limitation that was legally enforceable during the consecutive 24-month period. (c) For a regulated NSR pollutant, when a project involves multiple emissions units, only one consecutive 24-month period must be used to determine the baseline actual emissions for the emissions units being changed. A different consecutive 24-month period can be used for each regulated NSR pollutant. (d) The average rate shall not be based on any consecutive 24-month period for which there is inadequate information for determining annual emissions, in tons per year, and for adjusting this amount if required by paragraph (b)(48)(i)(b) of this section. To identify and calculate baseline actual emissions, PacifiCorp has used data from the EPA Clean Markets Division s emissions database and annual emissions inventories. In order to comply with the EPA s acid rain program, PacifiCorp utilizes continuous emissions monitors (CEMs) to report hourly SO 2 and NO X emissions for each unit at the Huntington facility. CEMs are also used to obtain and report the hourly heat input rates into each unit s boiler. The hourly emissions and heat input data is submitted to the EPA on a quarterly basis and is readily available on the EPA s website located at For purposes of this review the 5-year evaluation period is from January 2003 through December The baseline actual emissions are summarized in Table
9 SO 2 Emissions Appendix B, Table HUN-1 identifies the monthly SO 2 emissions for the relevant time period. This data was obtained from the Environmental Protection Agency s (EPA) Acid Rain Emissions database for the Unit 1 and Unit 2 stack emissions and from the Huntington Plant s annual emissions inventory for non-stack emissions. The monthly data and emissions inventory data was used to calculate the maximum past actual annual plant SO 2 emission rate of 19,141.2 tons/year. NO X Emissions Appendix B, Table HUN-3 identifies the monthly NO X emissions for the relevant time period. This data was obtained from the Environmental Protection Agency s (EPA) Acid Rain Emissions database for the Unit 1 and Unit 2 stack emissions and from the Huntington Plant s annual emissions inventory for non-stack emissions. The monthly data were used to calculate the maximum past actual Unit 1 NO X emission rate of 6,194.8 tons/year; the Unit 2 baseline emission rate of 5,648.4 tons/year was calculated on a potential to emit basis based on the 0.26 lb/mmbtu limit which was implemented following the 2006 Unit 2 low-no X control projects; and emissions inventory data was used to calculate the maximum past actual non-stack emission rate of 58.6 tons/year. These individual values were used to obtain a baseline NO X emission rate of 11,901.9 tons/year. Particulate Matter Emissions Appendix B, Table HUN-7 identifies the monthly PM 10 emissions for the relevant time period. The facility PM 10 emission rates are based on annual stack test data, in units of lb/mmbtu multiplied by the Unit-specific monthly boiler heat input values identified in the EPA s Acid Rain Emissions database to calculate the Unit 1 and Unit 2 stack emission rates. The Huntington Plant s annual emissions inventory database was used to identify the maximum non-stack emission rate. As indicated in Table HUN-7, the Huntington Plant had a maximum past actual 5- year PM 10 emission rate of 1,759.4 tons/year. Carbon Monoxide Carbon monoxide emissions for Unit 1 and Unit 2 have been determined by multiplying the past annual coal consumption (Appendix B, Table HUN-6) by the AP-42 emission factor for carbon monoxide emissions from coal fired boilers. The maximum non-stack carbon monoxide emission rates were obtained from the Huntington Plant s annual emissions inventory database. The maximum past actual total Huntington CO emission rate was tons/year. The result of the past actual CO emissions evaluation is contained in Appendix B, Table HUN-15. 8
10 Volatile Organic Compounds Volatile organic compound emissions for Unit 1 and Unit 2 have been determined by multiplying the past annual coal consumption (Appendix B, Table HUN-6) by the AP-42 emission factor for volatile organic compounds emissions from coal fired boilers. The maximum non-stack VOC emission rates were obtained from the Huntington Plant s annual emissions inventory database. The maximum past actual total Huntington Plant VOC emission rate was 93.8 tons/year. The result of the past actual VOC emissions evaluation is contained in Appendix B, Table HUN-17. Lead Emissions Lead emissions have been determined from the average past annual lead concentrations in the coal burned, the average past annual coal ash concentrations, the annual particulate matter emission rates, the annual boiler heat input rates (Appendix B, Table HUN-5) and the Method specified in AP-42 for determining lead emissions from coal fired boilers. The maximum past actual total Unit 1 and Unit 2 lead emission rate was 0.13 tons/year. The result of the past actual lead emissions evaluation is contained in Appendix B, Table HUN-13. Fluoride Emissions Fluoride emissions, as hydrogen fluoride, have been determined from the 5-year average annual fluorine concentrations contained in coal burned at the Huntington Plant and from the past actual annual coal burn rates as indicated in Table HUN- 6. The Electric Power Research Institute (EPRI) LARK-TRIPP method for the determination of hydrogen fluoride (HF) emissions was used to calculate the maximum past actual annual HF emission rate of tons/year as indicted in Table HUN-9. Sulfuric Acid Emissions Sulfuric acid emissions are calculated using past actual annual coal sulfur concentrations, past actual annual heat input rates (HUN-5) and Electric Power Research Institute s Estimating Total Sulfuric Acid Emissions from Stationary Power Plants, Technical Update, April 2007 method for calculating H 2 SO 4 emissions. The maximum past actual total Unit 1 and Unit 2 sulfuric acid emission rate was 16.4 tons/year. The result of the past actual sulfuric acid emissions evaluation is contained in Appendix B, Table HUN-11. 9
11 Table 4.2 indicates the annual past actual baseline emission rates for the Huntington Plant pollutants identified above. Table 4.2: Summary of Huntington Baseline Emissions Huntington Units 1 and 2 Stack Emissions SO 2 tons/year NO X tons/year PM 10 tons/year HF tons/year H 2 SO 4 tons/year Lead tons/year CO tons/year VOC tons/year 19, , , Non-Stack Emissions Baseline Actual Emissions 19, , , Projected Actual Emissions for Prevention of Significant Deterioration Pollutants The next step in the emission rate evaluation is to project actual emission rates for each pollutant. This is accomplished by determining the projected actual emissions based on coal quality, unit utilization, addition of pollution controls and expected emission rates. Projected actual emissions are defined as follows: 40 CFR 52.21(b)(41)(i) Projected actual emissions means the maximum annual rate, in tons per year, at which an existing emissions unit is projected to emit a regulated NSR pollutant in any one of the 5 years (12-month period) following the date the unit resumes regular operation after the project, or in any one of the 10 years following that date, if the project involves increasing the emissions unit s design capacity or its potential to emit that regulated NSR pollutant and full utilization of the unit would result in a significant emissions increase or a significant net emissions increase at the major stationary source. (ii) In determining the projected actual emissions under paragraph (b)(41)(i) of this section (before beginning actual construction), the owner or operator of the major stationary source: (a) Shall consider all relevant information, including but not limited to, historical operational data, the company s own representations, the company s expected business activity and the company s highest projections of business activity, the company s filings with the State or Federal regulatory authorities, and compliance plans under the approved State Implementation Plan; and (b) Shall include fugitive emissions to the extent quantifiable and emissions associated with startups, shutdowns, and malfunctions; and 1 Maximum past non-stack emissions from emissions inventories 10
12 (c) Shall exclude, in calculating any increase in emissions that results from the particular project, that portion of the unit s emissions following the project that an existing unit could have accommodated during the consecutive 24-month period used to establish the baseline actual emissions under paragraph (b)(48) of this section and that are also unrelated to the particular project, including any increased utilization due to product demand growth; or (d) In lieu of using the method set out in paragraphs (a)(41)(ii)(a) through (c) of this section, may elect to use the emissions unit s potential to emit, in tons per year, as defined under paragraph (b)(4) of this section. PacifiCorp has proposed to accept plantwide applicability limits (PALs) for SO 2 and NO X which are based on the Huntington Plant s past actual baseline emission rates. With these caps in place there is no potential that future emissions will be greater than past actual emissions, and no additional evaluation of future emissions is required Calculation Projected Annual Emissions Under the provisions of 40 CFR 52.21(b)(41)(ii)(d) PacifiCorp has elected to determine the future emission rates of SO 2, NO X, PM 10, fluoride (as HF), sulfuric acid, lead, CO and VOCs based on the facility s potential to emit these pollutants. The future annual emission rates are based on applicable pollutant emission limitations at existing or requested future emission limits as well as on a maximum annual boiler operating time of 8,760 hours/year, a Unit 1 boiler heat input rate of 4,960 MMBtu/hour and a Unit 2 boiler heat input rate of 4,960 MMBtu/hour. The facility s average 5-year unit-specific coal heating values, in units of Btu/lb are used to calculate the maximum annual unit-specific coal burn rates based on the unit-specific Units 1 and 2 boiler heat input rates as indicated above. Finally, where applicable, EPA AP-42 emission factors are used to calculate future potential pollutant emission rates. 11
13 Boiler Heat Input Unit-specific boiler heat input rates are used to calculate future potential emission rates at applicable pollutant emission limitations or, where appropriate, using EPA AP-42 emission factors. Other valid emission calculation methods, such as LARK-TRIPP were used to calculate HF and H 2 SO 4 emission rates. A review of the EPA s Clean Air Markets Acid Rain database was used to identify the Huntington Plant s unit-specific maximum boiler heat input rates for the 5-year evaluation period used for this construction permit application. An evaluation of the Acid Rain database indicates a maximum Unit 1 boiler heat input rate of 4,960 MMBtu/hour and a Unit 2 boiler heat input rate of 4,960 MMBtu/hour. Coal Burn Boiler coal burn rates are used to calculate some future potential emission rates such as hydrogen fluoride and carbon monoxide using appropriate AP-42 emission factors. Maximum future potential coal burn rates were calculated based on the 5-year average unit-specific coal heating content values and the unitspecific boiler heat input rates identified above. A 5-year review of Huntington s most recent ( ) coal heating content data indicates that Unit 1 had an average coal heating value of 11,268.3 Btu/lb and Unit 2 had an average coal heating value of 11,263.1 Btu/lb. Maximum future annual coal burn rates can then be calculated using the average coal heating content values; the unit-specific boiler heat input rates; and a maximum annual boiler operating time of 8,760 hours/year. Using these data and appropriate conversion factors provides a maximum Unit 1 future annual coal burn rate of 1,927,958 tons/year and a maximum Unit 2 future annual coal burn rate of 1,928,844 tons/year as indicated in Table HUN-10. Sulfur Dioxide (SO 2 ) Emissions In this construction permit application PacifiCorp is requesting that a PAL be established for SO 2. The future potential SO 2 emission rate for Unit 1 of 2,607.0 tons/year; the future potential Unit 2 SO 2 emission rate of 2,607.0 tons/year; the maximum past actual non-stack emission rate of 6.2 tons/year; and the PSD significance level of 40 tons/year were used to establish the requested PAL value of 5,260.2 tons/year as indicated in Table HUN-2. Nitrogen Oxides (NO X ) Emissions In this construction permit application PacifiCorp is requesting that a PAL be established for NO X. The future potential NO X emission rate for Unit 1 of 5,648.4 tons/year; the future potential Unit 2 NO X emission rate of 5,648.4 tons/year; the maximum past actual non-stack emission rate of 58.6 tons/year; and the PSD significance level of 40 tons/year were used to establish the requested PAL value of 11,395.5 tons/year as indicated in Table HUN-4. 12
14 Particulate Matter Emissions Post-pollution control project PM 10 emission limits were used to calculate the future potential Unit 1 and Unit 2 exhaust stack particulate matter emission rates. Following installation of the Unit 1 filter baghouse, Unit 1 will have a future potential PM 10 emission rate of tons/year based on a requested limit of 74 lb/hour and Unit 2 will have a future potential PM 10 emission rate of tons/year based on an existing limit of 70 lb/hour. These unit-specific PM 10 emission rates plus the maximum non-stack PM 10 emission rate of tons/year provide a future total particulate matter emission rate of tons/year as indicated in Table HUN-8. Carbon Monoxide Emissions PacifiCorp is requesting that a Unit 1 carbon monoxide (CO) emission limit of 0.34 lb/mmbtu on a 30-day rolling average basis be established following installation of the low-no X control system on the Unit 1 boiler. A maximum future potential Unit 1 CO emission rate of 7,386.4 tons/year was calculated based on the requested emission limit of 0.34 lb/mmbtu and a boiler heat input rate of 4,960 MMBtu/hour. A maximum future potential Unit 2 CO emission rate of tons/year was calculated based on a future potential coal burn rate of 1,928,844 tons/year and the applicable AP-42 emission factor of 0.5 lb/ton. A future potential non-stack CO emission rate has been established that is equivalent to the maximum past actual non-stack CO emission rate of 24.8 tons/year. Summation of the unit-specific future potential CO emission rates plus the maximum non-stack CO emission rate establishes a total future potential Huntington Plant carbon monoxide emission rate of 7,893.4 tons/year as indicated in Table HUN-16. Volatile Organic Compound Emissions Maximum future potential volatile organic compound (VOC) emission rates were calculated based on the applicable AP-42 emission factor and on maximum future potential coal burn rates. The applicable VOC emission factor for coal-fired boilers is equivalent to 0.06 lb/ton of coal burned. The maximum future potential Unit 1 coal burn rate is equivalent to 1,927,958 tons/year and the maximum future potential Unit 2 coal burn rate is equivalent to 1,928,844 tons/year. Multiplying the 0.06 lb/ton VOC emission factor by the maximum coal burn rates establishes a maximum future potential Huntington Plant stack-only VOC emission rate of tons/year. Adding the maximum non-stack VOC emission rate of 2.7 tons/year to the tons/year stack emission rate established a total future potential Huntington VOC annual emission rate of tons/year as indicated in Table HUN
15 Lead Emissions Maximum future potential lead emission rates were calculated based on the applicable AP-42 emission factor for coal-fired boilers and on 5-year average unit-specific data including coal lead concentrations, coal ash concentrations, post-pollution control project PM 10 emission rates, and on future potential boiler heat input rates. Utilizing the appropriate AP-42 emission factor from EPA Table and an average Unit 1 and Unit 2 coal lead concentration of 4.74 ppm; average Unit 1 coal ash content of 14.47% and Unit 2 coal ash content of 14.51%; Unit 1 and Unit 2 PM 10 emission rate of lb/mmbtu; and future potential heat input rate of 43,449,600 MMBtu/year for each boiler establishes a maximum future potential lead emission rate of 83.6 lb/year for Unit 1 and 83.4 lb/year for Unit 2. Summation of the unit-specific lead emission rates establishes a maximum future potential Huntington Plant lead emission rate of lb/year or 0.08 tons/year as indicated in Table HUN-14. Fluoride Emissions Maximum future potential fluoride emission rates, as hydrogen fluoride, have been determined from the Huntington Plant s 5-year average annual coal fluoride concentrations, from the upgrade of the Unit 1 SO 2 scrubber that eliminates scrubber bypass, and from the maximum future potential unit-specific annual coal burn rates. The EPRI LARK-TRIPP method was used to calculate the maximum future potential HF emission rate of 34.0 tons/year as indicated in Table HUN-10. Sulfuric Acid Emissions EPRI s Estimating Total Sulfuric Acid Emissions from Stationary Power Plants, Technical Update, April 2007 method was used to calculate the Huntington Plant s maximum future potential H 2 SO 4 emission rate. Unit-specific future potential sulfuric acid emissions were calculated based on 5-year average annual coal sulfur concentrations; future potential boiler heat input values as indicated in Table HUN-10; and the elimination of bypass on the Unit 1 SO 2 scrubber. Using the EPRI calculation method and future potential heat input values and average 5- year coal sulfur concentrations provides a maximum future potential Huntington Plant H 2 SO 4 emission rate of 1.6 tons/year as indicated in Table HUN
16 Table 4.3 indicates the annual future potential emission rates for the Huntington Plant pollutants identified above. Table 4.3: Summary of Huntington Future Potential Emissions Huntington Unit 1 and Unit 2 Stack Emissions SO 2 2 tons/year NO X 2 tons/year PM 10 tons/year HF tons/year H 2 SO 4 tons/year Lead tons/year CO tons/year VOC tons/year , Non-Stack Emissions Future Potential Emissions 5, , , Prevention of Significant Deterioration Significance Determination In order to determine if a Prevention of Significant Deterioration (PSD) significance level has been reached the past actual baseline emissions for each pollutant is subtracted from the projected annual emissions. If a significance level has been exceeded for a pollutant then a Prevention of Significant Deterioration review must be performed for that pollutant. PacifiCorp is requesting that the past actual to future potential actual emissions test specified in the December 2002 revisions to the New Source Review rules [40 CFR 52.21] be used to establish Plantwide Applicability Limitations (PALs) for SO 2 and NO X at the Huntington Plant. These plantwide annual emission limits will be imposed to assure, through federal enforceability, that the future Potential to Emit for the facility, as a whole, will be no greater than historical emissions. Therefore, there will be no net emissions increase of sulfur dioxide or nitrogen oxides as defined as significant [40 CFR 52.21(b)(23)] with respect to PSD review of these pollutants under the provisions of a PSD major modification [40 CFR 52.21(b)(2)(i)]. PSD review will apply to the other regulated pollutants for which there is a net increase defined as significant [40 CFR 52.21(b)(23)]. 2 Because SO 2 and NO X emissions are being capped using plantwide applicability limitations (PALs) set at future potential (Unit 1) and future potential (Unit 2) stack emission rates, non-stack emission rates, plus the PSD significance level, the PALs become the future potential emission rates and no additional review is required. 3 Future potential non-stack emission rates obtained from maximum past actual emissions from emissions inventories 15
17 PacifiCorp requests the implementation of a NO X Plantwide Applicability Limitation (PAL) of 11,395.5 tons/year and an SO 2 PAL of 5,260.2 tons/year following completion and commercial acceptance of the Unit 1 low-no X and scrubber upgrade projects. In order to determine if a Prevention of Significant Deterioration significance level has been reached the past actual baseline emissions for each pollutant is subtracted from the projected annual emissions. If a significance level has been exceeded for a pollutant then a Prevention of Significant Deterioration review must be performed for that pollutant Contemporaneous Period and Pre-Project Actual Emissions Definition of a Major Modification An existing major source is subject to Prevention of Significant Deterioration review only if it undertakes a major modification [40 CFR 52.21(b)(2)(i)]. Major modification is defined as any physical change in or change in the method of operation of a major stationary source that would result in a significant net emissions increase of any pollutant subject to regulation under Clean Air Act [40 CFR 52.21(b)(23)]. A major modification does not include: routine maintenance, repair and replacement [40 CFR 52.21(b)(2)(iii)(a)] or an increase in the hours of operation or in the production rate [40 CFR 52.21(b)(2)(iii)(f)]. To determine if a Prevention of Significant Deterioration significance level has been reached the baseline actual emissions are subtracted from the projected actual emissions. The results of this evaluation for each pollutant are shown in Table
18 Table 4.4: Evaluation of Significance Level by Pollutant Pollutant Past Actual (Baseline) Emissions tons/year Projected Actual (Future Annual) Emissions tons/year Projected Actual minus Past Actual Emissions (Emission Increase) tons/year PSD Review Significance Level tons/year Is Emission Increase greater than PSD Significance Level SO 2 (Total: stack and non-stack emissions) NO X (Total: stack and non-stack emissions) PM 10 (Total: stack and non-stack emissions) Hydrogen Fluoride (Total: stack and non-stack emissions) (HF) Sulfuric Acid (Total: stack and non-stack emissions) (H 2 SO 4 ) Lead (Total: stack and non-stack emissions) Carbon Monoxide (Total: stack and non-stack emissions) (CO) VOC (Total: stack and non-stack emissions) 19, , , No 11, , No 1, No No No No , , Yes No 17
19 Determination of Major Modification Although the proposed projects may constitute a physical change at the plant, they will not result in significant net emissions increases of SO 2, NO X, particulate matter, hydrogen fluoride, sulfuric acid, lead or VOCs and therefore are not major modifications for these pollutants. The results of the emissions evaluation indicate that future potential emissions of CO may increase above the PSD significance level. 4.4 Requested Emission Rate Limits This section identifies the requested emission rate limits for Huntington Unit 1 following completion of the proposed pollution control equipment projects. The following emission rate limits are requested for Unit 1: Particulate matter = 10 microns (filterable): 74 lb/hour, annual average (4,960 MMBtu/hr x lb/ MMBtu) This limit will go into effect within 90 days after the Unit 1 fabric filter baghouse has been installed, tested and deemed commercial. It is expected that the Unit 1 fabric filter baghouse will be deemed commercial in April Sulfur dioxide: 595 lb/hour, 30-day rolling average This limit will go into effect within 90 days after the Unit 1 flue gas desulfurization system upgrade projects have been completed and deemed commercial. The expected commercial date is April After successful testing the equipment will be deemed commercial. Nitrogen oxides: 1,290 lb/hour, 30-day rolling average This limit will go into effect within 90 days after the low-no X projects have been completed and deemed commercial. The expected commercial date is April After successful testing the equipment will be deemed commercial. Carbon monoxide: 1,686 lb/hour, 30-day rolling average This limit will go into effect within 90 days after the low-no X burners have been installed, tested and deemed commercial. The expected installation date is April After successful testing the equipment will be deemed commercial. 18
20 Plantwide Applicability Limitations As indicated in Section 1.0 of this application, PacifiCorp Energy is requesting that SO 2 and NO X Plantwide Applicability Limitations (PALs) be established at the Huntington Plant following issuance of the requested construction permit. The following federally enforceable annual plantwide emission limits are requested for SO 2 and NO X. These limits are based on future potential Unit 1 and Unit 2 NO X and SO 2 emission rates; maximum past actual non-stack NO X and SO 2 emission rates; and NO X and SO 2 PSD significance threshold values of 40 tons/year. Following completion and certification of the Unit 1 low-no X projects it is requested that a NO X PAL be established at a rate of 11,395.5 tons/year. Following completion of the Unit 1 flue gas desulfurization system (SO 2 scrubber) upgrades it is requested that an SO 2 PAL be established at a rate of 5,260.2 tons/year. The following page containing Table 4.5 summarizes the emissions data and PSD significance values used to establish the requested NO X and SO 2 PAL values for the Huntington Power Plant. Table 4.6 contained on page 21 provides a summary of the past actual and future potential stack emission rates for NO X, SO 2, PM 10, HF, H 2 SO 4, lead, CO and VOC at the Huntington Plant. Table 4.7 contained on page 22 presents a chronology of the requested emission limits to be implemented at the Huntington Plant. 19
21 Table 4.5: Huntington Plant NO X and SO 2 PAL Evaluation Pollutant Maximum Past Actual Boiler Heat Input Emission Rate MMBtu/hour tons/year NO X (Plant Total) 11,901.9 NO X (Unit 1) NO X (Unit 2) NO X (Non-Stack) Emission Limit lb/mmbtu Annual Emissions tons/year 4, , , , PSD Significance Level tons/year Requested PAL tons/year 40 11,395.5 Notes Maximum past actual stack and non-stack NO X emission rate of 11,901.9 tons/year PacifiCorp requests that an 11,395.5 tons/year NO X PAL be established following completion of the Unit 1 low-no X control projects. The requested 11,395.5 tons/year value was set from future potential Unit 1 and Unit 2 emission rates, the maximum past actual non-stack emission rate, and the PSD significance threshold. SO 2 (Plant Total) 19,141.2 Maximum past actual stack and non-stack SO 2 emission rate of 19,141.2 tons/year SO 2 (Unit 1) SO 2 (Unit 2) SO 2 (Non-Stack) 4, , , , ,260.2 PacifiCorp requests that a 5,260.2 tons/year SO 2 PAL be established following completion of the Unit 1 scrubber upgrade projects. The requested 5,260.2 tons/year value was set from future potential Unit 1 and Unit 2 emission rates, the maximum past actual non-stack emission rate, and the PSD significance threshold. 20
22 Table 4.6: Huntington Emissions Summary Past Actual vs. Future Potential Maximum Past Actual Emission Rate Pollutant/Parameter Table Reference Maximum Future Potential Rate PSD Significance Level Is PSD Triggered Rate Increase/Decrease SO 2 Tables HUN-1 and HUN-2 19,141.2 tons/year 5,220.2 tons/year -13,921.0 tons/year 40 tons/year No NO X Tables HUN-3 and HUN-4 11,901.9 tons/year 11,355.5 tons/year tons/year 40 tons/year No Heat Input Tables HUN-5 and HUN-10 65,041,937 MMBtu/year 86,899,200 MMBtu/year Coal Burn Tables HUN-6 and HUN-10 3,037,478 tons/year 3,856,802 tons/year Particulate Matter (Stack and Non-Stack) Tables HUN-7 and HUN-8 1,759.4 tons/year tons/year tons/year 25 tons/year (15 tons/year for PM 10 ) No Hydrogen Fluoride Tables HUN-9 and HUN tons/year 34.0 tons/year tons/year 3 tons/year (fluoride) No Sulfuric Acid Tables HUN-11 and HUN tons/year 1.6 tons/year tons/year 7 tons/year No Lead Tables HUN-13 and HUN tons/year 0.08 tons/year tons/year 0.6 tons/year No Carbon Monoxide Tables HUN-15 and HUN tons/year 7,893.4 tons/year 7,109.3 tons/year 100 tons/year Yes VOC Tables HUN-17 and HUN tons/year tons/year 24.6 tons/year 40 tons/year No HAPs Tables HUN-19 and HUN tons/year 52.9 tons/year tons/year Note: Carbon monoxide is the only pollutant that has a post-project emission increase above its PSD significance level. 21
23 Table 4.7: Huntington Plant Emission Limit Summary 2010: Upon Certification of Pollution Control Equipment (a) Huntington Unit 1 will be subject to a 30-day rolling average NO X limitation of 1,290 lb/hour (b) Huntington Unit 1 will be subject to a 30-day rolling average SO 2 limitation of 595 lb/hour (c) Huntington Unit 1 will be subject to a CO limitation of 1,686 lb/hour on a 30-day rolling average (d) Huntington Unit 1 will be subject to a PM 10 limitation of 74 lb/hour within 90 days following the completion of the fabric filter baghouse installation (e) (f) The Huntington Plant will be subject to a NO X PAL of 11,395.5 tons/year The Huntington Plant will be subject to an SO 2 PAL of 5,260.2 tons/year 22
24 5.0 Description of Pollution Control Equipment 5.1 Sulfur Dioxide Unit 1 - Flue Gas Desulfurization (FGD) PacifiCorp will upgrade the wet flue gas desulfurization system on Huntington Unit 1 in 2010 which will be used to control sulfur dioxide (SO 2 ) emissions. In this application PacifiCorp requests that a 595 lb/hour emission limit, on a 30-day rolling average basis, be implemented following completion of the FGD system upgrade projects. 5.2 Nitrogen Oxides Unit 1 Low-NO X Burners PacifiCorp will install a low-no X boiler burner system on Huntington Unit 1 in 2010 which will be used to control nitrogen oxides (NO X ) emissions. In this application PacifiCorp requests that a 1,290 lb/hour emission limit, on a 30-day rolling average basis, be implemented on Unit 1 following construction of the low-no X system. 5.3 Particulate Matter Unit 1 Fabric Filter Baghouse PacifiCorp requests that a pulse jet fabric filter baghouse be installed on Unit 1 in 2010 to replace the existing electrostatic precipitator. The specification for the pulse jet fabric filter is being finalized at this time. PacifiCorp requests that a 74 lb/hour PM 10 limit be established on Unit 1 following completion of construction of the pulse jet fabric filter baghouse. 6.0 Best Available Control Technology Determination The Clean Air Act s PSD program provides that a Best Available Control Technology analysis must be conducted if a proposed project will result in a significant increase of a PSD pollutant. Applicability PacifiCorp has determined that the projects proposed for the Huntington Power Plant may result in a significant increase (as determined by the thresholds established in the regulations) of carbon monoxide (CO). Therefore, PacifiCorp has conducted a Best Available Control Technology analysis for CO in this construction permit application. 23
25 The EPA has developed a process for conducting Best Available Control Technology analyses. This method is referred to as the top-down method. The steps to conducting a top-down analysis are listed in Environmental Protection Agency s New Source Review Workshop Manual Draft, October The steps are: Step 1 Identify All Control Technologies Step 2 Eliminate Technically Infeasible Options Step 3 Rank Remaining Control Technologies by Control Effectiveness Step 4 Evaluate Most Effective Controls and Document Results Step 5 Select Best Available Control Technology Carbon Monoxide Best Available Control Technology Analysis Combustion controls designed to reduce NO X emissions may increase carbon monoxide by creating oxygen deficient combustions zones in the boiler. These controls are balanced to provide the maximum NO X reduction while minimizing carbon monoxide emission increases. Step 1 - Identify All Control Technologies Only two control technologies have been identified for control of carbon monoxide. Catalytic oxidation Combustion controls The catalytic oxidation is a post-combustion control device that would be applied to the combustion system exhaust, while combustion controls are part of the combustion system design of the boiler. Step 2 - Eliminate Technically Infeasible Options Catalytic oxidation has been used to obtain the most stringent control of carbon monoxide emissions from combustion turbines firing natural gas. This alternative, however, has never been applied to a coal-fired boiler and has not been demonstrated to be a practical technology in this application. For sulfur-containing fuels such as coal, an oxidation catalyst will convert SO 2 to SO 3, resulting in unacceptable levels of corrosion to the flue gas system as SO 3 is converted to H 2 SO 4. Generally, oxidation catalysts are designed for a maximum particulate loading of 50 milligrams per cubic meter. Huntington Unit 1 has a particulate matter loading upstream of its respective particulate matter control devices in excess of 5,000 milligrams per cubic meter. In addition, trace elements present in coal, particularly chlorine, are poisonous to oxidation catalysts. Catalysts have not been developed that have or can be applied to coalfired boilers due to the high levels of particulate matter and trace elements present in the flue gas. 24
26 Although the catalyst could be installed downstream of the particulate matter pollution control devices (Unit 1 and Unit 2 fabric filter baghouses and wet scrubbers), the flue gas temperature at that point will be less than 300º F, which is well below the minimum temperature required (600ºF) for the operation of the oxidation catalyst. Utilization of a catalyst would require the flue gas to be reheated, resulting in significant negative energy and economic impacts. For these reasons, as well as the low levels of CO in coal-fired units, no pulverized-coalfired boilers have been equipped with oxidation catalysts. Use of an oxidation catalyst system is thus considered technically infeasible and this system cannot be considered to represent Best Available Control Technology for control of carbon monoxide. Step 3 - Rank Remaining Control Technologies by Control Effectiveness Based on the Step 2 analysis, combustion control is the only remaining technology for this application. Step 4 - Evaluate Most Effective Controls and Document Results There are no environmental or energy costs associated with combustion controls. Step 5 - Select Best Available Control Technology The EPA New Source Review, RACT, BACT, LAER Clearinghouse database for comparable sources related to CO is shown in Table 6.1. The final step in the top-down Best Available Control Technology analysis process is to select Best Available Control Technology. Based on the above analysis, good combustion control for CO is chosen as Best Available Control Technology for these projects. Because there is a balance between reducing NO X emissions with advanced combustion controls and increasing CO emissions, i.e., the lower the NO X emissions the greater the potential for an increase in CO emissions, a 30-day rolling average emission limit of 1,686 lb/hour for CO is recommended for Huntington Unit 1. References U.S. Environmental Protection Agency, 2007, RACT/BACT/LAER Clearinghouse Database Utah Department of Administrative Services. Title R307, Air Quality. Utah Administrative Code. 25
27 Table 6.1: Review of EPA RACT/BACT/LAER Clearinghouse (RBLC) for Carbon Monoxide Emission Limits Company Plant Heat Input CO Emission Limit Averaging Time Boiler Construction Date/Permit Date Emission Control Description RBLC ID 1MidAmerican Energy Co., Iowa George Neal North-Neal 1 Boiler 1,363 MMBtu/hr 1.26 lb/mmbtu 3-hour average /17/2006 Good Combustion Practices IA MidAmerican Energy Co., Iowa Neal Energy Center South- Unit 4 Boiler 6,900 MMBtu/hr 0.42 lb/mmbtu 1 calendar day 1977/ /2006 Good Combustion Practices IA Reliant Energy, Texas Washington Parish Electric Generating Station Unit 7 6,700 MMBtu/hr 0.33 lb/mmbtu Unknown Unknown 01/04/2005 Combustion Control TX CO was the only pollutant with a projected increase in emissions in the change to add an over fire air system, date of determination BACT-PSD 01/17/ CO was the only pollutant with a projected increase in emissions in the change for installation of a new low NOx burner and the addition of over fire air system, date of determination BACT-PSD 01/26/ Case-by-case BACT PSD 26
28 7.0 Regulatory Review The Clean Air Act s PSD program provides that a Best Available Control Technology analysis must be conducted if a proposed project will result in a significant increase This section provides a regulatory review of the applicability of state and federal air quality permitting requirements for the addition of the emission controls and other plant projects. State of Utah Air Permitting Requirements The State of Utah has been granted authority to implement and enforce the federal Clean Air Act [pursuant to the State Implementation Plan review and approval process] and federal air permitting requirements which are embodied within the state rules. The plant is a major stationary source of air emissions, as defined within the Utah Administrative Code, 40 CFR 70 (Title V Operating Permits) and 40 CFR Part (PSD Program Requirements). The Utah Department of Environmental Quality, Utah Division of Air Quality, has previously issued permits and permit revisions as appropriate for the existing Plant facilities. The general requirements for permits and permit revisions are codified under the state environmental protection regulations Utah Administrative Code R307 (Environmental Quality, Air Quality). Notice of Intent and Approval Order (UAC R ) The replacement, addition or upgrade of existing emissions controls will result in a potential increase of some air pollutant emissions, necessitating the issuance of an approval order pursuant to UAC R PacifiCorp is required by UAC R to submit to the Utah Division of Air Quality this Notice of Intent application and obtain a Utah Division of Air Quality-issued approval order prior to the initiation of construction activities associated with the proposed projects. Operating Permit Requirements (UAC R ) The federal operating permit program (Title V) is implemented by regulations codified at 40 CFR Part 70 and 71. The State of Utah has been granted authority to implement and enforce the federal Title V program through state regulations outlined under UAC R PacifiCorp currently has a Utah Division of Air Quality issued Title V Operating Permit (Permit No ) for the Huntington Power Plant. The replacement, addition of, or upgrade to existing air emissions controls and other plant projects constitute a significant change to the plant and will therefore require a modification of the existing Title V permit. 27
29 Prevention of Significant Deterioration (UAC R ) Within the federal New Source Review regulations, a subset of rules, which apply to major sources and major modifications within attainment areas, is referred to as the Prevention of Significant Deterioration program. Since the planned projects are at a current PSD source, located in an area classified as attainment for all criteria pollutants, the PSD program will apply to the permitting of these projects. The Utah Division of Air Quality has been delegated full authority from the EPA for administering the federal PSD rules; consequently, these requirements are codified within the state s permitting rules at UAC R The PSD program defines a major stationary source as: 1. Any source type belonging to one of the 28 listed source categories that has a potential-to-emit (PTE) of 100 tons per year or more of any criteria pollutant regulated under the CAA, or 2. Any other (non-categorical) source type with a PTE of 250 tpy of any pollutant regulated under the CAA. The Huntington facility is a fossil-fuel-fired steam electric plant of more than 250 million Btu/hr heat input and is considered an existing major stationary source because of the potential to emit for sulfur dioxide, nitrogen oxides, particulate matter, carbon monoxide, volatile organic compounds, and hydrogen fluoride all exceed the limits listed in this section. Modifications to an existing major source are considered major and subject to PSD review if the resulting net emissions increase is equal to or greater than the corresponding significant emissions increase threshold for each respective pollutant. A net emissions increase includes both of the following: The potential increase in emissions due to the modifications itself; and Contemporaneous net emissions increases and decreases of regulated air pollutants, under the PSD program An emissions increase is considered significant if emissions meet or exceed any of the following rates: CO, 100 tpy NO X, 40 tpy SO 2, 40 tpy PM 10, 15 tpy Particulate matter, 25 tpy Ozone, 40 tpy of VOCs Lead, 0.6 tpy 28
30 Fluorides, 3 tpy Hydrogen sulfide, 10 tpy New and Modified Sources in Non-attainment Areas and Maintenance Areas The plant is not located in a non-attainment or maintenance area. Therefore, a nonattainment New Source Review analysis is not required. Emissions Impact Analysis (UAC R ) Because the addition of combustion control technology (Unit 1 low-no X burners) may result in an increase in CO emissions, the project is subject to UAC R which describes the emission impact analysis requirements in attainment areas. CO is not a hazardous air pollutant; therefore, is not subject to the hazardous air pollutant modeling requirement in R There may be an increase of a criteria air pollutant (CO) as a result of the project, and therefore there is a required criteria impact analysis under R PacifiCorp will use a consultant to conduct an air quality modeling analysis for CO. Monitoring and Reporting After an approval order is received, PacifiCorp will be required to conduct monitoring, recordkeeping and reporting as specified in 40 CFR 52.21a and submit emission reports, ensure that equipment meets certain specifications, and conduct other activities as the Utah Division of Air Quality requests. Some of these requirements are enumerated below: Meet the reporting requirements specified in UAC R in the event of an unavoidable breakdown. Submit and retain air emission inventory and perform testing and monitoring as required in UAC R
31 Appendix A: Huntington Unit 1 Projects Year Unit Project Replace ESP with fabric filter baghouse Install low-no X control system Upgrade flue gas desulfurization system HP/IP/LP turbine upgrade Install submerged drag chain conveyor Boiler economizer replacement Boiler finishing superheater replacement Mercury controls Boiler rear reheater replacement Boiler waterwall nose arch replacement Boiler coutant slope replacement Boiler radiant low temperature reheater replacement (50% replacement) Boiler superheater platens partial replacement Boiler burner corner/transition tube replacement Replace four boiler sootblower waterwall panels Replace 1-7 feedwater heater Replace 1-6 feedwater heater Replace 1-2 feedwater heater Replace 1-1 feedwater heater Boiler feed pump turbine rotor replacement Coat circulating water line 30
32 Appendix B: Emissions Calculations This appendix contains maximum past actual and future potential annual emission rates for SO 2, NO X, PM 10, HF, H 2 SO 4, lead, CO, VOCs and Hazardous Air Pollutants (HAPs). Appendix B also contains maximum past actual and future potential boiler heat input rates and coal burn rates for the Huntington boilers for use in applicable pollutant emission rate calculations. 31
33 Huntington Emissions Summary Past Actual vs. Future Potential Emissions Evaluation Maximum Past Actual Emission Rate Pollutant/Parameter Table Reference Maximum Future Potential Rate PSD Significance Level Is PSD Triggered Rate Increase/Decrease SO 2 Tables HUN-1 and HUN-2 19,141.2 tons/year 5,220.2 tons/year -13,921.0 tons/year 40 tons/year No NO X Tables HUN-3 and HUN-4 11,901.9 tons/year 11,355.5 tons/year tons/year 40 tons/year No Heat Input Tables HUN-5 and HUN-10 65,041,937 MMBtu/year 86,899,200 MMBtu/year Coal Burn Tables HUN-6 and HUN-10 3,037,478 tons/year 3,856,802 tons/year Particulate Matter (Stack and Non-Stack) Tables HUN-7 and HUN-8 1,759.4 tons/year tons/year tons/year 25 tons/year (15 tons/year for PM 10 ) No Hydrogen Fluoride Tables HUN-9 and HUN tons/year 34.0 tons/year tons/year 3 tons/year (fluoride) No Sulfuric Acid Tables HUN-11 and HUN tons/year 1.6 tons/year tons/year 7 tons/year No Lead Tables HUN-13 and HUN tons/year 0.08 tons/year tons/year 0.6 tons/year No Carbon Monoxide Tables HUN-15 and HUN tons/year 7,893.4 tons/year 7,109.3 tons/year 100 tons/year Yes VOC Tables HUN-17 and HUN tons/year tons/year 24.6 tons/year 40 tons/year No HAPs Tables HUN-19 and HUN tons/year 52.9 tons/year tons/year Note: Carbon monoxide is the only pollutant that has a post-project emission increase above its PSD significance level. 32
34 Permit Assumption Timeline: 2010: Upon Certification of Pollution Control Equipment (a) Huntington Unit 1 will be subject to a 30-day rolling average NO X limitation of 1,290 lb/hour (b) Huntington Unit 1 will be subject to a 30-day rolling average SO 2 limitation of 595 lb/hour (c) Huntington Unit 1 will be subject to a CO limitation of 1,686 lb/hour on a 30-day rolling average (d) Huntington Unit 1 will be subject to a PM 10 limitation of 74 lb/hour within 90 days following the completion of the fabric filter baghouse installation (e) (f) The Huntington Plant will be subject to a NO X PAL of 11,395.5 tons/year The Huntington Plant will be subject to an SO 2 PAL of 5,260.2 tons/year 33
35 Table HUN - 0 Huntington Past Actual Non-Stack Emissions Evaluation PM (TSP) Emissions Source ID a 10b Total Annual Non-Stack PM Emissions Maximum Past Actual Non-Stack PM Emissions Year Year PM 10 Emissions Source ID a 10b Total Annual Non-Stack PM 10 Emissions Maximum Past Actual Non-Stack PM 10 Emissions Year Year SO 2 Emissions Source ID a 10b Total Annual Non-Stack SO 2 Emissions Maximum Past Actual Non-Stack SO 2 Emissions Year Year NO X Emissions Source ID a 10b Total Annual Non-Stack NO X Emissions Maximum Past Actual Non-Stack NO X Emissions Year Year VOC Emissions Source ID a 10b Total Annual Non-Stack VOC Emissions Year Year Maximum Past Actual Non-Stack VOC Emissions 34
36 Table HUN - 0 (continued) Huntington Past Actual Non-Stack Emissions Evaluation CO Emissions Source ID a 10b Total Annual Non-Stack CO Emissions Maximum Past Actual Non-Stack CO Emissions Year Year Source ID Description 3 Ash Landfill 4 Coal Storage 5 Unit #1 Cooling Tower 6 Unit #2 Cooling Tower 8 Coal Conveyors 10a Ash Haul Road (dirt) 10b Ash Haul Road (paved) 12 Unit #1 Emergency Generator (diesel engine) 13 Unit #2 Emergency Generator (diesel engine) 14 Emergency Fire Pump (diesel engine) 17 Coal Silo System Exhauster for Unit #1 18 Coal Silo System Exhauster for Unit #2 19 Lime Silo Bin Vent 32 Ash Unloader for Unit #1 33 Ash Unloader for Unit #2 41 Coal Handling and Blending Equipment Note: Non-stack emission rates were obtained from 2002 through 2006 annual emission inventories. 35
37 Table HUN - 1 Huntington Past Actual SO 2 Emissions Evaluation Past Actual Monthly SO 2 Emissions from CEMs/Clean Air Markets (tons/month) UNIT NAME Jan-03 Feb-03 Mar-03 Apr-03 May-03 Jun-03 Jul-03 Aug-03 Sep-03 Oct-03 Nov-03 Dec-03 Jan-04 Feb-04 Mar-04 Apr-04 May-04 Jun-04 Jul-04 Aug-04 Sep-04 Oct-04 Huntington Huntington 2 1, , , , , , , , , , , , , , , , , , , , ,219.3 Huntington Totals 1, , , , , , , , , , , , , , , , , , , , , ,407.2 Past Actual Annual SO 2 Emission Rate Based on Rolling 24-Month Period UNIT NAME Jan-03 Feb-03 Mar-03 Apr-03 May-03 Jun-03 Jul-03 Aug-03 Sep-03 Oct-03 Nov-03 Dec-03 Jan-04 Feb-04 Mar-04 Apr-04 May-04 Jun-04 Jul-04 Aug-04 Sep-04 Oct-04 Huntington 1 This is based on a 24-month rolling average so there are no valid averages until December 2004 Huntington 2 This is based on a 24-month rolling average so there are no valid averages until December 2004 Huntington Totals Table HUN - 1 (continued) Huntington Past Actual SO 2 Emissions Evaluation Past Actual Monthly SO 2 Emissions from CEMs/Clean Air Markets (tons/month) Nov-04 Dec-04 Jan-05 Feb-05 Mar-05 Apr-05 May-05 Jun-05 Jul-05 Aug-05 Sep-05 Oct-05 Nov-05 Dec-05 Jan-06 Feb-06 Mar-06 Apr-06 May-06 Jun-06 Jul-06 Aug-06 Sep , , , , , , , , , , , , , , , , , , , , , , , , , , , , , , , , , , , , , , , , , , , , , ,302.0 Past Actual Annual SO 2 Emission Rate Based on Rolling 24-Month Period Nov-04 Dec-04 Jan-05 Feb-05 Mar-05 Apr-05 May-05 Jun-05 Jul-05 Aug-05 Sep-05 Oct-05 Nov-05 Dec-05 Jan-06 Feb-06 Mar-06 Apr-06 May-06 Jun-06 Jul-06 Aug-06 Sep-06 2,491 2,490 2, , , , , , , , , , , , , , , , , , , , ,015 15,094 15, , , , , , , , , , , , , , , , , , , , ,506 17,584 17, , , , , , , , , , , , , , , , , , , ,
38 Table HUN - 1 (continued) Huntington Past Actual SO 2 Emissions Evaluation Past Actual Monthly SO 2 Emissions from CEMs/Clean Air Markets (tons/month) Oct-06 Nov-06 Dec-06 Jan-07 Feb-07 Mar-07 Apr-07 May-07 Jun-07 Jul-07 Aug-07 Sep-07 Oct-07 Nov-07 Dec Past Actual Annual SO 2 Emission Rate Based on Rolling 24-Month Period Oct-06 Nov-06 Dec-06 Jan-07 Feb-07 Mar-07 Apr-07 May-07 Jun-07 Jul-07 Aug-07 Sep-07 Oct-07 Nov-07 Dec-07 2, , , , , , , , , , , , , , , ,924.8 tons/year Maximum Past Actual Unit 1 SO 2 Emission Rate 15, , , , , , , , , , , , , , , ,668.0 tons/year Maximum Past Actual Unit 2 SO 2 Emission Rate 18, , , , , , , , , , , , , , , ,135.0 tons/year Maximum Past Actual Stack SO 2 Emission Rate Maximum Past Actual Non-Stack SO 2 Emissions Emissions Source Unit #1 Emergency Generator (diesel engine) Unit #2 Emergency Generator (diesel engine) Emergency Fire Pump (diesel engine) Coal Handling and Blending Equipment Total Maximum Non-Stack SO 2 Emission Rate Total Maximum Past Actual SO 2 Emission Rate Stack and Non-Stack Emissions 19,141.2 Maximum Past Actual Non-Stack Emission Rate
39 Table HUN - 2 Huntington Future Potential Sulfur Dioxide Emission Evaluation Step 1: Calculate future potential Unit 1 and Unit 2 SO 2 emissions based on post-scrubber project emission limits Maximum Boiler Heat Input (MMBtu/hour) Post-Project Sulfur Dioxide Emission Limit (lb/mmbtu) Maximum Annual Boiler Operational Time (hours/year) Post-Project Annual Sulfur Dioxide Emission Rate Huntington Unit 1 4, ,760 2,607.0 Huntington Unit 2 4, ,760 2,607.0 Huntington Total (post-project Units 1 and 2 SO 2 emission rate): 5,214.0 Step 2: Identify the maximum past actual non-stack SO 2 emission rate Maximum non-stack SO 2 emission rate = 6.2 tons/year Step 3: Establish Plantwide Applicability Limit (PAL) The PAL is equivalent to the sum of the future potential Unit 1 stack SO 2 emission rate, the future potential Unit 2 stack emission rate, the non-stack SO 2 emission rate and the PSD significance threshold Unit 1 Future Potential SO 2 Emission Rate: Unit 2 Future Potential SO 2 Emission Rate: Maximum Non-Stack SO 2 Emission Rate: PSD Significance Level: Requested SO 2 PAL Value: 2,607.0 tons/year 2,607.0 tons/year 6.2 tons/year 40.0 tons/year 5,260.2 tons/year Step 4: Calculate Uncontrolled SO 2 Emission Rate SO 2 Emission Factor (lb/ton) Reference Sulfur Concentration (percent) Reference Annual Coal Burn Rate Annual Uncontrolled SO 2 Emission Rate (lb/year) Huntington Unit 1 38S AP-42 Table Emissions 1,927,958 49,818,447 Huntington Unit 2 38S AP-42 Table Emissions 1,928,844 50,574,287 Total: 100,392,734 lbs/year Total Future Potential Uncontrolled SO 2 Emission Rate: 50,196.4 tons/year 38
40 Table HUN - 3 Huntington Baseline NO X Emissions Evaluation Past Actual Monthly NO X Emissions from CEMs/Clean Air Markets (tons/month) UNIT NAME Jan-03 Feb-03 Mar-03 Apr-03 May-03 Jun-03 Jul-03 Aug-03 Sep-03 Oct-03 Nov-03 Dec-03 Jan-04 Feb-04 Mar-04 Apr-04 May-04 Jun-04 Jul-04 Aug-04 Sep-04 Oct-04 Huntington Huntington Huntington Totals 1, , , , , , , , , , Past Actual Annual NO X Emission Rate Based on Rolling 24-Month Period UNIT NAME Jan-03 Feb-03 Mar-03 Apr-03 May-03 Jun-03 Jul-03 Aug-03 Sep-03 Oct-03 Nov-03 Dec-03 Jan-04 Feb-04 Mar-04 Apr-04 May-04 Jun-04 Jul-04 Aug-04 Sep-04 Oct-04 Huntington 1 This is based on a 24-month rolling average so there are no valid averages until December 2004 Huntington 2 This is based on a 24-month rolling average so there are no valid averages until December 2004 Huntington Totals Table HUN - 3 (continued) Huntington Baseline NO X Emissions Evaluation Past Actual Monthly NO X Emissions from CEMs/Clean Air Markets (tons/month) Nov-04 Dec-04 Jan-05 Feb-05 Mar-05 Apr-05 May-05 Jun-05 Jul-05 Aug-05 Sep-05 Oct-05 Nov-05 Dec-05 Jan-06 Feb-06 Mar-06 Apr-06 May-06 Jun-06 Jul-06 Aug-06 Sep , , , , , , , , , Past Actual Annual NO X Emission Rate Based on Rolling 24-Month Period Nov-04 Dec-04 Jan-05 Feb-05 Mar-05 Apr-05 May-05 Jun-05 Jul-05 Aug-05 Sep-05 Oct-05 Nov-05 Dec-05 Jan-06 Feb-06 Mar-06 Apr-06 May-06 Jun-06 Jul-06 Aug-06 Sep-06 5,396 5,350 5, , , , , , , , , , , , , , , , , , , , ,901 5,903 5, , , , , , , , , , , , , , , , , , , , ,297 11,253 11, , , , , , , , , , , , , , , , , , , ,
41 Table HUN - 3 (continued) Huntington Baseline NO X Emissions Evaluation Past Actual Monthly NO X Emissions from CEMs/Clean Air Markets (tons/month) Oct-06 Nov-06 Dec-06 Jan-07 Feb-07 Mar-07 Apr-07 May-07 Jun-07 Jul-07 Aug-07 Sep-07 Oct-07 Nov-07 Dec Past Actual Annual NO X Emission Rate Based on Rolling 24-Month Period Oct-06 Nov-06 Dec-06 Jan-07 Feb-07 Mar-07 Apr-07 May-07 Jun-07 Jul-07 Aug-07 Sep-07 Oct-07 Nov-07 Dec-07 5, , , , , , , , , , , , , , , ,194.8 tons/year Maximum Past Actual Unit 1 NO X Emission Rate 5, , , , , , , , , , , , , , , , , , , , , , , , , , , , , ,752.4 Maximum Past Actual Non-Stack NO X Emissions Emissions Source Maximum Past Actual Non-Stack Emission Rate Unit #1 Emergency Generator (diesel engine) 0.6 Unit #2 Emergency Generator (diesel engine) 0.4 Emergency Fire Pump (diesel engine) 1.1 Coal Handling and Blending Equipment 56.5 Total Maximum Non-Stack NO X Emission Rate 58.6 Total Maximum Past Actual NO X Emission Rate Stack and Non-Stack Emissions 58.6 Unit 1 Baseline Emissions: 6,194.8 tons/year Unit 2 Baseline Emissions (potential to emit basis): 5,648.4 tons/year Unit 2 NO X Limit: 0.26 lb/mmbtu Total Baseline Emission Rate: Unit 1 Unit 2 Non-Stack Total Baseline NO X Emission Rate: 6,194.8 tons/year (Unit 1 maximum past actual rate) 5,648.4 tons/year (Unit 2 future potential rate) 58.6 tons/year (non-stack maximum past actual rate) 11,901.9 tons/year Unit 2 Heat Input Rate: 4,960 MMBtu/hour Note: The 24-month evaluation period runs from November 2005 through October 2007 The Unit 1 baseline emission rate which occurred in October 2007 is equivalent to 6,194.8 tons/year Because the intstallation of the Unit 2 low-no X burner project occurred in October 2006, the Unit 2 baseline emission rate is calculated on a potential-to-emit basis based on the post-project NO X emission limit of 0.26 lb/mmbtu 40
42 Table HUN - 4 Huntington Future Potential Nitrogen Oxides Emission Evaluation Step 1: Calculate future potential Unit 1 and Unit 2 NO X emissions based on post-low-no X project emission limits Maximum Boiler Heat Input (MMBtu/hour) Post-Project Nitrogen Oxides Emission Limit (lb/mmbtu) Maximum Annual Boiler Operational Time (hours/year) Post-Project Annual Nitrogen Oxides Emission Rate Huntington Unit 1 4, ,760 5,648.4 Huntington Unit 2 4, ,760 5,648.4 Huntington Total (post-project Units 1 and 2 NO X emission rate): 11,296.9 Step 2: Identify the maximum past actual non-stack NO X emission rate Maximum non-stack NO X emission rate = 58.6 tons/year Step 3: Establish Plantwide Applicability Limit (PAL) The PAL is equivalent to the sum of the future potential Unit 1 stack NO X emission rate, the future potential Unit 2 stack emission rate, the non-stack NO X emission rate and the PSD significance threshold Unit 1 Future Potential NO X Emission Rate: Unit 2 Future Potential NO X Emission Rate: Maximum Non-Stack NO X Emission Rate: PSD Significance Level: Requested NO X PAL Value: 5,648.4 tons/year 5,648.4 tons/year 58.6 tons/year 40.0 tons/year 11,395.5 tons/year Step 3: Calculate Uncontrolled NO X Emission Rate NO X Emission Factor (lb/ton) Huntington Unit 1 12 Huntington Unit 2 22 Total: Reference AP-42 Table NSPS AP-42 Table Pre-NSPS Annual Coal Burn Rate Annual Uncontrolled NO X Emission Rate (lb/year) 1,927,958 23,135,502 1,928,844 42,434,566 65,570,067 lbs/year Total Future Potential Uncontrolled NO X Emission Rate: 32,785.0 tons/year 41
43 Table HUN - 5 Huntington Past Actual Heat Input Evaluation Past Actual Monthly Heat Input from CEMs/Clean Air Markets (MMBtu/month) UNIT NAME Jan-03 Feb-03 Mar-03 Apr-03 May-03 Jun-03 Jul-03 Aug-03 Sep-03 Oct-03 Nov-03 Dec-03 Jan-04 Feb-04 Mar-04 Apr-04 May-04 Jun-04 Jul-04 Aug-04 Sep-04 Huntington 1 2,954,824 2,056,039 2,277,974 3,106,440 2,503,186 3,069,277 3,167,021 3,123,325 2,951,095 2,688,765 2,833,188 2,953,885 2,804,914 2,261,618 3,112,590 1,748,847 3,015,588 2,737,265 2,926, ,597 2,076,807 Huntington 2 2,879,451 2,291,742 2,883,852 2,939,674 2,778,207 2,891,690 3,015,058 3,036,619 2,899,235 3,079,067 2,653,957 2,917,478 2,129,755 2,260,068 2,500,506 2,248,101 2,936,730 2,517,022 2,466,693 2,677,412 2,810,698 Huntington Totals 5,834,275 4,347,781 5,161,826 6,046,114 5,281,393 5,960,967 6,182,079 6,159,944 5,850,330 5,767,832 5,487,145 5,871,363 4,934,669 4,521,686 5,613,096 3,996,948 5,952,318 5,254,287 5,393,146 3,675,009 4,887,505 Past Actual Annual Heat Input Rate Based on Rolling 24-Month Period (MMBtu/year) UNIT NAME Jan-03 Feb-03 Mar-03 Apr-03 May-03 Jun-03 Jul-03 Aug-03 Sep-03 Oct-03 Nov-03 Dec-03 Jan-04 Feb-04 Mar-04 Apr-04 May-04 Jun-04 Jul-04 Aug-04 Sep-04 Huntington 1 This is based on a 24-month rolling average so there are no valid averages until December 2004 Huntington 2 This is based on a 24-month rolling average so there are no valid averages until December 2004 Huntington Totals Table HUN - 5 (continued) Huntington Past Actual Heat Input Evaluation Past Actual Monthly Heat Input from CEMs/Clean Air Markets (MMBtu/month) Oct-04 Nov-04 Dec-04 Jan-05 Feb-05 Mar-05 Apr-05 May-05 Jun-05 Jul-05 Aug-05 Sep-05 Oct-05 Nov-05 Dec-05 Jan-06 Feb-06 Mar-06 Apr-06 May-06 Jun-06 Jul-06 Aug-06 2,708,048 2,480,285 2,916,727 2,834,986 1,963,940 2,832,478 2,581,761 2,867,611 2,836,077 2,721,462 2,998,720 1,561, ,448 2,731,188 3,052,797 2,940,327 2,404,432 2,667,748 2,689,960 2,708,359 2,804,964 2,667,953 2,885,032 2,821,573 2,952,531 2,545,312 2,767,589 2,677,861 2,721,441 3,175,297 2,824,823 2,399,866 2,566,681 2,511,477 2,695,703 2,971,399 2,657,240 2,545,445 2,809,793 2,673,695 2,959,120 1,894,599 2,605,710 2,615,698 3,172,000 3,128,943 5,529,621 5,432,816 5,462,039 5,602,575 4,641,801 5,553,919 5,757,058 5,692,434 5,235,943 5,288,143 5,510,197 4,256,929 3,576,847 5,388,428 5,598,242 5,750,120 5,078,127 5,626,868 4,584,559 5,314,069 5,420,662 5,839,953 6,013,975 Past Actual Annual Heat Input Rate Based on Rolling 24-Month Period (MMBtu/year) Oct-04 Nov-04 Dec-04 Jan-05 Feb-05 Mar-05 Apr-05 May-05 Jun-05 Jul-05 Aug-05 Sep-05 Oct-05 Nov-05 Dec-05 Jan-06 Feb-06 Mar-06 Apr-06 May-06 Jun-06 Jul-06 Aug-06 31,735,879 31,675,960 31,629,911 31,907,163 31,644,823 31,827,036 31,710,436 31,487,656 31,425,354 30,730,419 29,688,761 29,637,761 29,687,217 29,754,923 29,826,330 29,603,909 30,074,466 29,920,851 29,954,701 29,825,451 30,769,168 32,566,216 32,510,285 32,703,344 32,622,139 32,739,950 32,763,258 32,517,346 32,293,158 32,030,587 31,928,821 31,874,987 31,876,628 31,690,612 32,030,631 32,237,444 32,466,751 32,290,000 32,124,490 32,173,828 32,526,482 32,752,247 64,302,095 64,186,245 64,333,255 64,529,301 64,384,773 64,590,294 64,227,782 63,780,814 63,455,940 62,659,240 61,563,747 61,514,389 61,377,828 61,785,554 62,063,774 62,070,660 62,364,466 62,045,341 62,128,529 62,351,932 63,521,415 Table HUN - 5 (continued) Huntington Past Actual Heat Input Evaluation Past Actual Monthly Heat Input from CEMs/Clean Air Markets (MMBtu/month) Sep-06 Oct-06 Nov-06 Dec-06 Jan-07 Feb-07 Mar-07 Apr-07 May-07 Jun-07 Jul-07 Aug-07 Sep-07 Oct-07 Nov-07 Dec-07 2,464,156 3,037,682 2,818,032 2,841,127 3,093,099 2,754,448 3,033,873 2,522,339 2,566,222 2,601,631 3,020,095 2,623,301 2,795,469 2,738,460 1,929,959 2,917,128 1,486, ,579 2,691,806 3,362,296 3,168,776 2,901,943 2,866,821 3,374,299 3,079,349 3,409,612 2,991,383 3,026,241 3,274,429 3,275,282 3,072,703 3,950,156 3,037,682 3,535,611 5,532,933 6,455,395 5,923,224 5,935,816 5,389,160 5,940,521 5,680,980 6,429,707 5,614,684 5,821,710 6,012,889 5,205,241 5,989,831 Past Actual Annual Heat Input Rate Based on Rolling 24-Month Period (MMBtu/year) Sep-06 Oct-06 Nov-06 Dec-06 Jan-07 Feb-07 Mar-07 Apr-07 May-07 Jun-07 Jul-07 Aug-07 Sep-07 Oct-07 Nov-07 Dec-07 30,962,843 31,127,660 31,296,533 31,258,733 31,387,790 31,783,044 31,883,741 31,854,030 31,703,336 31,586,113 31,735,429 31,547,720 32,164,841 33,231,347 32,830,733 32,762,898 33,231,347 MMBtu/year Maximum Past Actual Unit 1 Heat Input 32,089,898 30,679,112 29,561,636 29,634,883 29,932,236 30,177,694 30,267,945 30,113,707 30,388,445 30,728,186 31,149,652 31,389,605 31,554,874 31,706,389 32,015,410 32,279,039 32,763,258 MMBtu/year Maximum Past Actual Unit 2 Heat Input 63,052,741 61,806,771 60,858,169 60,893,616 61,320,026 61,960,737 62,151,686 61,967,737 62,091,780 62,314,299 62,885,081 62,937,324 63,719,715 64,937,736 64,846,142 65,041,937 Maximum 12 month ave based on 24-month period 65,041,937 MMBtu/year Past Actual Heat Input 42
44 Table HUN - 6 Past Actual Coal Burn Evaluation Past Actual Monthly Coal Burn (tons/month) UNIT NAME Jan-03 Feb-03 Mar-03 Apr-03 May-03 Jun-03 Jul-03 Aug-03 Sep-03 Oct-03 Nov-03 Dec-03 Jan-04 Feb-04 Mar-04 Apr-04 May-04 Jun-04 Jul-04 Aug-04 Sep-04 Huntington 1 138,581 92, , , , , , , , , , , ,561 94, ,864 76, , , ,443 48,566 93,618 Huntington 2 127, , , , , , , , , , , ,801 93, , , , , , , , ,678 Huntington Totals 265, , , , , , , , , , , , , , , , , , , , ,296 Past Actual Annual Coal Burn Rate Based on Rolling 24-Month Period UNIT NAME Jan-03 Feb-03 Mar-03 Apr-03 May-03 Jun-03 Jul-03 Aug-03 Sep-03 Oct-03 Nov-03 Dec-03 Jan-04 Feb-04 Mar-04 Apr-04 May-04 Jun-04 Jul-04 Aug-04 Sep-04 Huntington 1 This is based on a 24-month rolling average so there are no valid averages until December 2004 Huntington 2 This is based on a 24-month rolling average so there are no valid averages until December 2004 Huntington Totals Table HUN - 6 (continued) Past Actual Coal Burn Evaluation Past Actual Monthly Coal Burn (tons/month) Oct-04 Nov-04 Dec-04 Jan-05 Feb-05 Mar-05 Apr-05 May-05 Jun-05 Jul-05 Aug-05 Sep-05 Oct-05 Nov-05 Dec-05 Jan-06 Feb-06 Mar-06 Apr-06 May-06 Jun-06 Jul-06 Aug , , , ,206 92, , , , , , ,049 72,697 27, , , , , , , , , , , , , , , , , , , , , , , , , , , , ,648 82, , , , , , , , , , , , , , , , , , , , , , , , , , , ,369 Past Actual Annual Coal Burn Rate Based on Rolling 24-Month Period Oct-04 Nov-04 Dec-04 Jan-05 Feb-05 Mar-05 Apr-05 May-05 Jun-05 Jul-05 Aug-05 Sep-05 Oct-05 Nov-05 Dec-05 Jan-06 Feb-06 Mar-06 Apr-06 May-06 Jun-06 Jul-06 Aug-06 1,445,358 1,442,671 1,442,205 1,459,197 1,457,522 1,475,425 1,475,242 1,472,549 1,473,683 1,443,333 1,396,058 1,398,241 1,400,915 1,404,394 1,411,083 1,398,099 1,427,893 1,418,189 1,418,027 1,405,201 1,443,034 1,547,101 1,546,940 1,556,471 1,553,399 1,559,694 1,562,053 1,548,096 1,537,250 1,524,636 1,518,779 1,516,566 1,513,235 1,494,924 1,507,640 1,512,913 1,514,422 1,497,673 1,482,193 1,478,289 1,484,085 1,474,688 2,992,460 2,989,611 2,998,677 3,012,596 3,017,216 3,037,478 3,023,338 3,009,799 2,998,319 2,962,112 2,912,624 2,911,476 2,895,840 2,912,034 2,923,996 2,912,521 2,925,565 2,900,382 2,896,315 2,889,287 2,917,722 Table HUN - 6 (continued) Past Actual Coal Burn Evaluation Past Actual Monthly Coal Burn (tons/month) Sep-06 Oct-06 Nov-06 Dec-06 Jan-07 Feb-07 Mar-07 Apr-07 May-07 Jun-07 Jul-07 Aug-07 Sep-07 Oct-07 Nov-07 Dec , , , , , , , , , , , , , ,041 92, ,683 59, , , , , , , , , , , , , , , , , , , , , , , , , , , , , , ,920 Past Actual Annual Coal Burn Rate Based on Rolling 24-Month Period Sep-06 Oct-06 Nov-06 Dec-06 Jan-07 Feb-07 Mar-07 Apr-07 May-07 Jun-07 Jul-07 Aug-07 Sep-07 Oct-07 Nov-07 Dec-07 1,447,755 1,454,327 1,470,025 1,470,305 1,472,754 1,490,886 1,494,549 1,489,508 1,478,625 1,470,141 1,471,671 1,456,503 1,481,910 1,534,371 1,513,781 1,510,642 1,436,069 1,369,461 1,316,950 1,324,920 1,333,854 1,338,680 1,340,669 1,332,556 1,343,845 1,358,403 1,370,347 1,377,250 1,383,259 1,390,253 1,401,675 1,413,704 2,883,824 2,823,788 2,786,975 2,795,226 2,806,609 2,829,566 2,835,218 2,822,064 2,822,470 2,828,544 2,842,019 2,833,753 2,865,170 2,924,624 2,915,456 2,924,346 Maximum 12 month ave based on 24-month period 3,037,478 tons/year Past Actual Coal Burn 43
45 Table HUN - 7 Huntington Past Actual Particulate Matter Emission Evaluation Past Actual Monthly Heat Input from CEMs/Clean Air Markets (MMBtu/month) UNIT NAME Jan-03 Feb-03 Mar-03 Apr-03 May-03 Jun-03 Jul-03 Aug-03 Sep-03 Oct-03 Nov-03 Dec-03 Jan-04 Feb-04 Mar-04 Apr-04 May-04 Jun-04 Jul-04 Aug-04 Sep-04 Oct-04 Nov-04 Dec-04 Jan-05 Feb-05 Huntington 1 2,954,824 2,056,039 2,277,974 3,106,440 2,503,186 3,069,277 3,167,021 3,123,325 2,951,095 2,688,765 2,833,188 2,953,885 2,804,914 2,261,618 3,112,590 1,748,847 3,015,588 2,737,265 2,926, ,597 2,076,807 2,708,048 2,480,285 2,916,727 2,834,986 1,963,940 Huntington 2 2,879,451 2,291,742 2,883,852 2,939,674 2,778,207 2,891,690 3,015,058 3,036,619 2,899,235 3,079,067 2,653,957 2,917,478 2,129,755 2,260,068 2,500,506 2,248,101 2,936,730 2,517,022 2,466,693 2,677,412 2,810,698 2,821,573 2,952,531 2,545,312 2,767,589 2,677,861 Huntington Totals 5,834,275 4,347,781 5,161,826 6,046,114 5,281,393 5,960,967 6,182,079 6,159,944 5,850,330 5,767,832 5,487,145 5,871,363 4,934,669 4,521,686 5,613,096 3,996,948 5,952,318 5,254,287 5,393,146 3,675,009 4,887,505 5,529,621 5,432,816 5,462,039 5,602,575 4,641,801 Past Actual Monthly Particulate Matter Emission Rate from Annual Stack Testing (lb/mmbtu) UNIT NAME Jan-03 Feb-03 Mar-03 Apr-03 May-03 Jun-03 Jul-03 Aug-03 Sep-03 Oct-03 Nov-03 Dec-03 Jan-04 Feb-04 Mar-04 Apr-04 May-04 Jun-04 Jul-04 Aug-04 Sep-04 Oct-04 Nov-04 Dec-04 Jan-05 Feb-05 Huntington Huntington Monthly Particulate Matter Emission Rate (obtained by multiplying monthly heat input times particulate matter emission rate) tons/month UNIT NAME Jan-03 Feb-03 Mar-03 Apr-03 May-03 Jun-03 Jul-03 Aug-03 Sep-03 Oct-03 Nov-03 Dec-03 Jan-04 Feb-04 Mar-04 Apr-04 May-04 Jun-04 Jul-04 Aug-04 Sep-04 Oct-04 Nov-04 Dec-04 Jan-05 Feb-05 Huntington Huntington Huntington Totals Past Actual Annual Particulate Matter Emission Rate Based on Rolling 24-Month Period UNIT NAME Jan-03 Feb-03 Mar-03 Apr-03 May-03 Jun-03 Jul-03 Aug-03 Sep-03 Oct-03 Nov-03 Dec-03 Jan-04 Feb-04 Mar-04 Apr-04 May-04 Jun-04 Jul-04 Aug-04 Sep-04 Oct-04 Nov-04 Dec-04 Jan-05 Feb-05 Huntington 1 This is based on a 24-month rolling average so there are no valid averages until December Huntington 2 This is based on a 24-month rolling average so there are no valid averages until December , , ,270.5 Huntington Totals 1, , ,458.9 Table HUN - 7 (continued) Huntington Past Actual Particulate Matter Emission Evaluation Past Actual Monthly Heat Input from CEMs/Clean Air Markets (MMBtu/month) Mar-05 Apr-05 May-05 Jun-05 Jul-05 Aug-05 Sep-05 Oct-05 Nov-05 Dec-05 Jan-06 Feb-06 Mar-06 Apr-06 May-06 Jun-06 Jul-06 Aug-06 Sep-06 Oct-06 Nov-06 Dec-06 Jan-07 Feb-07 Mar-07 Apr-07 May-07 Jun-07 2,832,478 2,581,761 2,867,611 2,836,077 2,721,462 2,998,720 1,561, ,448 2,731,188 3,052,797 2,940,327 2,404,432 2,667,748 2,689,960 2,708,359 2,804,964 2,667,953 2,885,032 2,464,156 3,037,682 2,818,032 2,841,127 3,093,099 2,754,448 3,033,873 2,522,339 2,566,222 2,601,631 2,721,441 3,175,297 2,824,823 2,399,866 2,566,681 2,511,477 2,695,703 2,971,399 2,657,240 2,545,445 2,809,793 2,673,695 2,959,120 1,894,599 2,605,710 2,615,698 3,172,000 3,128,943 1,486, ,579 2,691,806 3,362,296 3,168,776 2,901,943 2,866,821 3,374,299 3,079,349 5,553,919 5,757,058 5,692,434 5,235,943 5,288,143 5,510,197 4,256,929 3,576,847 5,388,428 5,598,242 5,750,120 5,078,127 5,626,868 4,584,559 5,314,069 5,420,662 5,839,953 6,013,975 3,950,156 3,037,682 3,535,611 5,532,933 6,455,395 5,923,224 5,935,816 5,389,160 5,940,521 5,680,980 Past Actual Monthly Particulate Matter Emission Rate from Annual Stack Testing (lb/mmbtu) Mar-05 Apr-05 May-05 Jun-05 Jul-05 Aug-05 Sep-05 Oct-05 Nov-05 Dec-05 Jan-06 Feb-06 Mar-06 Apr-06 May-06 Jun-06 Jul-06 Aug-06 Sep-06 Oct-06 Nov-06 Dec-06 Jan-07 Feb-07 Mar-07 Apr-07 May-07 Jun Monthly Particulate Matter Emission Rate (obtained by multiplying monthly heat input times particulate matter emission rate) tons/month Mar-05 Apr-05 May-05 Jun-05 Jul-05 Aug-05 Sep-05 Oct-05 Nov-05 Dec-05 Jan-06 Feb-06 Mar-06 Apr-06 May-06 Jun-06 Jul-06 Aug-06 Sep-06 Oct-06 Nov-06 Dec-06 Jan-07 Feb-07 Mar-07 Apr-07 May-07 Jun Past Actual Annual Particulate Matter Emission Rate Based on Rolling 24-Month Period Mar-05 Apr-05 May-05 Jun-05 Jul-05 Aug-05 Sep-05 Oct-05 Nov-05 Dec-05 Jan-06 Feb-06 Mar-06 Apr-06 May-06 Jun-06 Jul-06 Aug-06 Sep-06 Oct-06 Nov-06 Dec-06 Jan-07 Feb-07 Mar-07 Apr-07 May-07 Jun , , , , , , , , , , , , , , , , , , , , , , , , , , , , , , , , , , , , , , , , , , , , , , , , , , , , , ,
46 Table HUN - 7 (continued) Huntington Past Actual Particulate Matter Emission Evaluation Past Actual Monthly Heat Input from CEMs/Clean Air Markets (MMBtu/month) Jul-07 Aug-07 Sep-07 Oct-07 Nov-07 Dec-07 3,020,095 2,623,301 2,795,469 2,738,460 1,929,959 2,917,128 3,409,612 2,991,383 3,026,241 3,274,429 3,275,282 3,072,703 6,429,707 5,614,684 5,821,710 6,012,889 5,205,241 5,989,831 Past Actual Monthly Particulate Matter Emission Rate from Annual Stack Testing (lb/mmbtu) Jul-07 Aug-07 Sep-07 Oct-07 Nov-07 Dec Monthly Particulate Matter Emission Rate (obtained by multiplying monthly heat input times particulate matter emission rate) tons/month Jul-07 Aug-07 Sep-07 Oct-07 Nov-07 Dec Past Actual Annual Particulate Matter Emission Rate Based on Rolling 24-Month Period Jul-07 Aug-07 Sep-07 Oct-07 Nov-07 Dec tons/year Past Actual Unit 1 Particulate Matter Emission Rate ,272.9 tons/year Past Actual Unit 2 Particulate Matter Emission Rate 1, , , , Maximum 12 month ave based on 24-month period 1,465.3 tons/year Past Actual Stack PM 10 Emission Rate Maximum Past Actual Non-Stack PM 10 Emissions Maximum Past Actual Emissions Source Non-Stack PM 10 Emission Rate Ash Landfill 37.6 Coal Storage 64.6 Unit #1 Cooling Tower 45.7 Unit #2 Cooling Tower 36.0 Coal Conveyors Ash Haul Road (dirt) 37.1 Ash Haul Road (paved) 31.7 Unit #1 Emergency Generator (diesel engine) 0.0 Unit #2 Emergency Generator (diesel engine) 0.0 Emergency Fire Pump (diesel engine) 0.1 Coal Silo System Exhauster for Unit #1 8.8 Coal Silo System Exhauster for Unit #2 6.9 Lime Silo Bin Vent 0.1 Ash Unloader for Unit #1 0.0 Ash Unloader for Unit #2 0.0 Coal Handling and Blending Equipment 25.4 Total Maximum Non-Stack PM 10 Emission Rate Total Maximum Past Actual PM 10 Emission Rate Stack and Non-Stack Emissions 1,759.4 (Past actual stack emission rate of 1,465.3 tons/year plus non-stack emission rate of tons/year) 45
47 Table HUN - 8 Huntington Future Potential Particulate Matter Emission Evaluation Maximum Boiler Heat Input (I) (MMBtu/hour) Post-Project Particulate Matter Emission Limit* (lb/hour) Post-Project Particulate Matter Emission Limit (lb/hour) Maximum Annual Boiler Operational Time (hours/year) Future Potential Annual Particulate Matter Emission Rate Huntington Unit 1 4, a 8, Huntington Unit 2 4, b 8, Non-Stack NA NA NA NA Huntington Total (post-project PM 10 rate): a Unit 1 Particulate Matter Emission Limit Following Installation of Unit 1 Fabric Filter Baghouse b Unit 2 Particulate Matter Emission Limit Calculate Uncontrolled PM 10 Emission Rate PM 10 Emission Factor (lb/ton) Reference Coal Ash Concentration (percent) Huntington Unit 1 2.3A AP-42 Table Huntington Unit 2 2.3S AP-42 Table Reference 2006 Emissions Inventory 2006 Emissions Inventory Annual Coal Burn Rate Annual Uncontrolled PM 10 Emission Rate (lb/year) 1,927,958 65,405,991 1,928,844 66,633,841 Non-Stack Emissions 588,151 Total: 132,627,983 lbs/year Total Future Potential Uncontrolled PM 10 Emission Rate: 66,314.0 tons/year 46
48 Table HUN - 9 Huntington Past Actual Hydrogen Fluoride Emission Evaluation M HF = F comb x 2000 lb/ton x C HF x 1/10 6 x F acid Where: Mfg HF = Manufacture of Hydrogen Fluoride, lb/year F comb = Coal combustion, tons/year F comb = 1,475,425 tons/year (Unit 1) Note: Maximum annual coal burn rates from May 2005; F comb = 1,562,053 tons/year (Unit 2) Table HUN - 6 C HF = Average Unit 1 fluoride concentration in coal, ppm (FGD scrubber, 6.5% bypass) C HF = Average Unit 2 fluoride concentration in coal, ppm (no FGD scrubber) F Bypass = 0.07 Unit 1 F Bypass = 0.00 Unit 2 F acid = M HF /M F Acid conversion factor: ratio of molecular weights, compound/parent chemical M F = Molecular weight of fluorine M HF = Molecular weight of hydrogen fluoride F acid = AR = Annual release of hydrogen fluoride, lb/year EF FGD = 6% HF emission factor for FGD systems EF No FGD = 90% HF emission factor without FGD AR = Mfg * (EF/100) AR FGD Removal = (1.0 - F Bypass ) x E FGD x M HF AR Bypass = F Bypass x EF NoFGD x M HF AR Total = AR FGD Removal + AR Bypass 47
49 Table HUN - 9 (continued) Huntington Past Actual Hydrogen Fluoride Emission Evaluation Historical Coal Fluoride Concentrations (Parts Per Million) Average Fluoride Concentration ppm Huntington Huntington Mfg HF = (Coal, tons/year)*(2000 lb/ton)*(c HF ppm)*(1/10 6 ) F acid Mfg HF Unit 1 = Mfg HF Unit 2 = 434,083.1 lbs/year 459,570.0 lbs/year Unit 1 (scrubber with 6.5% bypass) AR FGD Removal = (1.0 - F Bypass ) x EF FGD x Mfg HF AR FGD Removal = ( )*(0.06)*(434,083) lbs AR FGD Removal = 24,352 lbs/year AR Bypass = F Bypass x EF NoFGD x Mfg AR Bypass = (0.065)*(0.90)*(434,083) lbs AR Bypass = 25,394 lbs/year AR Total = AR FGD Removal + AR Bypass AR Total = 49,746 lbs/year (Unit 1) Unit 2 (no scrubber) AR = Mfg HF Unit 2 * (EF/100) AR = 413,613.0 lbs/year (Unit 2) 48
50 Table HUN - 9 (continued) Huntington Past Actual Hydrogen Fluoride Emission Evaluation Maximum Past Actual Hydrogen Fluoride Emissions Huntington Unit 1 Huntington Unit 2 Total Past HF Rate: 49,745.9 lbs/year 413,613.0 lbs/year 463,358.9 lbs/year tons/year Calculation Method: EPRI LARK-TRIPP Calculation and Methods for Threshold Determination and Release Estimates HF Emission Factor with FGD System: 6% Bituminous Coal Emission Factor: 90% (Table 5-1 Emission Factors for HCL and HF) 49
51 Table HUN - 10 Huntington Future Potential Coal Burn and Hydrogen Fluoride Emission Evaluation Annual Average Coal Heating Value (Btu/lb) Average Coal Heating Value (Btu/lb) Huntington Unit 1 11, , , , , ,268.3 Huntington Unit 2 11, , , , , ,263.1 Maximum Potential Annual Coal Burn Rate Maximum Boiler Heat Input (MMBtu/hour) Huntington Unit 1 4,960 Huntington Unit 2 4,960 Totals Maximum Annual Heat Input at 8760 hours/year* (MMBtu/year) Average Coal Heating Value (Btu/lb) Maximum Potential Annual Coal Burn* 43,449,600 11, ,927,958 43,449,600 11, ,928,844 86,899,200 3,856,802 * Maximum potential annual heat input and coal burn rates used in future potential H 2 SO 4, lead and HF emission calculations 50
52 Table HUN - 10 (continued) Huntington Future Potential Coal Burn and Hydrogen Fluoride Emission Evaluation M HF = F comb x 2000 lb/ton x C HF x 1/10 6 x F acid Where: Mfg HF = Manufacture of Hydrogen Fluoride, lb/year F comb = Coal combustion, tons/year F comb = 1,927,958 tons/year (Unit 1 future potential coal burn rate) F comb = 1,928,844 tons/year (Unit 2 future potential coal burn rate) C HF = Average Unit 1 fluoride concentration in coal, ppm (FGD scrubber, no bypass) C HF = Average Unit 2 fluoride concentration in coal, ppm (FGD scrubber, no bypass) F Bypass = 0.00 Unit 1 F Bypass = 0.00 Unit 2 F acid = M HF /M F Acid conversion factor: ratio of molecular weights, compound/parent chemical M F = Molecular weight of fluorine M HF = Molecular weight of hydrogen fluoride F acid = AR = Annual release of hydrogen fluoride, lb/year EF FGD = 6% HF emission factor for FGD systems EF No FGD = 90% HF emission factor without FGD AR = Mfg * (EF/100) AR FGD Removal = (1.0 - F Bypass ) x E FGD x M HF AR Bypass = F Bypass x EF NoFGD x M HF AR Total = AR FGD Removal + AR Bypass 51
53 Table HUN - 10 (continued) Huntington Future Potential Coal Burn and Hydrogen Fluoride Emission Evaluation Historical Coal Fluoride Concentrations (Parts Per Million) Average Fluoride Concentration ppm Huntington Huntington Mfg HF = (Coal, tons/year)*(2000 lb/ton)*(c HF ppm)*(1/10 6 ) F acid Mfg HF Unit 1 = Mfg HF Unit 2 = 567,222.6 lbs/year 567,483.1 lbs/year AR FGD Removal = (1.0 - F Bypass ) x EF FGD x Mfg HF AR FGD Removal Unit 1 = ( ) x (0.06) x (567,222.6) lbs/year AR FGD Removal = AR Bypass = 34,033.4 lbs/year 0.0 lbs/year AR Total = AR FGD Removal + AR Bypass AR Total = 34,033.4 Unit 1 lbs/year AR FGD Removal Unit 2 = ( ) x (0.06) x (567,483.1) AR FGD Removal = AR Bypass = 34,049.0 lbs/year 0.0 lbs/year AR Total = AR FGD Removal + AR Bypass AR Total = 34,049.0 Unit 2 lbs/year 52
54 Table HUN - 10 (continued) Huntington Future Potential Coal Burn and Hydrogen Fluoride Emission Evaluation Maximum Future Potential Hydrogen Fluoride Emissions Huntington Unit 1 34,033.4 lbs/year Huntington Unit 2 34,049.0 lbs/year Total Future Potential HF Rate: 68,082.3 lbs/year 34.0 tons/year Calculation Method: EPRI LARK-TRIPP Calculation and Methods for Threshold Determination and Release Estimates HF Emission Factor with FGD System: 6% Bituminous Coal Emission Factor: 90% (Table 5-1 Emission Factors for HCL and HF) 53
55 Table HUN - 11 Huntington Past Actual Sulfuric Acid Emission Evaluation Sulfuric Acid Mist Manufactured from Combustion (EPRI LARK-TRIPP method used to calculate sulfuric acid emission rate) EM Comb = K*F1*E2 Where: EM Comb = total H 2 SO 4 manufactured from combustion, lbs/year K = molecular weight and units conversion constant = (98.07)/(64.04) * = Molecular weight of H 2 SO = Molecular weight of SO 2 K = 3,063 F1 = Fuel Impact Factor F1 = (Western Bituminous coal) E2 = SO 2 mass rate, tons/year E2 = K1 * K2 * C1 * S1 Where: K1 = molecular weight and units conversion constant = (64.04)/(100*32.06) = Molecular weight of SO = Molecular weight of S 100 = conversion of % S to fraction K1 = 0.02 K2 = Sulfur conversion to SO 2 ; implicit from EPA AP-42 K2 = 0.95 (Bituminous coal) C1 = Coal burn, tons/year C1 = 1,475,425 tons/year (Unit 1 max from HUN-6; May 2005) C1 = 1,562,053 tons/year (Unit 2 max from HUN-6; May 2005) S1 = Coal sulfur weighted, % 54
56 Table HUN - 11 (continued) Huntington Past Actual Sulfuric Acid Emission Evaluation Concentrati Huntington Unit Huntington Unit S1 = 0.58 % (Unit 1) S1 = 0.59 % (Unit 2) E2 = 15,689 tons/year (Unit 1) (sulfur dioxide emissions) E2 = 16,710 tons/year (Unit 2) (sulfur dioxide emissions) EM Comb = 53,343 lbs/year (Unit 1) (total H 2 SO 4 manufactured from combustion) EM Comb = 56,813 lbs/year (Unit 2) (total H 2 SO 4 manufactured from combustion) ER Comb = EM Comb * F2 (all that apply) (Unit 2) ER Comb = (SB f + ((1 - SB f )*F2 s) )*K*F1*E2*F2 x Annual Average Coal Sulfur Concentration (percent) Average Coal Sulfur (Unit 1 with 6.5% scrubber bypass) ER Comb = Sulfuric acid released from combustion F2 = Technology Impact Factors F2 = 0.56 (Air Heater Removal of Sulfuric Acid - PRB Coal; Applicable to Huntington Boilers) F2 = 0.73 (Cold-side ESP - Subbituminous (PRB) Coal; Applicable to Huntington Boilers) F2 = 0.40 (Wet FGD - PRB Coal; Applicable to Huntington Unit 1) 55
57 Table HUN - 11 (continued) Huntington Past Actual Sulfuric Acid Emission Evaluation ER Comb = ER Comb = 9,573 lbs/year (Unit 1 Sulfuric Acid Released from Combustion) 23,225 lbs/year (Unit 2 Sulfuric Acid Released from Combustion) Total Past Actual Sulfuric Acid Emission Rate = 32,798 lbs/year 16.4 tons/year Huntington Unit 1 Huntington Unit 2 Note: Pre-Project FGD (SO 2 scrubber) Post-Project FGD Pre-Project FGC (SO 2 scrubber) (flue gas conditioning) Yes Yes No No Yes Yes No No Post-Project FGC (flue gas conditioning) The pre-project descriptions pertain to the proposed Unit 1 baghouse installation and scrubber upgrade. Huntington Unit 2 did not have a scrubber during the period of maximum coal burn rate. The Huntington Unit 2 scrubber (with no bypass) and baghouse installation was completed in
58 Table HUN - 12 Huntington Future Potential Sulfuric Acid Emission Evaluation Sulfuric Acid Mist Manufactured from Combustion (EPRI LARK-TRIPP method used to calculate sulfuric acid emission rate) EM Comb = K*F1*E2 Where: EM Comb = total H 2 SO 4 manufactured from combustion, lbs/year K = molecular weight and units conversion constant = (98.07)/(64.04) * = Molecular weight of H 2 SO 4 E2 = K1 * K2 * C1 * S = Molecular weight of SO 2 K = 3,063 F1 = Fuel Impact Factor F1 = (Western Bituminous coal) E2 = SO 2 mass rate, tons/year Where: K1 = molecular weight and units conversion constant = (64.04)/(100*32.06) = Molecular weight of SO = Molecular weight of S 100 = conversion of % S to fraction K1 = 0.02 K2 = Sulfur conversion to SO 2 ; implicit from EPA AP-42 K2 = 0.95 (Bituminous coal) C1 = Coal burn, tons/year C1 = 1,927,958 tons/year (Unit 1 future max from page 1 of HUN-10) C1 = 1,928,844 tons/year (Unit 2 future max from page 1 of HUN-10) S1 = Coal sulfur weighted, % 57
59 Table HUN - 12 (continued) Huntington Future Potential Sulfuric Acid Emission Evaluation Annual Average Coal Sulfur Concentration (percent) Huntington Unit Huntington Unit S1 = 0.58 % (Unit 1) S1 = 0.59 % (Unit 2) E2 = 20,501 tons/year (Unit 1) (sulfur dioxide emissions) E2 = 20,634 tons/year (Unit 2) (sulfur dioxide emissions) Average Coal Sulfur Concentration (percent) EM Comb = 69,703 lbs/year (Unit 1) (total H 2 SO 4 manufactured from combustion) EM Comb = 70,153 lbs/year (Unit 2) (total H 2 SO 4 manufactured from combustion) ER Comb = EM Comb * F2 (all that apply) (No scrubber bypass on Unit 1 and Unit 2) ER Comb = Sulfuric acid released from combustion F2 = Technology Impact Factors F2 = 0.56 (Air Heater Removal of Sulfuric Acid - PRB Coal; Applicable to Huntington Boilers) F2 = 0.10 (Baghouse; Applicable to Huntington Unit 1 and Unit 2) F2 = 0.40 (Wet FGD - PRB Coal; Applicable to Huntington Unit 1 and Unit 2) 58
60 Table HUN - 12 (continued) Huntington Future Potential Sulfuric Acid Emission Evaluation ER Comb = ER Comb = 1,561 lbs/year (Unit 1 Sulfuric Acid Released from Combustion) 1,571 lbs/year (Unit 2 Sulfuric Acid Released from Combustion) Total Future Potential Sulfuric Acid Emission Rate = 3,133 lbs/year 1.6 tons/year Huntington Unit 1 Huntington Unit 2 Note: Pre-Project FGD (SO 2 scrubber) Post-Project FGD Pre-Project FGC (SO 2 scrubber) (flue gas conditioning) Yes Yes No No Yes Yes No No Post-Project FGC (flue gas conditioning) The pre-project descriptions pertain to the proposed Unit 1 baghouse installation and scrubber upgrade. Huntington Unit 2 did not have a scrubber during the period of maximum coal burn rate. The Huntington Unit 2 scrubber (with no bypass) and baghouse installation was completed in
61 Table HUN - 13 Huntington Past Actual Lead Emission Evaluation Lead emissions calculated using AP-42 Table /98 Lead emissions (lb/10 12 Btu) = 3.4 * (C/A * PM) 0.80 C = milligrams/kilogram (lead cncentration in coal) A= percent ash in coal PM = average particulate matter emission rate lb/mmbtu Annual Average Coal Lead Concentration (C) (ppm) Average Coal Lead Concentration (C) (ppm) Huntington Unit Huntington Unit Annual Average Coal Ash Concentration (A) (percent) Average Coal Ash Concentration (A) (percent) Huntington Unit % 12.97% 14.66% 15.38% 14.75% 14.47% Huntington Unit % 12.98% 14.61% 15.34% 15.02% 14.51% 60
62 Table HUN - 13 (continued) Huntington Past Actual Lead Emission Evaluation Annual Average Particulate Matter Emission Rate (PM) (lb/mmbtu) Average PM Emission Rate (PM) (lb/mmbtu) Huntington Unit Huntington Unit Maximum Past Annual Heat Input (MMBtu/year) Reference Huntington Unit 1 32,762,898 HUN-5; December 2007 Huntington Unit 2 32,279,039 HUN-5; December 2007 Average Lead Concentration (C) (ppm) Average Coal Ash Concentration (A) (weight fraction) Average Particulate Matter Emission Rate (PM) (lb/mmbtu) Annual Lead Emission Rate (lb/10 12 Btu) Huntington Unit Huntington Unit
63 Table HUN - 13 (continued) Huntington Past Actual Lead Emission Evaluation Annual Lead Emission Rate (lb/10 12 Btu) Annual Heat Input (10 12 Btu/year) Annual Lead Emission Rate (lb/year) Annual Lead Emission Rate Huntington Unit Huntington Unit Total Maximum Past Actual Lead Emission Rate: 0.13 tons/year 62
64 Table HUN - 14 Huntington Future Potential Lead Emission Evaluation Lead emissions calculated using AP-42 Table /98 Lead emissions (lb/10 12 Btu) = 3.4 * (C/A * PM) 0.80 C = milligrams/kilogram (lead cncentration in coal) A= percent ash in coal PM = average particulate matter emission rate lb/mmbtu Annual Average Coal Lead Concentration (C) (ppm) Average Coal Lead Concentration (C) (ppm) Huntington Unit Huntington Unit Annual Average Coal Ash Concentration (A) (percent) Average Coal Ash Concentration (A) (percent) Huntington Unit % 12.97% 14.66% 15.38% 14.75% 14.47% Huntington Unit % 12.98% 14.61% 15.34% 15.02% 14.51% 63
65 Table HUN - 14 (continued) Huntington Future Potential Lead Emission Evaluation Huntington Unit 1 Huntington Unit 2 Future Post-Project Particulate Matter Emission Rate (PM) (lb/mmbtu) Huntington Unit 1 Huntington Unit 2 Future Potential Annual Heat Input (MMBtu/year) 43,449,600 43,449,600 Reference Table HUN-10 Table HUN-10 Average Lead Concentration (C) (ppm) Average Coal Ash Concentration (A) (weight fraction) Post-Project Particulate Matter Emission Rate (PM) (lb/mmbtu) Annual Lead Emission Rate (lb/10 12 Btu) Huntington Unit Huntington Unit
66 Table HUN - 14 (continued) Huntington Future Potential Lead Emission Evaluation Annual Lead Emission Rate (lb/10 12 Btu) Annual Heat Input (10 12 Btu/year) Annual Lead Emission Rate (lb/year) Annual Lead Emission Rate Huntington Unit Huntington Unit Total Maximum Future Potential Lead Emission Rate: 0.08 tons/year 65
67 Table HUN - 15 Huntington Past Actual Carbon Monoxide Emission Evaluation Carbon monoxide emissions calculated using AP-42 Table /98 Carbon monoxide AP-42 emission factor = 0.5 lb/ton (0.5 lb of CO emitted per ton of coal burned) Maximum Past Actual Annual Coal Burn Rate Reference Carbon Monoxide Emission Factor lb/ton Annual CO Emission Rate lb/year Annual CO Emission Rate tons/year Huntington Unit 1 1,475,425 HUN-6; May , Huntington Unit 2 1,562,053 NAU-6; May , Total 1,518, Maximum Past Actual Unit 1 and Unit 2 Stack Carbon Monoxide Emissio tons/year Maximum Past Actual Non-Stack CO Emissions Emissions Source Unit #1 Emergency Generator (diesel engine) Unit #2 Emergency Generator (diesel engine) Emergency Fire Pump (diesel engine) Coal Handling and Blending Equipment Total Maximum Non-Stack CO Emission Rate Maximum Past Actual Non-Stack CO Emission Rate Total Maximum Past Actual CO Emission Rate Stack and Non-Stack Emissions
68 Table HUN - 16 Huntington Future Potential Carbon Monoxide Emission Evaluation Step 1: Calculate future potential Unit 1 and Unit 2 CO emissions based on post-low-no X project emission limit for Unit 1 and AP-42 emission factor for Unit 2 Maximum Boiler Heat Input Rate (MMBtu/hour) Post-Project Carbon Monoxide Emission Limit (lb/mmbtu) Maximum Annual Boiler Operational Time (hours/year) Post-Project Annual Carbon Monoxide Emission Rate Huntington Unit 1 4, ,760 7,386.4 Maximum Future Potential Annual Coal Burn Rate Reference Carbon Monoxide Emission Factor lb/ton Annual CO Emission Rate lb/year Annual CO Emission Rate tons/year Huntington Unit 2 1,928,844 HUN , Step 2: Identify the future potential non-stack CO emissions Maximum Non-Stack CO Emission Rate: 24.8 tons/year (Reference HUN-15) Step 3: Identify total annual Unit 1 post-low-no X control project annual carbon monoxide emission rate Post-Project Annual Carbon Monoxide Emission Rate Huntington Unit 1 7,386.4 Huntington Unit Non-Stack 24.8 Total 7,
69 Table HUN - 17 Huntington Past Actual VOC Emission Evaluation Volatile Organic Compound emissions calculated using AP-42 Table /98 VOC AP-42 emission factor = 0.06 lb/ton (0.06 lb of VOC emitted per ton of coal burned) Maximum Past Actual Annual Coal Burn Rate Reference VOC Emission Factor lb/ton Annual VOC Emission Rate lb/year Annual VOC Emission Rate tons/year Huntington Unit 1 1,475,425 HUN-6; May , Huntington Unit 2 1,562,053 HUN-6; May , Total 182, Maximum Past Actual Unit 1 and Unit 2 Stack CO Emission Rate: 91.1 tons/year Maximum Past Actual Non-Stack VOC Emissions Emissions Source Unit #1 Emergency Generator (diesel engine) 0.0 Unit #2 Emergency Generator (diesel engine) 0.0 Emergency Fire Pump (diesel engine) 0.1 Coal Handling and Blending Equipment 2.6 Total Maximum Non-Stack VOC Emission Rate Maximum Past Actual Non-Stack CO Emission Rate 2.7 Total Maximum Past Actual VOC Emission Rate Stack and Non-Stack Emissions
70 Table HUN - 18 Huntington Future Potential VOC Emission Evaluation Volatile Organic Compound emissions calculated using AP-42 Table /98 VOC AP-42 emission factor = 0.06 lb/ton (0.06 lb of VOC emitted per ton of coal burned) Maximum Future Potential Annual Coal Burn Rate Reference VOC Emission Factor lb/ton Annual VOC Emission Rate lb/year Annual VOC Emission Rate tons/year Huntington Unit 1 1,927,958 from HUN , Huntington Unit 2 1,928,844 from HUN , Non-Stack NA NA NA 5, Total 236, Maximum Future Potential VOC Emission Rate: tons/year 69
71 Table HUN - 19 Past Actual Hazardous Air Pollutant Emissions Facility: Emission Unit: Huntington Steam generating unit (primary fuel, coal) Production Data Unit 1 Unit 2 Coal consumption, ton/year 1,475,425 1,562,053 ton/yr Maximum occurred in May 2005 % Moisture in the coal % 2005 coal analysis Coal consumption dry, ton/year 1,361,510 1,441,450 ton/yr Calculated based on coal % moisture Heating value of coal, Btu/lb 11,045 11,051 Btu/lb 2005 data Heat Input 32,592,826 34,524,169 mmbtu/yr Calculated based on coal burn and heating content Ash fraction in coal, lb ash/lb coal lb ash/lb coal 2005 emissions inventory rate Particulate matter concentration, lb/mmbtu lb/mmbtu May 2005 PM emission rates HAPS from Coal Unit 1 Unit 2 HAP Emissions HAP CAS # Emission Factor Emission Factor Units Reference (lb/year) Arsenic E E+00 lb/10 12 Btu AP-42 Table / Benzene lb/ton AP-42 Table /98 3,643.8 Beryllium E E-01 lb/10 12 Btu AP-42 Table / Chromium E E+01 lb/10 12 Btu AP-42 Table / Cadmium E E+00 lb/1012btu AP-42 Table / Formaldehyde lb/ton AP-42 Table / Acetaldehyde lb/ton AP-42 Table /98 1,597.7 Acetophenone lb/ton AP-42 Table / Acrolein lb/ton AP-42 Table / Antimony E E-01 lb/10 12 Btu AP-42 Table / Benzyl Chloride lb/ton AP-42 Table /98 1,962.1 Biphenyl lb/ton AP-42 Table / Bis (2-ethylhexy)phthalate (DEHP) lb/ton AP-42 Table / Bromoform lb/ton AP-42 Table / Carbon Disulfide lb/ton AP-42 Table / Chloracetophenone lb/ton AP-42 Table / Chlorobenzene lb/ton AP-42 Table / Chloroform lb/ton AP-42 Table / Cobalt E E+00 lb/10 12 Btu AP-42 Table / Cumene lb/ton AP-42 Table / Cyanide lb/ton AP-42 Table /98 7,007.4 Dimethyl Sulfate lb/ton AP-42 Table / ,4-Dinitrotoluene lb/ton AP-42 Table / Ethylbenzene lb/ton AP-42 Table / Ethyl Chloride lb/ton AP-42 Table / Ethylene Dibromide lb/ton AP-42 Table / Ethylene Dichloride lb/ton AP-42 Table / Hexane lb/ton AP-42 Table / Hydrogen Chloride from HCl worksheet (below) 978,374.8 Isophorone lb/ton AP-42 Table /98 1,625.7 Manganese E E+01 lb/10 12 Btu AP-42 Table / Mercury from Mercury worksheet (below) 54.6 Methyl Bromide lb/ton AP-42 Table / Methyl Chloride lb/ton AP-42 Table /98 1,485.6 Methyl Chloroform (1,1,1-Trichloroethane) lb/ton AP-42 Table /
72 Table HUN - 19 (continued) Past Actual Hazardous Air Pollutant Emissions HAPS from Coal Unit 1 Unit 2 HAP Emissions HAP CAS # Emission Factor Emission Factor Units Reference (lb/year) Methyl Ethyl Ketone lb/ton AP-42 Table /98 1,093.2 Methyl Hydrazine lb/ton AP-42 Table / Methyl Methacrylate lb/ton AP-42 Table / Methyl Tert Butyl Ether lb/ton AP-42 Table / Methylene Chloride lb/ton AP-42 Table / Naphthalene lb/ton AP-42 Table / Nickel E E+00 lb/10 12 Btu AP-42 Table / o-xylenes N/A N/A N/A NA Phenol lb/ton AP-42 Table / Phosphorus N/A N/A N/A NA Polycylic Organic Matter (POM) * N/A lb/10 12 Btu EPRI Data Propionaldehyde lb/ton AP-42 Table /98 1,065.1 Selenium lb/ton AP-42 Table /97 3,643.8 Styrene lb/ton AP-42 Table / Tetrachloroethylene lb/ton AP-42 Table / Toluene lb/ton AP-42 Table / Vinyl Acetate lb/ton AP-42 Table / Xylenes lb/ton AP-42 Table / Dioxin/Furans N/A lb/10 12 Btu EPRI Data 0.0 Total Past Actual Coal HAPs (lb/year): 1,010,042.7 Radionuclides are also emitted in small quantities, unable to estimate with current data. * All POM emission factors were summed to make this one emission factor. Note:? Calculated annual HAPs emission rate does not include For Metal HAP emissions (example; arsenic): lead, hydrogen fluoride or sulfuric acid. E = 3.1 * (C/A * PM) 0.85 lb/10 12 BTU? Emissions of these chemicals are calculated separately Where: E = arsenic emission rate in lb/10 12 BTU C = concentration of arsenic in coal, parts per million weight A = coal ash content, 15% ash equals 0.15 PM = particulate matter emission factor, lb/10 6 BTU Unit 1 PM Emission Rate Unit 2 PM Emission Rate Concentration of HAP in Coal: lb/10 6 BTU lb/10 6 BTU Trace Element Dry Units Reference Stack Test Values from May 2005 Sb 1 ppmdw Coal trace element analysis As 1.33 ppmdw Coal trace element analysis Be 0.63 ppmdw Coal trace element analysis Cd 0.27 ppmdw Coal trace element analysis Cr 22 ppmdw Coal trace element analysis Co 3.33 ppmdw Coal trace element analysis Pb 5.33 ppmdw Coal trace element analysis Mn ppmdw Coal trace element analysis Ni 9.67 ppmdw Coal trace element analysis Hg 0.03 ppmdw Coal trace element analysis Se 1.33 ppmdw Coal trace element analysis Cl ppmdw Coal trace element analysis F ppmdw Coal trace element analysis 71
73 Table HUN - 19 (continued) Past Actual Hazardous Air Pollutant Emissions Production Data Fuel Oil Consumption 558,266 gallons/year 2005 Production Data Heat Input 140,000 BTU/gallon Production Data HAPS from Fuel Oil Summary HAP CAS # Emission Factor Reference (lb/year) Arsenic AP-42 Table , 9/ Benzene N/A Beryllium AP-42 Table , 9/ Chromium AP-42 Table , 9/ Cadmium AP-42 Table , 9/ Formaldehyde N/A Acetaldehyde N/A Acetophenone N/A Acrolein N/A Antimony N/A Benzyl Chloride N/A Biphenyl N/A Bis (2-ethylhexy)phthalate (DEHP) N/A Bromoform N/A Carbon Disulfide N/A 2-Chloracetophenone N/A Chlorobenzene N/A Chloroform N/A Cobalt N/A Cumene N/A Cyanide N/A Dimethyl Sulfate N/A 2,4-Dinitrotoluene N/A Ethylbenzene N/A Ethyl Chloride N/A Ethylene Dibromide N/A Ethylene Dichloride N/A Hexane N/A Hydrogen Chloride N/A Isophorone N/A Manganese AP-42 Table , 9/ Mercury AP-42 Table , 9/ Methyl Bromide N/A Methyl Chloride N/A Methyl Chloroform (1,1,1-Trichloroethane) N/A Methyl Ethyl Ketone N/A Methyl Hydrazine N/A Methyl Methacrylate N/A Methyl Tert Butyl Ether N/A Methylene Chloride N/A Naphthalene N/A Nickel AP-42 Table , 9/ o-xylene N/A 72
74 Table HUN - 19 (continued) Past Actual Hazardous Air Pollutant Emissions HAPS from Fuel Oil Summary HAP CAS # Emission Factor Reference (lb/year) Phenol N/A Phosphorous N/A N/A Polycylic Organic Matter (POM) * N/A Propionaldehyde N/A Selenium AP-42 Table , 9/ Styrene N/A Tetrachloroethylene N/A Toluene N/A Vinyl Acetate N/A Xylenes N/A N/A Dioxin/Furans N/A N/A * All POM emission factors were summed to make this one emission factor. Total Past Actual Fuel Oil HAPs (lb/year):
75 Table HUN - 19 (continued) Past Actual Hazardous Air Pollutant Emissions Total HAP Emissions from Coal and Fuel Oil Coal HAP Fuel Oil HAP Total HAP Emissions Emissions Emissions HAP lb/year lb/year lb/year Arsenic Benzene 3, ,643.8 Beryllium Chromium Cadmium Formaldehyde Acetaldehyde 1, ,597.7 Acetophenone Acrolein Antimony Benzyl Chloride 1, ,962.1 Biphenyl Bis (2-ethylhexy)phthalate (DEHP) Bromoform Carbon Disulfide Chloracetophenone Chlorobenzene Chloroform Cobalt Cumene Cyanide 7, ,007.4 Dimethyl Sulfate ,4-Dinitrotoluene Ethylbenzene Ethyl Chloride Ethylene Dibromide Ethylene Dichloride Hexane Hydrogen Chloride 978, ,374.8 Isophorone 1, ,625.7 Manganese Mercury Methyl Bromide Methyl Chloride 1, ,485.6 Methyl Chloroform (1,1,1-Trichloroethane) Methyl Ethyl Ketone 1, ,093.2 Methyl Hydrazine Methyl Methacrylate Methyl Tert Butyl Ether Methylene Chloride Naphthalene Nickel o-xylene 0.0 Phenol Phosphorous 0.0 Polycylic Organic Matter (POM) * Propionaldehyde 1, ,
76 Table HUN - 19 (continued) Past Actual Hazardous Air Pollutant Emissions Total HAP Emissions from Coal and Fuel Oil Coal HAP Fuel Oil HAP Total HAP Emissions Emissions Emissions HAP lb/year lb/year lb/year Selenium 3, ,645.0 Styrene Tetrachloroethylene Toluene Vinyl Acetate Xylenes Dioxin/Furans Worksheets for Past Actual Mercury and Hydrogen Chloride Emissions Total Past Actual HAP Emissions (Coal and Fuel Oil): 1,010,045.9 lbs/year tons/year Past Actual Mercury Emission Worksheet Production Data Heat Input 65,041,937 MMBtu/year (Maximum past actual heat input occurred in December 2007) 32,762,898 MMBtu/year (Unit 1 annual heat input in December 2007) 32,279,039 MMBtu/year (Unit 2 annual heat input in December 2007) Past Actual Mercury Emission Rates Huntington Unit lb/10 12 Btu (Assumed rate from Unit 2 testing) Huntington Unit lb/10 12 Btu (Emission rate from Unit 2 testing) Huntington Unit 1 Mercury Emissions Huntington Unit 2 Mercury Emissions Total Past Actual Mercury Emissions: 27.5 lbs/year 27.1 lbs/year 54.6 lbs/year Past Actual Hydrogen Chloride Emission Worksheet Past Actual HCl Emissions Reference: EPRI Equations 5-1, 5-2, 5-3, 5-4 and 5-5 Unit 1 Unit 2 Total Past Actual HCl Release lb/year Coal consumption, ton/year 1,475,425 1,562,053 Coal consumption - Dry, ton/year 1,361,510 1,441,450 % Moisture in the coal 7.72% 7.72% Cl, PPM HCl acid conver factor, compound/parent chemical FGD Bypass, fraction 6.5% 100.0% HCl FGD emission factor 3.0% 3.0% Bituminous HCl non-scrubbed emission factor 100.0% 100.0% Total manufactured - lb/year 849, ,333 Air Release with FGD Removal 23, Air Release with bypass 55, ,333 Total HCL Air Release 79, , ,375 75
77 Table HUN - 20 Future Potential Hazardous Air Pollutant Emissions Facility: Emission Unit: Huntington Steam generating unit (primary fuel, coal) Production Data Unit 1 Unit 2 Coal consumption, ton/year 1,927,958 1,928,844 ton/yr Future potential coal burn rates from HUN-10 % Moisture in the coal % 2005 coal analysis Coal consumption dry, ton/year 1,779,104 1,779,921 ton/yr Calculated based on coal % moisture Heating value of coal, Btu/lb 11,045 11,051 Btu/lb 2005 data Heat Input 42,589,512 42,630,903 mmbtu/yr Calculated based on coal burn and heating content Ash fraction in coal, lb ash/lb coal lb ash/lb coal 2005 emissions inventory rate Particulate matter concentration, lb/mmbtu lb/mmbtu Requested Unit 1 and existing Unit 2 PM emission rates HAPS from Coal Unit 1 Unit 2 HAP Emissions HAP CAS # Emission Factor Emission Factor Units Reference (lb/year) Arsenic E E-01 lb/10 12 Btu AP-42 Table / Benzene lb/ton AP-42 Table /98 4,626.7 Beryllium E E-02 lb/10 12 Btu AP-42 Table / Chromium E E+00 lb/10 12 Btu AP-42 Table / Cadmium E E-01 lb/1012btu AP-42 Table / Formaldehyde lb/ton AP-42 Table / Acetaldehyde lb/ton AP-42 Table /98 2,028.6 Acetophenone lb/ton AP-42 Table / Acrolein lb/ton AP-42 Table /98 1,032.1 Antimony E E-01 lb/10 12 Btu AP-42 Table / Benzyl Chloride lb/ton AP-42 Table /98 2,491.3 Biphenyl lb/ton AP-42 Table / Bis (2-ethylhexy)phthalate (DEHP) lb/ton AP-42 Table / Bromoform lb/ton AP-42 Table / Carbon Disulfide lb/ton AP-42 Table / Chloracetophenone lb/ton AP-42 Table / Chlorobenzene lb/ton AP-42 Table / Chloroform lb/ton AP-42 Table / Cobalt E E-01 lb/10 12 Btu AP-42 Table / Cumene lb/ton AP-42 Table / Cyanide lb/ton AP-42 Table /98 8,897.6 Dimethyl Sulfate lb/ton AP-42 Table / ,4-Dinitrotoluene lb/ton AP-42 Table / Ethylbenzene lb/ton AP-42 Table / Ethyl Chloride lb/ton AP-42 Table / Ethylene Dibromide lb/ton AP-42 Table / Ethylene Dichloride lb/ton AP-42 Table / Hexane lb/ton AP-42 Table / Hydrogen Chloride from HCl worksheet (below) 66,615.2 Isophorone lb/ton AP-42 Table /98 2,064.2 Manganese E E+00 lb/10 12 Btu AP-42 Table / Mercury from Mercury worksheet (below) 71.6 Methyl Bromide lb/ton AP-42 Table / Methyl Chloride lb/ton AP-42 Table /98 1,886.3 Methyl Chloroform (1,1,1-Trichloroethane) lb/ton AP-42 Table /
78 Table HUN - 20 (continued) Future Potential Hazardous Air Pollutant Emissions HAPS from Coal Unit 1 Unit 2 HAP Emissions HAP CAS # Emission Factor Emission Factor Units Reference (lb/year) Methyl Ethyl Ketone lb/ton AP-42 Table /98 1,388.0 Methyl Hydrazine lb/ton AP-42 Table / Methyl Methacrylate lb/ton AP-42 Table / Methyl Tert Butyl Ether lb/ton AP-42 Table / Methylene Chloride lb/ton AP-42 Table /98 1,032.1 Naphthalene lb/ton AP-42 Table / Nickel E E+00 lb/10 12 Btu AP-42 Table / o-xylenes N/A N/A N/A NA Phenol lb/ton AP-42 Table / Phosphorus N/A N/A N/A NA Polycylic Organic Matter (POM) * N/A lb/10 12 Btu EPRI Data Propionaldehyde lb/ton AP-42 Table /98 1,352.4 Selenium lb/ton AP-42 Table /97 4,626.7 Styrene lb/ton AP-42 Table / Tetrachloroethylene lb/ton AP-42 Table / Toluene lb/ton AP-42 Table / Vinyl Acetate lb/ton AP-42 Table / Xylenes lb/ton AP-42 Table / Dioxin/Furans N/A lb/10 12 Btu EPRI Data 0.0 Total Past Actual Coal HAPs (lb/year): 105,781.1 Radionuclides are also emitted in small quantities, unable to estimate with current data. * All POM emission factors were summed to make this one emission factor. Note:? Calculated annual HAPs emission rate does not include For Metal HAP emissions (example; arsenic): lead, hydrogen fluoride or sulfuric acid. E = 3.1 * (C/A * PM) 0.85 lb/10 12 BTU? Emissions of these chemicals are calculated separately Where: E = arsenic emission rate in lb/10 12 BTU C = concentration of arsenic in coal, parts per million weight A = coal ash content, 15% ash equals 0.15 PM = particulate matter emission factor, lb/10 6 BTU Unit 1 PM Emission Rate Unit 2 PM Emission Rate Concentration of HAP in Coal: lb/10 6 BTU lb/10 6 BTU Trace Element Dry Units Reference Existing and Future Emission Rates Sb 1 ppmdw Coal trace element analysis As 1.33 ppmdw Coal trace element analysis Be 0.63 ppmdw Coal trace element analysis Cd 0.27 ppmdw Coal trace element analysis Cr 22 ppmdw Coal trace element analysis Co 3.33 ppmdw Coal trace element analysis Pb 5.33 ppmdw Coal trace element analysis Mn ppmdw Coal trace element analysis Ni 9.67 ppmdw Coal trace element analysis Hg 0.03 ppmdw Coal trace element analysis Se 1.33 ppmdw Coal trace element analysis Cl ppmdw Coal trace element analysis F ppmdw Coal trace element analysis 77
79 Table HUN - 20 (continued) Future Potential Hazardous Air Pollutant Emissions Production Data Fuel Oil Consumption 558,266 gallons/year 2005 Production Data Heat Input 140,000 BTU/gallon Production Data HAPS from Fuel Oil Summary HAP CAS # Emission Factor Reference (lb/year) Arsenic AP-42 Table , 9/ Benzene N/A Beryllium AP-42 Table , 9/ Chromium AP-42 Table , 9/ Cadmium AP-42 Table , 9/ Formaldehyde N/A Acetaldehyde N/A Acetophenone N/A Acrolein N/A Antimony N/A Benzyl Chloride N/A Biphenyl N/A Bis (2-ethylhexy)phthalate (DEHP) N/A Bromoform N/A Carbon Disulfide N/A 2-Chloracetophenone N/A Chlorobenzene N/A Chloroform N/A Cobalt N/A Cumene N/A Cyanide N/A Dimethyl Sulfate N/A 2,4-Dinitrotoluene N/A Ethylbenzene N/A Ethyl Chloride N/A Ethylene Dibromide N/A Ethylene Dichloride N/A Hexane N/A Hydrogen Chloride N/A Isophorone N/A Manganese AP-42 Table , 9/ Mercury AP-42 Table , 9/ Methyl Bromide N/A Methyl Chloride N/A Methyl Chloroform (1,1,1-Trichloroethane) N/A Methyl Ethyl Ketone N/A Methyl Hydrazine N/A Methyl Methacrylate N/A Methyl Tert Butyl Ether N/A Methylene Chloride N/A Naphthalene N/A Nickel AP-42 Table , 9/ o-xylene N/A 78
80 Table HUN - 20 (continued) Future Potential Hazardous Air Pollutant Emissions HAPS from Fuel Oil Summary HAP CAS # Emission Factor Reference (lb/year) Phenol N/A Phosphorous N/A N/A Polycylic Organic Matter (POM) * N/A Propionaldehyde N/A Selenium AP-42 Table , 9/ Styrene N/A Tetrachloroethylene N/A Toluene N/A Vinyl Acetate N/A Xylenes N/A N/A Dioxin/Furans N/A N/A * All POM emission factors were summed to make this one emission factor. Total Future Potential Fuel Oil HAPs (lb/year):
81 Table HUN - 20 (continued) Future Potential Hazardous Air Pollutant Emissions Total HAP Emissions from Coal and Fuel Oil Coal HAP Fuel Oil HAP Total HAP Emissions Emissions Emissions HAP lb/year lb/year lb/year Arsenic Benzene 3, ,626.7 Beryllium Chromium Cadmium Formaldehyde Acetaldehyde 1, ,028.6 Acetophenone Acrolein ,032.1 Antimony Benzyl Chloride 1, ,491.3 Biphenyl Bis (2-ethylhexy)phthalate (DEHP) Bromoform Carbon Disulfide Chloracetophenone Chlorobenzene Chloroform Cobalt Cumene Cyanide 7, ,897.6 Dimethyl Sulfate ,4-Dinitrotoluene Ethylbenzene Ethyl Chloride Ethylene Dibromide Ethylene Dichloride Hexane Hydrogen Chloride 978, ,615.2 Isophorone 1, ,064.2 Manganese Mercury Methyl Bromide Methyl Chloride 1, ,886.3 Methyl Chloroform (1,1,1-Trichloroethane) Methyl Ethyl Ketone 1, ,388.0 Methyl Hydrazine Methyl Methacrylate Methyl Tert Butyl Ether Methylene Chloride ,032.1 Naphthalene Nickel o-xylene Phenol Phosphorous Polycylic Organic Matter (POM) * Propionaldehyde 1, ,
82 Table HUN - 20 (continued) Future Potential Hazardous Air Pollutant Emissions Total HAP Emissions from Coal and Fuel Oil Coal HAP Fuel Oil HAP Total HAP Emissions Emissions Emissions HAP lb/year lb/year lb/year Selenium 3, ,626.7 Styrene Tetrachloroethylene Toluene Vinyl Acetate Xylenes Dioxin/Furans Worksheets for Future Potential Mercury and Hydrogen Chloride Emissions Total Future Potential HAP Emissions (Coal and Fuel Oil): 105,781.1 lbs/year 52.9 tons/year Future Potential Mercury Emission Worksheet Production Data Heat Input 85,220,415 MMBtu/year (Maximum future potential heat input rate) 42,589,512 MMBtu/year (Unit 1 future potential heat input rate) 42,630,903 MMBtu/year (Unit 2 future potential heat input rate) Future Potential Mercury Emission Rates Huntington Unit lb/10 12 Btu (Assumed rate from Unit 2 testing) Huntington Unit lb/10 12 Btu (Emission rate from Unit 2 testing) Huntington Unit 1 Mercury Emissions Huntington Unit 2 Mercury Emissions Total Future Potential Mercury Emissions: 35.8 lbs/year 35.8 lbs/year 71.6 lbs/year Future Potential Hydrogen Chloride Emission Worksheet Future Potential HCl Emissions Reference: EPRI Equations 5-1, 5-2, 5-3, 5-4 and 5-5 Unit 1 Unit 2 Total Future Potential HCl Release lb/year Coal consumption, ton/year 1,927,958 1,928,844 Coal consumption - Dry, ton/year 1,779,104 1,779,921 % Moisture in the coal 7.72% 7.72% Cl, PPM HCl acid conver factor, compound/parent chemical FGD Bypass, fraction 0.0% 0.0% HCl FGD emission factor 3.0% 3.0% Bituminous HCl non-scrubbed emission factor 100.0% 100.0% Total manufactured - lb/year 1,109,998 1,110,508 Air Release with FGD Removal 33,300 33,315.2 Air Release with bypass 0 0 Total HCL Air Release 33,300 33,315 66,615 81
83 Appendix C: Approval Order Form This appendix includes a completed Utah Division of Air Quality Air Quality New Source Review form for an approval order for Huntington Unit 1 pollution control equipment and other planned facility projects. 82
84 Utah Division of Air Quality Date: April 11, 2008 New Source Review Section Form 1 General Information? Application for:? Initial Approval Order C Approval Order Modification AN APPROVAL ORDER MUST BE ISSUED BEFORE ANY CONSTRUCTION OR INSTALLATION CAN BEGIN. This is not a stand alone document. Please refer to the Permit Application Instructions for specific details required to complete the application. Please print or type all information requested. All information requested must be completed and submitted before an engineering review can be initiated. If you have any questions, contact the Division of Air Quality at (801) and ask to speak with a New Source Review Engineer. Written inquiries may be addressed to: Division of Air Quality, New Source Review Section, P.O. Box , Salt Lake City, Utah Applicable base fee for engineering review and filing fee must be submitted with the application. General Owner and Facility Information 1. Company name and address: PacifiCorp 1407 West North Temple Salt Lake City, UT Phone No.: (801) Fax No.: (801) Facility name and address (if different from above): Huntington Plant P.O. Box 680 Huntington, Utah County where the facility is located in: Emery Co. 2. Company contact for environmental matters: William K. Lawson 1407 West North Temple Suite 210 Salt Lake City, UT Phone No.: (801) Fax No.: (801) Owners name and address: PacifiCorp 1407 West North Temple Salt Lake City, UT Phone No.: (801) Fax No.: (801) Latitude & longitude, and/or UTM coordinates of plant: Approximately: 39 o North Latitude 111 o West Longitude 7. Directions to plant or Installation (street address and/or directions to site) (include U.S. Coast and Geodetic Survey map if necessary): State highway 31, approximately 7 miles northwest of Huntington, Utah 8. Identify any current Approval Order(s): DAQE-AN Dated August 14, 2006 DAQE-AO Dated March 30, If request for modification, permit # to be modified: DAQE-AN DATED: 08/14/ Type of business at this facility: coal-fired steam electric generating plant 11. Total company employees greater than 100? C Yes? No Standard Industrial Classification Code
85 Approval Order Application Form 1 (Continued) 13. Application for:? New construction C Modification? Existing equipment operating without permit? Permanent site for Portable Approval Order? Change of permit condition? Change of location 14. For new construction or modification, enter estimated start date: 09/18/10 Estimated completion date: 11/22/ For change of permittee, location or condition, enter date of occurrence: 16. For existing equipment in operation without prior permit, enter initial operation date: 17. Has facility been modified or the capacity increased since November 29, 1969:? Yes C No 18. Site plan of facility (Attach as Appendix A): Process Information 19. Flow diagram of entire process to include flow rates and other applicable information (Attach as Appendix B): Appendix B 20. Detailed written process and equipment description. (Attach as Appendix C) Section 2 and Appendix C Description must include: Process/Equip specific form(s) identified in the instructions Fuels and their use Equipment used in process Description of product(s) Raw materials used Operation schedules Description of changes to process (if applicable) Production rates (including daily/seasonal variances) 21. Does this application contain justifiable confidential data?? Yes C No Emissions Information 22. Complete and attach Form 1d, Emissions Information See Section 3 and Appendix C and D Include Material Safety Data Sheets for all chemicals or compounds that may be emitted to the atmosphere 23. Identify on the site plan (see #18 above) all emissions points, building dimensions, stack parameters, etc. 84
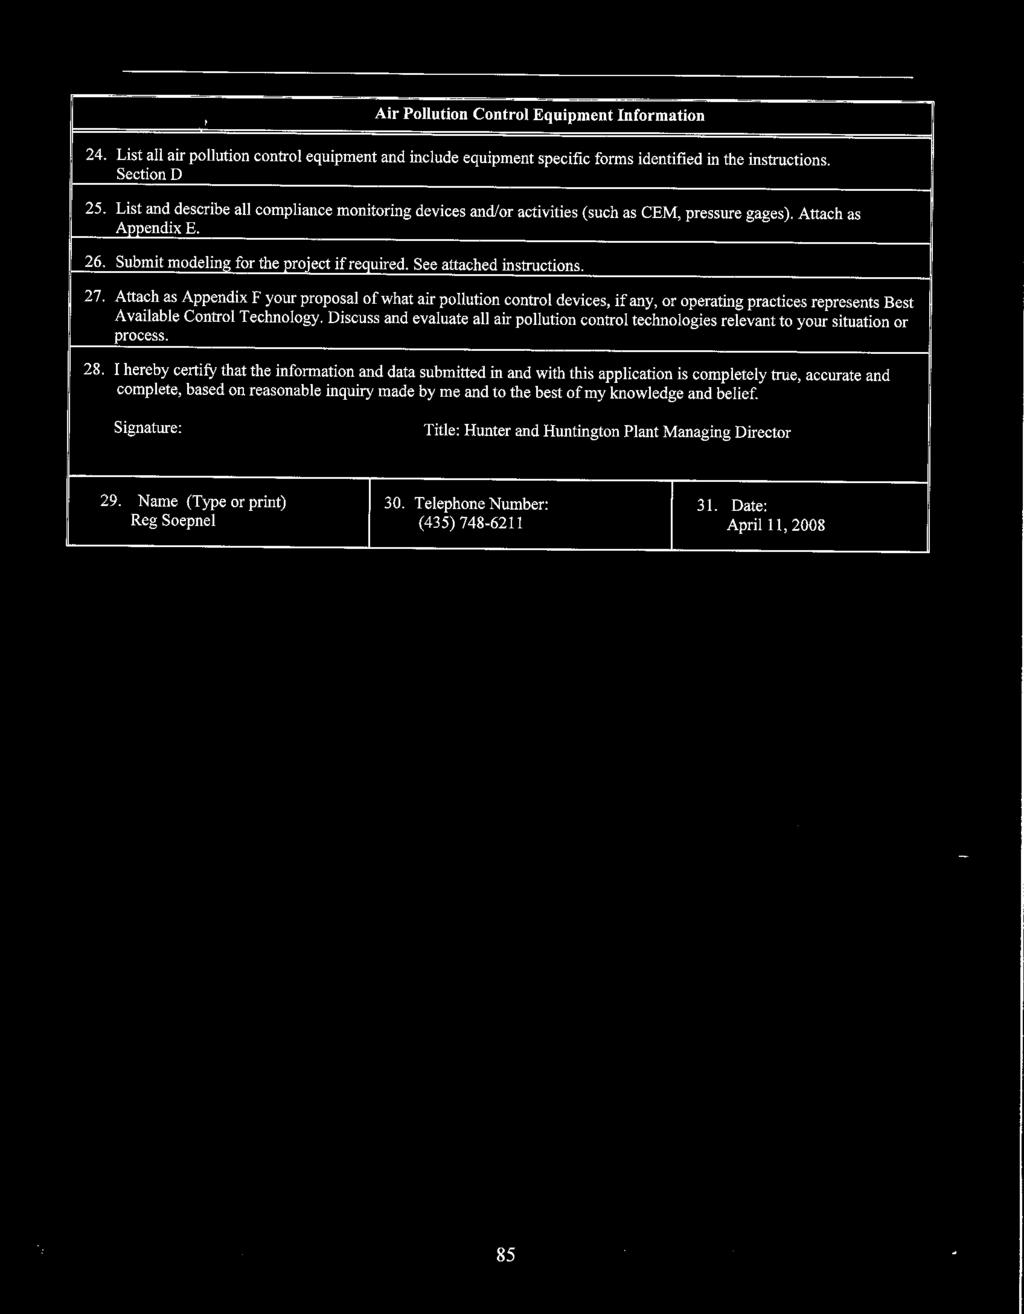
86
Facility Name: BASF Corporation Attapulgus Operations City: Attapulgus County: Decatur AIRS #: Application #: 22788
 Facility Name: BASF Corporation Attapulgus Operations City: Attapulgus County: Decatur AIRS #: 04-13-08700037 Application #: 22788 Date SIP Application Received: August 11, 2014 Date Title V Application
Industrial, Commercial and Institutional Boilers at Area Source Facilities (Boiler GACT) Final Reconsidered Rule Requirements Summary
 Final Reconsidered Rule Requirements Summary") Industrial, Commercial and Institutional Boilers at Area Facilities (Boiler GACT) Final Reconsidered Rule Requirements Summary Federal Regulation NESHAP, 40 CFR 63, Subpart JJJJJJ Proposed rule published
Industrial, Commercial and Institutional Boilers at Area Facilities (Boiler GACT) Final Reconsidered Rule Requirements Summary Federal Regulation NESHAP, 40 CFR 63, Subpart JJJJJJ Proposed rule published
Public Service Company of Colorado THE SOURCE TO WHICH THIS PERMIT APPLIES IS DESCRIBED AND LOCATED AS FOLLOWS:
 COLORADO DEPARTMENT OF PUBLIC HEALTH AND ENVIRONMENT AIR POLLUTION CONTROL DIVISION TELEPHONE: (303) 692-3150 CONSTRUCTION PERMIT PERMIT NO: 11PB859 DATE ISSUED: JULY 5, 2005 INITIAL APPROVAL Modification
This rule shall apply to any stationary source which is a major source of regulated air pollutants or of hazardous air pollutants.
 RULE 2530 FEDERALLY ENFORCEABLE POTENTIAL TO EMIT (Adopted June 15, 1995; Amended April 25, 2002; Amended December 18, 2008, but not in effect until June 10, 2010) 1.0 Purpose The purpose of this rule
Streamlining Multiple Applicable Requirements
 Streamlining Multiple Applicable Requirements What is Streamlining? 1. Streamlining is the process of determining one set of requirements to be incorporated into the Title V permit from among multiple
The Premcor Refining Group, Inc. Delaware City Refinery 4550 Wrangle Hill Rd. EXHIBIT A Delaware City, DE 19706
 DRAFT Permit: APC-2004/0721-CONSTRUCTION (NSPS) Two Package Boilers The Premcor Refining Group, Inc. Delaware City Refinery 4550 Wrangle Hill Rd. EXHIBIT A Delaware City, DE 19706 ATTENTION: Andrew Kenner
NARRATIVE. Dika Kuoh Alaa-Eldin A. Afifi DATE: December 14, 2015
 Georgia Department of Natural Resources Environmental Protection Division Air Protection Branch 4244 International Parkway Suite 120 Atlanta Georgia 30354 404/363-7000 Fax: 404/363-7100 Judson H. Turner,
AIR EMISSION SOURCE CONSTRUCTION PERMIT
 AIR EMISSION SOURCE CONSTRUCTION PERMIT Source ID No.: 0550023 Effective Date: Source Name: DRAFT Holcomb Station NAICS: 221112, Fossil fuel power generation (SIC 4911) Site Location: Site Owner/Operator
RULE 4352 SOLID FUEL FIRED BOILERS, STEAM GENERATORS AND PROCESS HEATERS (Adopted September 14, 1994; Amended October 19, 1995; Amended May 18, 2006)
") RULE 4352 SOLID FUEL FIRED BOILERS, STEAM GENERATORS AND PROCESS HEATERS (Adopted September 14, 1994; Amended October 19, 1995; Amended May 18, 2006) 1.0 Purpose The purpose of this rule is to limit emissions
RULE 4352 SOLID FUEL FIRED BOILERS, STEAM GENERATORS AND PROCESS HEATERS (Adopted September 14, 1994; Amended October 19, 1995; Amended May 18, 2006) 1.0 Purpose The purpose of this rule is to limit emissions
ELECTRICAL GENERATING STEAM BOILERS, REPLACEMENT UNITS AND NEW UNITS (Adopted 1/18/94; Rev. Adopted & Effective 12/12/95)
") RULE 69. ELECTRICAL GENERATING STEAM BOILERS, REPLACEMENT UNITS AND NEW UNITS (Adopted 1/18/94; Rev. Adopted & Effective 12/12/95) (a) APPLICABILITY (1) Except as provided in Section (b) or otherwise specified
RULE 69. ELECTRICAL GENERATING STEAM BOILERS, REPLACEMENT UNITS AND NEW UNITS (Adopted 1/18/94; Rev. Adopted & Effective 12/12/95) (a) APPLICABILITY (1) Except as provided in Section (b) or otherwise specified
ALLEGHENY COUNTY HEALTH DEPARTMENT AIR QUALITY PROGRAM
 ALLEGHENY COUNTY HEALTH DEPARTMENT AIR QUALITY PROGRAM June 17, 2004 SUBJECT: Review of Application Title V Operating Permit Bellefield Boiler Plant Boundary Street Pittsburgh, PA 15213 RE: Operating Permit
Facility Name: Chevron Products Company Doraville Terminal City: Doraville County: DeKalb AIRS #: Application #: 40411
 Facility Name: Chevron Products Company Doraville Terminal City: Doraville County: DeKalb AIRS #: 04-13-089-00100 Application #: 40411 Date SIP Application Received: September 28, 2015 Date Title V Application
3.1 Air Pollution Control Officer (APCO): as defined in Rule 1020 (Definitions).
: as defined in Rule 1020 (Definitions).") RULE 4352 SOLID FUEL FIRED BOILERS, STEAM GENERATORS AND PROCESS HEATERS (Adopted September 14, 1994; Amended October 19, 1995; Amended May 18, 2006; Amended December 15, 2011) 1.0 Purpose The purpose
RULE 4352 SOLID FUEL FIRED BOILERS, STEAM GENERATORS AND PROCESS HEATERS (Adopted September 14, 1994; Amended October 19, 1995; Amended May 18, 2006; Amended December 15, 2011) 1.0 Purpose The purpose
ALLEGHENY COUNTY HEALTH DEPARTMENT AIR QUALITY PROGRAM
 ALLEGHENY COUNTY HEALTH DEPARTMENT AIR QUALITY PROGRAM February 2, 2012 SUBJECT: Superior Appalachian Pipeline, LLC Kissick Lane Frazer Township, PA 15084 Allegheny County Installation Permit No. 0837-I001
APPENDIX D. REGULATIONS (excerpts) ON 24-HOUR EMISSION LIMITS: MARYLAND DEPARTMENT OF THE ENVIRONMENT
 ON 24-HOUR EMISSION LIMITS: MARYLAND DEPARTMENT OF THE ENVIRONMENT") APPENDIX D APPENDIX D REGULATIONS (excerpts) ON 24-HOUR EMISSION LIMITS: MARYLAND DEPARTMENT OF THE ENVIRONMENT DELAWARE DEPARTMENT OF NATURAL RESOURCES AND ENVIRONMENTAL CONTROL NEW JERSEY STATE DEPARTMENT
APPENDIX D APPENDIX D REGULATIONS (excerpts) ON 24-HOUR EMISSION LIMITS: MARYLAND DEPARTMENT OF THE ENVIRONMENT DELAWARE DEPARTMENT OF NATURAL RESOURCES AND ENVIRONMENTAL CONTROL NEW JERSEY STATE DEPARTMENT
Part 70 Operating Permit Amendment
 Part 70 Operating Permit Amendment Effective Date: February 18, 2016 Facility Name: Scherer Steam-Electric Generating Plant Facility Address 10986 Highway 87 Juliette, Georgia 31046, Monroe County Mailing
ALLEGHENY COUNTY HEALTH DEPARTMENT AIR QUALITY PROGRAM
 ALLEGHENY COUNTY HEALTH DEPARTMENT AIR QUALITY PROGRAM April 18, 2014 SUBJECT: Cellco Partnership, dba Verizon Wireless 18 Abele Road Bridgeville, PA 15017 Allegheny County Operating Permit No. 0867 TO:
1996, or for which modification is commenced on or before March 16, 1998, shall not exceed the
 15A NCAC 02D.1206 HOSPITAL, MEDICAL, AND INFECTIOUS WASTE INCINERATORS (a) Applicability. This Rule applies to any hospital, medical, and infectious waste incinerator (HMIWI), except: (1) any HMIWI required
ENGINEERING CALCULATION SHEET AIR RESOURCES DIVISION
 SIC Code: 4911 (Energy Production) DATE: 06/17/2005 Page 1 of 6 DATE APPLICATION RECEIVED: March 31, 2004 (Application # FY04-0427) FACILITY DESCRIPTION Pinetree-Bethlehem (the Permittee) operates a 17.1
RULE 4306 BOILERS, STEAM GENERATORS, AND PROCESS HEATERS PHASE 3 (Adopted September 18, 2003; Amended March 17, 2005; Amended October 16, 2008)
") RULE 4306 BOILERS, STEAM GENERATORS, AND PROCESS HEATERS PHASE 3 (Adopted September 18, 2003; Amended March 17, 2005; Amended October 16, 2008) 1.0 Purpose The purpose of this rule is to limit emissions
RULE 4306 BOILERS, STEAM GENERATORS, AND PROCESS HEATERS PHASE 3 (Adopted September 18, 2003; Amended March 17, 2005; Amended October 16, 2008) 1.0 Purpose The purpose of this rule is to limit emissions
RULE STATIONARY GAS TURBINES Adopted (Amended , ) INDEX
 INDEX") RULE 413 - STATIONARY GAS TURBINES Adopted 04-06-95 (Amended 05-01-97, 03-24-05) INDEX 100 GENERAL 101 PURPOSE 102 APPLICABILITY 110 EXEMPTION - EMERGENCY STANDBY UNITS 111 EXEMPTION - REMOVAL FROM SERVICE
RULE 413 - STATIONARY GAS TURBINES Adopted 04-06-95 (Amended 05-01-97, 03-24-05) INDEX 100 GENERAL 101 PURPOSE 102 APPLICABILITY 110 EXEMPTION - EMERGENCY STANDBY UNITS 111 EXEMPTION - REMOVAL FROM SERVICE
AIR QUALITY PERMIT. 7 Foundation Drive Savannah, Georgia (Chatham County)
") AIR QUALITY PERMIT Permit No. Effective Date April 11, 2016 In accordance with the provisions of the Georgia Air Quality Act, O.C.G.A. Section 12-9-1, et seq and the Rules, Chapter 391-3-1, adopted pursuant
AIR QUALITY PERMIT Permit No. Effective Date April 11, 2016 In accordance with the provisions of the Georgia Air Quality Act, O.C.G.A. Section 12-9-1, et seq and the Rules, Chapter 391-3-1, adopted pursuant
Public Service Company of Colorado THE SOURCE TO WHICH THIS PERMIT APPLIES IS DESCRIBED AND LOCATED AS FOLLOWS:
 COLORADO DEPARTMENT OF PUBLIC HEALTH AND ENVIRONMENT AIR POLLUTION CONTROL DIVISION TELEPHONE: (303) 692-3150 CONSTRUCTION PERMIT PERMIT NO: 04PB1019 DATE ISSUED: JULY 5, 2005 INITIAL APPROVAL ISSUED TO:
STATEMENT OF BASIS. Cherokee Nitrogen LLC Cherokee, Alabama Colbert County Facility Number
 STATEMENT OF BASIS Cherokee Nitrogen LLC Cherokee, Alabama Colbert County Facility Number 701-0013 Introduction On June 30, 2017, the Department received an application to renew the Title V Major Source
Air Individual Permit Permit Limits to Avoid NSR
 Air Individual Permit Permit Limits to Avoid NSR 13900128-001 Permittee: Facility name: Shakopee Distributed Generation Shakopee Distributed Generation Vierling Drive E Shakopee, Minnesota 55379 Scott
3. GENERAL CONDITIONS
 2 3. GENERAL CONDITIONS a) This Plan Approval authorizes the construction of a 272 net megawatt waste coal-fired, circulating fluidized bed boiler by Robinson Power Company (RPC), P. O. Box 127, Burgettstown,
AIR EMISSION PERMIT NO IS ISSUED TO. Cogentrix
 AIR EMISSION PERMIT NO. 16300087-004 IS ISSUED TO Cogentrix 9525 105th Street Court South Cottage Grove, Washington County, MN 55016 The emission units, control equipment and emission stacks at the stationary
WORKSHOP REPORT. No, the RICE NESHAP applies only to stationary engines as defined in 40 CFR
 AIR POLLUTION CONTROL DISTRICT COUNTY OF SAN DIEGO FEDERAL SUBPART ZZZZ NATIONAL EMISSIONS STANDARDS FOR HAZARDOUS AIR POLLUTANTS FOR STATIONARY RECIPROCATING INTERNAL COMBUSTION ENGINES WORKSHOP REPORT
AIR EMISSION PERMIT NO IS ISSUED TO. Northern Natural Gas Company
 AIR EMISSION PERMIT NO. 16300110-001 IS ISSUED TO Northern Natural Gas Company NORTHERN NATURAL GAS - HUGO No Street Address Hugo, Washington County, Minnesota 55038 The emission units and emission stacks
Regulatory and Permitting Requirements of Stationary Generators In Delaware
 Regulatory and Permitting Requirements of Stationary Generators In Delaware Delaware - DNREC Air Quality Management February 7, 2006 Mark A. Prettyman and Guadalupe J. Reynolds Outline Regulation No. 1144
SAN JOAQUIN VALLEY AIR POLLUTION CONTROL DISTRICT
 SAN JOAQUIN VALLEY AIR POLLUTION CONTROL DISTRICT DATE: 3/1/10, updated 5/5/10 TO: Interested Parties SUBJECT: Frequently asked questions regarding compliance with Rule 4320, Advanced Emission Reduction
General Plan Approval and General Operating Permit BAQ-GPA/GP-5 and Proposed Exemption 38. Citizens Advisory Council Meeting March 19, 2013
 General Plan Approval and General Operating Permit BAQ-GPA/GP-5 and Proposed Exemption 38 Citizens Advisory Council Meeting March 19, 2013 Headings : White Text 40 pt. Calibri GP-5 General Information
AIR QUALITY PERMIT P 01 0 May 14, 2007
 AIR QUALITY PERMIT Permit No. Effective Date 4911 099 0033 P 01 0 May 14, 2007 In accordance with the provisions of the Georgia Air Quality Act, O.C.G.A. Section 12 9 1, et seq and the Rules, Chapter 391
Major/Area Source. Speaker: Eric Swisher. 23rd Virginia Environmental Symposium April 11, Your environmental compliance is clearly our business.
 Major/Area Source Boiler MACT Rule Speaker: Eric Swisher 23rd Virginia Environmental Symposium April 11, 2012 Your environmental compliance is clearly our business. Overview Ground Rules Regulatory Framework
This is a new permit condition titled, "2D.1111 Subpart ZZZZ, Part 63 (Existing Non-Emergency nonblack start CI > 500 brake HP)"
") This is a new permit condition titled, "2D.1111 Subpart ZZZZ, Part 63 (Existing Non-Emergency nonblack start CI > 500 brake HP)" Note to Permit Writer: This condition is for existing engines (commenced
This is a new permit condition titled, "2D.1111 Subpart ZZZZ, Part 63 (Existing Non-Emergency nonblack start CI > 500 brake HP)" Note to Permit Writer: This condition is for existing engines (commenced
ARTICLE AIR POLLUTION CONTROL REGULATIONS AND PROCEDURES
 TABLE OF CONTENTS ARTICLE 2.0000 AIR POLLUTION CONTROL REGULATIONS AND PROCEDURES Section 2.1400 Nitrogen Oxides 2.1401 Definitions... 214-01 2.1402 Applicability... 214-04 2.1403 Compliance Schedules...
NARRATIVE. Dika Kuoh Steve Allison DATE: August 5, 2015
 Georgia Department of Natural Resources Environmental Protection Division Air Protection Branch 4244 International Parkway Suite 120 Atlanta Georgia 30354 404/363-7000 Fax: 404/363-7100 Judson H. Turner,
SECTION.1400 NITROGEN OXIDES
 SECTION.1400 NITROGEN OXIDES 15A NCAC 02D.1401 DEFINITIONS (a) For the purpose of this Section, the definitions at G.S 143-212 and G.S. 143-213, and 15A NCAC 02D.0101 shall apply, and in addition the following
Facility Name: Georgia-Pacific Consumer Products LP Savannah River Mill City: Rincon County: Effingham AIRS #: Application #: 40890
 Facility Name: Georgia-Pacific Consumer Products LP Savannah River Mill City: Rincon County: Effingham AIRS #: 04-13-103-00007 Application #: 40890 Date SIP Application Received: March 7, 2016 Date Title
MARAMA 2015 SCIENCE MEETING JULY 29-30, 2015 RICHMOND, VIRGINIA
 Air Permitting of Sources at Natural gas Production, Compression and Processing Facilities MARAMA 2015 SCIENCE MEETING JULY 29-30, 2015 RICHMOND, VIRGINIA Tom Wolf, Governor John Quigley, Secretary Overview
AIR EMISSION PERMIT NO IS ISSUED TO. Rochester Public Utilities for Two Standby/Peaking Diesel-Fired Generator Sets
 AIR EMISSION PERMIT NO. 10901019-002 IS ISSUED TO Rochester Public Utilities for Two Standby/Peaking Diesel-Fired Generator Sets Rochester Public Utilities 3605 Highway 52 North Rochester, Olmsted County,
Permit Holder. Permitted Equipment
 Air Quality Registration Stationary Spark Ignition Internal Combustion Engine (Less than 400 Brake Horsepower) Permit No. Project No. Description Date Testing No Plant Number: Under the Direction of the
AIR QUALITY PERMIT. Longleaf Energy Associates, LLC C/o LS Power Development, LLC Two Tower Center, 11 th Floor East Brunswick, New Jersey 08816
 AIR QUALITY PERMIT Permit No. Effective Date In accordance with the provisions of the Georgia Air Quality Act, O.C.G.A. Section 12-9-1, et seq and the Rules, Chapter 391-3-1, adopted pursuant to or in
Facility Name: Packaging Corporation of America City: Clyattville County: Lowndes County AIRS #: Application #: 22133
 Facility Name: Packaging Corporation of America City: Clyattville County: Lowndes County AIRS #: 04-13-185-00001 Application #: 22133 Date SIP Application Received: September 16, 2013 Date Title V Application
Full Compliance Evaluation Report Off-Site Report
 STATE OF NEW HAMPSHIRE DEPARTMENT OF ENVIRONMENTAL SERVICES AIR RESOURCES DIVISION Full Compliance Evaluation Report Off-Site Report CONCORD STEAM CORPORATION 105 ½ PLEASANT STREET CONCORD, NH 03302-1377
STATE IMPLEMENTATION PLAN CREDIT FOR EMISSION REDUCTIONS GENERATED THROUGH INCENTIVE PROGRAMS (Adopted June 20, 2013)
") RULE 9610 STATE IMPLEMENTATION PLAN CREDIT FOR EMISSION REDUCTIONS GENERATED THROUGH INCENTIVE PROGRAMS (Adopted June 20, 2013) 1.0 Purpose The purpose of this rule is to provide an administrative mechanism
RULE 9610 STATE IMPLEMENTATION PLAN CREDIT FOR EMISSION REDUCTIONS GENERATED THROUGH INCENTIVE PROGRAMS (Adopted June 20, 2013) 1.0 Purpose The purpose of this rule is to provide an administrative mechanism
PERMIT TO INSTALL. Table of Contents
 Permit No. 118-18 Page 1 of 23 PERMIT TO INSTALL Table of Contents COMMON ACRONYMS... 2 POLLUTANT / MEASUREMENT ABBREVIATIONS... 3 GENERAL CONDITIONS... 4 EMISSION UNIT SPECIAL CONDITIONS... 6 EMISSION
STATEMENT OF BASIS Boise Cascade Wood Products, LLC Thorsby Engineered Wood Products Thorsby, Chilton County, Alabama Facility/Permit No.
 STATEMENT OF BASIS Boise Cascade Wood Products, LLC Thorsby Engineered Wood Products Thorsby, Chilton County, Alabama Facility/Permit No. 403-S006 This draft Title V Major Source Operating Permit (MSOP)
6/1/2011. NSPS and MACT Standards for Combustion Sources at Utility Authorities What happens when a permit has both federal and state regulations?
 Presented by Richard M. Cestone, PE, CHMM Birdsall Services Group For NJEWA Conference May 9, 2011 What happens when a permit has both federal and state regulations? 1 Facilities get confused with Federal
PA RACT 2. Reasonably Available Control Technology. Presented by Suzanne Dibert
 PA RACT 2 Reasonably Available Control Technology Presented by Suzanne Dibert Affected Facilities Facilities with potential emissions that exceed 100 tons per year (tpy) for NOx (nitrogen oxide) and 50
AIR QUALITY PERMIT. Kennesaw State University - Marietta Campus
 AIR QUALITY PERMIT Permit No. Effective Date February 11, 2016 In accordance with the provisions of the Georgia Air Quality Act, O.C.G.A. Section 12-9-1, et seq and the Rules, Chapter 391-3-1, adopted
DRAFT/PROPOSED. AIR EMISSION PERMIT NO Major Amendment IS ISSUED TO. Hoffman Enclosures, Inc.
 DRAFT/PROPOSED AIR EMISSION PERMIT NO. 00300155 002 Major Amendment IS ISSUED TO Hoffman Enclosures, Inc. Hoffman Enclosure Inc/Pentair Equipment Protection 2100 Hoffman Way Anoka, Anoka County, MN 55303
AIR QUALITY PERMIT. Permit No S Effective Date May 26, 2015
 AIR QUALITY PERMIT Permit No. Effective Date May 26, 2015 In accordance with the provisions of the Georgia Air Quality Act, O.C.G.A. Section 12-9-1, et seq and the Rules, Chapter 391-3-1, adopted pursuant
Part 70 Operating Permit Amendment
 Part 70 Operating Permit Amendment Permit Amendment No.: 2436-211-0013-V-03-1 Effective Date: July 25, 2014 Facility Name: Facility Address: Mailing Address: Parent/Holding Company: Georgia-Pacific Wood
RICE NESHAP Frequently Asked Questions (FAQ)
") RICE NESHAP Frequently Asked Questions (FAQ) What does RICE NESHAP mean? RICE NESHAP is an acronym for Reciprocating Internal Combustion Engines National Emission Standards for Hazardous Air Pollutants.
RICE NESHAP Frequently Asked Questions (FAQ) What does RICE NESHAP mean? RICE NESHAP is an acronym for Reciprocating Internal Combustion Engines National Emission Standards for Hazardous Air Pollutants.
Engineering Summary New NGC, Inc.
 1 Engineering Summary New NGC, Inc. Application #: FY04-0335 AFS #: 3301500045 County: Rockingham Engineer: Laughton Date: March 2004 Permitting Background/History New NGC, Inc. (NGC), formerly known as
Tune-up Information. Owners and operators of all biomass-fired and oil-fired area source boilers.
 Tune-up Information National Emission Standards for Hazardous Air Pollutants for Area Sources: Industrial, Commercial, and Institutional Boilers 40 CFR Part 63 Subpart JJJJJJ Who must conduct a tune-up
State of New Jersey. Department of Environmental Protection Division of Air Quality
 GOP-006 State of New Jersey Department of Environmental Protection Division of Air Quality General Operating Permit (GOP-006) Combined Heat and Power Stationary Spark Ignition Reciprocating Engine(s) less
MICHIGAN DEPARTMENT OF ENVIRONMENTAL QUALITY AIR QUALITY DIVISION. May 1, 2015 PERMIT TO INSTALL 4-13B. ISSUED TO Zoetis LLC
 MICHIGAN DEPARTMENT OF ENVIRONMENTAL QUALITY AIR QUALITY DIVISION May 1, 2015 PERMIT TO INSTALL 4-13B ISSUED TO Zoetis LLC LOCATED AT 306 Pitcher Street Kalamazoo, Michigan IN THE COUNTY OF Kalamazoo STATE
Prepared for: BP-Husky Refining LLC 4001 Cedar Point Road Oregon, Ohio Prepared by:
 BP-HUSKY REFINING LLC REVISION TO FCCU WET GAS COMPRESSOR RECONSTRUCTION PERMIT TO INSTALL (04-01482) TO INCORPORATE FINAL FCCU NO X EMISSIONS LIMITS Prepared for: BP-Husky Refining LLC 4001 Cedar Point
AIR EMISSION PERMIT NO Total Facility Oper. Permit - Reissuance IS ISSUED TO. LSPCottage Grove, L.P.
 AIR EMISSION PERMIT NO. 16300087-006 Total Facility Oper. Permit - Reissuance IS ISSUED TO LSPCottage Grove, L.P. LSPCOTTAGE GROVE COGENERATION FACILITY 9525 105th Street Court South Cottage Grove, Washington
California s Success in Controlling Large Industrial Sources
 California s Success in Controlling Large Industrial Sources Endicott House 2006 Symposium Mike Scheible Deputy Executive Officer California Air Resources Board California Environmental Protection Agency
STATEMENT OF BASIS. University of Arkansas for Medical Sciences (UAMS) 4301 West Markham St. Little Rock, Arkansas 72205
 4301 West Markham St. Little Rock, Arkansas 72205") STATEMENT OF BASIS For the issuance of Draft Air Permit # 2125-AOP-R3 1. PERMITTING AUTHORITY: Arkansas Department of Environmental Quality 5301 Northshore Drive North Little Rock, Arkansas 72118-5317
STATEMENT OF BASIS For the issuance of Draft Air Permit # 2125-AOP-R3 1. PERMITTING AUTHORITY: Arkansas Department of Environmental Quality 5301 Northshore Drive North Little Rock, Arkansas 72118-5317
ICAPCD RULE APPENDIX C
 There is not a federal policy that establishes maximum cost effectiveness values for NOx RACT. The San Joaquin Valley APCD uses a BARCT threshold of $9,700.00 (California Air Resources Board (CARB), Report
ALLEGHENY COUNTY HEALTH DEPARTMENT AIR QUALITY PROGRAM
 ALLEGHENY COUNTY HEALTH DEPARTMENT AIR QUALITY PROGRAM August 26, 2014 SUBJECT: Veterans Affairs Medical Center Oakland Facility University Drive C Pittsburgh, PA 15240 Allegheny County Synthetic Minor
Regulation No. 3 Changes For Internal Combustion Engines. Christine Hoefler November 14, 2012
 Regulation No. 3 Changes For Internal Combustion Engines Christine Hoefler November 14, 2012 Overview Changes to Regulation No. 3 New Source Performance Standard (NSPS) IIII Conflicts with NSPS IIII 2
TECHNICAL SUPPORT DOCUMENT. Nevada Power Company, dba NV Energy. Walter M. Higgins III Generating Station
 TECHNICAL SUPPORT DOCUMENT TECHNICAL INFORMATION PRESENTED IN REVIEW OF AN APPLICATION FOR A PART 70 OP APPLICATION SUBMITTED BY Nevada Power Company, dba NV Energy For Generating Station Part 70 OP Number:
Appendix K. Final DOC Conditions
 Appendix K Final DOC Conditions Puente Power Project 262 MW (net nominal) GE 7HA.01 Combustion Turbine Generator (CTG) The CTG is simultaneously subject to the emission limits, monitoring requirements,
NATURAL GAS TRANSMISSION
 NATURAL GAS TRANSMISSION and PROCESSING APPLICATIONS GUIDANCE This guidance is intended to help applicants prepare applications and certifications with a reduced amount of effort, yielding clearer and
RULE NOX REDUCTIONS FROM MISCELLANEOUS SOURCES (Adopted 12/13/2016)
") VENTURA COUNTY AIR POLLUTION CONTROL DISTRICT RULE 74.34 NOX REDUCTIONS FROM MISCELLANEOUS SOURCES (Adopted 12/13/2016) A. Purpose and Applicability The purpose of this rule is to reduce emissions of oxides
VENTURA COUNTY AIR POLLUTION CONTROL DISTRICT RULE 74.34 NOX REDUCTIONS FROM MISCELLANEOUS SOURCES (Adopted 12/13/2016) A. Purpose and Applicability The purpose of this rule is to reduce emissions of oxides
MICHIGAN DEPARTMENT OF ENVIRONMENTAL QUALITY AIR QUALITY DIVISION. September 28, 2005 PERMIT TO INSTALL
 MICHIGAN DEPARTMENT OF ENVIRONMENTAL QUALITY AIR QUALITY DIVISION September 28, 2005 PERMIT TO INSTALL 187-05 ISSUED TO Zeeland Board of Public Works LOCATED AT 8943 Riley Street Zeeland, Michigan IN THE
OUTOKUMPU STAINLESS USA, LLC CALVERT, AL FACILITY NO.: MAJOR SOURCE OPERATING PERMIT INITIAL TITLE V DRAFT
 CALVERT, AL FACILITY NO.: 503-0106 MAJOR SOURCE OPERATING PERMIT INITIAL TITLE V DRAFT (THIS PAGE LEFT BLANK INTENTIONALLY) Table of Contents PROCESS DESCRIPTION... 2 MELT SHOP... 4 STATE REGULATIONS...
AIR EMISSION PERMIT NO Total Facility Operating Permit - Reissuance IS ISSUED TO. Mayo Foundation
 AIR EMISSION PERMIT NO. 10900008-004 Total Facility Operating Permit - Reissuance IS ISSUED TO Mayo Foundation St Marys 1216 Southwest 2nd Street Rochester, Olmsted County, MN 55902 The emission units,
Appendix K. DOC Conditions
 Appendix K DOC Conditions Mission Rock Energy Center Five (5) GE LM6000-PG-Sprint Combustion Turbine Generators (CTGs) Total = 275 MW Nominal Each CTG is simultaneously subject to the emission limits,
FINAL PERMIT APPLICATION REVIEW SUMMARY
 FINAL PERMIT APPLICATION REVIEW SUMMARY New Hampshire Department of Environmental Services Air Resources Division P.O. Box 95, 29 Hazen Drive Concord, NH 03302-0095 Phone: 603-271-1370 Fax: 603-271-7053
9/17/2013 OVERVIEW WHAT RICE UNITS ARE IMPACTED? WHAT IS A RICE UNIT? EXAMPLES OF RICE UNITS WHY IS THE EPA REGULATING RICE?
 OVERVIEW Compliance Webinar Reciprocating Internal Combustion Engines RICE September 16, 2013 Jesse Zahn, CHMM Jesse.zahn@hrpassociates.com HRP Associates, Inc. Clifton Park, NY 12065 What is RICE Unit
State of New Jersey Department of Environmental Protection Division of Air Quality. General Operating Permit (GOP-007) Boiler or Heater
 Boiler or Heater") 11/21/2016 State of New Jersey Department of Environmental Protection Division of Air Quality General Operating Permit (GOP-007) Boiler or Heater Greater than or equal to 1 MMBTU/hr and less than 5 MMBTU/hr
11/21/2016 State of New Jersey Department of Environmental Protection Division of Air Quality General Operating Permit (GOP-007) Boiler or Heater Greater than or equal to 1 MMBTU/hr and less than 5 MMBTU/hr
RICE NESHAP ZZZZ (>500 hp Non-Emergency CI Engines) Altorfer Meeting June 15, 2010
 Altorfer Meeting June 15, 2010") RICE NESHAP ZZZZ (>500 hp Non-Emergency CI Engines) Altorfer Meeting June 15, 2010 Discussion Topics Background Important Terms Applicability Compliance Deadlines Emission/Operating Limits Performance/Compliance
RICE NESHAP ZZZZ (>500 hp Non-Emergency CI Engines) Altorfer Meeting June 15, 2010 Discussion Topics Background Important Terms Applicability Compliance Deadlines Emission/Operating Limits Performance/Compliance
AIR EMISSION PERMIT NO IS ISSUED TO NORTHERN STATES POWER COMPANY
 AIR EMISSION PERMIT NO. 12300012-002 IS ISSUED TO NORTHERN STATES POWER COMPANY NSP - HIGH BRIDGE GENE 501 Shepard Road St. Paul, Ramsey County, Minnesota 551023004 The emission units, control equipment
COST EFFECTIVENESS EVALUATION. A. Selective Catalytic Reduction System
 was installed with a Selective Catalytic Reduction (SCR) and is able to comply with a NOx emission limit of 9 ppmv when operating with natural gas and 13 ppmv when operating under diesel fuel. In addition,
MAJOR SOURCE OPERATING PERMIT
 MAJOR SOURCE OPERATING PERMIT Permitee: Facility Name: Facility No.: Location: INTERNATIONAL PAPER CO. INTERNATIONAL PAPER RIVERDALE MILL 104-0003 SELMA, ALABAMA In accordance with and subject to the provisions
State of New Jersey. Department of Environmental Protection Air Quality Permitting
 GP021 State of New Jersey Department of Environmental Protection Air Quality Permitting General Permit (GP 021) Combined Heat and Power Combustion Turbine(s) less than or equal to 65 MMBTU per hour This
RULE 412 STATIONARY INTERNAL COMBUSTION ENGINES LOCATED AT MAJOR STATIONARY SOURCES OF NO X Adopted INDEX
 RULE 412 STATIONARY INTERNAL COMBUSTION ENGINES LOCATED AT MAJOR STATIONARY SOURCES OF NO X Adopted 06-01-95 INDEX 100 GENERAL 101 PURPOSE 102 APPLICABILITY 110 EXEMPTION, EMERGENCY STANDBY 111 EXEMPTION,
DRAFT/PROPOSED. AIR EMISSION PERMIT NO Total Facility Operating Permit Reissuance IS ISSUED TO. Hutchinson Utilities Commission
 DRAFT/PROPOSED AIR EMISSION PERMIT NO. 08500034 002 Total Facility Operating Permit Reissuance IS ISSUED TO Hutchinson Utilities Commission Hutchinson Utilities Commission Plant 2 1100 Industrial Boulevard
RULE EMISSIONS OF OXIDES OF NITROGEN FROM SMALL INDUSTRIAL, INSTITUTIONAL, AND COMMERCIAL BOILERS, STEAM GENERATORS, AND PROCESS HEATERS
 RULE 1146.1. EMISSIONS OF OXIDES OF NITROGEN FROM SMALL INDUSTRIAL, INSTITUTIONAL, AND COMMERCIAL BOILERS, STEAM GENERATORS, AND PROCESS HEATERS (a) Definitions 1. ANNUAL HEAT INPUT means the actual amount
Regulatory Impacts of Biogas-fired Internal Combustion Engines
 Regulatory Impacts of Biogas-fired Internal Combustion Engines Kit Liang, PE, Malcolm Pirnie Air, Water & Energy: Sustainability for Wastewater Treatment Plants California Water Environment Association
The subject renewal application was received on February 28, 2017 and was determined to be administratively complete on March 9, 2017.
 COMMONWEAL TH OF PENNSYLVANIA Department of Environmental Protection December 7, 2017 814/332-6940 Fax: 814/332-6117 SUBJECT: TO: FROM: THROUGH: Review of Application for Renewal Title V Permit AUTH ID
AIR EMISSION PERMIT NO IS ISSUED TO. St Cloud State University 720 South Fourth Avenue St Cloud, Stearns County, Minnesota 56301
 AIR EMISSION PERMIT NO. 14500026-001 IS ISSUED TO St Cloud State University 720 South Fourth Avenue St Cloud, Stearns County, Minnesota 56301 The emission units, control equipment and emission stacks at
AUTHORITY TO CONSTRUCT
 AUTHORITY TO CONSTRUCT PERMIT NO: S-7658-1-0 ISSUANCE DATE: 10/30/2009 LEGAL OWNER OR OPERATOR: ABEC BIDART-STOCKDALE LLC MAILING ADDRESS: C/O CALIFORNIA BIOENERGY LLC 2828 ROUTH STREET SUITE 500 DALLAS,
STATEMENT OF BASIS. NAICS Description: Motor and Generator Manufacturing NAICS Code:
 STATEMENT OF BASIS For the issuance of Draft Air Permit # 0996-AOP-R24 1. PERMITTING AUTHORITY: Arkansas Department of Environmental Quality 5301 Northshore Drive North Little Rock, Arkansas 72118-5317
AUTHORITY TO CONSTRUCT
 AUTHORITY TO CONSTRUCT PERMIT NO: N-6311-9-1 ISSUANCE DATE: 12/17/2008 LEGAL OWNER OR OPERATOR: FISCALINI FARMS & FISCALINI DAIRY MAILING ADDRESS: 7231 COVERT RD MODESTO, CA 95358 LOCATION: 4848 JACKSON
Permit Holder. Permitted Equipment
 Air Quality Registration Stationary Compression Ignition Internal Combustion Engine (Less than 400 Brake Horsepower) Permit No. Project No. Description Date Testing No Plant Number: Under the Direction
DRAFT/PROPOSED. AIR EMISSION PERMIT NO Total Facility Operating Permit Reissuance IS ISSUED TO. ALLETE Inc dba Minnesota Power Inc
 DRAFT/PROPOSED AIR EMISSION PERMIT NO. 13700013 007 Total Facility Operating Permit Reissuance IS ISSUED TO ALLETE Inc dba Minnesota Power Inc Minnesota Power Laskin Energy Center 5699 Colby Lake Road
DEP7007CC Compliance Certification
 Commonwealth of Kentucky Natural Resources & Environmental Protection Cabinet Department for Environmental Protection DIVISION FOR AIR QUALITY DEP7007CC Compliance Certification Division Use Only ID# Permit
AIR EMISSION PERMIT NO IS ISSUED TO INTERSTATE POWER COMPANY
 AIR EMISSION PERMIT NO. 09100007-002 IS ISSUED TO INTERSTATE POWER COMPANY INTERSTATE POWER - FOX LAKE STATION County Road 28 Sherburn, Martin County, Minnesota 561710367 The emission units, control equipment
TECHNICAL SUPPORT DOCUMENT For DRAFT AIR EMISSION PERMIT NO
 TECHNICAL SUPPORT DOCUMENT For DRAFT AIR EMISSION PERMIT NO. 14500029 003 This technical support document (TSD) is intended for all parties interested in the draft permit and to meet the requirements that
Proposed Rule Amendment
 Department of Environmental Protection Promulgation of Amendments to Chapter 2 of Title 15 of the Rules of the City of New York Rules Governing the Emissions from the Use of #4 and #6 Fuel Oil in Heat
AIR EMISSION PERMIT NO IS ISSUED TO. Minnesota Power Division of ALLETE, Inc.
 AIR EMISSION PERMIT NO. 13700013-005 IS ISSUED TO Minnesota Power Division of ALLETE, Inc. MINNESOTA POWER - LASKIN ENERGY CENTER County Road 633 Aurora, St. Louis County, MN 55705 The emission units,
AIR PERMITTING REQUIREMENTS FOR ON-SITE STATIONARY POWER GENERATING ENGINES
 AIR PERMITTING REQUIREMENTS FOR ON-SITE STATIONARY POWER GENERATING ENGINES MAY 15, 2012 FOR MORE INFORMATION CONTACT NEGIB HARFOUCHE, PH.D. NJDEP DIVISION OF AIR QUALITY (609) 292-2137 nharfouc@dep.state.nj.us
ALLEGHENY COUNTY HEALTH DEPARTMENT AIR QUALITY PROGRAM
 ALLEGHENY COUNTY HEALTH DEPARTMENT AIR QUALITY PROGRAM December 2, 2016 SUBJECT: Bay Valley Foods, LLC 1080 River Avenue Pittsburgh, PA 15212-5995 Allegheny County Title V Operating Permit No. 0079 (renewal)