Iowa State University Extension
|
|
|
- Lynn McCoy
- 6 years ago
- Views:
Transcription

1 Iowa State University Extension Dr. Robert Wisner, University Professor & Retired Extension Economist Dr. Robert Wisner: Grain Outlook Grain Outlook and Marketing Considerations 3/15/06 1/09/08
2
3 Price Outlook, Grain, 1/04/08 Potential for irregular uptrend in corn & bean prices into mid-february Markets very volatile as South American growing season & Northern Hemisphere wheat progress Look for Corn & Bean markets to over-react on up-side with battle for 2008 crop acreage Look for stronger corn & bean basis in spring & summer
4 Keys to Grain Markets R. Wisner, ISU Econ. 1. Ethanol profitability --Infrastructure & transportation -- Negative margins ahead -- how long & how bad? 2. Govt. biofuels mandates 3. Strong Export sales foreign weather? 4. World Economy? 5. EU opening up 10% set-aside in Battle for acreage: S. Am., EU, U.S. wheat, SB, Cotton, & Corn
5 Cautions in Grain Markets, R. Wisner, ISU Econ. 1. Fund Traders Repositioning Portfolios -- 1 st. 10 days of January -- More petroleum, gold, less wheat, SB? 2. Better foreign weather for 2008? 3. USDA U.S. Jan. 11 grain reports: prod n, stocks, S. American crops 4. Bio-diesel economics not good & no mandate for Domestic user returns tighten with higher corn prices
6 Marketing considerations: Grain Markets, R. Wisner, ISU Econ. 1. Scale-up marketing using offer contracts (objective: profitable price) 2. You can t go broke taking a profit 3. Basis for both corn & beans likely to strengthen in spring and summer 4. Forward prices show some profit for summer storage 5. Expect markets to over-react on upside, then weaken later 6. Extreme sensitivity to weather
7 Example Mktg. Strategies, 2008 Corn, 1/8/08, Fence: Forward contract: fall 08 = $4.66 (Dec.=$4.96) Buy $4.70 Dec. corn put, sell $6.20 call: Put cost = $0.34/bu. Call sale = $0.14 Net cost = $ brokerage Floor $0.30 harvest basis = $4.20 Maximum local upside $0.30 basis = $ $ $0.20 = $5.70 Risks: Be sure you understand call sales Basis, out-of-money options premiums not precisely following futures market Over-selling crop, potential margin calls
8 Example Mktg. Strategies, 2008 Corn, 1/8/08, Synthetic Put: Forward contract: fall 08 = $4.66 $4.66 forward contract, $5.30 call purchase: Call cost = $0.35/bu. + brokerage Floor price = $4.31 Maximum local upside potential: no limit Risks: Basis, Over-selling crop: Consider harvest-price revenue insurance
9 Example Mktg. Strategies, 2008 Corn, 1/8/08, Put Purchase: Buy Dec. 08 $4.80 Strike price Put cost = $0.39/bu. + brokerage Floor price = $4.10 Maximum local upside potential: no limit Floor $5.00 put = $4.20 ($.50 cost) --Floor $4.50 put = $3.95 ($.25 cost) Risks: Basis, Over-selling crop: Consider harvest-price revenue insurance
10 Risks: 2009 & 2010 Crop Sales Production Costs Some of new-generation contracts not tested in extreme mkt. conditions Weather (Strongly consider harvestprice revenue insurance)

11

12
13
14
15
16
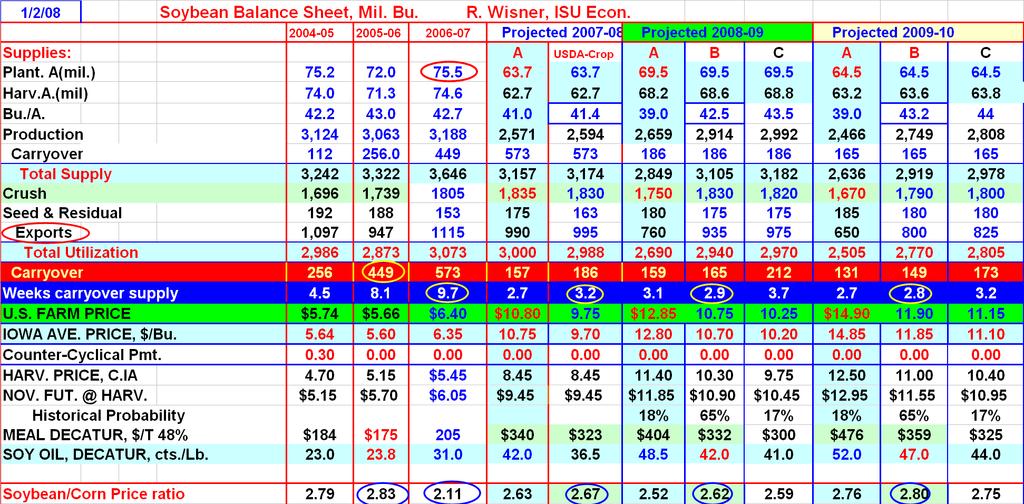
17 Market Overview R. Wisner, ISU Econ. 1. Corn Supplies fully adequate for demand --Slower domestic feed demand -- Slowing ethanol growth -- Sizeable increase in carryover likely in SB supplies tightening -- How tight depends on S. America -- More SB acres needed this spring 3. Without more acres, could be very tight in More corn needed in 2009

18 Lower feed use may temper corn prices.

19 Weekly ethanol futures
20

21 Monthly CRB Index Incentive for Index Fund Traders to buy Commodities for inflation hedge

22 Week U.S. Dollar Index: Reduces grain prices in world markets

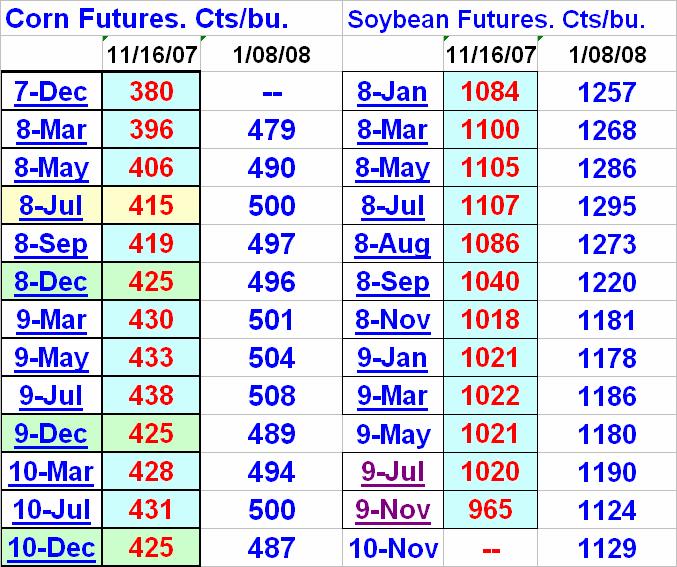
23 Dec. 08 Corn Futures 1/03/08 Possible Objectives: $5.00, $5.18, $5.36, $5.50?

24 Objectives: $12.90-$13.45? Nov. 08 SB Futures Prices, 1/08/08
25
26 41 countries encourage biofuels Major Countries with Ethanol Fuels U.S. Brazil Canada China EU-27 Thailand Countries considering ethanol fuels South Africa Ukraine Japan, others
27 Major Countries with Ethanol Fuels U.S. likely production of 15 bil. gal. from corn in 4.5 to 5.5 years Brazil current 5.34 bil gal. 89 new ethanol plants to be built, (51 under construction) 2% biodiesel mandate by 2008 & 5% by 2013 China 3 corn-based plants, emphasis shifting to other feedstocks (9 mil. T. maize for ethanol)
28 Major Countries with Ethanol Fuels, cont. EU % of motor fuel to be renewable by 2010, 10% in 2020 Canada 5% ethanol mandate by 2010, 2% biodiesel by 2012 Thailand ethanol from sugar, casava Biodiesel Competition for crop land

29 Infrastructure lags

30 USDA 07-08
31 International Impacts U.S. ethanol plants under construction to use 55 mil. tons of corn (doubling use) 3.5 times the volume of Japan imports of U.S. corn 123% of 2006 EU corn crop 66% of global corn exports Other countries are expanding ethanol & biodiesel Strong negative impacts on animal ag. Higher food costs ahead Major risk-management challenges in Ag. & bioenergy
32 (Growth = 147% of U.S. soybean oil exports) (Food demand for vegetable oil highly inelastic) EU Use of Rapeseed Oil 10 Million Metric Tons Year Crop Harvested Food Other Biofuel Source: FAPRI estimates Pulls land away from food uses

33 Figure 3. Total 11,693 mil. Bu.
34 Price Demand Curve for Ethanol Renewable Fuel Standards/Oxygenation But at expense of: Octane Enhancement Motor Fuel Use 73-75% of E-85 Source: Dr. Matthew Roberts, Ohio State University Quantity 34
35 U.S. corn supplies adequate to meet demand Crop up 25%, 20% increase in corn acres But at expense of: 16% decline in soybean planted area 29% decline in cotton area 8% decline in non-durum spring wheat Declines in other minor crops Soybean supplies to tighten substantially, increased plantings needed in 2008 Cotton more needed in 2008 More U.S. corn likely will be needed in 2009

36
37 Changes in Ethanol Plants, 7/27 to 11/06/07 (From DTN) Expansion hasn t stopped 7/27/07 11/6/07 1/8/08 U.S. Operating Plants U.S. Plants Under Const Planned plants Total
38
39 10/02/07 U.S. Corn Feed & Residual Use Weeks

40
41 Lyon Sioux Plymouth Osceola O Brien Cherokee Dickenson Clay BuenaVista Kosuth Potential Planned + Iowa current Plants in Iowa 11 Just across the IA borders Borders Woodbury Ida Sac Webster Hamilton BlackHawk Buchana Delawa Dubuque Calhoun Hardin Grundy n re Tama Linn Story Benton n Jones Jackson Monona Crawford r Carroll Greene Boone Marshal l Clinton n Audubon Poweshiek Cedar Harrison Shelby Guthrie Dalla Polk Jasper Iowa Johnson Scott s Mucatine Pottawattamie Adair Madis Warren Washington Cass Marion Mahask Keokuk on a Louisa Figure 1. Mills Fremont Montgomery Page Emmet Palo Alto Pocahontas Winnebago Worth Mitchell HowardWinnesh iek Allamakee Hancoc Floyd CerroGordo k Wright Franklin Appanoose Chickasaw Bremer Fayette Iowa Iowa Corn corn Corn Processing processing Processing & Ethanol & ethanol Plants, plants, Current Locations, current & Actual Planned, & planned, & Planned. 7/25/07, 10/26/06 11/20/06 9/26/06 Butler Adams Union Clarke Lucas Monroe Taylor Figure 2. Humbol dt Ringgold Decatur Wayne Wapello Davis Capacity: 129% of 2006 crop Capacity: 159% of 2006 Crop Jefferson Henry VanBuren Clayton Lee Des Moines
42 Basis Impacts from Ethanol Iowa regional price surface shifting Large local variability at point in time Increased variability over time A few key peaks in price surface, more to come Top bidders: processors & feed mills Large response to short crops Biofuels mandates a potential factor
43 August 07 High Points in Iowa Corn Basis Feed Mills & Ethanol Plants +6 to +7 t -10 to -12 Shelby Kossuth Hancock Humboldt Wright Webster Hamilton Union Ringgold Boone Dallas Winnebago Worth Mitchell Howard Decatur Polk Cerro Gordo -20 Franklin Hardin Grundy Dubuque Black Hawk Buchanan Delaware -18 Story Marshall to 5-20 Central Lucas Wayne Jasper Winneshiek Allamakee Floyd Chickasaw Fayette Clayton Bremer Butler Tama Benton Poweshiek Iowa Muscatine Madison Warren Marion Mahaska Keokuk Washington +6 to Clarke to 3 Louisa Monroe Wapello Jefferson Henry Des Moines 9 Appanoose Davis Van Buren Lee Jones Linn E. Central to Johnson Cedar -20 Jackson Clinton Scott
44 Cent. Iowa Basis Examples, Corn 9/28/07 West Central --Boone New Coop, Vincent Verisun, Ft. Dodge Poet Ethnol, Webstr Cty. Hawkeye, Iowa Falls Heartland, Colo Heart of IA, Nevada Heartland, Madrid Range Harv. Delivry July Delvry 3.24 (-.49) 3.65 (-.37) 3.21 (-.52) 3.68 (-.40) 3.27 (-.46) 3.76 (-.32) 3.28 (-.45) 3.78 (-.30) 3.18 (-.55) 3.73 (-.35) 3.20 (-.53) 3.65 (-.43) 3.24 (-.50) 3.71 (-.37) 3.20 (-.53) 3.65 (-.43) $.10 $.13
45 N.C. Iowa Basis Examples, Corn 9/28/07 Garner Kebler Milling Hobartan Global Lakota (ethanol) Algona Emmetsburg - Ethanol Harv. Delivry July Delvry 3.18 (-.55) 3.66 (-.42) 3.41 (-.32) 3.86 (-.22) 3.29 (-.44) 3.80 (-.28) 3.28 (-.45) 3.73 (-.35) 3.20 (-.53) 3.66 (-.42) 3.33 (-.40) 3.78 (-.30) Range.23.20
46 N.W. Iowa Basis Examples, Corn 9/28/07 Rock Rapids elevator Ashton ethanol Siouxland Energy Albert City Alton Terminal Orange City elevator Sheldon Visser Elevtr Sioux Cntr. Egg Center, Sioux Cntr. Farmers Coop. Sanborn Range Implications for farm storage economics? Harv. Delivry July Delvry 3.41 (-.32) 3.77 (-.31) 3.40 (-.33) 3.80 (-.28) 3.51 (-.22) 3.84 (-.24) 3.30 (-.43) 3.78 (-.28) 3.44 (-.29) (-.27) 3.44 (-.29) 3.81 (-.27) 3.44 (-.29) 3.81 (-.27) 3.48 (-.30) N.A (-.27) N.A (-.30) 3.80 (-.28).21.07
47 W.C. & Sw. Iowa Basis Examples, Corn 9/28/07 Coon Rapids ethanol Denison ethanol Creston Elevator Corning ethanol plant Bunge, Council Bluffs Onawa Lamoni Shenandoah eth. plant Range Harv. Delivry July Delvry 3.27 (-.46) 3.74 (-.34) 3.51 (-.22) 3.84 (-.24) 3.30 (-.41) 3.78 (-.28) 3.32 (-.41) 3.85 (-.23) 3.29 (-.44) est (-.33) 3.43 (-.35) N.A (-.53) N.A (-.24) 3.95 (-.13).33.21

48

49
50
51 6,000 5,000 S. America, U.S. & Rest of World Soybean Supplies USDA Proj. 10/12/07 4,000 Mil. Bu. 3,000 2,000 S. America. 1,000 0 U.S. R-O-W

52
53
54
55 MINIMUM SOYOIL PRICE FOR BIODIESEL BREAKEVEN at GIVEN WORLD CRUDE OIL PRICE Add biodiesel PRX_C_US_BA, GTB-06-03, Mar Crude Oil Price, $/bbl $30.00 $35.00 $40.00 $45.00 $50.00 $55.00 $60.00 $65.00 $70.00 Profitability of Biodiesel at given crude oil and soyoil prices, %$/lb Soybean $0.19 ($0.10) $0.02 $0.14 $0.25 $0.37 $0.49 $0.61 $0.73 $0.85 Oil Price $0.20 ($0.18) ($0.06) $0.06 $0.18 $0.30 $0.42 $0.54 $0.66 $0.78 $/lb $0.21 ($0.25) ($0.13) ($0.01) $0.11 $0.23 $0.35 $0.47 $0.58 $0.70 $0.22 ($0.32) ($0.20) ($0.08) $0.04 $0.15 $0.27 $0.39 $0.51 $0.63 $0.23 ($0.39) ($0.28) ($0.16) ($0.04) $0.08 $0.20 $0.32 $0.44 $0.56 $0.24 ($0.47) ($0.35) ($0.23) ($0.11) $0.01 $0.13 $0.25 $0.37 $0.48 $0.25 ($0.54) ($0.42) ($0.30) ($0.18) ($0.06) $0.05 $0.17 $0.29 $0.41 $0.26 ($0.61) ($0.49) ($0.38) ($0.26) ($0.14) ($0.02) $0.10 $0.22 $0.34 $0.27 ($0.69) ($0.57) ($0.45) ($0.33) ($0.21) ($0.09) $0.03 $0.15 $0.27 $0.28 ($0.76) ($0.64) ($0.52) ($0.40) ($0.28) ($0.16) ($0.05) $0.07 $0.19 $0.29 ($0.83) ($0.71) ($0.59) ($0.48) ($0.36) ($0.24) ($0.12) $0.00 $0.12 $0.30 ($0.91) ($0.79) ($0.67) ($0.55) ($0.43) ($0.31) ($0.19) ($0.07) $0.05 $0.31 ($0.98) ($0.86) ($0.74) ($0.62) ($0.50) ($0.38) ($0.26) ($0.15) ($0.03) For Blue Sky Scenario, PRX adopts a crude oil price of $50/bbl and thus a minimum 24 cent/lb soyoil price, to evaluate impact of subsidized biodiesel market.
56

57

58
59 Soybean Basis Lost Cause? Iowa basis -$1.00 to -$1.25 vs. near-by futures this summer CBOT says speculative trading has overwhelmed the delivery mechanism Delivery area: Illinois River to St. Louis (actually larger than corn) Mechanism: shipping certificates Expect basis to be substantially stronger in spring, summer, 2008 but no guarantees SB geographic basis likely to follow corn
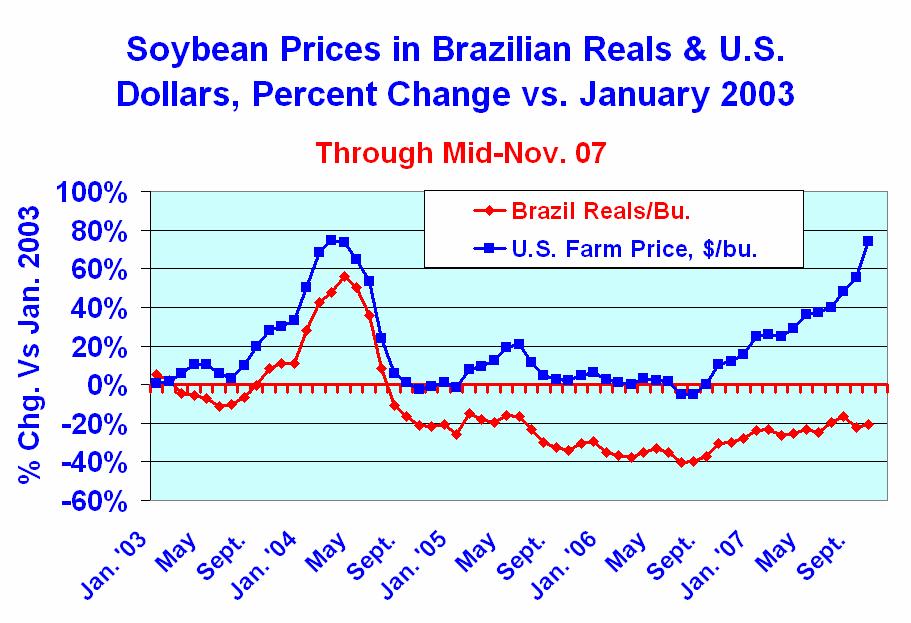
60
61
62
63
64 Direct Cost of Crop Production ($/A) Historical vs Estimate Source: U of IL Extension Economics, July 2007.
65 The Margins $65.88 $10.32 $44.33 $96.23 Margin/acre SOYBEANS CORN $0.20 $0.19 $0.25 $0.53 Margin/Bu Total Cost Land Labor Fixed Cost Variable Cost $ $ $ $ Income Yield bu/a 2008 $8.60/bu 2007 $6.40/bu 2008 $3.35/bu 2007 $3.10bu $1.20
66
67 Pricing alternatives fall 2007 Large storage returns signaled for corn Weak ethanol margins & sharp drop in summer feed use = upside recent corn futures prices Partially offsetting: extreme wheat tightness (short-term), strong export sales, govt. boost in biofuels mandates? Weak U.S. dollar Strong Brazilian Real You can t go broke taking a profit
68 Take-Home Points: Corn & SB Concern about tight corn supply --Slowing feed use weakening ethanol profits Yield changes: Jan. crop estimates? Watch export sales: repeat of 95-96? More soybeans, wheat (cotton?) likely to reduce corn acres in 2008 Acreage battle likely to intensify in 2009 & 2010 Higher govt. biofuels mandate key to ethanol infrastructure capacity
69 Take-Home Points: Corn & SB II Forward contracts & HTAs offer well above-normal profit potential Corn & SB basis likely stronger in spring. Strongest ethanol plants, feed mills Options look expensive, may be better alternative in spring Be prepared for bean market to bring sharp increase in 2008 acres, downward trend in bean prices in fall of 08 Corn prices, late summer 08 to depend on improvements in ethanol infrastructure, Govt. biofuels mandate, weather & blending credit
70 Thanks
71 ...and justice for all The U.S. Department of Agriculture (USDA) prohibits discrimination in all its programs and activities on the basis of race, color, national origin, gender, religion, age, disability, political beliefs, sexual orientation, and marital or family status. (Not all prohibited bases apply to all programs.) Many materials can be made available in alternative formats for ADA clients. To file a complaint of discrimination, write USDA, Office of Civil Rights, Room 326-W, Whitten Building, 14th and Independence Avenue, SW, Washington, DC or call Issued in furtherance of Cooperative Extension work, Acts of May 8 and June 30, 1914, in cooperation with the U.S. Department of Agriculture. Jack M. Payne, director, Cooperative Extension Service, Iowa State University of Science and Technology, Ames, Iowa.
Iowa State University Extension
 Iowa State University Extension Dr. Robert Wisner, University Professor & Extension Economist Dr. Robert Wisner: Grain Outlook Biofuels Update & Outlook 3/15/06 11/27/07 Global Biofuels Developments Dramatic
Summary of Land Capability Class (LCC) for Iowa counties
 for Iowa counties") Summary of Land Capability Class (LCC) for Iowa counties Compiled from ISPAID 7.3 by Brad Oneal, January 2011 Statewide --* 824293 2.29% 1 3365810 9.37% 2E 6920618 19.26% 2S 536398 1.49% 2W 8673296 24.14%
Summary of Land Capability Class (LCC) for Iowa counties Compiled from ISPAID 7.3 by Brad Oneal, January 2011 Statewide --* 824293 2.29% 1 3365810 9.37% 2E 6920618 19.26% 2S 536398 1.49% 2W 8673296 24.14%
Population for whom poverty status is determined One race alone All races White Black or African American American Indian/Alaska Native
 Universe: Population for whom poverty is determined All races White Black or African American American Indian/Alaska Native Asian Area Total Number Percent Total Number Percent Total Number Percent Total
Crude Oil, Biofuels,, and Implications for Corn and Soybean Markets
 Crude Oil, Biofuels,, and Implications for Corn and Soybean Markets By Dr. Robert Wisner, Emeritus University Professor and Biofuels Economist AgMarketing Resource Center Iowa State University Grain Prices:
Contemporary Immigration in Iowa: Hispanics, Language, and Foreign Born
 Contemporary Immigration in Iowa: Hispanics, Language, and Foreign Born Iowa Sandra Charvat Burke Community Vitality Center scburke@iastate.edu www.cvcia.org 2 Contents: Contents and Introduction. p. 2
Ethanol & Grain Market Outlook for /04/07
 Ethanol & Grain Market Outlook for 2007-09 09 9/04/07 By Dr. Robert Wisner, University Professor of Economics and Coles Professor of International Agriculture Iowa State University Ames, Iowa, U.S.A. Grain
Indicators Program. Community and Economic Development. Race and Hispanic Origin in Iowa: Sandra Charvat Burke
 Community and Economic Development Indicators Program Race and Hispanic Origin in Iowa: 1980-2015 Sandra Charvat Burke Findings Although all race groups are estimated to have increased between 2010 and
MINE.RAL PRODUCTION IN IOWA
 MINE.RAL PRODUCTION IN IOWA IN 907 BY s. W. BEYER VALUE OF MINERAL PRODUCTION. 90 Coal................... $0,49,93 Clay........................................... 3,408,47 ' Stone....,.................................
Market Outlook. David Reinbott.
 Market Outlook David Reinbott Agriculture Business Specialist P.O. Box 187 Benton, MO 63736 (573) 545-3516 http://extension.missouri.edu/scott/agriculture.aspx reinbottd@missouri.edu Trending Issues Volatile
Small Planner Pgs - SM_Box_Sub
 Small Planner Pgs - SM_Box_Sub Mon Day Tues Day Wed Day Thurs Day Fri Day Sat Day Sun Day Notes Initials Initials Initials Initials Initials Small Planner Pgs - SM_Box_Sub Subjects Mon Day Tues Day Wed
SOYBEAN OUTLOOK Midwest & Great Plains/Western Extension Summer Outlook Conference. St. Louis, Missouri
 SOYBEAN OUTLOOK 2014 Midwest & Great Plains/Western Extension Summer Outlook Conference St. Louis, Missouri Jim Hilker Department of Agricultural, Food, And Resource Economics Michigan State University
~:r: AiiCi-============ ===============
 Table 15. Estimated Market Value of All Machinery and Equipment: 1978Con. (1978 d oto ore boed s on 0 som plett 0 arms; see fex t) by eslimoted value of machinery and equipment Eslimoled value $110 $5,000
Crop Market Outlook 8/22/2017
 MSU is an affirmativeaction, equal-opportunity employer. Michigan State University Extension programs and materials are open to all without regard to race, color, national origin, gender, gender identity,
Corn Outlook. David Miller Director of Research & Commodity Services Iowa Farm Bureau Federation December 2013
 Corn Outlook David Miller Director of Research & Commodity Services Iowa Farm Bureau Federation December 2013 Source: USDA-WAOB U.S. Corn Supply & Usage U.S. Corn Supply & Usage Comments With the largest
THE STATE Adair Adams Allamakee App1U1oose Audubon Benton Black Ha.wk
 CENSUS OF AGRICULTURE-IOWA 151 CoUNrv TABLE IV:-SPECIFIED CLASSES OF LIVESTOCK ON FARMS AND RANCHES, APR. 1, 1940 AND 1930, AND JAN. 1, 1935; AND SPECIFIED LIVESTOCK PRODUCTS, 1939 AND 1934 [The 1935 figures
USDA Projections of Bioenergy-Related Corn and Soyoil Use for
 USDA Projections of Bioenergy-Related Corn and Soyoil Use for 2010-2019 Daniel M. O Brien, Extension Agricultural Economist K-State Research and Extension The United States Department of Agriculture released
Oilseeds and Products
 Oilseeds and Products Oilseeds compete with major grains for area. As a result, weather impacts soybeans, rapeseed, and sunflowerseed similarly to the grain and other crops grown in the same regions. The
Oilseeds and Products
 Oilseeds and Products Oilseeds compete with major grains for area. As a result, weather impacts soybeans, rapeseed, and sunflowerseed similarly to grain and other crops grown in the same regions. The same
World Wheat Supply and Demand Situation August 2018
 World Wheat Supply and Demand Situation August 218 Major data source: USDA World Agricultural Supply and Demand Estimates released August 1, 218. Projections will change over the course of the year depending
Mid-term Outlook for World Agricultural Markets
 Mid-term Outlook for World Agricultural Markets Jacinto Fabiosa Co-Director, (515) 294-6183 jfabiosa@iastate.edu Food and Agricultural Policy Research Institute The Question of Interest? In 27 we asked,
2017 Risk and Profit Conference Breakout Session Presenters. 13. Ethanol and Biodiesel Market and Profitability Prospects
 2017 Risk and Profit Conference Breakout Session Presenters 13. Ethanol and Biodiesel Market and Profitability Prospects Dan O Brien Daniel O Brien was raised on a grain and livestock
Outlook for Crop Farm Income, Cash Rent, and Farmland Prices. Gary Schnitkey University of Illinois
 Outlook for Crop Farm Income, Cash Rent, and Farmland Prices Gary Schnitkey University of Illinois Net Income on Illinois Grain Farms, 1996-2016, 2017P U.S. Corn Yield, U.S. USDA release 2017 forecast
World Wheat Supply and Demand Situation December 2018
 World Wheat Supply and Demand Situation December 218 Major data source: USDA World Agricultural Supply and Demand Estimates released December 11, 218. Projections will change over the course of the year
316 / World Biofuels: FAPRI 2009 Agricultural Outlook. World Ethanol
 WORLD BIOFUELS 316 / World Biofuels: FAPRI 2009 Agricultural Outlook World The world ethanol price increased 13.7% in 2008, to $1.76 per gallon. It is projected to decrease by almost 16%, to $1.48 per
World Wheat Supply and Demand Situation March 2018
 World Wheat Supply and Demand Situation March 218 Major data source: USDA World Agricultural Supply and Demand Estimates released March 8, 218. Projections will change over the course of the year depending
Preliminary Assessment of the Drought s Impacts on Crop Prices and Biofuel Production
 CARD Policy Brief 12-PB 7 July 2012 Preliminary Assessment of the Drought s Impacts on Crop Prices and Biofuel Production by Bruce Babcock Partial support for this work is based upon work supported by
World Wheat Supply and Demand Situation
 World Wheat Supply and Demand Situation September 218 Major data source: USDA World Agricultural Supply and Demand Estimates released September 12, 218. Projections will change over the course of the year
The Outlook for Biofuels
 PRX BlueSky Outlook, Page 1 The Fertilizer Institute Fertilizer Outlook and Technology Conference The Outlook for Biofuels November 6, 2007 Ross Korves Economic Policy Analyst The ProExporter Network ross.korves@proexporter.com
Soybean Trade Growth: A Story of Brazil, the United States, and China
 United States Department of Agriculture Foreign Agricultural Service October 2017 Soybean Trade Growth: A Story of Brazil, the United States, and China 12-Month Soybean Export Growth Year Ending September
World Wheat Supply and Demand Situation October 2018
 World Wheat Supply and Demand Situation October 218 Major data source: USDA World Agricultural Supply and Demand Estimates released October 12, 218. Projections will change over the course of the year
World Wheat Supply and Demand Situation
 World Wheat Supply and Demand Situation November 218 Major data source: USDA World Agricultural Supply and Demand Estimates released November, 218. Projections will change over the course of the year depending
Economic and Commodity Market Outlook
 Economic and Commodity Market Outlook August 12, 2016 By Robert Coats, Ph.D. Professor Economics Department of Agricultural Economics and Agribusiness Division of Agriculture University of Arkansas System
Updated Assessment of the Drought's Impacts on Crop Prices and Biofuel Production
 CARD Policy Briefs CARD Reports and Working Papers 8-2012 Updated Assessment of the Drought's Impacts on Crop Prices and Biofuel Production Bruce A. Babcock Iowa State University, babcock@iastate.edu Follow
Argentine Exporters Switch to Soybean Oil as Biodiesel Exports Fall
 United States Department of Agriculture Foreign Agricultural Service Circular Series FOP 08-13 Argentine Exporters Switch to Soybean Oil as Biodiesel Exports Fall Argentina s soybean oil exports have surged
2018 Outlook for Grains and Oilseeds
 2018 Outlook for Grains and Oilseeds Present to the American Fats and Oils Associa;on October 2017 AdvancedEconomicSolu0ons US$ Declines from Peak - Now at lowest point since October 2015 Currently in
Soybean and Oilseed Meal Import Prospects Higher as Severe Weather Damages EU Crops
 Million Tons Million Tons Million Tons United States Department of Agriculture Foreign Agricultural Service August 2018 Soybean and Oilseed Meal Import Prospects Higher as Severe Weather Damages EU Crops
Biofuels: Implications for Prices and Production. Darrel L. Good and Scott H. Irwin
 Biofuels: Implications for Prices and Production Darrel L. Good and Scott H. Irwin Why Ethanol? Convert relatively abundant domestic sources of energy into a substitute for imported petroleum Energy Conversion
Weak Real to Boost Brazil s Soybean Exports in 2016
 United States Department of Agriculture Foreign Agricultural Service October 2015 Weak Real to Boost Brazil s Soybean Exports in 2016 Brazil s exchange rate is having a significant impact on domestic and
2017/18 Cotton Outlook
 217/1 Cotton Outlook 217 Ag Econ In service Training Dr. S. Aaron Smith, Assistant Professor, Department of Agricultural and Resource Economics, University of Tennessee https://ag.tennessee.edu/arec/pages/cropeconomics.aspx
FAPRI Food and Agricultural Policy Research Institute
 26 WORLD OUTLOOK Presentation Food and Agricultural Policy Research Institute Global Macroeconomic Overview Sustained and widespread real economic growth for the decade averaging 3.1%. Industrialized countries
The economics of biofuels. by Ronald Steenblik Director of Research
 The economics of biofuels by Ronald Steenblik Director of Research Current and expected future costs of ethanol 1.0 0.8 0.6 0.4 2005 2030 Ethanol from sugar cane Ethano from maize Ethanol from sugar beet
Early-Season U.S. Soybean Meal Sales Surge
 United States Department of Agriculture Foreign Agricultural Service November 2014 Early-Season U.S. Soybean Meal Sales Surge U.S. soybean meal export commitments (accumulated exports plus outstanding
U.S. Soybean Exports Forecast to Reach Record
 United States Department of Agriculture Foreign Agricultural Service July 2017 U.S. Soybean Exports Forecast to Reach Record 60 Accumulated Exports by Week Total Commitments of Soybeans as of End of June
Canola Weekly. Index. WCE May/07 Canola Jul 9-Aug 14-Sep 20-Oct 27-Nov 4-Jan 8-Feb 16-Mar
 March 2, 2 Canola Weekly Index ) Canola Steady Despite Weak Soy Complex 2) Slow Crush Improves Canola Oil Basis ) Export Demand Underpins Canola Last week, we mentioned that May canola had key support
U.S. Soybean Prices Fall as Buyers Focus Turns to South America
 United States Department of Agriculture Foreign Agricultural Service Circular Series FOP 2-10 ruary 2010 U.S. Soybean Prices Fall as Buyers Focus Turns to South America $11.00 Daily U.S. Soybean Cash Price
CHARTS AND PRICE PROJECTIONS
 CHARTS AND PRICE PROJECTIONS 18 / Charts and Price Projections: FAPRI 28 Agricultural Outlook Average Annual GDP Growth, 27-217 Percent Change 1 8 8.4 7.92 6 4 4.44 3.67 4.6 4.34 2 2.37 2.17 1.38 2.44
External Market Factors Impacting US Soybean Meal
 External Market Factors Impacting US Soybean Meal USSEC Luncheon International Production and Processing Expo January 3, 213 Atlanta, GA Paul Smolen Presentation Objectives Examine the economic drivers
Missouri Soybean Facts
 Missouri Soybean Facts $1,929,659,800: Five-year average value of Missouri soybean production between 2006 and 2010 a Top Soybean Production Regions, 2010 a Rank United States Rank Missouri Counties 1
Global biofuel growth Implications for agricultural markets and policies
 Global biofuel growth Implications for agricultural markets and policies Martin von Lampe Trade and Agriculture Directorate OECD Regional Meeting on Agricultural Policy Reform Bucharest, Romania 24-26
Baseline Update for International Livestock Markets
 Baseline Update for International Livestock Markets September 2018 FAPRI-MU Report #04-18 www.fapri.missouri.edu Published by the Food and Agricultural Policy Research Institute (FAPRI) at the University
Drought in South America to Limit Soybean Exports
 United States Department of Agriculture Foreign Agricultural Service Circular Series FOP 2-09 ruary 2009 Drought in South America to Limit Soybean Exports Million Tons 16 14 12 10 8 6 4 2 Annual Change
CHARTS AND PRICE PROJECTIONS
 CHARTS AND PRICE PROJECTIONS 18 / Charts and Price Projections: FAPRI 27 Agricultural Outlook Average Annual GDP Growth Percent Change 9 8 7 6 4 3 2 1 26-216 Canada China EU NMS EU- India Japan Latin America
Impact of Ethanol on Iowa s Transportation System
 Impact of Ethanol on Iowa s Transportation System Legislative Agriculture Chairs Summit VI St Louis, MO January 18-20, 2008 Craig O Riley, Office of Systems Planning 1 Discussion Topics Agricultural Trends
Biodiesel Industry A Statewide Assessment
 University of Nebraska - Lincoln DigitalCommons@University of Nebraska - Lincoln Industrial Agricultural Products Center -- Publications & Information Industrial Agricultural Products Center 8-31-2006
Crop Value and Volatility in a New Era
 Crop Value and Volatility in a New Era Scott Irwin sirwin@illinois.edu University of Illinois The Profitability of Illinois Agriculture: Looking Ahead in Extraordinary Times Prices have changed so much
Share of Brazil s Soybean Exports to China Spikes in August
 United States Department of Agriculture Foreign Agricultural Service September 2018 Share of Brazil s Soybean Exports to China Spikes in August Monthly Share of Brazil's Soybean Exports to China 85% 75%
U.S. Ethanol Ready For The World Market
 U.S. Ethanol Ready For The World Market The United States has plenty of ethanol and is ready and willing to meet foreign market needs. As the U.S. Grains Council (USGC) works with its industry partners
China s Global Peanut Export Share Declines
 United States Department of Agriculture Foreign Agricultural Service Circular Series FOP 07-13 China s Global Peanut Export Share Declines U.S. 10% Others 19% Argentina 17% U.S. 11% Others 16% Argentina
FOOD, FUEL AND FORESTS BIOFUEL TRENDS IN LATIN AMERICA
 FOOD, FUEL AND FORESTS IPC - ALARN SEMINAR ON CLIMATE CHANGE, AGRICULTURE AND TRADE BIOFUEL TRENDS IN LATIN AMERICA Regúnaga ; Nogueira - Moreira; Foster - Valdéz BOGOR, May 2008 STRATEGIES: MAIN DRIVERS
Fundamentals Driving U.S. Agricultural Prosperity
 Fundamentals Driving U.S. Agricultural Prosperity Chris Hurt Purdue Extension Service March 2013, hurtc@purdue.edu Economic Shock Transition to New-Equilibrium 250 Hypothetical 29 Year Cycle: Index Base
US biofuel Indicators and a changing market dynamic
 US biofuel Indicators and a changing market dynamic Seth Meyer AMIS October 1-2, 13, Rome Movement of Ag and Energy Ethanol production and capacity 16 35 Crude oil and maize prices 14 3 billion gallons
Biofuels, Energy Security, and Future Policy Alternatives. Wally Tyner
 Biofuels, Energy Security, and Future Policy Alternatives Wally Tyner Purdue University Ethanol Economics Ethanol has value as energy and as an additive to gasoline The energy content is about 68% of gasoline
Market Report. Grain HIGHLIGHTS INTERNATIONAL GRAINS COUNCIL. WORLD ESTIMATES. GMR November 2018
 Grain INTERNATIONAL GRAINS COUNCIL www.igc.int Market Report GMR 494 22 November 2018 HIGHLIGHTS With small adjustments for wheat, maize and sorghum, the forecast for world total grains (wheat and coarse
Renewable Energy & Climate Change Newsletter
 Renewable Energy & Climate Change Newsletter in this issue... Feedstocks Used for U.S. Biodiesel: How Important is Corn Oil?...Page 1 Corn Price Squeeze Emerging for Corn Farmers...Page 6 prices, profitability
U.S. Soybeans Facing Stiff Competition from Brazil. Brazil Soybean Export Price (Dollars and Reals) and Exchange Rate
 and Exchange Rate") United States Department of Agriculture Foreign Agricultural Service June, 2018 U.S. Soybeans Facing Stiff Competition from Brazil Brazil Soybean Export Price (Dollars and Reals) and Exchange Rate FOB
United States Department of Agriculture Foreign Agricultural Service June, 2018 U.S. Soybeans Facing Stiff Competition from Brazil Brazil Soybean Export Price (Dollars and Reals) and Exchange Rate FOB
No sale Farmers continue to hold tight By Bryce Knorr
 No sale Farmers continue to hold tight By Bryce Knorr Basis in the grain cash market didn t firm everywhere during Thanksgiving week, but overall the trend is for strengthening as growers resist selling
Indian Soybean Meal Exports Unlikely to Recover in 2015/16
 United States Department of Agriculture Foreign Agricultural Service November 2015 Indian Soybean Meal Exports Unlikely to Recover in Though once a significant regional exporter of soybean meal, India
India. Oilseeds and Products Update. February 2012
 THIS REPORT CONTAINS ASSESSMENTS OF COMMODITY AND TRADE ISSUES MADE BY STAFF AND NOT NECESSARILY STATEMENTS OF OFFICIAL U.S. GOVERNMENT POLICY Required Report - public distribution India Oilseeds and Products
Basis gains despite transport woes Floods shut river system while congestion snarls rail traffic to Mexico By Bryce Knorr
 Basis gains despite transport woes Floods shut river system while congestion snarls rail traffic to Mexico By Bryce Knorr Transportation problems at harvest are nothing new for farmers, but when they occur
2011 Soft Red Winter Wheat Quality Survey. Final
 2011 Soft Red Winter Wheat Quality Survey Final Survey Overview Illinois Indiana U.S. Wheat Class Production Areas Gulf Tributary SRW States and Areas Surveyed East Coast Tributary Weather and Harvest:
Table E-13 Boat and ATV Registrations for Missouri Counties
 Table E-13 Adair Motor Boats 738 824 898 1,097 1,182 1,264 1,369 1,428 Boat Motors 591 744 882 1,071 1,217 1,360 1,501 1,582 ATV s 61 59 87 172 195 246 298 283 Total 1,390 1,627 1,867 2,340 2,594 2,870
Pakistan Oilseed Processors Seize Opportunity to Crush Soybeans
 United States Department of Agriculture Foreign Agricultural Service December 2015 Pakistan Oilseed Processors Seize Opportunity to Crush Soybeans Pakistan, long an importer of soybean meal, is transitioning
Refined Oils Weekly Wire 04/27/2012
 Refined Oils Weekly Wire 04/27/2012 The following is provided for informational purposes only and is not a recommendation to buy or sell a commodity. Much of this information is derived from sources that
What Does the March Prospective Plantings Report Mean for the Outlook? Chris Hurt & Corinne Alexander
 What Does the March Prospective Plantings Report Mean for the 2014-2015 Outlook? Chris Hurt & Corinne Alexander hurtc@purdue.edu cealexan@purdue.edu Purdue University April 1, 2014" Webinar: April 1, 2014
Devaluation Energizes Argentine Soybean Crush
 United States Department of Agriculture Foreign Agricultural Service March 2016 Devaluation Energizes Argentine Soybean Crush Argentina Quarterly Soybean Crush Volume Exchange Rate* and Constant Dollar
2011 Indiana Agricultural Outlook
 2011 Indiana Agricultural Outlook Corinne Alexander & Chris Hurt hurtc@purdue.edu September 13, 2010 World Economic Growth Ethanol Dollar Value Surprises and Uncertainty! Change Wheat Production 2010 vs.
THIS REPORT CONTAINS ASSESSMENTS OF COMMODITY AND TRADE ISSUES MADE BY USDA STAFF AND NOT NECESSARILY STATEMENTS OF OFFICIAL U.S.
 THIS REPORT CONTAINS ASSESSMENTS OF COMMODITY AND TRADE ISSUES MADE BY USDA STAFF AND NOT NECESSARILY STATEMENTS OF OFFICIAL U.S. GOVERNMENT POLICY Required Report - public distribution Oilseeds and Products
No Tillage Use for Crop Production in Kentucky Counties in 1996
 No Tillage Use for Crop Production in Kentucky Counties in 1996 G.R. Haszler and G.W. Thomas Two years ago, we reported the status of notillage adoption in Kentucky counties in the year 1994. Now, CTIC
Lingering Effects of Truckers Strike Impact Planting Plans
 THIS REPORT CONTAINS ASSESSMENTS OF COMMODITY AND TRADE ISSUES MADE BY USDA STAFF AND NOT NECESSARILY STATEMENTS OF OFFICIAL U.S. GOVERNMENT POLICY Required Report - public distribution Brazil Post: Brasilia
2012 Risk and Profit Conference Breakout Session Presenters. 9. Bio-Energy's Impact on U.S. and World Grain and Feed Markets
 2 Risk and Profit Conference Breakout Session Presenters 9. Bio-Energy's Impact on U.S. and World Grain and Feed Markets Daniel O Brien Daniel O Brien was raised on a grain and livestock
Upper Midwest Marketing Area -- F.O. 30 State and County Data 1/ (pool pounds) March 2009
 March 2009") and Data 1/ (pool pounds) Idaho Jerome 16 053 R R Minidoka 16 067 R R Idaho Total 16 R 2/ R 2/ Illinois Boone 17 007 31 3,431,362 Carroll 17 015 10 1,222,809 De Kalb 17 037 9 1,698,362 Jo Daviess 17 085
and Data 1/ (pool pounds) Idaho Jerome 16 053 R R Minidoka 16 067 R R Idaho Total 16 R 2/ R 2/ Illinois Boone 17 007 31 3,431,362 Carroll 17 015 10 1,222,809 De Kalb 17 037 9 1,698,362 Jo Daviess 17 085
Macro economic and Energy Factors Driving the Agricultural Outlook
 Macro economic and Energy Factors Driving the Agricultural Outlook Michael Swanson Ph.D. Wells Fargo September 2013 Inter connected Markets Economic growth GDP, Population and Income Currency competition
Palm and Soy Oil Use Expands at Expense of Other Oils
 United States Department of Agriculture Foreign Agricultural Service September 2015 Revised on September 15, 2015 Palm and Soy Oil Use Expands at Expense of Other Oils As global demand for vegetable oil
AOF Forum Oilseeds Outlook October, 2006
 AOF Forum Oilseeds Outlook October, 2006 Josh Roberts Senior Trading Manager Grain Pool Pty Ltd 30 Delhi Street West Perth Tel: +61 8 9237 9859 josh.roberts@grainpool.com.au Oilseeds trends versus other
China Tariffs Driving U.S. Soybean Exports To the European Union to a 30-Year High
 United States Department of Agriculture Foreign Agricultural Service March 2019 China Tariffs Driving U.S. Soybean Exports To the European Union to a 30-Year High 12-MONTH MOVING TOTAL U.S. SOYBEAN EXPORTS
THIS REPORT CONTAINS ASSESSMENTS OF COMMODITY AND TRADE ISSUES MADE BY USDA STAFF AND NOT NECESSARILY STATEMENTS OF OFFICIAL U.S.
 THIS REPORT CONTAINS ASSESSMENTS OF COMMODITY AND TRADE ISSUES MADE BY USDA STAFF AND NOT NECESSARILY STATEMENTS OF OFFICIAL U.S. GOVERNMENT POLICY Required Report - public distribution Date: GAIN Report
China Soybean Imports Stagnant Despite Record Consumption as Production Rebounds
 United States Department of Agriculture Foreign Agricultural Service Circular Series FOP 9-08 tember 2008 China Soybean Stagnant Despite Record Consumption as Rebounds Million Tons 60 50 40 30 20 10 0
Oil Crops Outlook Economic Research Service October 12, 2012 U.S. Department of Agriculture
 Oil Crops Outlook Economic Research Service October 12, 2012 U.S. Department of Agriculture OCS-12j text Approved by the World Agricultural Outlook Board Advancing Soybean Harvest Eases Near-term Prices
Macroeconomic Assumptions
 Macroeconomic Assumptions A major factor affecting the global economy this year continues to be weakness in Chinese financial markets and the resulting fallout affecting trading partners dependent on the
International Biofuels Baseline Update
 International Biofuels Baseline Update September 2017 FAPRI MU Report #04 17 www.fapri.missouri.edu Published by the Food and Agricultural Policy Research Institute (FAPRI) at the University of Missouri
A. U.S. Ethanol Policy. B. U.S. Ethanol Industry Capacity. C. U.S. Ethanol Prices, Costs & Profits. E. Key Ethanol Related Research
 U.S. Ethanol Market Outlook Kansas Farm Managers & Rural Appraisers Annual Meeting February 24, 2012 Ethanol Policy & Markets A. U.S. Ethanol Policy B. U.S. Ethanol Industry Capacity C. U.S. Ethanol Prices,
Market Report INTERNATIONAL GRAINS COUNCIL. HIGHLIGHTS WORLD ESTIMATES
 Grain GMR 467 1 July 2016 INTERNATIONAL GRAINS COUNCIL www.igc.int Market Report HIGHLIGHTS The forecast for total grains (wheat and coarse grains) production in 2016/17 is up by 10m t m/m (month-on-month),
Wheat Marketing Situation
 Wheat Marketing Situation Prepared by: Darrell L. Hanavan Executive Director Colorado Wheat Administrative Committee If you would like to receive an email when this report is updated, email gmostek@coloradowheat.org
Strong Global Grain Production Isn t Good Enough. David Hightower The Hightower Report
 Strong Global Grain Production Isn t Good Enough David Hightower The Hightower Report Big Picture Factors Cost of Production Pricing Not a downtrend signal Goldman $20 oil Forecast was wrong 8.9 mbd!
Soybean Oil Prices Diverge on Different Supply Situations
 United States Department of Agriculture Foreign Agricultural Service Circular Series FOP 10-09 October 2009 Soybean Oil Prices Diverge on Different Supply Situations Soybean Oil Price ($/ton) $900 $850
2016/17 Global Olive Oil Production Down But Prices Stabilize
 United States Department of Agriculture Foreign Agricultural Service November 2016 Global Olive Oil Down But Prices Stabilize Global Olive Oil and Stocks 4000 3500 5000 Extra Virgin Olive Oil Prices Stabilizing
Prices indeed dropped on Thursday, aided by a surprise increase in crude oil supplies caused by stronger imports.
 Trump s war on OPEC Farm fuel prices resist President s attempt to jawbone cartel By Bryce Knorr, senior grain market analyst For a day or two, at least, it looked like President Trump s attempt to tweet
It s time to start buying propane for fall Expect to pay more to dry 2017 corn crop By Bryce Knorr, senior grain market analyst
 It s time to start buying propane for fall Expect to pay more to dry 2017 corn crop By Bryce Knorr, senior grain market analyst It s the end of winter hopefully and that means it s a good time to buy coats,
2019 Grain Update December 4, 2018
 2019 Grain Update December 4, 2018 Orange Juice (Jan '19) Live Cattle (Dec '18) S&P 500 E-Mini (Dec '18) Dow Indu 30 E-Mini (Dec '18) Cotton #2 (Dec '18) U.S. Dollar Index (Dec '18) Wheat (Dec '18) Nasdaq
China s Rapeseed Meal Imports Rise as Seed Imports Decline
 United States Department of Agriculture Foreign Agricultural Service February 2017 China s Rapeseed Meal Rise as Seed Decline Trend in China Rapeseed 12-Month Moving Totals Trend In China Rapeseed Meal