Oilseeds and Products
|
|
|
- Aileen Osborne
- 5 years ago
- Views:
Transcription
1 Oilseeds and Products
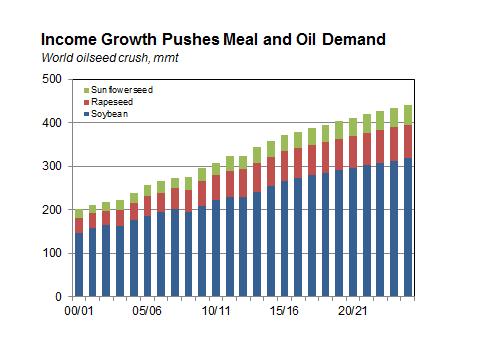
2 Oilseeds compete with major grains for area. As a result, weather impacts soybeans, rapeseed, and sunflowerseed similarly to grain and other crops grown in the same regions. The same general price movements expected for grains will also be exhibited by oilseeds. Lower corn prices allow soybeans to compete for area, pushing soybean prices lower, as well. Expanding South American soybean area and production will also pressure soybean prices lower. Soybeans will exhibit a more than 30% decline in prices in 2014/15 from two years earlier. Rapeseed competes with wheat and barley for area. As a result, rapeseed prices are expected to track wheat and barley prices in the next year, and will take a little longer than soybeans to find new price levels. By 2015/16, rapeseed prices are projected to see a 30% decline from 2012/13 prices, and a 40% decline from the peak of 2010/11. Sunflowerseed prices are mirroring the movements of rapeseed, falling 28% from 2012/13 and 37% from the high point reached in 2010/11. With larger oilseed availability, meal and oil production will also increase. Because the oilseeds are the largest cost categories for protein meal and vegetable oil production, the decline in oilseed prices reduces crushing costs, allowing lower output prices while maintaining crushers margins. Prices of soybean, rapeseed, and sunflowerseed meals are all expected to fall more than 30% from recent peaks. Soybean, rapeseed, and sunflowerseed meal prices also reflect prices of other major livestock feed components. The fall in grain prices will further pressure meal prices downward Expanding livestock production will dampen the downward movement of protein meals. Dairy, poultry, and hog production are the primary drivers of protein meal consumption, and production of livestock and products is rising globally. Because soybean, rapeseed, and sunflowerseed oils are co-products with their respective meal counterparts, some common costs underlie both products. Vegetable oil prices are projected to fall and remain below historical highs over the next ten years. From their zeniths soy, rapeseed, sunflowerseed, and palm oil prices are expected to exhibit declines of approximately 40% to 45%. While price-supporting demand factors, including energy-related factors, will remain in place, expected continuing increases in palm oil production will limit upward price pressure. Palm oil prices have adjusted back to a more typical relationship with other vegetable oils as production has recovered from constrained production in 2012/13. Vegetable oil prices tend to follow similar paths in the long term. However, there will likely be periods when prices move somewhat differently, particularly for palm oil, as there is a cyclical pattern to production.
3
4 The increase in oilseed, especially soybean area that quickened in recent years is expected to slow. Lower prices will provide less incentive to expand plantings, especially if it requires new ground to be broken. There are still some regions that have available land for expansion, particularly in South American countries such as Argentina and Brazil, where new crop is being cleared, most of it for soybeans. Compared to soybeans, rapeseed has a much more limited geographic area. New lands are not being devoted to rapeseed planting and traditional producing countries such as Canada and the EU must also consider established crop rotations. One region that has been able to expand rapeseed production is the former Soviet Union. Producers on land that was formerly under central planning now consider regional and global markets. As a result there has been some switching of land from traditional grains into rapeseed. The potential for that to continue in the future is limited, however, and rapeseed area will not exhibit large increases. Crushing is the primary utilization for oilseeds as the co-products, protein meals and vegetable oils form the primary basis of demand. While many nations import soybeans and rapeseed to take advantage of value-added industry opportunities, most of the crushing occurs in major producing countries. Brazil and Argentina process most of the soybeans they grow as they invest in expanding crush capacity and provide jobs. Major crushers of rapeseed are Canada, China, EU-27, and India. These are also the largest producers. While Japan produces virtually no rapeseed, it is the one nation that imports to feed crushing facilities. Ukraine, Russia, and the EU are the leading sunflowerseed producers and processors. Argentina, China, and Turkey also have significant crushing capacity Soybeans account for the largest share of global oilseed trade. The U.S., Argentina, and Brazil account for nearly 90% of exports. Approximately 35% of soybean production is traded, and that proportion is expected to increase primarily as demand grows in China, which currently accounts for nearly two-thirds of global imports. Imports by other countries have been relatively stable. A much smaller proportion of rapeseed is traded. Approximately 15% of global rapeseed production will be sold on the world market in the next ten years. Canada controls an approximately two-thirds market share. The EU-28 has emerged as the world s largest exporter of sunflowerseed. However, trade is not as important in the sunflowerseed market, with only about 1% being sold on the world market.
5
6 In combination with population growth, especially in developing regions, per capita incomes are pushing demand for meat and dairy products. Increased purchasing power allows better diets. As demand for these products increases, so too, does utilization of protein meals. Increasing urbanization in nations such as China is pushing livestock, poultry, and dairy production into locations closer to population centers. As a result, animal production is intensifying, using improved practices and feeds. Protein meals are being increasingly used in feed concentrates. Because poultry are much more efficient converters of protein than other animals, poultry production is increasing faster than hogs or dairy. Relatively low costs of production and short production cycles make poultry attractive for increasing meat in diets in developing regions. Versatility in product lines also has allowed poultry to take share away from other meats in developed countries. As global economic expansion accelerates in the next few years, dietary improvements, and therefore, protein meal consumption growth is expected to outpace the recent past. Rapid increases in livestock and dairy production are outpacing the ability to produce feed in many parts of the world. In addition, many nations with limited land bases have intensive livestock operations which require the importation of feed ingredients, including protein meals. The major exporters of soybean meal, as in the case of soybeans, are Argentina, Brazil, and the U.S. In recent years, India has emerged as a notable exporter, and Paraguay is increasing sales on the world market. China is self-sufficient as this country imports soybeans to process to meet domestic product demand. The EU is by far the largest importer, with other trade distributed widely around the world. As with rapeseed, Canada is the dominant exporter of rapeseed meal, with most going to the neighboring U.S. India has emerged as a minor exporter in recent years, but domestic consumption is growing faster and will limit export capability. Despite being one of the largest producers of rapeseed meal, the EU is self-sufficient, feeding all that it produces. Trade in sunflowerseed meal takes in a somewhat limited region of the globe. Ukraine and Russia are the dominant producers and exporters of sunflowerseed meal. Most of the trade is with the European Union and Turkey.
7
8 Vegetable oil consumption is being boosted by a combination of population growth, income expansion, and increased industrial uses, including those for biofuels. China is leading global soyoil demand growth, accounting for more than half of consumption increases in the past decade, and is expected to maintain that role in the next ten years. Palm oil production in tropical Asian nations such as Indonesia and Malaysia is dramatically increasing global vegetable oil supplies. These two countries together accounted for 85% of palm oil production in 2013/14. Palm oil is readily accepted and is rapidly taking share in many markets. Rapeseed oil consumption is increasing only with population growth. Per capita consumption is stagnating and is not expected to show measurable increases over the next decade as the rapid growth in production and consumption of palm oil is displacing rapeseed oil in some regions. Similarly, sunflowerseed oil is not increasing dramatically on a per capita basis. Unlike soybeans and products and palm oil, both rapeseed and sunflowerseed products are constrained by limited potential for expanding the land base devoted to those respective oilseeds. Palm oil has captured the largest share of global vegetable oil trade. Unlike soybean, rapeseed or sunflowerseed oil, palm oil is not a co-product with other oilseed products. The trees are fast growing in low-cost areas of the Pacific Rim and Asia and production has exploded. Two-thirds of global palm oil production is sold on the world market, coming primarily from Indonesia and Malaysia as this commodity has become an important source of foreign exchange. Together these two countries account for 90% of palm oil exports. Imports are much more widely distributed. In recent years, highly competitive palm oil gained market share from soyoil. As a result, soyoil trade declined in the period from 2008/09 to 2011/12. Nevertheless, demand growth globally will outpace crushing capacity increases in importing nations and trade will gradually increase. Argentina, Brazil, and the U.S. will remain top exporters. Approximately 15% of global production will be sold on international markets. Rapeseed and sunflowerseed crushers cannot absorb the competition from palm oil prices in the baseline as readily as soybean processors, as rapeseed and sunflowerseed have a 40% oil content compared to 18% for soybeans. As a result, crushers are more than twice as exposed to changes in vegetable oil prices than soybean crushers. Rapeseed oil will see only gradual increases in demand and trade over the next ten years. Important importers will be China, the EU, and the U.S. The U.S. will remain the single largest importer of rapeseed oil in the world due to location near major rapeseed production and processing in Canada, which accounts for the largest proportion of the 10% of global production that is traded. Though trade is small in absolute terms, sunflowerseed oil is dependent on the international market as more than one-third of production is traded. The largest exporters are Russia and Ukraine, and the largest importer is India.
9
10 World Soybean Supply & Utilization 03/04 04/05 05/06 06/07 07/08 08/09 09/10 10/11 11/12 12/13 13/14 (Million hectares) Area Harvested (Metric tons per hectare) Yield (Million metric tons) Supply Production Beginning stocks Net imports Utilization Crush Other utilization Ending Stocks Net Exports Total Demand Soybean Area Harvested 03/04 04/05 05/06 06/07 07/08 08/09 09/10 10/11 11/12 12/13 13/14 (Million hectares) Argentina Brazil Canada China EU India Japan Mexico Paraguay South Korea United States Rest of world World total
11 World Soybean Supply & Utilization 14/15 15/16 16/17 17/18 18/19 19/20 20/12 21/22 22/23 23/24 24/25 (Million hectares) Area Harvested (Metric tons per hectare) Yield (Million metric tons) Supply Production Beginning stocks Net imports Utilization Crush Other utilization Ending Stocks Net Exports Total Demand Soybean Area Harvested 14/15 15/16 16/17 17/18 18/19 19/20 20/12 21/22 22/23 23/24 24/25 (Million hectares) Argentina Brazil Canada China EU India Japan Mexico Paraguay South Korea United States Rest of world World total
12 Soybean Trade 03/04 04/05 05/06 06/07 07/08 08/09 09/10 10/11 11/12 12/13 13/14 (Thousand metric tons) Net exporters Argentina 6,204 8,876 6,665 7,574 10,885 4,349 13,087 9,192 7,368 7,736 7,840 Brazil 20,089 19,662 25,848 23,432 25,214 29,943 28,404 29,914 36,129 41,509 46,224 Canada ,449 1,444 1,630 1,872 2,693 2,702 3,200 3,131 India Paraguay 2,649 2,850 2,370 4,121 4,085 2,599 4,058 5,206 3,555 5,491 4,373 United States 23,977 29,708 25,487 30,140 31,269 34,456 40,401 40,566 36,717 34,743 42,864 Total net exports 53,459 61,840 61,353 66,717 72,909 73,032 87,837 87,589 86,509 92, ,611 Net importers China 16,614 25,412 27,963 28,280 37,363 40,698 50,154 52,149 58,956 59,599 70,149 EU-28 14,711 14,547 13,936 15,121 15,095 13,177 12,623 12,377 12,015 12,446 12,928 Japan 4,688 4,295 3,962 4,087 4,009 3,396 3,401 2,917 2,759 2,830 2,894 South Korea 1,368 1,240 1,190 1,231 1,232 1,167 1,197 1,239 1,139 1,113 1,271 Mexico 3,794 3,639 3,667 3,844 3,614 3,327 3,523 3,498 3,606 3,409 3,700 Rest of world 10,275 11,514 10,882 11,923 11,648 11,481 12,316 12,467 9,330 8,751 11,352 Total net imports 51,450 60,647 61,600 64,486 72,961 73,246 83,214 84,647 87,805 88, ,294 Residual 2,009 1, , ,623 2,942-1,296 4,651 2,317 (Dollars per metric ton) Soybean price, Central IL
13 Soybean Trade 14/15 15/16 16/17 17/18 18/19 19/20 20/12 21/22 22/23 23/24 24/25 (Thousand metric tons) Net exporters Argentina 8,018 9,983 9,847 9,851 10,135 10,635 11,245 11,787 12,250 12,694 13,154 Brazil 45,514 50,786 52,488 54,585 55,809 57,063 58,318 59,534 60,576 61,722 62,840 Canada 3,595 3,959 3,985 4,010 4,032 4,042 4,039 4,024 3,998 3,968 3,933 India Paraguay 4,515 4,502 4,581 4,613 4,781 4,922 5,156 5,452 5,791 6,153 6,403 United States 47,832 47,703 47,753 48,846 49,601 50,680 50,975 51,580 51,815 51,826 52,249 Total net exports 109, , , , , , , , , , ,681 Net importers China 73,810 79,329 81,106 84,913 87,222 90,008 92,653 95,336 97,363 99, ,995 EU-28 12,757 13,988 13,551 12,923 12,991 13,036 12,969 13,039 12,914 12,853 12,782 Japan 3,181 3,283 3,128 2,951 2,893 2,883 2,864 2,878 2,842 2,805 2,762 South Korea 1,299 1,292 1,294 1,295 1,296 1,296 1,295 1,294 1,292 1,290 1,288 Mexico 3,970 4,169 4,192 4,195 4,225 4,268 4,279 4,291 4,283 4,279 4,269 Rest of world 11,097 11,498 12,037 12,277 12,326 12,408 12,221 12,068 12,290 12,112 12,084 Total net imports 106, , , , , , , , , , ,182 Residual 3,499 3,499 3,499 3,499 3,499 3,499 3,499 3,499 3,499 3,499 3,499 (Dollars per metric ton) Soybean price, Central IL
14 World Soybean Products Supply & Utilization 03/04 04/05 05/06 06/07 07/08 08/09 09/10 10/11 11/12 12/13 13/14 Soybean Meal (Million metric tons) Supply Production Beginning stocks Net imports Utilization Consumption Ending Stocks Net Exports Total Demand Soybean Oil Supply Production Beginning stocks Net imports Utilization Consumption Ending Stocks Net Exports Total Demand
15 World Soybean Products Supply & Utilization 14/15 15/16 16/17 17/18 18/19 19/20 20/12 21/22 22/23 23/24 24/25 Soybean Meal (Million metric tons) Supply Production Beginning stocks Net imports Utilization Consumption Ending Stocks Net Exports Total Demand Soybean Oil Supply Production Beginning stocks Net imports Utilization Consumption Ending Stocks Net Exports Total Demand
16 Soybean Meal Trade 03/04 04/05 05/06 06/07 07/08 08/09 09/10 10/11 11/12 12/13 13/14 (Thousand metric tons) Net exporters Argentina 19,219 20,650 24,221 25,624 26,813 24,021 24,912 27,615 26,043 23,667 24,960 Brazil 14,510 14,004 12,700 12,548 11,958 13,026 12,899 13,929 14,648 13,210 13,923 China , ,349 1,997 India 3,674 2,230 4,265 4,140 5,280 3,800 3,110 4,792 4,384 4,347 2,735 Paraguay 1, ,095 1,072 1,076 1,124 1, ,147 2,500 United States 4,431 6,525 7,173 7,845 8,256 7,628 9,980 8,075 8,649 9,917 10,173 Total net exports 43,546 44,646 48,663 52,087 53,810 50,353 53,123 55,632 55,100 54,637 56,288 Net importers Canada 1,011 1,052 1,213 1,278 1,390 1, EU-28 21,729 21,486 22,233 21,818 24,197 20,689 20,408 21,268 19,988 16,405 17,865 Japan 1,195 1,503 1,601 1,737 1,747 1,812 2,106 2,208 2,282 1,765 1,976 South Korea 1,307 1,462 1,773 1,870 1,752 1,697 1,662 1,586 1,533 1,539 1,647 Mexico 791 1,249 1,724 1,775 1,393 1,512 1,203 1,493 1,537 1,282 1,406 Rest of world 16,362 16,218 19,300 21,722 22,128 22,315 24,638 26,574 27,566 28,925 30,320 Total net imports 42,395 42,970 47,844 50,200 52,607 49,195 50,997 53,995 53,871 50,653 53,955 Residual 1,151 1, ,887 1,203 1,158 2,126 1,637 1,229 3,927 2,333 (Dollars per metric ton) Soymeal price 48%, Decatur
17 Soybean Meal Trade 14/15 15/16 16/17 17/18 18/19 19/20 20/12 21/22 22/23 23/24 24/25 (Thousand metric tons) Net exporters Argentina 27,837 29,684 31,732 33,040 34,065 34,985 35,841 36,767 37,704 38,656 39,664 Brazil 14,083 14,609 15,498 15,893 16,375 16,552 16,478 16,360 16,481 16,551 16,605 China 1,595 1,376 1,338 1,321 1,301 1,308 1,333 1,349 1,355 1,391 1,421 India 2,575 2,944 2,658 2,501 2,478 2,515 2,573 2,683 2,813 2,977 3,159 Paraguay 2,632 2,771 2,887 2,989 3,078 3,153 3,221 3,286 3,349 3,412 3,470 United States 11,474 10,903 10,231 10,162 10,168 10,128 10,313 10,214 9,952 10,075 10,035 Total net exports 60,195 62,286 64,345 65,905 67,465 68,640 69,759 70,659 71,655 73,062 74,353 Net importers Canada EU-28 18,941 18,487 19,394 20,205 20,259 20,363 20,742 20,974 21,403 21,771 22,169 Japan 1,944 1,835 1,910 1,989 1,986 1,970 1,967 1,972 2,042 2,096 2,176 South Korea 1,700 1,683 1,763 1,799 1,817 1,838 1,873 1,919 1,983 2,043 2,126 Mexico 1,402 1,304 1,527 1,696 1,810 1,893 2,004 2,114 2,239 2,340 2,445 Rest of world 32,989 35,831 36,655 37,163 38,584 39,616 40,255 40,801 41,143 41,995 42,639 Total net imports 57,695 59,786 61,845 63,405 64,965 66,140 67,259 68,159 69,155 70,562 71,853 Residual 2,500 2,500 2,500 2,500 2,500 2,500 2,500 2,500 2,500 2,500 2,500 (Dollars per metric ton) Soymeal price 48%, Decatur
18 Soybean Oil Trade 03/04 04/05 05/06 06/07 07/08 08/09 09/10 10/11 11/12 12/13 13/14 (Thousand metric tons) Net exporters Argentina 4,238 4,757 5,597 5,970 5,789 4,704 4,453 4,561 3,794 4,244 4,090 Brazil 2,692 2,411 2,438 2,458 2,321 1,903 1,412 1,668 1,885 1,245 1,378 Canada Paraguay United States , ,477 1, Total net exports 7,384 7,797 8,669 9,465 9,627 7,780 7,586 7,909 6,445 7,010 6,931 Net importers China 2,714 1,688 1,411 2,310 2,625 2,411 1,437 1,267 1,442 1,325 1,259 EU India 901 2,015 1,714 1, ,058 1, ,164 1,086 1,829 Japan South Korea Mexico Rest of world 3,634 3,799 3,944 3,939 4,578 3,440 3,427 4,475 3,201 3,828 3,776 Total net imports 7,073 7,589 7,958 8,907 9,183 7,763 7,143 7,773 5,930 6,040 6,887 Residual (Dollars per metric ton) Soyoil price, Decatur , ,173 1,144 1,
19 Soybean Oil Trade 14/15 15/16 16/17 17/18 18/19 19/20 20/12 21/22 22/23 23/24 24/25 (Thousand metric tons) Net exporters Argentina 4,343 4,600 4,884 5,078 5,159 5,268 5,408 5,573 5,695 5,793 5,889 Brazil 1,166 1,398 1,581 1,697 1,805 1,877 1,914 1,936 1,894 1,836 1,769 Canada Paraguay United States ,044 1,150 Total net exports 7,094 7,592 8,078 8,250 8,555 8,812 9,070 9,349 9,529 9,706 9,865 Net importers China 1,042 1,104 1,159 1,025 1,034 1,123 1,187 1,224 1,266 1,346 1,400 EU India 1,927 1,988 2,136 2,158 2,291 2,367 2,402 2,423 2,446 2,467 2,476 Japan South Korea Mexico Rest of world 3,632 4,131 4,366 4,521 4,690 4,766 4,909 5,126 5,165 5,178 5,209 Total net imports 6,694 7,192 7,678 7,850 8,155 8,412 8,670 8,949 9,129 9,306 9,465 Residual (Dollars per metric ton) Soyoil price, Decatur
20 World Rapeseed Supply & Utilization 03/04 04/05 05/06 06/07 07/08 08/09 09/10 10/11 11/12 12/13 13/14 (Million hectares) Area Harvested (Metric tons per hectare) Yield (Million metric tons) Supply Production Beginning stocks Net imports Utilization Crush Other utilization Ending Stocks Net Exports Total Demand Rapeseed Area Harvested 03/04 04/05 05/06 06/07 07/08 08/09 09/10 10/11 11/12 12/13 13/14 (Million hectares) Canada China EU India Japan United States Rest of world World total
21 World Rapeseed Supply & Utilization 14/15 15/16 16/17 17/18 18/19 19/20 20/12 21/22 22/23 23/24 24/25 (Million hectares) Area Harvested (Metric tons per hectare) Yield (Million metric tons) Supply Production Beginning stocks Net imports Utilization Crush Other utilization Ending Stocks Net Exports Total Demand Rapeseed Area Harvested 14/15 15/16 16/17 17/18 18/19 19/20 20/12 21/22 22/23 23/24 24/25 (Million hectares) Canada China EU India Japan United States Rest of world World total
22 Rapeseed Trade 03/04 04/05 05/06 06/07 07/08 08/09 09/10 10/11 11/12 12/13 13/14 (Thousand metric tons) Net exporters Canada 3,520 3,385 5,271 5,257 5,629 7,777 7,044 6,983 8,598 6,986 9,107 India Rest of world ,557-1,735-1,214 1, ,224 2,512 Total net exports 3,073 2,647 3,716 3,522 4,417 9,034 6,847 6,617 8,777 9,210 11,619 Net importers China ,034 2, ,622 3,421 5,046 EU ,231 1,906 2,410 3,603 3,284 3,205 Japan 2,283 2,231 2,281 2,165 2,257 2,123 2,275 2,321 2,350 2,495 2,378 United States Total net imports 2,684 2,742 3,397 3,880 3,789 9,022 6,749 5,849 9,044 9,417 11,404 Residual (Dollars per metric ton) Rapeseed price, Hamburg
23 Rapeseed Trade 14/15 15/16 16/17 17/18 18/19 19/20 20/12 21/22 22/23 23/24 24/25 (Thousand metric tons) Net exporters Canada 8,399 7,929 8,045 8,181 8,313 8,491 8,625 8,719 8,843 8,972 9,090 India Rest of world 1,084 1,509 1,841 2,144 2,324 2,330 2,631 2,811 2,954 3,095 3,218 Total net exports 9,484 9,438 9,886 10,325 10,637 10,821 11,256 11,529 11,797 12,066 12,308 Net importers China 3,752 3,691 3,738 4,041 4,117 4,228 4,548 4,619 4,709 4,846 4,950 EU-28 2,403 2,827 3,188 3,291 3,503 3,567 3,672 3,861 4,028 4,158 4,293 Japan 2,452 2,447 2,478 2,492 2,499 2,500 2,502 2,504 2,503 2,502 2,500 United States Total net imports 9,339 9,638 10,086 10,525 10,837 11,021 11,456 11,729 11,997 12,266 12,508 Residual (Dollars per metric ton) Rapeseed price, Hamburg
24 World Rapeseed Products Supply & Utilization 03/04 04/05 05/06 06/07 07/08 08/09 09/10 10/11 11/12 12/13 13/14 Rapeseed Meal (Million metric tons) Supply Production Beginning stocks Net imports Utilization Consumption Ending Stocks Net Exports Total Demand Rapeseed Oil Supply Production Beginning stocks Net imports Utilization Consumption Ending Stocks Net Exports Total Demand
25 World Rapeseed Products Supply & Utilization 14/15 15/16 16/17 17/18 18/19 19/20 20/12 21/22 22/23 23/24 24/25 Rapeseed Meal (Million metric tons) Supply Production Beginning stocks Net imports Utilization Consumption Ending Stocks Net Exports Total Demand Rapeseed Oil Supply Production Beginning stocks Net imports Utilization Consumption Ending Stocks Net Exports Total Demand
26 Rapeseed Meal Trade 03/04 04/05 05/06 06/07 07/08 08/09 09/10 10/11 11/12 12/13 13/14 (Thousand metric tons) Net exporters Canada 1,569 1,412 1,489 1,481 1,852 1,856 1,927 2,965 3,328 3,334 3,413 India , ,311 1, ,327 EU Total net exports 2,142 1,917 2,132 2,422 3,105 2,624 2,797 4,294 4,368 4,092 4,644 Net importers China , Japan United States 1,450 1,303 1,412 1,437 1,715 1,626 1,132 1,978 2,722 3,058 3,340 Rest of world , Total net imports 2,143 1,977 2,177 2,510 2,972 2,622 2,935 4,168 4,066 3,968 4,569 Residual (Dollars per metric ton) Rapemeal price, Hamburg
27 Rapeseed Meal Trade 14/15 15/16 16/17 17/18 18/19 19/20 20/12 21/22 22/23 23/24 24/25 Net exporters Canada 3,426 3,527 3,551 3,588 3,629 3,654 3,678 3,710 3,738 3,758 3,777 India 1,129 1,167 1,107 1,108 1,124 1,129 1,137 1,161 1,182 1,192 1,204 EU Total net exports 4,441 4,614 4,627 4,623 4,742 4,724 4,793 4,914 5,035 5,137 5,253 Net importers China Japan United States 3,358 3,519 3,588 3,608 3,611 3,624 3,683 3,749 3,833 3,928 4,024 Rest of world Total net imports 4,366 4,539 4,552 4,548 4,667 4,649 4,718 4,839 4,960 5,062 5,178 Residual (Dollars per metric ton) Rapemeal price, Hamburg
28 Rapeseed Oil Trade 03/04 04/05 05/06 06/07 07/08 08/09 09/10 10/11 11/12 12/13 13/14 (Thousand metric tons) Net exporters Canada ,049 1,129 1,271 1,416 1,609 2,296 2,584 2,346 2,265 Rest of world Total net exports ,186 1,177 1,618 1,785 2,230 2,682 2,483 2,525 Net importers China ,030 1, EU India Japan United States ,189 1,191 1,037 1,419 Total net imports ,394 1,302 1,619 1,953 2,139 2,723 2,404 2,471 Residual (Dollars per metric ton) Rapeoil price, Rotterdam , ,367 1,258 1,
29 Rapeseed Oil Trade 14/15 15/16 16/17 17/18 18/19 19/20 20/12 21/22 22/23 23/24 24/25 (Thousand metric tons) Net exporters Canada 2,552 2,519 2,540 2,563 2,587 2,600 2,623 2,650 2,674 2,693 2,712 Rest of world Total net exports 2,837 2,842 2,862 2,884 2,941 3,013 3,050 3,108 3,178 3,251 3,239 Net importers China 1, ,011 1,075 1,141 1,364 EU India Japan United States 1,335 1,568 1,638 1,673 1,728 1,789 1,842 1,884 1,924 1,962 1,998 Total net imports 2,783 2,788 2,808 2,830 2,887 2,959 2,996 3,054 3,124 3,197 3,185 Residual (Dollars per metric ton) Rapeoil price, Rotterdam
30 World Sunflowerseed Supply & Utilization 03/04 04/05 05/06 06/07 07/08 08/09 09/10 10/11 11/12 12/13 13/14 (Million hectares) Area Harvested (Metric tons per hectare) Yield (Million metric tons) Supply Production Beginning stocks Net imports Utilization Crush Other utilization Ending Stocks Net Exports Total Demand Sunflowerseed Area Harvested 03/04 04/05 05/06 06/07 07/08 08/09 09/10 10/11 11/12 12/13 13/14 (Million hectares) Argentina China EU India Kazakhstan Russia Turkey Ukraine United States Rest of world World total
31 World Sunflowerseed Supply & Utilization 14/15 15/16 16/17 17/18 18/19 19/20 20/12 21/22 22/23 23/24 24/25 (Million hectares) Area Harvested (Metric tons per hectare) Yield (Million metric tons) Supply Production Beginning stocks Net imports Utilization Crush Other utilization Ending Stocks Net Exports Total Demand Sunflowerseed Area Harvested 14/15 15/16 16/17 17/18 18/19 19/20 20/12 21/22 22/23 23/24 24/25 (Million hectares) Argentina China EU India Kazakhstan Russia Turkey Ukraine United States Rest of world World total
32 Sunflowerseed Trade 03/04 04/05 05/06 06/07 07/08 08/09 09/10 10/11 11/12 12/13 13/14 (Thousand metric tons) Net exporters Argentina China EU India Kazakhstan Russia Ukraine United States Total net exports , Net importers Turkey Rest of world Total net imports Residual (Dollars per metric ton) Sunflowerseed, Rotterdam
33 Sunflowerseed Trade 14/15 15/16 16/17 17/18 18/19 19/20 20/12 21/22 22/23 23/24 24/25 (Thousand metric tons) Net exporters Argentina China EU India Kazakhstan Russia Ukraine United States Total net exports 1,095 1,039 1,130 1,121 1,092 1,093 1,100 1,156 1,216 1,253 1,256 Net importers Turkey ,026 Rest of world Total net imports ,008 1,045 1,048 Residual (Dollars per metric ton) Sunflowerseed, Rotterdam
34 World Sunflowerseed Products Supply & Utilization 03/04 04/05 05/06 06/07 07/08 08/09 09/10 10/11 11/12 12/13 13/14 Sunflowerseed Meal (Million metric tons) Supply Production Beginning stocks Net imports Utilization Consumption Ending Stocks Net Exports Total Demand Sunflowerseed Oil Supply Production Beginning stocks Net imports Utilization Consumption Ending Stocks Net Exports Total Demand
35 World Sunflowerseed Products Supply & Utilization 14/15 15/16 16/17 17/18 18/19 19/20 20/12 21/22 22/23 23/24 24/25 Sunflowerseed Meal (Million metric tons) Supply Production Beginning stocks Net imports Utilization Consumption Ending Stocks Net Exports Total Demand Sunflowerseed Oil Supply Production Beginning stocks Net imports Utilization Consumption Ending Stocks Net Exports Total Demand
36 Sunflowerseed Meal Trade 03/04 04/05 05/06 06/07 07/08 08/09 09/10 10/11 11/12 12/13 13/14 (Thousand metric tons) Net exporters Argentina 945 1, , India Kazakhstan Russia ,681 1,360 1,750 Ukraine 1, ,337 1,483 1,272 2,209 2,516 2,926 3,836 3,050 3,750 United States Total net exports 2,569 2,463 3,175 3,158 3,068 3,966 3,810 4,289 6,440 4,718 5,768 Net importers China EU-28 1,702 1,486 1,733 1,641 1,513 2,438 1,947 2,147 3,734 2,907 3,191 Turkey Rest of world , ,115 Total net imports 2,370 2,246 2,919 2,984 2,558 3,658 3,189 3,558 5,781 4,336 5,026 Residual (Dollars per metric ton) Sunmeal price, Rotterdam
37 Sunflowerseed Meal Trade 14/15 15/16 16/17 17/18 18/19 19/20 20/12 21/22 22/23 23/24 24/25 (Thousand metric tons) Net exporters Argentina India Kazakhstan Russia 1,444 1,486 1,617 1,696 1,770 1,812 1,862 1,913 1,954 1,985 2,013 Ukraine 3,746 3,614 3,783 3,975 4,172 4,366 4,548 4,721 4,883 5,022 5,153 United States Total net exports 5,484 5,454 5,746 5,998 6,246 6,451 6,655 6,869 7,059 7,218 7,364 Net importers China EU-28 3,057 3,023 3,233 3,389 3,513 3,566 3,633 3,730 3,789 3,884 3,959 Turkey ,004 Rest of world 1,063 1,022 1,093 1,180 1,266 1,361 1,440 1,515 1,602 1,620 1,647 Total net imports 4,742 4,712 5,004 5,256 5,504 5,709 5,913 6,127 6,317 6,476 6,622 Residual (Dollars per metric ton) Sunmeal price, Rotterdam
38 Sunflowerseed Oil Trade 03/04 04/05 05/06 06/07 07/08 08/09 09/10 10/11 11/12 12/13 13/14 (Thousand metric tons) Net exporters Argentina 1,006 1,175 1, , Kazakhstan Russia , ,540 Ukraine ,514 1,867 1,324 2,098 2,644 2,651 3,262 3,244 3,850 United States Total net exports 2,019 1,899 3,268 3,296 2,676 3,681 3,671 3,623 5,423 4,523 5,755 Net importers China EU ,123 1,072 1, India , ,526 Turkey Rest of world ,051 1, ,251 1,197 1,045 2,218 1,582 2,284 Total net imports 1,301 1,496 2,649 2,574 1,880 3,191 2,907 2,738 4,617 3,951 5,258 Residual (Dollars per metric ton) Sunoil price, NW Europe , ,404 1,254 1,
39 Sunflowerseed Oil Trade 14/15 15/16 16/17 17/18 18/19 19/20 20/12 21/22 22/23 23/24 24/25 (Thousand metric tons) Net exporters Argentina Kazakhstan Russia 1,386 1,364 1,567 1,656 1,771 1,858 1,957 2,060 2,155 2,242 2,309 Ukraine 3,699 3,607 3,773 3,958 4,146 4,332 4,508 4,672 4,824 4,955 5,077 United States Total net exports 5,434 5,375 5,717 5,953 6,208 6,438 6,676 6,915 7,134 7,323 7,486 Net importers China EU India 1,478 1,534 1,666 1,729 1,850 1,922 1,982 2,038 2,094 2,150 2,200 Turkey Rest of world 2,328 2,295 2,354 2,442 2,519 2,623 2,757 2,865 2,947 3,022 3,103 Total net imports 5,077 5,018 5,360 5,596 5,851 6,081 6,319 6,558 6,777 6,966 7,129 Residual (Dollars per metric ton) Sunoil price, NW Europe
40 World Palm Oil Supply & Utilization 03/04 04/05 05/06 06/07 07/08 08/09 09/10 10/11 11/12 12/13 13/14 (Million metric tons) Supply Production Beginning stocks Net imports Utilization Consumption Ending Stocks Net Exports Total Demand Palm Oil Production 03/04 04/05 05/06 06/07 07/08 08/09 09/10 10/11 11/12 12/13 13/14 (Thousand metric tons) India Indonesia Malaysia Nigeria Thailand Rest of world World total
41 World Palm Oil Supply & Utilization 14/15 15/16 16/17 17/18 18/19 19/20 20/12 21/22 22/23 23/24 24/25 (Million metric tons) Supply Production Beginning stocks Net imports Utilization Consumption Ending Stocks Net Exports Total Demand Palm Oil Production 14/15 15/16 16/17 17/18 18/19 19/20 20/12 21/22 22/23 23/24 24/25 (Thousand metric tons) India Indonesia Malaysia Nigeria Thailand Rest of world World total
Oilseeds and Products
 Oilseeds and Products Oilseeds compete with major grains for area. As a result, weather impacts soybeans, rapeseed, and sunflowerseed similarly to the grain and other crops grown in the same regions. The
FAPRI 2006 Preliminary Baseline December 15-16, 2005
 FAPRI 26 Preliminary Baseline December 15-16, 25 INTERNATIONAL OILSEEDS Tun-Hsiang (Edward) Yu 515-294-815 edyucard@iastate.edu FAPRI Food and Agricultural Policy Research Institute Center for Agricultural
Indian Soybean Meal Exports Unlikely to Recover in 2015/16
 United States Department of Agriculture Foreign Agricultural Service November 2015 Indian Soybean Meal Exports Unlikely to Recover in Though once a significant regional exporter of soybean meal, India
China Soybean Imports Stagnant Despite Record Consumption as Production Rebounds
 United States Department of Agriculture Foreign Agricultural Service Circular Series FOP 9-08 tember 2008 China Soybean Stagnant Despite Record Consumption as Rebounds Million Tons 60 50 40 30 20 10 0
FAPRI Food and Agricultural Policy Research Institute
 26 WORLD OUTLOOK Presentation Food and Agricultural Policy Research Institute Global Macroeconomic Overview Sustained and widespread real economic growth for the decade averaging 3.1%. Industrialized countries
Soybean Trade Growth: A Story of Brazil, the United States, and China
 United States Department of Agriculture Foreign Agricultural Service October 2017 Soybean Trade Growth: A Story of Brazil, the United States, and China 12-Month Soybean Export Growth Year Ending September
Drought in South America to Limit Soybean Exports
 United States Department of Agriculture Foreign Agricultural Service Circular Series FOP 2-09 ruary 2009 Drought in South America to Limit Soybean Exports Million Tons 16 14 12 10 8 6 4 2 Annual Change
CHARTS AND PRICE PROJECTIONS
 CHARTS AND PRICE PROJECTIONS 18 / Charts and Price Projections: FAPRI 27 Agricultural Outlook Average Annual GDP Growth Percent Change 9 8 7 6 4 3 2 1 26-216 Canada China EU NMS EU- India Japan Latin America
CHARTS AND PRICE PROJECTIONS
 CHARTS AND PRICE PROJECTIONS 18 / Charts and Price Projections: FAPRI 28 Agricultural Outlook Average Annual GDP Growth, 27-217 Percent Change 1 8 8.4 7.92 6 4 4.44 3.67 4.6 4.34 2 2.37 2.17 1.38 2.44
China s Global Peanut Export Share Declines
 United States Department of Agriculture Foreign Agricultural Service Circular Series FOP 07-13 China s Global Peanut Export Share Declines U.S. 10% Others 19% Argentina 17% U.S. 11% Others 16% Argentina
Sharp Decline in Vegetable Oil Stocks Leads to Steeply Higher Prices
 United States Department of Agriculture Foreign Agricultural Service Circular Series FOP 1-11 Sharp Decline in Vegetable Oil Leads to Steeply Higher Prices Commodity prices have been on an upward trend
Growing Soybean Oil Price Raises Oil s Contribution to Total Soybean Value
 United States Department of Agriculture Foreign Agricultural Service Circular Series FOP 10-07 October 2007 Growing Soybean Oil Price Raises Oil s Contribution to Total Soybean Value Relative Share Value:
Weak Real to Boost Brazil s Soybean Exports in 2016
 United States Department of Agriculture Foreign Agricultural Service October 2015 Weak Real to Boost Brazil s Soybean Exports in 2016 Brazil s exchange rate is having a significant impact on domestic and
Argentine Exporters Switch to Soybean Oil as Biodiesel Exports Fall
 United States Department of Agriculture Foreign Agricultural Service Circular Series FOP 08-13 Argentine Exporters Switch to Soybean Oil as Biodiesel Exports Fall Argentina s soybean oil exports have surged
Soybean Oil Prices Diverge on Different Supply Situations
 United States Department of Agriculture Foreign Agricultural Service Circular Series FOP 10-09 October 2009 Soybean Oil Prices Diverge on Different Supply Situations Soybean Oil Price ($/ton) $900 $850
As China s Soybean Oil Imports Fall, Production Expands
 United States Department of Agriculture Foreign Agricultural Service Circular Series FOP 10-10 October 2010 As China s Soybean Oil Fall, Expands 12 10 Million Metric Tons 8 6 4 2 0 2006/07 2007/08 China
Regional Vegetable Oil Situation: Cut in Sun Oil Production, Imports Leaves North Africa & the Middle East Looking for Soy & Palm Oil to Fill Demand
 United States Department of Agriculture Foreign Agricultural Service Circular Series FOP 09-07 tember 2007 Regional Vegetable Oil Situation: Cut in Sun Oil, Leaves North Africa & the Middle East Looking
Drought Forecast to Reduce Australian Rapeseed Exports in 2007
 United States Department of Agriculture Foreign Agricultural Service Circular Series FOP 11-06 November 2006 Drought Forecast to Reduce Australian Rapeseed Exports in 2007 1800 1600 1400 1200 1000 800
Growing Fuel Use Limits Exports of Soybean Oil by South America
 United States Department of Agriculture Foreign Agricultural Service Circular Series FOP 11-09 ember 2009 Growing Fuel Use Limits of Soybean Oil by South America 2006/07 Soybean Oil Distribution Soybean
Rising Coconut Oil Prices Foreshadow Tight Supplies in 2007
 United States Department of Agriculture Foreign Agricultural Service Circular Series FOP 2-07 ruary 2007 Rising Coconut Oil Prices Foreshadow Tight Supplies in 2007 800 Coconut Oil Price: CIF Rotterdam
Soybean and Oilseed Meal Import Prospects Higher as Severe Weather Damages EU Crops
 Million Tons Million Tons Million Tons United States Department of Agriculture Foreign Agricultural Service August 2018 Soybean and Oilseed Meal Import Prospects Higher as Severe Weather Damages EU Crops
316 / World Biofuels: FAPRI 2009 Agricultural Outlook. World Ethanol
 WORLD BIOFUELS 316 / World Biofuels: FAPRI 2009 Agricultural Outlook World The world ethanol price increased 13.7% in 2008, to $1.76 per gallon. It is projected to decrease by almost 16%, to $1.48 per
Early-Season U.S. Soybean Meal Sales Surge
 United States Department of Agriculture Foreign Agricultural Service November 2014 Early-Season U.S. Soybean Meal Sales Surge U.S. soybean meal export commitments (accumulated exports plus outstanding
Explosive Growth in Vegetable Oil Demand Exacerbates Chinese Supply Deficit, Reliance on Imports. Imports
 United States Department of Agriculture Foreign Agricultural Service Circular Series FOP 12-07 ember 2007 Million tons 35 Explosive Growth in Vegetable Oil Demand Exacerbates Chinese Supply Deficit, Reliance
Brazil s Soybean Oil Exports Squeezed by Rising Biodiesel Demand
 United States Department of Agriculture Foreign Agricultural Service Circular Series FOP 6-09 e 2009 Brazil s Soybean Oil Exports Squeezed by Rising Biodiesel Demand Soybean Oil Exports and Industrial
Baseline Update for International Livestock Markets
 Baseline Update for International Livestock Markets September 2018 FAPRI-MU Report #04-18 www.fapri.missouri.edu Published by the Food and Agricultural Policy Research Institute (FAPRI) at the University
Macroeconomic Assumptions
 Macroeconomic Assumptions A major factor affecting the global economy this year continues to be weakness in Chinese financial markets and the resulting fallout affecting trading partners dependent on the
U.S. Soybean Exports Forecast to Reach Record
 United States Department of Agriculture Foreign Agricultural Service July 2017 U.S. Soybean Exports Forecast to Reach Record 60 Accumulated Exports by Week Total Commitments of Soybeans as of End of June
China s Rapeseed Meal Imports Rise as Seed Imports Decline
 United States Department of Agriculture Foreign Agricultural Service February 2017 China s Rapeseed Meal Rise as Seed Decline Trend in China Rapeseed 12-Month Moving Totals Trend In China Rapeseed Meal
Palm and Soy Oil Use Expands at Expense of Other Oils
 United States Department of Agriculture Foreign Agricultural Service September 2015 Revised on September 15, 2015 Palm and Soy Oil Use Expands at Expense of Other Oils As global demand for vegetable oil
Pakistan Oilseed Processors Seize Opportunity to Crush Soybeans
 United States Department of Agriculture Foreign Agricultural Service December 2015 Pakistan Oilseed Processors Seize Opportunity to Crush Soybeans Pakistan, long an importer of soybean meal, is transitioning
Share of Brazil s Soybean Exports to China Spikes in August
 United States Department of Agriculture Foreign Agricultural Service September 2018 Share of Brazil s Soybean Exports to China Spikes in August Monthly Share of Brazil's Soybean Exports to China 85% 75%
2017/18 Olive Oil Export Forecast Rises with Slight Growth in Production
 United States Department of Agriculture Foreign Agricultural Service November 2017 Olive Oil Export Forecast Rises with Slight Growth in Production Million Metric Tons 3.4 3.2 3.0 2.8 2.6 Olive Oil Prices
U.S. Soybean Prices Fall as Buyers Focus Turns to South America
 United States Department of Agriculture Foreign Agricultural Service Circular Series FOP 2-10 ruary 2010 U.S. Soybean Prices Fall as Buyers Focus Turns to South America $11.00 Daily U.S. Soybean Cash Price
Devaluation Energizes Argentine Soybean Crush
 United States Department of Agriculture Foreign Agricultural Service March 2016 Devaluation Energizes Argentine Soybean Crush Argentina Quarterly Soybean Crush Volume Exchange Rate* and Constant Dollar
U.S. Soybeans Facing Stiff Competition from Brazil. Brazil Soybean Export Price (Dollars and Reals) and Exchange Rate
 and Exchange Rate") United States Department of Agriculture Foreign Agricultural Service June, 2018 U.S. Soybeans Facing Stiff Competition from Brazil Brazil Soybean Export Price (Dollars and Reals) and Exchange Rate FOB
United States Department of Agriculture Foreign Agricultural Service June, 2018 U.S. Soybeans Facing Stiff Competition from Brazil Brazil Soybean Export Price (Dollars and Reals) and Exchange Rate FOB
Coconut Oil Prices Spike
 United States Department of Agriculture Foreign Agricultural Service Coconut Oil Prices Spike Coconut oil prices have surged over the past year in contrast to the general downward trend in other vegetable
Strong Brazilian Soybean Sales Expected to Slow Rebound in Argentine Exports
 United States Department of Agriculture Foreign Agricultural Service December 2018 Strong Brazilian Soybean Sales Expected to Slow Rebound in Argentine Exports Oct. 1 - Nov. 30 Brazil Soybean Exports (Million
THIS REPORT CONTAINS ASSESSMENTS OF COMMODITY AND TRADE ISSUES MADE BY USDA STAFF AND NOT NECESSARILY STATEMENTS OF OFFICIAL U.S.
 THIS REPORT CONTAINS ASSESSMENTS OF COMMODITY AND TRADE ISSUES MADE BY USDA STAFF AND NOT NECESSARILY STATEMENTS OF OFFICIAL U.S. GOVERNMENT POLICY Required Report - public distribution Date: GAIN Report
OECD FAO Agricultural Outlook
 OECD FAO Agricultural Outlook 2018 2027 ca 4. OILSEEDS AND OILSEED PRODUCTS Chapter 4. Oilseeds and oilseed products This chapter describes the market situation and highlights the latest set of quantitative
China is Key to Slow Pace of U.S. Soybean Exports
 United States Department of Agriculture Foreign Agricultural Service January 2018 China is Key to Slow Pace of U.S. Soybean Exports U.S. and Brazil Soybean Exports by Destination (Accumulated Exports:
2016/17 Global Olive Oil Production Down But Prices Stabilize
 United States Department of Agriculture Foreign Agricultural Service November 2016 Global Olive Oil Down But Prices Stabilize Global Olive Oil and Stocks 4000 3500 5000 Extra Virgin Olive Oil Prices Stabilizing
China 2017/18 Soybean Imports Soar on Appetite for Pork, Aquaculture, and Dairy
 United States Department of Agriculture Foreign Agricultural Service June 2017 China Soybean Soar on Appetite for Pork, Aquaculture, and Dairy China: Booming Farmed Aquaculture Production China: Record
Bangladesh: A Growing Market for U.S. Soybeans
 United States Department of Agriculture Foreign Agricultural Service December 2017 Bangladesh: A Growing Market for U.S. Soybeans 100% 310 3 Meal Equivalent Share 90% 80% 70% 60% 50% 40% 30% 20% 10% Animal
India Soybean Meal Exports: Revised and Rebounding
 United States Department of Agriculture Foreign Agricultural Service January 2017 India Soybean Meal Exports: Revised and Rebounding India Soybean Meal Exports Forecast to Rise in 8.0 Data Series Comparison
Mid-term Outlook for World Agricultural Markets
 Mid-term Outlook for World Agricultural Markets Jacinto Fabiosa Co-Director, (515) 294-6183 jfabiosa@iastate.edu Food and Agricultural Policy Research Institute The Question of Interest? In 27 we asked,
India. Oilseeds and Products Update. February 2012
 THIS REPORT CONTAINS ASSESSMENTS OF COMMODITY AND TRADE ISSUES MADE BY STAFF AND NOT NECESSARILY STATEMENTS OF OFFICIAL U.S. GOVERNMENT POLICY Required Report - public distribution India Oilseeds and Products
World Wheat Supply and Demand Situation
 World Wheat Supply and Demand Situation November 218 Major data source: USDA World Agricultural Supply and Demand Estimates released November, 218. Projections will change over the course of the year depending
Record U.S. Peanut Exports on Strong Shipments to China and Vietnam
 United States Department of Agriculture Foreign Agricultural Service September 2016 Record U.S. Peanut Exports on Strong Shipments to China and Vietnam Thousand Metric Tons 800 700 600 500 400 300 200
World Wheat Supply and Demand Situation October 2018
 World Wheat Supply and Demand Situation October 218 Major data source: USDA World Agricultural Supply and Demand Estimates released October 12, 218. Projections will change over the course of the year
United States Boosts Share in South Korea s Soybean Oil Market
 United States Department of Agriculture Foreign Agricultural Service February, 2018 United States Boosts Share in South Korea s Soybean Oil Market Thousand Metric Tons 350 300 250 200 150 100 50 50% 45%
USDA Projections of Bioenergy-Related Corn and Soyoil Use for
 USDA Projections of Bioenergy-Related Corn and Soyoil Use for 2010-2019 Daniel M. O Brien, Extension Agricultural Economist K-State Research and Extension The United States Department of Agriculture released
China Tariffs Driving U.S. Soybean Exports To the European Union to a 30-Year High
 United States Department of Agriculture Foreign Agricultural Service March 2019 China Tariffs Driving U.S. Soybean Exports To the European Union to a 30-Year High 12-MONTH MOVING TOTAL U.S. SOYBEAN EXPORTS
World Wheat Supply and Demand Situation
 World Wheat Supply and Demand Situation September 218 Major data source: USDA World Agricultural Supply and Demand Estimates released September 12, 218. Projections will change over the course of the year
Soybean Prices Fall on Rising South American Production
 United States Department of Agriculture Foreign Agricultural Service April 2017 Soybean Prices Fall on Rising South American Production Million Tons Change in South America Soybean Production Forecast
EU BIO-FUEL POTENTIAL CHANGES IN INTERNATIONAL RAPESEED TRADE FLOWS
 Mercantile, April 2013 1 EU BIO-FUEL POTENTIAL CHANGES IN INTERNATIONAL RAPESEED TRADE FLOWS GCIRC Technical Meeting 2013 Mercantile Consulting Venture Inc. Marlene Boersch Mercantile, April 2013 2 Overview
Contents of Paper. 06-Jan-17 SIGNIFICANCE OF COMMODITIES SECTOR TO MALAYSIAN ECONOMY, WITH EMPHASIS ON OIL PALM
 SIGNIFICANCE OF COMMODITIES SECTOR TO MALAYSIAN ECONOMY, WITH EMPHASIS ON OIL PALM Ahmad Fauzi, Puasa Deputy Director Malaysian Institute of Economic Research (MIER) 17 January 2017 Contents of Paper World
AOF Forum Oilseeds Outlook October, 2006
 AOF Forum Oilseeds Outlook October, 2006 Josh Roberts Senior Trading Manager Grain Pool Pty Ltd 30 Delhi Street West Perth Tel: +61 8 9237 9859 josh.roberts@grainpool.com.au Oilseeds trends versus other
World Wheat Supply and Demand Situation December 2018
 World Wheat Supply and Demand Situation December 218 Major data source: USDA World Agricultural Supply and Demand Estimates released December 11, 218. Projections will change over the course of the year
World Wheat Supply and Demand Situation August 2018
 World Wheat Supply and Demand Situation August 218 Major data source: USDA World Agricultural Supply and Demand Estimates released August 1, 218. Projections will change over the course of the year depending
FAPRI - Iowa State University
 FAPRI 26 World Agricultural Outlook FAPRI - Iowa State University John Beghin, FAPRI Director Fengxia Dong, International Dairy Analyst Amani Elobeid, International Sugar Analyst Jay Fabiosa, Technical
Chapter 4. Oilseeds and oilseed products
 4. OILSEEDS AND OILSEED PRODUCTS Chapter 4. Oilseeds and oilseed products This chapter describes the market situation and highlights the latest set of quantitative medium-term projections for world and
Corn & Bean Producers-1
 Largest Corn Producing Countries - 2016 est. Largest Corn Importing Countries - 2016 est. (Marketing year - thousands of hectares, tons per hectare, and thousands of metric tons) (Marketing year - thousands
World Wheat Supply and Demand Situation March 2018
 World Wheat Supply and Demand Situation March 218 Major data source: USDA World Agricultural Supply and Demand Estimates released March 8, 218. Projections will change over the course of the year depending
Market Report INTERNATIONAL GRAINS COUNCIL. HIGHLIGHTS WORLD ESTIMATES
 Grain GMR 467 1 July 2016 INTERNATIONAL GRAINS COUNCIL www.igc.int Market Report HIGHLIGHTS The forecast for total grains (wheat and coarse grains) production in 2016/17 is up by 10m t m/m (month-on-month),
Citrus: World Markets and Trade
 United States Department of Agriculture Foreign Agricultural Service uary 2015 Citrus: World Markets and Trade Oranges Global orange production for is forecast to decline 4 percent from the previous year
Sunflower Oil Imports Increase for Ration Card Program
 THIS REPORT CONTAINS ASSESSMENTS OF COMMODITY AND TRADE ISSUES MADE BY USDA STAFF AND NOT NECESSARILY STATEMENTS OF OFFICIAL U.S. GOVERNMENT POLICY Required Report - public distribution Date: GAIN Report
FAPRI 2006 Preliminary Baseline December 15-16, 2005
 FAPRI 26 Preliminary Baseline December 15-16, 25 INTERNATIONAL DAIRY FAPRI Food and Agricultural Policy Research Institute Fengxia Dong (515) 294-47 fdong@iastate.edu Center for Agricultural and Rural
WORLD DAIRY PRODUCTS
 WORLD DAIRY PRODUCTS 376 / World Dairy Products: FAPRI 2001 Agricultural Outlook World Dairy Products A reduction in U.S. exports coupled with strong import demand pushed up international prices for NFD
Corn Outlook. David Miller Director of Research & Commodity Services Iowa Farm Bureau Federation December 2013
 Corn Outlook David Miller Director of Research & Commodity Services Iowa Farm Bureau Federation December 2013 Source: USDA-WAOB U.S. Corn Supply & Usage U.S. Corn Supply & Usage Comments With the largest
External Market Factors Impacting US Soybean Meal
 External Market Factors Impacting US Soybean Meal USSEC Luncheon International Production and Processing Expo January 3, 213 Atlanta, GA Paul Smolen Presentation Objectives Examine the economic drivers
Citrus: World Markets and Trade
 United States Department of Agriculture Foreign Agricultural Service July 2015 Citrus: World Markets and Trade Oranges Global orange production for is estimated to decline 7 percent from the previous year
Business potential and challenges from the private sector perspective
 Business potential and challenges from the private sector perspective The Argentine crushing industry can be an efficient ally of the Chinese low cost meat producers, combining strengths in favor of the
Grain: World Markets and Trade
 United States Department of Agriculture Foreign Agricultural Service Circular Series FG 6-2 June 22 Grain: World Markets and Trade Corn Competition Continues to Contract 2/1 21/2 22/3 U.S. S. America China
IGC GRAINS CONFERENCE 2012: London - 7 June for futher details see INTERNATIONAL GRAINS COUNCIL GRAIN MARKET REPORT EXPORT PRICES
 IGC GRAINS CONFERENCE 2012: London - 7 June for futher details see www.igc.int INTERNATIONAL GRAINS COUNCIL GRAIN MARKET REPORT www.igc.int GMR No. 422 24 May 2012 WORLD ESTIMATES million tons 08/09 09/10
FAPRI 2002 World Agricultural Outlook Briefing Book
 FAPRI 22 World Agricultural Outlook Briefing Book FAPRI 22 World Agricultural Outlook FAPRI - Iowa State University 3 Bruce Babcock, CARD Director 3 John Beghin, FAPRI Director 3 Jay Fabiosa, Technical
Linu Mathew Philip. Centre for Trade and Development (Centad), New Delhi, India
, New Delhi, India") Linu Mathew Philip Centre for Trade and Development (Centad), New Delhi, India Regional Dialogue in Biofuels in Asia 9-10 November 2009 Relevance of Biofuel in the new context Trends Production Consumption
Linu Mathew Philip Centre for Trade and Development (Centad), New Delhi, India Regional Dialogue in Biofuels in Asia 9-10 November 2009 Relevance of Biofuel in the new context Trends Production Consumption
280 / World Cotton: FAPRI 2005 Agricultural Outlook. World Cotton
 WORLD COTTON 280 / World Cotton: FAPRI 2005 Agricultural Outlook World Cotton The 2004/05 crop can be characterized simply as record breaking. A record 35.8 mha of cotton were harvested, producing a record
Five-year global supply and demand projections
 December 2016 International Grains Council Five-year global supply and demand projections Executive Summary The projections outlined in this report represent a possible supply and demand scenario for the
Citrus: World Markets and Trade
 United States Department of Agriculture Foreign Agricultural Service January 2017 Citrus: World Markets and Trade Oranges Global orange production for 2016/17 is forecast up 2.4 million metric tons from
Global Oilseed Production: Trends, Drivers, Competition. Prof. Dr. Folkhard Isermeyer Thünen Institute, Braunschweig, Germany
 Global Oilseed Production: Trends, Drivers, Competition Prof. Dr. Folkhard Isermeyer Thünen Institute, Braunschweig, Germany Folkhard Isermeyer October 2015 Content 1 Production Acreage Production 2 Trade
U.S. Soybean Export Forecast Declines This Month by 1.4 MMT South American Export Forecast Increases
 United States Department of Agriculture Foreign Agricultural Service Circular Series FOP 12-05 December 2005 U.S. Soybean Export Forecast Declines This Month by 1.4 MMT South American Export Forecast Increases
EU-25 Soybean Crush Forecast to Decline in 2005/06
 United States Department of Agriculture Foreign Agricultural Service Circular Series FOP 3-06 March 2006 EU-25 Soybean Crush Forecast to Decline in 2005/06 EU-25 Soybean Crush 20 19 18 17 Million tons
EU Oilseed Complex Trade 2017/18 Marketing Year July - June. AGRI G 4 Committee for the Common Organisation of Agricultural Markets 30 August 2018
 EU Oilseed Complex Trade 2017/18 Marketing Year July - June AGRI G 4 Committee for the Common Organisation of Agricultural Markets 30 August 2018 EU MS importing all oilseeds July - June +7% NL 4 240 4
Indonesia Palm Oil Industry: Current Status and Outlook 2018
 Indonesia Palm Oil Industry: Current Status and Outlook 2018 M. Fadhil Hasan Director of Corporate Affairs Asian Agri Group Board Member of Indonesian Palm Oil Association (IPOA) Outline World palm oil
Palm Oil the Leader in Global Oils & Fats Supply
 Palm Oil the Leader in Global Oils & Fats Supply Presentation at the Malaysia / Myanmar Palm Oil Trade Fair & Seminar in Yangon on June, 13 there somebody to pick me up tomorrow at the airport Thomas Mielke,
2018 Outlook for Grains and Oilseeds
 2018 Outlook for Grains and Oilseeds Present to the American Fats and Oils Associa;on October 2017 AdvancedEconomicSolu0ons US$ Declines from Peak - Now at lowest point since October 2015 Currently in
Developments for Palm Oil in Global Market
 Developments for Palm Oil in Global Market American Palm Oil Council American Palm Oil Council US Regional Office for Malaysian Palm Oil Council (MPOC) Presentation Outline Global Oils & Fats Scenario
World Meat Prices. World Meat Production and Trade. 240 / World Meat: FAPRI 2002 Agricultural Outlook. Dollars per CWT 90.
 WORLD MEAT 240 / World Meat: FAPRI 2002 Agricultural Outlook World Meat Prices Dollars per CWT 90 80 70 60 50 40 30 20 10 0 1991 1993 1995 1997 1999 2001 2003 2005 2007 2009 2011 World Meat and Trade Million
THIS REPORT CONTAINS ASSESSMENTS OF COMMODITY AND TRADE ISSUES MADE BY USDA STAFF AND NOT NECESSARILY STATEMENTS OF OFFICIAL U.S.
 THIS REPORT CONTAINS ASSESSMENTS OF COMMODITY AND TRADE ISSUES MADE BY USDA STAFF AND NOT NECESSARILY STATEMENTS OF OFFICIAL U.S. GOVERNMENT POLICY Required Report - public distribution Oilseeds and Products
Market Report. Grain HIGHLIGHTS INTERNATIONAL GRAINS COUNCIL. WORLD ESTIMATES. GMR November 2018
 Grain INTERNATIONAL GRAINS COUNCIL www.igc.int Market Report GMR 494 22 November 2018 HIGHLIGHTS With small adjustments for wheat, maize and sorghum, the forecast for world total grains (wheat and coarse
Prospects for EU agricultural markets and income
 European Commission, DG Agriculture and Rural Development December 2014 http://ec.europa.eu/agriculture/markets-and-prices/medium-term-outlook/index_en.htm Baseline assumptions on key macroeconomic variable,
Monthly Economic Letter
 Monthly Economic Letter Cotton Market Fundamentals & Price Outlook RECENT PRICE MOVEMENT The global cotton market was volatile over the past month, with values for most benchmark prices moving strongly
THIS REPORT CONTAINS ASSESSMENTS OF COMMODITY AND TRADE ISSUES MADE BY USDA STAFF AND NOT NECESSARILY STATEMENTS OF OFFICIAL U.S.
 THIS REPORT CONTAINS ASSESSMENTS OF COMMODITY AND TRADE ISSUES MADE BY STAFF AND NOT NECESSARILY STATEMENTS OF OFFICIAL U.S. GOVERNMENT POLICY Required Report - public distribution Indonesia Oilseeds and
Algeria. Grain and Feed Update. Wheat update
 THIS REPORT CONTAINS ASSESSMENTS OF COMMODITY AND TRADE ISSUES MADE BY USDA STAFF AND NOT NECESSARILY STATEMENTS OF OFFICIAL U.S. GOVERNMENT POLICY Required Report - public distribution Grain and Feed
Growing Dependence on Palm Oil in World Trade and Consumption
 Growing Dependence on Palm Oil in World Trade and Consumption Plenary Lecture at the Malaysia Russia Palm Oil Trade Fair & Seminar (POTS) there somebody in Moscow to pick on me 16 Sept up tomorrow 2013
Grain: World Markets and Trade
 United States Department of Agriculture Foreign Agricultural Service Circular Series FG12-01 December 2001 Grain: World Markets and Trade EU Changes Impact Global Wheat Markets Million Metric Tons Wheat
GLOBAL AND REGIONAL NEW-CROP OUTLOOK FOR OILSEEDS
 GLOBAL AND REGIONAL NEW-CROP OUTLOOK FOR OILSEEDS GRAIN ACADEMY 2018 01 NOVEMBER 2018, Varna/BULGARIA AGENDA 1-OILSEEDS OUTLOOK GLOBALLY 2 OILSEEDS OUTLOOK IN BLACK SEA 3 2018/19 NEW-SEASON PROSPECTS 4-
Crop Market Outlook 8/22/2017
 MSU is an affirmativeaction, equal-opportunity employer. Michigan State University Extension programs and materials are open to all without regard to race, color, national origin, gender, gender identity,
Grain: World Markets and Trade
 Department of Agriculture Foreign Agricultural Service Circular Series FG 11-1 Nov 21 Grain: World Markets and Trade Global Wheat and Coarse Grain Ending Stocks Drop MMT 8 6 4 2-2 -4-6 -8 Year-to-Year