Macroeconomic Assumptions
|
|
|
- Baldric Lawson
- 6 years ago
- Views:
Transcription
1 Macroeconomic Assumptions
2 A major factor affecting the global economy this year continues to be weakness in Chinese financial markets and the resulting fallout affecting trading partners dependent on the Chinese markets as economic growth from that country has slowed. In addition, markets around the world are intertwined with Chinese financial markets, and many have taken large blows in late 2015 and early The risks of a bursting financial bubble have increased in recent months. Many oil exporters are seeing their economies slow considerably from the precipitous drop in petroleum prices. Since the middle of 2014, tanking petroleum prices have put the Russian economy on shaky ground. The European Union is suffering because of the dependence on trade with Russia. The U.S. economy is expected to expand at rates near long-term potential in On the other hand, Canada is seeing lower economic growth with lower energy prices, which provide vital export earnings. Japan s expansion will again be modest, although exceed the performance of last year. Developing regions are expected to accelerate in 2016, but not reach pre-recession rates of growth. The slowing in population growth rates will persist in all global regions in the long term. Annual global population expansion will fall below 1% within the next 10 years, although individual nations growth rates will vary considerably. Population growth ticked up in 2015 and is expected to be somewhat higher again in The Middle East unrest has pushed many refugees from their homelands and a large proportion of those people are heading for developed countries, especially in Europe and North America. There are political issues surrounding the settlement of refugees which will ultimately impact regional population shifts. Developing and emerging economies are projected to exhibit significant slowing in population growth. However, even with economic and geo-political issues, developing nations overall will still have by far the highest growth rates. Emerging nations will experience slower than average population growth. With high overall income growth, this group of nations will enjoy robust per capita income increases, substantially increasing purchasing power, especially once the economies of China and Russia regain strength. Despite high total GDP growth in developing countries, rapid increases in population dilute per capita income expansion and constrain improvements in standards of living. Food and feed demand will increase primarily as a result of population growth in many of the poorest nations until income thresholds are reached that enable improved diets and increased demand for consumer goods. Some of the poorest nations have incomes below the developing nation average of $2,100, and those populations often live on subsistence agriculture, without much ability to purchase additional food.
3
4 The U.S. dollar strengthened relative to a global basket of currencies last year and is expected to continue to appreciate in 2016 then settle somewhat in the following year before stabilizing thereafter. The broad strengthening of the dollar will reduce competitiveness of U.S. goods in the short to medium term. The currencies of Japan, Russia, and the European Union weakened substantially against the dollar in All will continue to weaken, although at a slower rate this year. In addition, the currencies of Argentina and Brazil will weaken significantly against the dollar in Overall, developing country currencies will weaken the most relative to the dollar. Depreciation of local currencies is expected to occur widely in Africa and Latin America. While depreciation of currencies, especially steep and rapid weakening causes reduced ability to purchase goods in the short and medium term, often longer-term effects are mitigated by adjustment in the relative price levels of the importing vis-à-vis the exporting country. As such, longer-term real purchasing power is expected to eventually return to similar levels as those prior to the recent currency adjustments. Emerging countries real exchange rates are actually expected to appreciate after 2016, led by the stabilization and eventual strengthening of the Chinese yuan. Developed and developing nation currencies are expected to strengthen for a few years after 2016 before stabilizing for the remainder of the projection period. The overall long-term picture is for one of fairly consistent purchasing power relative to the dollar to return before 2020, and be maintained for the remainder of the outlook. As such, U.S. goods should regain competitiveness on world markets. The Chinese yuan will stabilize relative to the dollar from 2017 through 2020, as that country s financial system regains firmer footing. At that point it will appreciate in the second half of the projection period. This is a significantly weaker view of the yuan in the sort to medium term than in previous baseline projections and could impact trade with the U.S. The Euro is currently facing challenges that are resulting in weakening against the dollar. As the Eurozone countries are projected to get their fiscal situations back on track and emerge successfully from the current financial crisis after 2016, the Euro will appreciate slowly against the dollar.
5
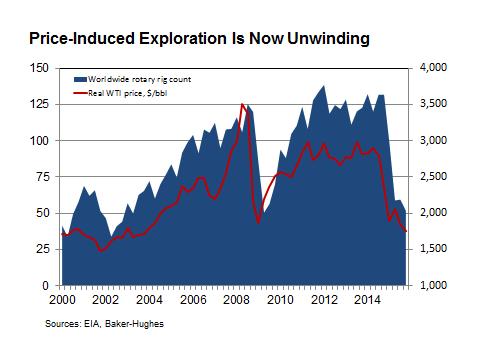
6 The outlook for crude oil prices is for the recent slide to end this year, with an average below $50 per barrel. In recent weeks, petroleum prices have fallen below $40, and have even dipped temporarily below $30. Steady, yet moderate price increases are projected thereafter but staying below $90 per barrel by Oil price outlooks always have substantial risk around them, however, this year the uncertainty seems to be even greater. Factors including the still slow growth of the global economy, the pace of Saudi production, the war against ISIS in Syria and Iraq with consequences for Iraqi production and deliveries, excess production capacity resulting from recent exploration and development, and sizeable reserves existing in various production region around the world all suggest that volatility could increase in petroleum markets. In the past several years, extended periods of high prices induced substantial exploration and expansion of production capacity that is beyond current demand. As a result, some of this capacity has been idled with current low prices. However, as prices strengthen, this capacity could come back on line in a relatively short time. This presents a downward risk for crude oil prices in the short to medium term. In addition, recent lower prices have resulted in a steep drop in exploration activity. Global rotary rig counts are only around half of what they were two years ago. As developed production capacity becomes utilized over time, exploration and development activity will again increase. Without additional geo-political shocks, the petroleum price increases should be able to induce drilling at a pace to prevent steep price spikes. The drop in distillate prices resulting from the lowest crude oil prices since 2005 will provide a boost to consumers and the economies of oil importing nations in the next few years. Oil exporters are facing substantial declines in export earnings. The combination of economic sanctions and lower crude oil prices is severely hampering the economy of Russia. Agriculture will benefit from lower fuel prices in terms of lower production and transportation costs. Lower fuel costs not only make it less expensive to operate machinery, but will also reduce costs for purchased inputs.
7
8 Macroeconomic Indicators Real GDP World Algeria Argentina Australia Bangladesh Brazil Canada China Egypt Ethiopia EU India Indonesia Iran Japan Kazakhstan Malaysia Mexico Morocco Nigeria Pakistan Paraguay Philippines Russia Saudi Arabia South Korea Sudan Thailand Turkey Ukraine Uzbekistan United States Rest of world Wheat Rice Corn Barley Sorghum Soybeans Rapeseed Sunflowerseed Palm oil Cotton
9 Macroeconomic Indicators Real GDP World Algeria Argentina Australia Bangladesh Brazil Canada China Egypt Ethiopia EU India Indonesia Iran Japan Kazakhstan Malaysia Mexico Morocco Nigeria Pakistan Paraguay Philippines Russia Saudi Arabia South Korea Sudan Thailand Turkey Ukraine Uzbekistan United States Rest of world Wheat Rice Corn Barley Sorghum Soybeans Rapeseed Sunflowerseed Palm oil Cotton
10 GDP Deflator Algeria Argentina Australia Bangladesh Brazil Canada China Egypt Ethiopia EU India Indonesia Iran Japan Kazakhstan Malaysia Mexico Morocco Nigeria Pakistan Paraguay Philippines Russia Saudi Arabia South Africa South Korea Sudan Thailand Turkey Ukraine Uzbekistan United States
11 GDP Deflator Algeria Argentina Australia Bangladesh Brazil Canada China Egypt Ethiopia EU India Indonesia Iran Japan Kazakhstan Malaysia Mexico Morocco Nigeria Pakistan Paraguay Philippines Russia Saudi Arabia South Africa South Korea Sudan Thailand Turkey Ukraine Uzbekistan United States
12 Exchange Rate Algeria Argentina Australia Bangladesh Brazil Canada China Egypt Ethiopia EU India Indonesia Iran Japan Kazakhstan Malaysia Mexico Morocco Nigeria Pakistan Paraguay Philippines Russia Saudi Arabia South Africa South Korea Sudan Thailand Turkey Ukraine Uzbekistan United States, trd wtd
13 Exchange Rate Algeria Argentina Australia Bangladesh Brazil Canada China Egypt Ethiopia EU India Indonesia Iran Japan Kazakhstan Malaysia Mexico Morocco Nigeria Pakistan Paraguay Philippines Russia Saudi Arabia South Africa South Korea Sudan Thailand Turkey Ukraine Uzbekistan United States, trd wtd
14 Population World Algeria Argentina Australia Bangladesh Brazil Canada China Egypt Ethiopia EU India Indonesia Iran Japan Kazakhstan Malaysia Mexico Morocco Nigeria Pakistan Paraguay Philippines Russia Saudi Arabia South Africa South Korea Sudan Thailand Turkey Ukraine Uzbekistan United States Rest of world Wheat Rice Corn Barley Sorghum Soybeans Rapeseed Sunflowerseed Palm oil Cotton
15 Population World Algeria Argentina Australia Bangladesh Brazil Canada China Egypt Ethiopia EU India Indonesia Iran Japan Kazakhstan Malaysia Mexico Morocco Nigeria Pakistan Paraguay Philippines Russia Saudi Arabia South Africa South Korea Sudan Thailand Turkey Ukraine Uzbekistan United States Rest of world Wheat Rice Corn Barley Sorghum Soybeans Rapeseed Sunflowerseed Palm oil Cotton
FAPRI Food and Agricultural Policy Research Institute
 26 WORLD OUTLOOK Presentation Food and Agricultural Policy Research Institute Global Macroeconomic Overview Sustained and widespread real economic growth for the decade averaging 3.1%. Industrialized countries
Oilseeds and Products
 Oilseeds and Products Oilseeds compete with major grains for area. As a result, weather impacts soybeans, rapeseed, and sunflowerseed similarly to the grain and other crops grown in the same regions. The
Soybean Oil Prices Diverge on Different Supply Situations
 United States Department of Agriculture Foreign Agricultural Service Circular Series FOP 10-09 October 2009 Soybean Oil Prices Diverge on Different Supply Situations Soybean Oil Price ($/ton) $900 $850
As China s Soybean Oil Imports Fall, Production Expands
 United States Department of Agriculture Foreign Agricultural Service Circular Series FOP 10-10 October 2010 As China s Soybean Oil Fall, Expands 12 10 Million Metric Tons 8 6 4 2 0 2006/07 2007/08 China
Oilseeds and Products
 Oilseeds and Products Oilseeds compete with major grains for area. As a result, weather impacts soybeans, rapeseed, and sunflowerseed similarly to grain and other crops grown in the same regions. The same
Sharp Decline in Vegetable Oil Stocks Leads to Steeply Higher Prices
 United States Department of Agriculture Foreign Agricultural Service Circular Series FOP 1-11 Sharp Decline in Vegetable Oil Leads to Steeply Higher Prices Commodity prices have been on an upward trend
Drought in South America to Limit Soybean Exports
 United States Department of Agriculture Foreign Agricultural Service Circular Series FOP 2-09 ruary 2009 Drought in South America to Limit Soybean Exports Million Tons 16 14 12 10 8 6 4 2 Annual Change
Weak Real to Boost Brazil s Soybean Exports in 2016
 United States Department of Agriculture Foreign Agricultural Service October 2015 Weak Real to Boost Brazil s Soybean Exports in 2016 Brazil s exchange rate is having a significant impact on domestic and
Early-Season U.S. Soybean Meal Sales Surge
 United States Department of Agriculture Foreign Agricultural Service November 2014 Early-Season U.S. Soybean Meal Sales Surge U.S. soybean meal export commitments (accumulated exports plus outstanding
Brazil s Soybean Oil Exports Squeezed by Rising Biodiesel Demand
 United States Department of Agriculture Foreign Agricultural Service Circular Series FOP 6-09 e 2009 Brazil s Soybean Oil Exports Squeezed by Rising Biodiesel Demand Soybean Oil Exports and Industrial
IGC GRAINS CONFERENCE 2012: London - 7 June for futher details see INTERNATIONAL GRAINS COUNCIL GRAIN MARKET REPORT EXPORT PRICES
 IGC GRAINS CONFERENCE 2012: London - 7 June for futher details see www.igc.int INTERNATIONAL GRAINS COUNCIL GRAIN MARKET REPORT www.igc.int GMR No. 422 24 May 2012 WORLD ESTIMATES million tons 08/09 09/10
Growing Soybean Oil Price Raises Oil s Contribution to Total Soybean Value
 United States Department of Agriculture Foreign Agricultural Service Circular Series FOP 10-07 October 2007 Growing Soybean Oil Price Raises Oil s Contribution to Total Soybean Value Relative Share Value:
Regional Vegetable Oil Situation: Cut in Sun Oil Production, Imports Leaves North Africa & the Middle East Looking for Soy & Palm Oil to Fill Demand
 United States Department of Agriculture Foreign Agricultural Service Circular Series FOP 09-07 tember 2007 Regional Vegetable Oil Situation: Cut in Sun Oil, Leaves North Africa & the Middle East Looking
Soybean Trade Growth: A Story of Brazil, the United States, and China
 United States Department of Agriculture Foreign Agricultural Service October 2017 Soybean Trade Growth: A Story of Brazil, the United States, and China 12-Month Soybean Export Growth Year Ending September
Growing Fuel Use Limits Exports of Soybean Oil by South America
 United States Department of Agriculture Foreign Agricultural Service Circular Series FOP 11-09 ember 2009 Growing Fuel Use Limits of Soybean Oil by South America 2006/07 Soybean Oil Distribution Soybean
Argentine Exporters Switch to Soybean Oil as Biodiesel Exports Fall
 United States Department of Agriculture Foreign Agricultural Service Circular Series FOP 08-13 Argentine Exporters Switch to Soybean Oil as Biodiesel Exports Fall Argentina s soybean oil exports have surged
Coconut Oil Prices Spike
 United States Department of Agriculture Foreign Agricultural Service Coconut Oil Prices Spike Coconut oil prices have surged over the past year in contrast to the general downward trend in other vegetable
China s Global Peanut Export Share Declines
 United States Department of Agriculture Foreign Agricultural Service Circular Series FOP 07-13 China s Global Peanut Export Share Declines U.S. 10% Others 19% Argentina 17% U.S. 11% Others 16% Argentina
CHARTS AND PRICE PROJECTIONS
 CHARTS AND PRICE PROJECTIONS 18 / Charts and Price Projections: FAPRI 27 Agricultural Outlook Average Annual GDP Growth Percent Change 9 8 7 6 4 3 2 1 26-216 Canada China EU NMS EU- India Japan Latin America
Grain: World Markets and Trade
 United States Department of Agriculture Foreign Agricultural Service Circular Series FG 6-2 June 22 Grain: World Markets and Trade Corn Competition Continues to Contract 2/1 21/2 22/3 U.S. S. America China
Share of Brazil s Soybean Exports to China Spikes in August
 United States Department of Agriculture Foreign Agricultural Service September 2018 Share of Brazil s Soybean Exports to China Spikes in August Monthly Share of Brazil's Soybean Exports to China 85% 75%
Soybean and Oilseed Meal Import Prospects Higher as Severe Weather Damages EU Crops
 Million Tons Million Tons Million Tons United States Department of Agriculture Foreign Agricultural Service August 2018 Soybean and Oilseed Meal Import Prospects Higher as Severe Weather Damages EU Crops
U.S. Soybean Prices Fall as Buyers Focus Turns to South America
 United States Department of Agriculture Foreign Agricultural Service Circular Series FOP 2-10 ruary 2010 U.S. Soybean Prices Fall as Buyers Focus Turns to South America $11.00 Daily U.S. Soybean Cash Price
Indian Soybean Meal Exports Unlikely to Recover in 2015/16
 United States Department of Agriculture Foreign Agricultural Service November 2015 Indian Soybean Meal Exports Unlikely to Recover in Though once a significant regional exporter of soybean meal, India
Devaluation Energizes Argentine Soybean Crush
 United States Department of Agriculture Foreign Agricultural Service March 2016 Devaluation Energizes Argentine Soybean Crush Argentina Quarterly Soybean Crush Volume Exchange Rate* and Constant Dollar
CHARTS AND PRICE PROJECTIONS
 CHARTS AND PRICE PROJECTIONS 18 / Charts and Price Projections: FAPRI 28 Agricultural Outlook Average Annual GDP Growth, 27-217 Percent Change 1 8 8.4 7.92 6 4 4.44 3.67 4.6 4.34 2 2.37 2.17 1.38 2.44
Rising Coconut Oil Prices Foreshadow Tight Supplies in 2007
 United States Department of Agriculture Foreign Agricultural Service Circular Series FOP 2-07 ruary 2007 Rising Coconut Oil Prices Foreshadow Tight Supplies in 2007 800 Coconut Oil Price: CIF Rotterdam
Explosive Growth in Vegetable Oil Demand Exacerbates Chinese Supply Deficit, Reliance on Imports. Imports
 United States Department of Agriculture Foreign Agricultural Service Circular Series FOP 12-07 ember 2007 Million tons 35 Explosive Growth in Vegetable Oil Demand Exacerbates Chinese Supply Deficit, Reliance
China Soybean Imports Stagnant Despite Record Consumption as Production Rebounds
 United States Department of Agriculture Foreign Agricultural Service Circular Series FOP 9-08 tember 2008 China Soybean Stagnant Despite Record Consumption as Rebounds Million Tons 60 50 40 30 20 10 0
U.S. Soybeans Facing Stiff Competition from Brazil. Brazil Soybean Export Price (Dollars and Reals) and Exchange Rate
 and Exchange Rate") United States Department of Agriculture Foreign Agricultural Service June, 2018 U.S. Soybeans Facing Stiff Competition from Brazil Brazil Soybean Export Price (Dollars and Reals) and Exchange Rate FOB
United States Department of Agriculture Foreign Agricultural Service June, 2018 U.S. Soybeans Facing Stiff Competition from Brazil Brazil Soybean Export Price (Dollars and Reals) and Exchange Rate FOB
China s Rapeseed Meal Imports Rise as Seed Imports Decline
 United States Department of Agriculture Foreign Agricultural Service February 2017 China s Rapeseed Meal Rise as Seed Decline Trend in China Rapeseed 12-Month Moving Totals Trend In China Rapeseed Meal
Corn & Bean Producers-1
 Largest Corn Producing Countries - 2016 est. Largest Corn Importing Countries - 2016 est. (Marketing year - thousands of hectares, tons per hectare, and thousands of metric tons) (Marketing year - thousands
Palm and Soy Oil Use Expands at Expense of Other Oils
 United States Department of Agriculture Foreign Agricultural Service September 2015 Revised on September 15, 2015 Palm and Soy Oil Use Expands at Expense of Other Oils As global demand for vegetable oil
Grain: World Markets and Trade
 Department of Agriculture Foreign Agricultural Service Circular Series FG 12-1 Dec 21 Grain: World Markets and Trade Abundant Global Rice Supplies Contrast With a Tight Wheat Supply Situation Milled Rice
U.S. Soybean Exports Forecast to Reach Record
 United States Department of Agriculture Foreign Agricultural Service July 2017 U.S. Soybean Exports Forecast to Reach Record 60 Accumulated Exports by Week Total Commitments of Soybeans as of End of June
Pakistan Oilseed Processors Seize Opportunity to Crush Soybeans
 United States Department of Agriculture Foreign Agricultural Service December 2015 Pakistan Oilseed Processors Seize Opportunity to Crush Soybeans Pakistan, long an importer of soybean meal, is transitioning
Grain: World Markets and Trade
 Department of Agriculture Foreign Agricultural Service Circular Series FG 11-6 November 6 Grain: World Markets and Trade Tightening World Grain Supplies Push Prices to Decade-High Levels Global Grain Stocks
Grain: World Markets and Trade
 Department of Agriculture Foreign Agricultural Service Circular Series FG 1-7 October 27 Grain: World Markets and Trade Australian Wheat Exports Plummet MMT 18 16 14 12 1 8 6 4 2 Wheat Barley 24/2 2/26
Strong Brazilian Soybean Sales Expected to Slow Rebound in Argentine Exports
 United States Department of Agriculture Foreign Agricultural Service December 2018 Strong Brazilian Soybean Sales Expected to Slow Rebound in Argentine Exports Oct. 1 - Nov. 30 Brazil Soybean Exports (Million
China Tariffs Driving U.S. Soybean Exports To the European Union to a 30-Year High
 United States Department of Agriculture Foreign Agricultural Service March 2019 China Tariffs Driving U.S. Soybean Exports To the European Union to a 30-Year High 12-MONTH MOVING TOTAL U.S. SOYBEAN EXPORTS
Grain: World Markets and Trade
 Department of Agriculture Foreign Agricultural Service Circular Series FG 2-1 February 21 Grain: World Markets and Trade Barley: A Decade of Change & Export Redistribution 1999/ 29/1 1. MMT Exports 1 MMT
Primary energy. 8 Consumption 9 Consumption by fuel. 67 th edition
 Primary energy 8 Consumption 9 Consumption by fuel 67 th edition Primary energy Consumption* Growth rate per annum Million tonnes oil equivalent 27 28 29 2 211 212 213 214 215 216 217 217 26-16 Share 217
Grain: World Markets and Trade
 Department of Agriculture Foreign Agricultural Service Circular Series FG 11-1 Nov 21 Grain: World Markets and Trade Global Wheat and Coarse Grain Ending Stocks Drop MMT 8 6 4 2-2 -4-6 -8 Year-to-Year
Grain: World Markets and Trade
 United States Department of Agriculture Foreign Agricultural Service Circular Series FG 1-6 January 26 Grain: World Markets and Trade Larger Harvests Boost Australian Grain Exports MMT 4 Total Grain Production
Grain: World Markets and Trade
 United States Department of Agriculture Foreign Agricultural Service Circular Series FG 9-4 September 24 Grain: World Markets and Trade China To Be Net Grain Importer, As Supplies Continue To Fall Million
316 / World Biofuels: FAPRI 2009 Agricultural Outlook. World Ethanol
 WORLD BIOFUELS 316 / World Biofuels: FAPRI 2009 Agricultural Outlook World The world ethanol price increased 13.7% in 2008, to $1.76 per gallon. It is projected to decrease by almost 16%, to $1.48 per
Record U.S. Peanut Exports on Strong Shipments to China and Vietnam
 United States Department of Agriculture Foreign Agricultural Service September 2016 Record U.S. Peanut Exports on Strong Shipments to China and Vietnam Thousand Metric Tons 800 700 600 500 400 300 200
2016/17 Global Olive Oil Production Down But Prices Stabilize
 United States Department of Agriculture Foreign Agricultural Service November 2016 Global Olive Oil Down But Prices Stabilize Global Olive Oil and Stocks 4000 3500 5000 Extra Virgin Olive Oil Prices Stabilizing
Grain: World Markets and Trade
 United States Department of Agriculture Foreign Agricultural Service Circular Series FG 4-3 April 23 Grain: World Markets and Trade New Suppliers Displace EU in Shrinking World Flour Trade 12 1 MMT 8 6
Grain: World Markets and Trade
 Department of Agriculture Foreign Agricultural Service Circular Series FG 1-1 January 21 Grain: World Markets and Trade U.S. Wheat Exports Fall Despite Middle East Import Boom MMT 3 2 Import forecast,
FAPRI - Iowa State University
 FAPRI 26 World Agricultural Outlook FAPRI - Iowa State University John Beghin, FAPRI Director Fengxia Dong, International Dairy Analyst Amani Elobeid, International Sugar Analyst Jay Fabiosa, Technical
I. World trade in Overview
 I. World trade in - Overview Table I.1 Growth in the volume of world merchandise exports and production, 2-5 (Annual percentage change) 2-5 23 24 World merchandise exports 4.5 5. 9.5 6. Agricultural products
U.S. Soybean Export Forecast Declines This Month by 1.4 MMT South American Export Forecast Increases
 United States Department of Agriculture Foreign Agricultural Service Circular Series FOP 12-05 December 2005 U.S. Soybean Export Forecast Declines This Month by 1.4 MMT South American Export Forecast Increases
India Soybean Meal Exports: Revised and Rebounding
 United States Department of Agriculture Foreign Agricultural Service January 2017 India Soybean Meal Exports: Revised and Rebounding India Soybean Meal Exports Forecast to Rise in 8.0 Data Series Comparison
OECD FAO Agricultural Outlook
 OECD FAO Agricultural Outlook 2018 2027 ca 4. OILSEEDS AND OILSEED PRODUCTS Chapter 4. Oilseeds and oilseed products This chapter describes the market situation and highlights the latest set of quantitative
BP Statistical Review of World Energy June 2017
 BP Statistical Review of World Energy June 217 Primary energy 8 Consumption 8 Consumption by fuel 9 66 th edition Primary energy Consumption* Growth rate per annum Million tonnes oil equivalent 26 27 28
2017/18 Olive Oil Export Forecast Rises with Slight Growth in Production
 United States Department of Agriculture Foreign Agricultural Service November 2017 Olive Oil Export Forecast Rises with Slight Growth in Production Million Metric Tons 3.4 3.2 3.0 2.8 2.6 Olive Oil Prices
Grain: World Markets and Trade
 Department of Agriculture Foreign Agricultural Service Circular Series FG 7-9 July 29 Grain: World Markets and Trade Argentina s Role Shrinks in the World Wheat Export Market MMT 14 12 Exports Market Share
Grain: World Markets and Trade
 Department of Agriculture Foreign Agricultural Service Circular Series FG 7-1 July 21 Grain: World Markets and Trade Exporter Wheat Ending Stocks Shrink MMT 8 6 4 2 /1 1/2 2/3 3/4 4/ /6 6/7 7/8 8/9 9/1
China is Key to Slow Pace of U.S. Soybean Exports
 United States Department of Agriculture Foreign Agricultural Service January 2018 China is Key to Slow Pace of U.S. Soybean Exports U.S. and Brazil Soybean Exports by Destination (Accumulated Exports:
Grain: World Markets and Trade
 Department of Agriculture Foreign Agricultural Service Circular Series FG 9-5 September Grain: World Markets and Trade Rice: Shake-up in Medium Grain Market Share MMT 2 1.8 1.6 1.4 1.2 1.8.6.4.2 TMT 3
World Geographic Shares
 World Geographic Shares North America South America Europe Africa Asia Australia/ Oceania 18% 13% 7% 22% 33% 6% World Population Shares North America South America Europe Africa Asia Australia/ Oceania
IEA Analysis of Fossil-Fuel Subsidies for APEC
 211/SOM3/DIA/3 Session 2 IEA Analysis of Fossil-Fuel Subsidies for APEC Submitted by: IEA Policy Dialogue on Fossil Fuel Subsidy Reform San Francisco, United States 23 September 211 IEA analysis of fossil
Grain: World Markets and Trade
 United States Department of Agriculture Foreign Agricultural Service Circular Series FG 8-3 August 23 Grain: World Markets and Trade The Heat is On: Drought Shifts EU Feeding and Exports MMT 2 15 1 5-5
Grain: World Markets and Trade
 Department of Agriculture Foreign Agricultural Service Circular Series FG 4-7 April 7 Grain: World Markets and Trade MMT 6 World Rye Trade Dwindles EU Rye Intervention Ending Stocks MMT 2. World Trade
FAPRI - Iowa State University
 FAPRI 21 World Agricultural Outlook FAPRI - Iowa State University Miguel Carriquiry, International Oilseeds and Biodiesel Analyst Fengxia Dong, International Dairy Analyst Xiaodong Du, International Livestock
Soybean Prices Fall on Rising South American Production
 United States Department of Agriculture Foreign Agricultural Service April 2017 Soybean Prices Fall on Rising South American Production Million Tons Change in South America Soybean Production Forecast
Drought Forecast to Reduce Australian Rapeseed Exports in 2007
 United States Department of Agriculture Foreign Agricultural Service Circular Series FOP 11-06 November 2006 Drought Forecast to Reduce Australian Rapeseed Exports in 2007 1800 1600 1400 1200 1000 800
Grain: World Markets and Trade
 United States Department of Agriculture Foreign Agricultural Service Circular Series FG04-02 April 2002 Grain: World Markets and Trade Indian Wheat & Rice Exports & Stocks Soar Million Metric Tons Exports
EU-25 Soybean Crush Forecast to Decline in 2005/06
 United States Department of Agriculture Foreign Agricultural Service Circular Series FOP 3-06 March 2006 EU-25 Soybean Crush Forecast to Decline in 2005/06 EU-25 Soybean Crush 20 19 18 17 Million tons
Exports of SMP From Major Suppliers and Price of SMP (EU FOB)
") United States Department of Agriculture Foreign Agricultural Service Circular Series FD 2-07 Dec 2007 Although the high prices of skimmed milk powder (SMP) experienced in 2007 were expected to draw supplies
United States Department of Agriculture Foreign Agricultural Service Circular Series FD 2-07 Dec 2007 Although the high prices of skimmed milk powder (SMP) experienced in 2007 were expected to draw supplies
FAPRI 2006 Preliminary Baseline December 15-16, 2005
 FAPRI 26 Preliminary Baseline December 15-16, 25 INTERNATIONAL DAIRY FAPRI Food and Agricultural Policy Research Institute Fengxia Dong (515) 294-47 fdong@iastate.edu Center for Agricultural and Rural
WORLD MOTOR VEHICLE PRODUCTION BY COUNTRY AND TYPE QUARTERS June 14, 2018
 QUARTERS 2017-2018 June 14, 2018 CONTENTS BASEPROTOTAL BASEPROCARS BASEPROLCV BASEPROHCV BASEPROBC Summation of cars, LCVs, HCVs, heavy buses Cars LCVs HCVs Heavy buses Note: The production of cars and
Natural gas. 26 Reserves 28 Production and consumption 33 Prices 34 Trade movements. 67 th edition
 Natural gas 26 Reserves 28 Production and consumption 33 Prices 34 Trade movements 67 th edition Natural gas Total proved reserves At end 1997 At end 2007 At end 2016 At end Trillion Trillion Trillion
Grain: World Markets and Trade
 United States Department of Agriculture Foreign Agricultural Service Circular Series FG12-01 December 2001 Grain: World Markets and Trade EU Changes Impact Global Wheat Markets Million Metric Tons Wheat
Grain: World Markets and Trade
 Department of Agriculture Foreign Agricultural Service February 2017 Grain: World Markets and Trade Stiff Competition Among Rice Exporters as Global Trade Expands Milled Rice Exports Global Rice Trade
Citrus: World Markets and Trade
 United States Department of Agriculture Foreign Agricultural Service uary 2015 Citrus: World Markets and Trade Oranges Global orange production for is forecast to decline 4 percent from the previous year
Five-year global supply and demand projections
 December 2016 International Grains Council Five-year global supply and demand projections Executive Summary The projections outlined in this report represent a possible supply and demand scenario for the
Grain: World Markets and Trade
 United States Department of Agriculture Foreign Agricultural Service Grain: World Markets and Trade Circular Series FG 04-01 April 2001 Argentina Increases Wheat Production, Exports Move into New Markets
China 2017/18 Soybean Imports Soar on Appetite for Pork, Aquaculture, and Dairy
 United States Department of Agriculture Foreign Agricultural Service June 2017 China Soybean Soar on Appetite for Pork, Aquaculture, and Dairy China: Booming Farmed Aquaculture Production China: Record
World real merchandise trade grows faster than output
 I. I. world trade developments 8 Merchandise trade and GDP World real merchandise trade grows faster than output In 2006, the volume of world merchandise trade grew by 8 per cent while world gross domestic
STATISTICAL ANNEX NOTE ON QUARTERLY PROJECTIONS
 OECD Economic Outlook, Volume 2017 Issue 1 OECD 2017 This annex contains data on key economic series which provide a background to the recent economic developments in the OECD area described in the main
Bangladesh: A Growing Market for U.S. Soybeans
 United States Department of Agriculture Foreign Agricultural Service December 2017 Bangladesh: A Growing Market for U.S. Soybeans 100% 310 3 Meal Equivalent Share 90% 80% 70% 60% 50% 40% 30% 20% 10% Animal
World Air Conditioner Demand by Region
 World Air Conditioner Demand by Region April 2015 The Japan Refrigeration and Air Conditioning Industry Association 1 World Air Conditioner Demand by Region April 2015 The Japan Refrigeration and Air Conditioning
Citrus: World Markets and Trade
 United States Department of Agriculture Foreign Agricultural Service July 2015 Citrus: World Markets and Trade Oranges Global orange production for is estimated to decline 7 percent from the previous year
World Wheat Supply and Demand Situation October 2018
 World Wheat Supply and Demand Situation October 218 Major data source: USDA World Agricultural Supply and Demand Estimates released October 12, 218. Projections will change over the course of the year
Textile Per Capita Consumption
 November 2017 Textile Per Capita Consumption 2005-2022 Part 1: Lower middle income countries CHF300.- Table of Contents Preface... 4 Sources... 5 Definitions... 6 Charts... 7 Executive Summary... 9 Country
FAPRI 2002 World Agricultural Outlook Briefing Book
 FAPRI 22 World Agricultural Outlook Briefing Book FAPRI 22 World Agricultural Outlook FAPRI - Iowa State University 3 Bruce Babcock, CARD Director 3 John Beghin, FAPRI Director 3 Jay Fabiosa, Technical
Fresh Connections: Netherlands
 Fresh Connections: Netherlands SHIFTING TRADE WINDS: GEOPOLITICS, GLOBAL TRADE & YOU JULIEN MARCILLY CHIEF ECONOMIST APRIL 29, 215 Oil prices: Lower for longer 14 Oil price (Brent, source: OPEC) 12 Oil
35,000 52,000 87,000 1,600 8, ,400 76,600. Mean Crop. Monthly YTD Min ,671 8,211 Max. 2017
 YTD Inventory / Shipment Report In Shell Basis Crop: 2018 Monthly Market Prices FCA Hamburg Iranian Dried In Shell 28/30 Fandoghi Pistachios Total Consumption Ending Inventory 2nd Marketing Month YTD Carry
World Wheat Supply and Demand Situation December 2018
 World Wheat Supply and Demand Situation December 218 Major data source: USDA World Agricultural Supply and Demand Estimates released December 11, 218. Projections will change over the course of the year
Mid-term Outlook for World Agricultural Markets
 Mid-term Outlook for World Agricultural Markets Jacinto Fabiosa Co-Director, (515) 294-6183 jfabiosa@iastate.edu Food and Agricultural Policy Research Institute The Question of Interest? In 27 we asked,
United States Boosts Share in South Korea s Soybean Oil Market
 United States Department of Agriculture Foreign Agricultural Service February, 2018 United States Boosts Share in South Korea s Soybean Oil Market Thousand Metric Tons 350 300 250 200 150 100 50 50% 45%
Baseline Update for International Livestock Markets
 Baseline Update for International Livestock Markets September 2018 FAPRI-MU Report #04-18 www.fapri.missouri.edu Published by the Food and Agricultural Policy Research Institute (FAPRI) at the University
19,000 38,500. Mean Crop. 5, ,827 Max , ,869 Last Year 6, ,
 YTD Inventory / Shipment Report In Shell Basis Crop: 2017 Monthly Market Prices FCA Hamburg Iranian Dried In Shell 28/30 Fandoghi Pistachios 10th Marketing Month YTD Carry in from previous year 3,000 Total
World Wheat Supply and Demand Situation
 World Wheat Supply and Demand Situation November 218 Major data source: USDA World Agricultural Supply and Demand Estimates released November, 218. Projections will change over the course of the year depending
Coal. 36 Reserves and prices 38 Production and consumption. 67 th edition
 Coal 36 Reserves and prices 38 Production and consumption 67 th edition Total proved reserves at end 217 Million tonnes Anthracite and bituminous Subbituminous and lignite US 228 3116 25916 24.2% 357 Canada
Economic and Market Report. EU Automobile Industry
 Economic and Market Report EU Automobile Industry September 2015 Q2 2015 CONTENTS EU Economic Outlook... 2 Passenger cars... 4 Registrations... 4 World... 4 The European Union... 6 Production... 8 World...
UXC.COM A PUBLICATION OF. NPO Overview 1501 MACY DRIVE ROSWELL, GA PH FX
 2019 A PUBLICATION OF UXC.COM NPO Overview 1501 MACY DRIVE ROSWELL, GA 30076 PH +1 770 642-7745 FX +1 770 643-2954 NOTICE UxC, LLC ( UxC ) shall have title to, ownership of, and all proprietary rights
280 / World Cotton: FAPRI 2005 Agricultural Outlook. World Cotton
 WORLD COTTON 280 / World Cotton: FAPRI 2005 Agricultural Outlook World Cotton The 2004/05 crop can be characterized simply as record breaking. A record 35.8 mha of cotton were harvested, producing a record