ANALYST S BRIEFING : No.1/2016. March 4, 2016
|
|
|
- Dennis Owens
- 5 years ago
- Views:
Transcription
1 ANALYST S BRIEFING : No.1/2016 March 4, 2016
2 This presentation was made from the analysis of reliable information in order to assist investment community to better understand the company's financial status and operation. It also supports the "Good Corporate Governance Project" of the Securities and Exchange Commission (SEC). However, the information within this presentation has been derived from the existing factors in the present time. Therefore, the forward-looking information on this presentation may not occur in the future if the aforementioned factors or situations are changed. Investors are, nevertheless, required to use their own discretion regarding the use of information contained in this presentation for any purpose. For further information, please contact Investor Relations Section of the Electricity Generating Public Company Limited (EGCO) at Tel: (662) or 2
3 EGCO Group s Overview EGCO Group s Overview 2015 Financial Results Projects in Pipeline 3

4 EGCO Group s Overview EGCO s Shareholders Portfolio and Corporate Strategies 4


5 As of September 4, 2015 EGCO Group s Overview EGAT 25.41% TEPCO 50% NVDR 17.29% Foreign Investors 20.88% TEPDIA 23.94% Thai Investors 12.48% MC 50% 5
6 EGCO Group s Overview EGCO s Shareholders Portfolio and Corporate Strategies 6
 Contracted Cap. (MW) MW Equity KEGCO (KN 2&3) 100.00% 748.20 748.20 KK2 50.")
 EGCO s Shares Contracted Cap. (MW) MW Equity NED 66.67% 63.00 41.99 SPP2 100.00% 8.")
 Total 124.98 MW Equity NTPC 35.00% 1,070.00 374.50 QPL 100.00% 460.00 460.00 MPPCL Unit 1&2 40.95% 624.00 255.50 SEG 20.")
7 EGCO Group s portfolio comprises 23 operating power plants, total contracted capacity 3, MWe. 3.28% 32.78% 7.35% IPP SPP 56.59% Renewable Power Plant: IPP Power Plant: SPP EGCO s Shares EGCO s Shares Contracted Cap. (MW) Contracted Cap. (MW) MW Equity KEGCO (KN 2&3) % KK % 1, BLCP 50.00% 1, Total 2, MW Equity EGCO Cogen 80.00% Roi-Et Green 70.30% GCC 50.00% NKCC 50.00% SCC 50.00% GYG 50.00% Total Power Plant: Renewable (Domestic) EGCO s Shares Contracted Cap. (MW) MW Equity NED 66.67% SPP % SPP % SPP % SPP % GPS 60.00% TWF 90.00% Solarco 49.00% GIDEC 50.00% Power Plant: Overseas EGCO s Shares Contracted Cap. (MW) Total MW Equity NTPC 35.00% 1, QPL % MPPCL Unit 1& % SEG 20.00% BRWF % Total 1, Overseas 7
8 EGCO Group s portfolio consists of 5 under construction projects and 3 under development projects, total contracted capacity 1, MWe % 84.81% Under Construction Under Development Power Plant: Under Construction Power Plant: Under Development EGCO s Shares EGCO s Shares Contracted Cap. (MW) Contracted Cap. (MW) MW Equity KEGCO (KN4) % XPCL 12.50% 1, CWF 90.00% TJ Cogen % SBPL 49.00% Total 1, MW Equity TP Cogen % SK Cogen % MPPCL Unit % Total


9 EGCO Group s other business portfolio comprises 5 companies: EGCO Group s Overview ESCO (100%) O&M Coal Mining MME (40%) PEPOI (100%) O&M Water EASTW (18.72%) QMS (100%) Management Service 9


10 EGCO Group s Overview Operate power plants to achieve optimum efficiency and manage projects under construction to achieve COD on time Boost long-term earnings by acquisition of greenfield projects and/or expansion of existing projects Acquire operating assets to realize quick earnings, with focus on the Asia Pacific region 10
11 EGCO Group s Overview 2015 Financial Results Projects in Pipeline 11

12 Unit: Million Baht EGCO s Overview 7,705 7,920 MD&A +215 MB or +3% ,471 6,715 Power Generation Others Divestment of EGCOM Tara 12
 New Power Plants MPPCL 648 NED (Additional Shares) 251 BRWF 23 SEG 13 QPL(Additional Shares)")
 EGCOM Tara (42) Renewable Group (124) QPL (146) GEC (171) EGCO")
13 Unit: Million Baht 2,566 Change of AP RYPP (1,926) KK2 (211) KEGCO (KN2&3) (109) BLCP (58) (2,304) Under Construction & Under Development 654 (31) New Power Plants MPPCL 648 NED (Additional Shares) 251 BRWF 23 SEG 13 QPL(Additional Shares) 13 GIDEC (4) 7,705 EGCOM Tara 7, Divestment of Operating Performance RYPP 1,355 North Pole 324 KEGCO (KN2&3) 258 NTPC 90 ESCO 52 EGCO Cogen 29 KK2 22 MME 9 BLCP (38) EGCOM Tara (42) Renewable Group (124) QPL (146) GEC (171) EGCO (964) 13


 (3,332)")
14 Unit: Million Baht 7,667 Net Profit before FX, DT and TFRIC 4&12 Gain from sale of TARA MD&A +215 MB or +3% 4, FX TFRIC 4&12 Deferred Tax Impairment of QPL 7,705 7,920 6,968 (677) (3,332) (271) (483) 14

15 Million Baht 4,000 3,500 3,000 2,500 2,000 1,500 1,869 1,299 2,566 2,597 2,662 2,150 1,120 1,362 1, Q1 Q2 Q3 Q


16 Million Baht Net Profit Net Profit before FX, Deferred Tax, TFRIC 4&12 and Impairment Gain from combination 4,310 MB 4,990 11,240 6,930 7,164 7,667 4,319 5,301 6,060 7,375 7,705 7,


17 Other Business 253 MB, 2% (EGCOM Tara, ESCO, MME) KEGCO 153 MB, 1% Renewable (Overseas) 18 MB, 1% SPP 356 MB (GEC, EGCO Cogen) 3% KK2 1,013 MB 9% 26% Quezon 2,772 MB 10% MPPCL 1,084 MB 12% 21% BLCP 2,231 MB NTPC 1,277 MB 15% Note: Excluding EGCO Renewable (Domestic) 1,661 MB 17


18 Total Outstanding As of Sep 30, 2015 Total Outstanding As of Dec 31, 2015 AUD 244 M AUD 241 M USD 1,419 M USD 1,620 M THB 23,463 M THB 25,306 M Total Outstanding (Baht equivalence) THB 84,558 M THB 88,230 M 18


19 Times (X) Equity 77,750 MB EGCO + Subsidiaries EGCO 1.31 EGCO + Subsidiaries Debt 102,062 MB Equity 56,639 MB EGCO Debt 46,831 MB 19
20 Unit: Million Baht 2015 Beginning Cash 892 Cash Payments from Operations (EGCO) (920) Cash Receipts from RYPP 112 Net Cash Receipts from Operating Activities (809) Dividend Receipts from Subsidiaries, Joint Venture & Others 8,048 Cash Payments for Acquisition of Additional Investment in Subsidiaries and Joint Venture (1,448) Other Investments (Payments) and Interest Receipts 287 Net Cash Payments in Investing Activities 6,888 Loan Receipts and Payments (4,410) Interest Payments and Financing Fee (1,234) Cash Receipt from Debenture 4,637 Dividend Payments (3,289) Net Cash Receipts from Financing Activities (4,296) Ending Cash 2,675 20

21 Baht/Share Interim Payment Second Payment EGCO Group s Overview Note Our dividend policy is 40% of the consolidated net profit after tax. BOD in the 29 th February s Meeting approved the appropriation of net profit from the second-half year operation of 2015 at 3.25 baht for the second dividend payment which will be paid on April 29,

22 2015 Projects Financial Pipeline Results EGCO Group s Overview 2015 Financial Results Projects in Pipeline 22
")
 XPCL (Hydro)")
 MPPCL Unit 3")

23 2015 Projects Financial Pipeline Results CWF (Wind) SBPL (Coal) KEGCO (KN4) (Gas) TJ Cogen (Gas) XPCL (Hydro) TP Cogen (Gas) MPPCL Unit 3 (Coal) SK Cogen (Gas) Under Construction Projects Under Development Projects 23


24 XPCL Xayaburi, Laos PDR SCOD: October 1, 2019 Thailand Laos Philippines SBPL Quezon, The Philippines SCOD : June 2019 KEGCO (KN4) Nakhon Si Thammarat, Thailand SCOD: June 19, 2016 CWF Sub Yai, Chaiyaphum, Thailand SCOD: December 1, 2016 TJ Cogen Klong Luang, Pathum Thani SCOD: June


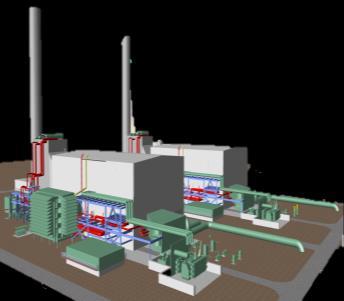
25 Type: Combined Cycle Power Plant Location: Khanom, Nakhon Si Thammarat Shareholders : EGCO 100% SCOD : June 19, 2016 Contractual Type : IPP Contracted Capacity : 930 MW PPA : 25 years with EGAT Overall Progress : Ending 2015, the overall progress was 99.60%. ( The construction plan was 99.70%. ) 25


26 Type : Wind Power Plant Location : Sub Yai, Chaiyaphum Shareholders : EGCO 90%, PVI Group 10% SCOD : December 1, 2016 Contractual Type : SPP Non-Firm Contracted Capacity : 90 MW with EGAT Adder : 3.50 Baht/kWh for 10 years Overall Progress : Ending 2015, the overall progress was 49.85%. ( The construction plan was 49.65%.) 26

27 Type : Hydro Power Plant (Run-of- River) Location : Xayaburi District, Laos PDR Shareholders : EGCO 12.5%, CKP 30%, EDL 20%, BEM 7.5%, GPSC 25%, PT Construction and Irrigation Co., Ltd. 5% SCOD : October 29, 2019 Contractual Type : IPP Contracted Capacity : 1,220 MW with EGAT and 60 MW with EDL PPA : 29 years with EGAT and EDL Overall Progress : Ending 2015, the overall progress was 56.09%. ( The construction plan was 44.00%.) 27
28 Type : Cogeneration Power Plant Location : Klong Luang, Pathum Thani Shareholders : EGCO 100% SCOD : June 2017 Contractual Type : SPP Cogeneration Installed Capacity : 115 MW Contracted Capacity : 90 MW with EGAT Contracted Capacity with IU : 17 MW and 10 t/h of steam Overall Progress : Project financing was achieved on December 11, Ending 2015, the overall progress was 31.10%. ( The construction plan was 34.15%.) 28

29 Type : Coal-Fired Power Plant Technology : Supercritical Boiler Location : Quezon, Luzon, The Philippines Shareholders : EGCO Group 49%, MPG 51% SCOD : June 2019 Contractual Type : IPP Installed Capacity : 500 MW Contracted Capacity : 455 MW with Meralco PSA Term : 20 years with 5-year extension Overall Progress: Project financing was achieved on December 1, Ending 2015, site preparation and construction equipment survey have been commenced. 29

30 KEGCO (KN4) CWF XPCL TJ Cogen Plan 99.70% Plan 49.65% Plan 44.00% Plan 34.15% Actual 99.60% Actual 49.85% Actual 56.09% Actual 31.10% 30
31 TP Cogen Ban Pong, Ratchaburi SCOD: October 2017 Thailand Philippines SK Cogen Ban Pong, Ratchaburi SCOD: October 2017 MPPCL Unit 3 Existing Site in Zambales, Luzon SCOD: June
32 Project Description Type : Cogeneration Power Plant Location : Ban Pong, Ratchaburi Shareholders : EGCO 100% SCOD : October 2017 Contractual Type : SPP Cogeneration Installed Capacity : 125 MW each Contracted Capacity : 90 MW each with EGAT Contracted Capacity with IU : TP Cogen 23 MW and 40 t/h of steam SK Cogen 17 MW and 60 t/h of steam Project Progress Financing : Project financing is expected to be achieved in March
33 Project Description Type : Brownfield expansion - Coal-fired Power Plant Project is an expansion at the same campus for Units 1&2 with same shareholders and project holding company Technology : Supercritical Boiler Location : Existing Site in Zambales, Luzon Shareholders : EGCO 40.95%, AES 51% and IFC 8.05% SCOD : June 2019 Contracted Capacity : 119 MW to date with Electric Cooperatives (EC) Installed Capacity : 335 MW Term of Contract : 20 years with the ECs Project Progress Omnibus Expansion Financing Agreement for the expansion was signed on December 1, 2015 Limited Notice to Proceed issued on December 4, 2015 Groundbreaking ceremony on March 3,
 MPPCL Unit 3 Existing Site in Zambales, Luzon SCOD: June 2019 Philippines EGCOM Tara Ratchaburi and Samut Songkram Divestment date: August 31, 2015 Thailand SBPL Quezon Province, Luzon First")
34 NED Lopburi Additional Shares Purchase of 33.33% Acquisition Date : February 4, 2015 (EGCO owned 66.67% stake after acquisition.) MPPCL Unit 3 Existing Site in Zambales, Luzon SCOD: June 2019 Philippines EGCOM Tara Ratchaburi and Samut Songkram Divestment date: August 31, 2015 Thailand SBPL Quezon Province, Luzon First drawdown of funds: December 8, 2015 QPL Quezon Province, Luzon Additional Share Purchase of 2% Acquisition Date : Oct 1, 2015 (EGCO Group owned 100% stake after acquisition.) 34
35 Project Description Type : Solar Power Plant Technology : Thin-Film Solar Cell Location : Lopburi Province Shareholder after Acquisition : EGCO 66.67% and CLP 33.33% COD : Lopburi Solar - Dec 2011 Wang Ploeng Solar - May 2011 Contracted Capacity : Lopburi Solar - 55 MW with EGAT Adder : 8 Baht/kWh for 10 years Wang Ploeng Solar - 8 MW with PEA Achievement Acquisition of additional shares of 33.33% in NED from Diamond Generating Asia, Limited. Share Transfer was completed on February 4,
 to Universal Utility Co., Ltd, a wholly owned subsidiary of East Water. The divestment of EGCOM Tara was completed on August 31, 2015.")
36 Detail of Business Type : Tap Water Producer Location : Ratchaburi and Samut Songkram Province Contractual Type : BOO Term of Contract : 30 years from April 7, 2001 with PWA Detail of Divestment Sale all ESCO s share in EGCOM Tara (74.19% of share in EGCOM Tara) to Universal Utility Co., Ltd, a wholly owned subsidiary of East Water. The divestment of EGCOM Tara was completed on August 31,

37 Project Description Type : Coal-fired Power Plant Technology : Supercritical Boiler Location : Quezon Province, Luzon, The Philippines Shareholders after Acquisition : EGCO 100% ownership in QPL COD : May 30, 2000 Contracted Capacity : 460 MW with Meralco Term of Contract : 25 years Achievement Purchase of 2% indirect ownership interest in QPL from PMR Holding Corp. Share Transfer was completed on October 1,
38 Project Description Type : Coal-Fired Power Plant Technology : Supercritical Boiler Location : Quezon, Luzon, The Philippines Shareholders : EGCO Group 49%, MPG 51% SCOD : December 8, 2015 Contractual Type : IPP Installed Capacity : 500 MW Contracted Capacity : 455 MW with Meralco PSA Term : 20 years with 5-year extension Achievement First Drawdown of funds from loan facility for the commencement of construction on December 8,

39 Project Description Type : Brownfield expansion - Coal-fired Power Plant Project is an expansion at the same campus for Units 1&2 with same shareholders and project holding company Technology : Supercritical Boiler Location : Existing Site in Zambales, Luzon Shareholders : EGCO 40.95%, AES 51% and IFC 8.05% SCOD : June 2019 Contracted Capacity : 119 MW to date with Electric Cooperatives (EC) Installed Capacity : 335 MW Term of Contract : 20 years with the ECs Project Progress Omnibus Expansion Financing Agreement for the expansion was signed on December 1, 2015 Limited Notice to Proceed issued on December 4, 2015 Groundbreaking ceremony on March 3,


40 THANK YOU 40

41 41


42 As of December 2015, Thailand s Power Installed Capacity was 38, MW. Classified by Producer Classified by Fuel type 5.0% 13.2% 8.9% 14.6% 41.0% 14.6% 36.9% 65.8% EGAT IPP SPP IMPORT NATURAL GAS HYDRO COAL OTHERS* EGAT : 15,518 MW IPP : 13,967 MW SPP : 5,013 MW Import : 3,387 MW Natural Gas : 24,938 MW Hydro : 5,523 MW Coal : 5,538 MW Others* : 1,885 MW Source: EGAT *OTHERS = Fuel Oil, Diesel, Renewable 42
43 MW 30,000 26, MW (April 23, 2014) 27, MW (June 11, 2015) 1.5% 25, MW (December 2, 2015) 25,000 20,000 15,000 January February March April May June July August September October November December Source: EGAT

44 FX Variance MD&A 44
 Tax")
45 Deferred Income (Expense) Tax 45
46 Impact of the Adoption of TFRIC 4 and TFRIC 12 Million Baht (100) (200) (300) (400) (500) (13) RYPP KEGCO Roi-Et Green (487) (403) (12) (2) BLCP GPG GYG NTPC ET +336 MB MB 46
47 Financial Ratio Highlights (Consolidated) Debt to Equity (Time) Net Debt to Equity (Time) Net Profit before FX* (Million Baht) 7,786 7,166 EPS (Baht) Operating Cash Flow / share (Baht) BV / share (Baht) * FX gains/losses from Income Statements including financial cost from foreign currency loans (EGCO & Subs and JVs) 47
48 Segmental Operating Results, Ended December 30, Holding (Million Baht) EGCO RYPP KEGCO EGCO Cogen Roi-Et Green Subsidiaries Power Generation SPP4 SPP3 Solarco SPP2 SPP5 TWF Quezon TJ Cogen TP&SK Cogen CWF BRWF North Pole Joint Ventures Power Generation Total Power generation Subsidiaries Others BLCP KK2 GEC NED NT2 GPS GIDEC SBPL MPPCL SEG ESCO Egcom Tara Joint Ventures Others MME Total Other businesses Grand Total Sales of Electricity - - 1,400 1, , , , ,939 - Capacity Payment - - 1, , ,338 - Energy Payment , , ,014 Other Income Sales of Water Service Income Cost of Sales - - (1,150) (1,750) (177) (38) (49) (326) (51) (51) (27) (5,945) (389) - (9,953) (734) (47) - (781) (10,734) Cost of Services - (152) (239) (40) (18) (46) (57) (421) (57) (54) (37) (1,826) (451) - (3,398) (157) (28) - (185) (3,583) Gross Profit , ,598 (12) (1) (9) , ,400 EBITDA (1,264) (93) , ,060 (12) (1) (9) 676 (216) 2,891 1, , (4) (10) 2, , ,095 EBIT (1,438) (95) , ,392 (12) (1) (9) 361 (216) 2,891 1, , (4) (10) 2, , ,985 Net Profit before Imparement, FX and deferred income tax (2,332) (95) ,772 (12) (3) (24) (17) (217) 2,231 1, , (34) (10) 1, , ,920 Net Profit before FX (2,689) (49) ,757 (12) (3) (23) (96) (216) 1,932 1, , (34) (10) 993 (36) 6, ,166 Net Profit (5,707) (49) (980) ,727 (14) 9 50 (95) (210) 2, , (34) (6) 931 (54) 3, ,834 48
49 Segmental Operating Results, Ended December 30, Holding (Million Baht) EGCO RYPP KEGCO EGCO Cogen Roi-Et Green Subsidiaries Power Generation SPP4 SPP3 Solarco SPP2 SPP5 TWF Quezon TJ Cogen TP&SK Cogen CWF BRWF North Pole Joint Ventures Power Generation Total Power generation Subsidiaries Others BLCP KK2 GEC NED NT2 GPS GIDEC SBPL MPPCL SEG ESCO Egcom Tara Joint Ventures Others MME Total Other businesses Grand Total Sales of Electricity - 1,960 1,513 2, , , , ,100 - Capacity Payment - 1,926 1, , ,662 - Energy Payment , , , , ,440 Sales of Water Service Income Cost of Sales - 1,337 1,314 2, , , ,555 Cost of Services Gross Profit , ,834 (1) (1) (1) (35) - 7, ,053 EBITDA (1,732) 1, , ,768 (0) 2 (2) (40) - 3,789 2, , (27) (30) , ,401 EBIT (1,856) 478 (45) , ,086 (0) 2 (2) (40) - 3,004 1, , (27) (30) , ,172 Net Profit before FX and deferred income tax (2,621) 461 (112) ,396 (0) 2 (2) (40) - 2,327 1, , (30) (30) , ,705 Net Profit before FX (2,434) 448 (131) ,397 (0) 2 (2) 155-2,311 1, , (30) (30) , ,930 Net Profit (2,954) 448 (133) ,395 (0) 2 (2) 163-2,161 1, , (30) (31) , ,253 49
50 3,722 2,319 2,535 2,788 2,258 2,170 2,167 1,762 2,201 2,038 1,959 1,528 6,317 7,672 8,107 7,937 10,825 8,667 17,909 17,706 17,868 18,505 17,255 22,506 22,750 22,655 20,462 29,649 27,470-2,952 2,127 1,155 5,643 4,783 5,476 4,976 4,004 5,311 2,693 5,188 5,258 4,778 10,018 9,329 10,036 9,857 5,816 10,617 8,813 6,361 5,770 6,274 6,150 6,283 5,073 5,314 10,770 10,848 10,157 9,323 10,825 10,784 Net Generation Annual Net Generation & Electricity Sales for the Year RYPP KEGCO (KN2&3) BLCP KK2 NT2 GWh 12,000 10,000 8,000 6,000 4,000 2, Electricity Sales Million Baht 35,000 30,000 25,000 20,000 15,000 10,000 5, EGAT is the sole off-taker for electricity produced by Rayong Power Plant and KEGCO under long term cost-plus based Power Purchase Agreements (PPAs). REGCO and KEGCO receive the capacity payment (Rayong Power Plant) or availability payment (KEGCO) for maintaining the availability of the power plants, regardless of whether the electric power will be supplied to EGAT or not. 50
51 Major Maintenance Expenses 2014 KEGCO Quarter Total Actual Actual Actual Actual Spare Parts Service Charge Total KEGCO Quarter Total Actual Actual Actual Actual Spare Parts Service Charge Total Million Baht 51
52 Operating Performance Equivalent Availability Factor KEGCO Plant Type Q14 2Q14 3Q14 4Q14 Target EAF (%) Actual EAF (%) Target EAF (%) Actual EAF (%) Target EAF (%) Actual EAF (%) Target EAF (%) Actual EAF (%) Barge # Barge # CCGT # KEGCO Plant Type Q15 2Q15 3Q15 4Q15 Target EAF (%) Actual EAF (%) Target EAF (%) Actual EAF (%) Target EAF (%) Actual EAF (%) Target EAF (%) Actual EAF (%) Barge # Barge # CCGT #
53 Net Generation and Fuel Consumption KEGCO Barge # 2 1Q14 2Q14 3Q14 4Q14 1Q15 2Q15 3Q15 4Q15 Net Generation - - By Natural Gas (GWh) By Secondary Fuel (GWh) Fuel Consumption - - By Natural Gas (MMBTU) 1,470,853 1,659,281 1,585,786 1,286, , , , ,593 - By Secondary Fuel (Million Litre) CCGT # 3 1Q14 2Q14 3Q14 4Q14 1Q15 2Q15 3Q15 4Q15 Net Generation - - By Natural Gas (GWh) 1,099 1,302 1,237 1,152 1,195 1,181 1,156 1,067 - By Secondary Fuel (GWh) Fuel Consumption - - By Natural Gas (MMBTU) 10,493,579 10,619,075 10,041,191 10,269,237 10,269,184 9,728,099 9,518,343 8,973,170 - By Secondary Fuel (Million Litre)
54 Net Generation and Fuel Consumption QPL 2014 Plant Type 1Q14 2Q14 3Q14 4Q14 Target EAF (%) Actual EAF (%) Target EAF (%) Actual EAF (%) Target EAF (%) Actual EAF (%) Target EAF (%) Actual EAF (%) 88.00% 77.80% 88.00% 98.28% 88.00% 90.36% 88.00% 94.22% QPL 2015 Plant Type 1Q15 2Q15 3Q15 4Q15 Target EAF (%) Actual EAF (%) Target EAF (%) Actual EAF (%) Target EAF (%) Actual EAF (%) Target EAF (%) Actual EAF (%) 51.42% 46.57% 93.39% 98.43% 91.43% 94.56% 95.06% 95.51% 54
55 Net Generation and Fuel Consumption QPL Q14 2Q14 3Q14 4Q14 1Q15 2Q15 3Q15 4Q15 Net Generation - By Coal (GWh) By Secondary Fuel (GWh) Fuel Consumption - By Coal (Ton) 328, , , , , , , ,647 - By Secondary Fuel (Million Litre)
 #1 (22D) #2 (19D) QPL MPPCL (17D) #2 (21D) #2 (43D) (46D) #1 (7D) #1 (12D) Roi-Et Green (12D) (22D)")
56 Maintenance in 2014 VS 2015 : Actual in 2014 # : Unit : Actual in 2015 D : Days Power Plant Jan Feb Mar Apr May Jun May Jul Aug Sep Oct Nov Dec BLCP #1 (9D) #1 (22D) #2 (19D) QPL MPPCL (17D) #2 (21D) #2 (43D) (46D) #1 (7D) #1 (12D) Roi-Et Green (12D) (22D) 56


57 57
Management Discussion and Analysis
 Management Discussion and Analysis For the Annual Operating Results Ended December 31, 2009 Note: This Management Discussion and Analysis (MD&A) was made to disclose information and the vision of the management
Management Discussion and Analysis
 Management Discussion and Analysis For the Annual Operating Results Ended December 31, 2008 Note: This Management Discussion and Analysis (MD&A) was made to disclose information and the vision of the management
Ratchaburi Electricity Generating Holding PCL. Management Discussion and Analysis For the Year Ended December 31, 2012
 Ratchaburi Electricity Generating Holding PCL Management Discussion and Analysis (Translation) Ratchaburi Electricity Generating Holding Public Co., Ltd. Management Discussion and Analysis 1. Significant
Analysis of Operating Results and Financial Status
 29 Analysis of Operating Results and Financial Status 1. Analysis of Operating Results of EGAT and Its Subsidiaries Operating results of EGAT and its subsidiaries including associated company and joint
Analysis of Operating Results and Financial Status
 Analysis of Operating Results and Financial Status 1. Analysis of Operating Results of EGAT and its Subsidiaries Operating results of EGAT and its subsidiaries including associated company and jointly
ANALYST BRIEFING FOR THE FOURTH QUARTER ENDED FEBRUARY 2017
 ANALYST BRIEFING FOR THE FOURTH QUARTER ENDED 2016 22 FEBRUARY 2017 MSM Malaysia Holdings Berhad Analyst Briefing Q4 2016 22/2/2017 1 CONTENTS 01 02 03 04 05 Group Financial Highlights Performance Review
ANALYST BRIEFING FOR THE THIRD QUARTER ENDED NOV 2016
 ANALYST BRIEFING FOR THE THIRD QUARTER ENDED 2016 21 NOV 2016 MSM Malaysia Holdings Berhad Analyst Briefing Q3 2016 21/11/2016 1 CONTENTS 01 02 03 04 05 Group Financial Highlights Performance Review Sugar
FY2/17 3Q(March 2016~November2016)
") FY2/17 (March 2016~November2016) Fact Book 1. Trends in the current fiscal year and previous fiscal year 3. Business overview (1) Performance overview P. 1 (1) No. of students at the end of month P. 7
FY2/17 (March 2016~November2016) Fact Book 1. Trends in the current fiscal year and previous fiscal year 3. Business overview (1) Performance overview P. 1 (1) No. of students at the end of month P. 7
BlueScope Steel Limited Consolidated Financial Headlines
 BlueScope Steel Limited Consolidated Financial Headlines 2003 2004 2005 2006 2007 2008 2009 2010 2011 2012 2013 2013 2013 2014 2014 2014 2015 2015 2015 2016 2016 2016 2017 2017 2017 2018 2018 2018 Total
Strong performance by the Bolloré Group s operating activities in 2018 Mr Cyrille Bolloré unanimously appointed Chairman and Chief Executive Officer
 PRESS RELEASE 2018 results (1) March 14, 2019 Strong performance by the Bolloré Group s operating activities in 2018 Mr Cyrille Bolloré unanimously appointed Chairman and Chief Executive Officer Revenue:
Somboon Advance Technology PCL
 Somboon Advance Technology PCL Opportunity Day 2017Q2 September 12, 2017 1 Company Overview Automotive Industry Overview Tractor Industry Overview Sale Performance Financial Highlights Q&A 2 Company Overview
BAYPORT SECURITISATION (RF) LTD INVESTOR REPORT AUGUST 2018
 LTD INVESTOR REPORT AUGUST 2018") BAYPORT SECURITISATION (RF) LTD INVESTOR REPORT AUGUST 2018 0 Note: This report has been prepared in accordance with IFRS 9. Financial statistics for the period ended August 2018 Aug 18 Jul 18 June 18
BAYPORT SECURITISATION (RF) LTD INVESTOR REPORT AUGUST 2018 0 Note: This report has been prepared in accordance with IFRS 9. Financial statistics for the period ended August 2018 Aug 18 Jul 18 June 18
FY2/18 (March 2017~February 2018)
") FY2/18 (March 2017~February 2018) Fact Book 1. Trends in the current fiscal year and previous fiscal year 3. Business overview (1) Performance overview P. 1 (1) No. of students at the end of month P. 6
FY2/18 (March 2017~February 2018) Fact Book 1. Trends in the current fiscal year and previous fiscal year 3. Business overview (1) Performance overview P. 1 (1) No. of students at the end of month P. 6
FY2/17 (March 2016~February 2017)
") FY2/17 (March 2016~February 2017) Fact Book 1. Trends in the current fiscal year and previous fiscal year 3. Business overview (1) Performance overview P. 1 (1) No. of students at the end of month P. 7
FY2/17 (March 2016~February 2017) Fact Book 1. Trends in the current fiscal year and previous fiscal year 3. Business overview (1) Performance overview P. 1 (1) No. of students at the end of month P. 7
LOGO. August 16,2010
 LOGO Opportunity Day TIRATHAI PUBLIC COMPANY LIMITED August 16,2010 Contents Company Profile Business Products Electrical Demand Overview Structure of Income & Q2 Operating Results Business Forecast for
BAYPORT SECURITISATION (RF) LTD INVESTOR REPORT JULY 2018
 LTD INVESTOR REPORT JULY 2018") BAYPORT SECURITISATION (RF) LTD INVESTOR REPORT JULY 2018 Note: This report has been prepared in accordance with IFRS 9. Financial statistics for the period ended July 2018 Jul 18 June 18 May 18 Apr 18
BAYPORT SECURITISATION (RF) LTD INVESTOR REPORT JULY 2018 Note: This report has been prepared in accordance with IFRS 9. Financial statistics for the period ended July 2018 Jul 18 June 18 May 18 Apr 18
KCB GROUP PLC INVESTOR PRESENTATION. Q FINANCIAL RESULTS
 KCB GROUP PLC INVESTOR PRESENTATION. Q3 2018 FINANCIAL RESULTS MACRO-ECONOMIC HIGHLIGHTS Macro-Economic Highlights: Kenya KENYA 4.9% 5.3% GDP Growth Rate (%) 5.6% 5.8% 4.9% 6.3% 6.2% KENYA 2013 2014 2015
1. Trends in the current fiscal year and previous fiscal year 3. Business overview 2. Secular trends in first quarter financial results
 FY2/19 (March 2018~May 2018) Fact Book 1. Trends in the current fiscal year and previous fiscal year 3. Business overview (1) Performance overview P. 1 (1) No. of students at the end of month P. 6 (2)
FISCAL YEAR MARCH 2018 FIRST HALF FINANCIAL RESULTS
 FISCAL YEAR MARCH 2018 FIRST HALF FINANCIAL RESULTS PRESENTATION OUTLINE Highlights Fiscal Year March 2018 First Half Results Fiscal Year March 2018 Full Year Forecast Progress of Key Initiatives/ Business
TOFAŞ Q ANALYST PRESENTATION
 TOFAŞ Q1 2016 ANALYST PRESENTATION 03.05.2016 1 2016 Q1 AGENDA Highlights Turkish Automotive Industry Production & Capacity Utilization Domestic Market Developments Tofaş Domestic Market Performance Export
Factbook. Tokyo Electric Power Company Holdings, Inc. August Tokyo Electric Power Company Holdings, Inc. All Rights Reserved.
 Factbook Tokyo Electric Power Company Holdings, Inc. August 2018 (Note) Please note that the following to be an accurate and complete translation of the original Japanese version prepared for the convenience
SECOND QUARTER 2015 RESULTS
 SECOND QUARTER 2015 RESULTS 7 AUGUST 2015 LUCA BETTONTE, CEO DISCLAIMER This document contains certain forward-looking information that is subject to a number of factors that may influence the accuracy
Bangkok Expressway and Metro Public Company Limited Management Discussion and Analysis for the Quarter Ended on March 31, 2016
 Overall Operational Results In the first quarter of the year 2016, the Company had the net profit attributable to equity holders in the amount of Baht 702 Million, representing an increase from the same
FY2015 First Quarter Financial Results. SUZUKI MOTOR CORPORATION 3 August 2015
 First Quarter Financial Results SUZUKI MOTOR CORPORATION 3 August 2015 Consolidated: Financial Summary Page2 Increased net sales and operating income/ordinary income Decreased net income attributable to
The 2 nd Quarter and 6-Month of 2014 Operating Performance Analysis of TRC Construction Public Company Limited and Its Subsidiaries
 1 The 2 nd Quarter and 6-Month of 2014 Operating Performance Analysis of TRC Construction Public Company Limited and Its Subsidiaries (Unit : Million Baht) The 1st Qtr The 2nd Qtr The 2nd Qtr (2 nd Qtr
2015 Interim Results Announcement
 China Petroleum & Chemical Corporation 2015 Interim Results Announcement August 27, 2015 Hong Kong Cautionary Statement This presentation and the presentation materials distributed herein include forward-looking
Q Analyst Teleconference. 9 August 2018
 9 August 218 Disclaimer This presentation contains forward-looking statements that reflect the Company management s current views with respect to certain future events. Although it is believed that the
Subject: Report on the operating results of Country Group Development PCL for the period ended September 30, 2018
 CGD61/0054 Date: November 13, 2018 Subject: Report on the operating results of Country Group Development PCL for the period ended September 30, 2018 To: The President The Stock Exchange of Thailand Country
Date/Time : 10/08/ :58. PTT : Management's discussion and Analysis Q2/07. PTT Public Co., Ltd.
 Date/Time : 10/08/2007 20:58 PTT : Management's discussion and Analysis Q2/07 PTT Public Co., Ltd. Management's Discussion and Analysis (MD&A) and operating results for the three- month and six-month period
Healthier Net Profit under Stronger IDR
 Investor Bulletin, First Half 2002 Healthier Net Profit under Stronger IDR As of June 2002, the consolidated revenue in USD increased by 32% y.o.y. Due to IDR strengthening against USD, in IDR revenue
FY2012. H1 Financial Results. November 8, Copyright(C) 2011 Isuzu Motors Limited All rights reserved
 2011 Isuzu Motors Limited All rights reserved") FY2012 H1 Financial Results November 8, 2011 1 Copyright(C) 2011 Isuzu Motors Limited All rights reserved Ⅰ. President and Representative Director : Susumu Hosoi :FY2012 H1 Financial Summary Outline Ⅱ.
FY2012 H1 Financial Results November 8, 2011 1 Copyright(C) 2011 Isuzu Motors Limited All rights reserved Ⅰ. President and Representative Director : Susumu Hosoi :FY2012 H1 Financial Summary Outline Ⅱ.
Interim report Q3 2014
 Interim report Q3 2014 CEO Daniel Skjeldam CFO Erik Hansen 6 November 2014 Agenda Highlights and Key Figures Operational & Financial review Outlook Q&A 2 Highlights and key figures NOK 77 million pre tax
2010 1Q Investor Meeting. May 2010
 2010 1Q Investor Meeting May 2010 This presentation contains preliminary figures which may be materially different from the final figures. While the statements in this presentation represent our current
Stronger Fundamental and Excellent Growth
 Investor Bulletin, First Half 2004 Stronger Fundamental and Excellent Growth For the first six months of 2004, PT United Tractors Tbk (UT/Company) recorded consolidated net revenue of IDR 4.29 trillion,
FY2/16(March 2015~February 2016)
") FY2/16(March 2015~February 2016) 1. Trends in the current fiscal year and the previous fiscal year 3. Business overview (1) Peformance overview P.1 (1) No. of students at the end of month P.7 (2) Cost
FY2/16(March 2015~February 2016) 1. Trends in the current fiscal year and the previous fiscal year 3. Business overview (1) Peformance overview P.1 (1) No. of students at the end of month P.7 (2) Cost
TIRATHAI PUBLIC COMPANY LIMITED
 TIRATHAI PUBLIC COMPANY LIMITED OPPORTUNITY 25 AUGUST 2015 Content 1 Company Profile 2 Vision and Mission 3 Business Plan & Investment 4 Operating Result for 2 nd Quarter of 2015 5 Forecast for 2015 6
Months Investor Presentation
 2018 9 Months Investor Presentation 25.10.2018 Disclaimer Ereğli Demir Çelik Fabrikaları T.A.Ş. (Erdemir) may, when necessary, make written or verbal announcements about forward-looking information, expectations,
PT Astra International Tbk 2011 Full Year Financial Statements
 To: Business Editor For immediate release PT Astra International Tbk 2011 Full Year Financial Statements The following announcement was issued today by the Company s 71%-owned subsidiary, Jardine Cycle
FOURTH QUARTER 2013 RESULTS
 FOURTH QUARTER 213 RESULTS 12 MARCH 214 LUCA BETTONTE, CEO DISCLAIMER This document contains certain forward-looking information that is subject to a number of factors that may influence the accuracy of
Q Briefing 16 November 2016
 Q3 2016 Briefing 16 November 2016 CONSOLIDATED FINANCIAL HIGHLIGHTS In million Php, except ratios Q1 2015 Q2 2015 Q3 2015 YTD 2015 Q1 2016 Q2 2016 Q3 2016 YTD 2016 Variance Revenues 7,245 6,472 5,536 19,252
FY2/18 2Q(March 2017~August 2018)
") FY2/18 2Q(March 2017~August 2018) Fact Book 1. Trends in the current fiscal year and previous fiscal year 3. Business overview (1) Performance overview P.1 (1) No. of students at the end of month P.7 (2)
FY2/18 2Q(March 2017~August 2018) Fact Book 1. Trends in the current fiscal year and previous fiscal year 3. Business overview (1) Performance overview P.1 (1) No. of students at the end of month P.7 (2)
The Group is expected to continue benefiting from stable coal prices, but in the car market, competitive pressures are likely to intensify.
 PRESS RELEASE 24th April 2018 PT ASTRA INTERNATIONAL TBK 2018 FIRST QUARTER FINANCIAL STATEMENTS Highlights Net earnings per share down 2 at 123 Lower market share for cars and motorcycles Higher coal
FY2/15(March 2014~February 2015)
") FY2/15(March 2014~February 2015) 1. Trends in the current fiscal year and the previous fiscal year 3. Business overview (1) Peformance overview P.1 (1) No. of students at the end of month P.7 (2) Cost
FY2/15(March 2014~February 2015) 1. Trends in the current fiscal year and the previous fiscal year 3. Business overview (1) Peformance overview P.1 (1) No. of students at the end of month P.7 (2) Cost
Nissan Motor Co., Ltd. February 12 th, 2019
 Nissan Motor Co., Ltd. February 12 th, 2019 NET REVENUE 2,875.5 3,045.7 OPERATING PROFIT *1 NET INCOME 301.6 FREE CASH FLOW (AUTO) NET CASH (AUTO) 1,311.4 1,334.4 US TAX REFORM 207.7 82.4 103.3 93.9 *2
First half (2014/3/1~2014/8/31)
") FY2/15 (March 2014~November 201 4) 1.Trends in current fiscal year and previouse fiscal year 3.Business overview (1)Peformance overview P.1 (1)No. of students at the end of month P.7 (2)Cost of sales breakdown
FY2/15 (March 2014~November 201 4) 1.Trends in current fiscal year and previouse fiscal year 3.Business overview (1)Peformance overview P.1 (1)No. of students at the end of month P.7 (2)Cost of sales breakdown
RESILIENCE MBM RESOURCES BERHAD ( V) Analyst Briefing 24 August 2017
 Analyst Briefing 24 August 2017") RESILIENCE MBM RESOURCES BERHAD (284496-V) Analyst Briefing 24 August 217 1 1 DISCLAIMER The information and opinions contained in this presentation are provided as at the date of the document. Certain
RESILIENCE MBM RESOURCES BERHAD (284496-V) Analyst Briefing 24 August 217 1 1 DISCLAIMER The information and opinions contained in this presentation are provided as at the date of the document. Certain
National Treasury Presentation to the Standing Committee on Finance: South African Airways SOC Ltd ( SAA )
") National Treasury Presentation to the Standing Committee on Finance: South African Airways SOC Ltd ( SAA ) Presenter: National Treasury 18 November 2015 90 day Action Plan In November 2014, the Ministers
National Treasury Presentation to the Standing Committee on Finance: South African Airways SOC Ltd ( SAA ) Presenter: National Treasury 18 November 2015 90 day Action Plan In November 2014, the Ministers
BAYPORT SECURITISATION (RF) LTD INVESTOR REPORT
 LTD INVESTOR REPORT") BAYPORT SECURITISATION (RF) LTD INVESTOR REPORT September 2017 Note: The Company adopted IFRS 9 as at 31 December 2016. All impacted figures have been restated from that date. The adoption of IFRS 9 introduced
BAYPORT SECURITISATION (RF) LTD INVESTOR REPORT September 2017 Note: The Company adopted IFRS 9 as at 31 December 2016. All impacted figures have been restated from that date. The adoption of IFRS 9 introduced
BAYPORT SECURITISATION (RF) LTD INVESTOR REPORT
 LTD INVESTOR REPORT") BAYPORT SECURITISATION (RF) LTD INVESTOR REPORT November 2017 Note: The Company adopted IFRS 9 as at 31 December 2016. All impacted figures have been restated from that date. The adoption of IFRS 9 introduced
BAYPORT SECURITISATION (RF) LTD INVESTOR REPORT November 2017 Note: The Company adopted IFRS 9 as at 31 December 2016. All impacted figures have been restated from that date. The adoption of IFRS 9 introduced
Energy Absolute Public Company Limited
 Energy Absolute Public Company Limited March 2017 1 Our Business 2 Our Project Pipeline 3 Our Power Plant 4 Financial Results 2 E@ at a Glance 3 Established Core Business In 2006 to produce palm oil Renewable
JAGUAR LAND ROVER RESULTS FOR THE THREE MONTHS ENDED 31 DECEMBER th FEBRUARY 2017
 JAGUAR LAND ROVER RESULTS FOR THE THREE MONTHS ENDED 31 DECEMBER 2016 14 th FEBRUARY 2017 DISCLAIMER Statements in this presentation describing the objectives, projections, estimates and expectations of
FISCAL YEAR MARCH 2018 THIRD QUARTER FINANCIAL RESULTS
 FISCAL YEAR MARCH 2018 THIRD QUARTER FINANCIAL RESULTS PRESENTATION OUTLINE Highlights Fiscal Year March 2018 Nine Month Results Fiscal Year March 2018 Full Year Forecast Progress of Key Initiatives 1
Analyst Presentation 1Q 2008 Results
 Analyst Presentation 1Q 2008 Results 0 Contents Section 1: Section 2: Section 3: Section 4: Section 5: Company Overview IPO Update Operating Performance Consolidated Financial Performance Dividend Update
Dynasty Ceramic. We are making the impossible, POSSIBLE.
 Dynasty Ceramic We are making the impossible, POSSIBLE. Contents Road to Success Sales Reports Cost of Production Performance Competitor Analysis Going Forward Q & A 2 Dynasty Ceramic Road to Success DCC
Q3 Results November 16, 2006 Analyst Presentation
 Q3 Results 2006 November 16, 2006 Analyst Presentation Group Sales (in million Euro) Total Sales 2,395 +3.3% (+2.4%)* 2,474 Split per Business Group (YTD) Specialty Products 7% Q3 797 +1.0% (+2.5%)* 805
BAYPORT SECURITISATION (RF) LTD INVESTOR REPORT
 LTD INVESTOR REPORT") BAYPORT SECURITISATION (RF) LTD INVESTOR REPORT December 2017 Note: The Company adopted IFRS 9 as at 31 December 2016. All impacted figures have been restated from that date. The adoption of IFRS 9 introduced
BAYPORT SECURITISATION (RF) LTD INVESTOR REPORT December 2017 Note: The Company adopted IFRS 9 as at 31 December 2016. All impacted figures have been restated from that date. The adoption of IFRS 9 introduced
Cambodia. East Asia: Testing Times Ahead
 Key Indicators Cambodia 68 East Asia: Testing Times Ahead 2002 2003 2004 2005 2006 2007 /e 2008 /p 2009 /p Year Year Year Year Year Year Year Year Real GDP (% change, previous year) 6.5 8.5 10.0 13.5 10.8
FY H1 Financial Results
 FY2011 1 H1 Financial Results November 8, 2010 1 Copyright(C) 2010 Isuzu Motors Limited All rights reserved Contents Ⅰ. President and Representative Director : Susumu Hosoi :FY2011 H1 Financial Summary
BURGEONING RESOURCES SECTOR POWERS PACIFIC ENERGY TO ANOTHER RECORD RESULT
 350.4M 15.6M 17 August 2011 175+ MW BURGEONING RESOURCES SECTOR POWERS PACIFIC ENERGY TO ANOTHER RECORD RESULT Highlights $18.0M EBITDA - up 44 per cent on prior twelve-month period $8.4M Adjusted NPAT
Operating Results Q Asian Insulators Public Company Limited
 Operating Results Q2-2010 Asian Insulators Public Company Limited 254 Seri Thai Road, Kannayaow, Bangkok 10230 Thailand http://www.asianinsulators.com Tel. (66) 0-2517-1451 Fax. (66) 0-2517-1465 E-mail
Monthly Operating Report. December 2017
 Monthly Operating Report December 20 December overview» For the month of December 20 Contact recorded: Electricity and gas sales of 571 GWh (December 2016: 582 GWh) Netback of $79.23/MWh (December 2016:
 General Announcement::Astra's 2018 First Half Financial Statements http://infopub.sgx.com/apps?a=cow_corpannouncement_content&b=announcem... Page 1 of 1 26/7/2018 General Announcement::Astra's 2018 First
Docket No. DE Dated: 05/04/2015 Attachment CJG-1 Page 1
 Docket No. DE - Dated: 0/0/0 Attachment CJG- Page 8 9 Summary of Forecasted Energy Service 0 Cost For January 0 Through December 0 TOTAL COST Cents per KWH Reference Fossil energy costs $ 9,9 $. Attachment
Somboon Advance Technology PCL
 Somboon Advance Technology PCL Opportunity Day: 2014Q4 Mar 17, 2015 1 Company Overview Industry Overview Sale Performance Financial Highlights Q&A 2 Company Overview SAT Paid up 425 million Baht As of
JAGUAR LAND ROVER INVESTOR CALL
 JAGUAR LAND ROVER INVESTOR CALL RESULTS FOR THE THREE AND SIX MONTHS ENDED 30 SEPTEMBER 2017 Kenneth Gregor, CFO 9 th NOVEMBER 2017 DISCLAIMER Statements in this presentation describing the objectives,
TOFAŞ RESULTS WEBCAST PRESENTATION
 TOFAŞ 31.12.2016 RESULTS WEBCAST PRESENTATION 02.02.2017 1 WEBCAST AGENDA Highlights Turkish Automotive Industry Production Domestic Market Developments Tofaş Domestic Market Performance Export Markets
Jordan Petroleum Refinery Company Equity Report. Jordan Petroleum Refinery Company June June 14, 2009
 Jordan Petroleum Refinery Company Equity Report June 14, 2009 Serene Zawaydeh Head of Research Awraq Investments szawaydeh@awraq.com P a g e 1 Table of Contents Executive Summary... 1 Financial Highlights...
FISCAL YEAR MARCH 2015 FIRST QUARTER FINANCIAL RESULTS. Mazda Roadster 25 th Anniversary Model
 FISCAL YEAR MARCH 2015 FIRST QUARTER FINANCIAL RESULTS Mazda Roadster 25 th Anniversary Model Mazda Motor Corporation July 31, 2014 1 PRESENTATION OUTLINE Highlights Fiscal Year March 2015 First Quarter
PETROBRAS ARGENTINA S.A.
 PETROBRAS ARGENTINA S.A. Second Quarter 2015 Results Buenos Aires, July 30, 2015 Petrobras Argentina S.A. (Buenos Aires: PESA NYSE: PZE) announces the results for the second quarter ended June 30, 2015.
ABOITIZ POWER CORPORATION
 ABOITIZ POWER CORPORATION First Quarter 2013 Financial & Operating Results 3 May 2013 NET INCOME (in million pesos) 5,600 EPS = P0.76 18% 4,595 EPS = P0.62 5,083 3,971-22% 733 749 2% Distribution Generation
ENEL PUBLISHES 2018 SECOND QUARTER AND FIRST HALF GROUP OPERATING DATA REPORT
 Media Relations Investor Relations T +39 06 8305 5699 T +39 06 8305 7975 F +39 06 8305 3771 F +39 06 8305 7940 ufficiostampa@enel.com investor.relations@enel.com enel.com enel.com ENEL PUBLISHES 2018 SECOND
Presentation to Investors Q results ROYAL DSM HEALTH NUTRITION MATERIALS
 Presentation to Investors Q3 2016 results ROYAL DSM HEALTH NUTRITION MATERIALS Safe harbor statement This presentation may contain forward-looking statements with respect to DSM s future (financial) performance
FOR IMMEDIATE RELEASE
 Article No. 7845 Available on www.roymorgan.com Roy Morgan Unemployment Profile Friday, 18 January 2019 Unemployment in December is 9.7% and under-employment is 8.8% FOR IMMEDIATE RELEASE Australian unemployment
A2A Results. Milan, March 14 th, 2013
 A2A 2012 Results Milan, March 14 th, 2013 Agenda 2012 Main financial highlights Segment analysis From EBITDA to net income Net debt and cash flow Focus on A2A main projects: Edipower: Iren exit Waste project
Lazydays Holdings, Inc. Reports Third Quarter 2018 Financial Results
 News Contact: +1 (813) 204-4099 investors@lazydays.com Lazydays Holdings, Inc. Reports Third Quarter 2018 Financial Results Tampa, FL (November 8, 2018) Lazydays Holdings, Inc. ( Lazydays ) (NasdaqCM:
First half 2017 Results September 1, 2017
 PRESS RELEASE First half 2017 Results September 1, 2017 Full consolidation of Vivendi Group from April 26, 2017 and Sale to Vivendi of the Bolloré Group s 59.2% stake in Havas for 2,317 million euros completed
Results for the Three Months ended June 30, 2018
 Reference Translation Results for the Three Months ended June 30, 2018 July 31, 2018 AUTOBACS SEVEN CO., LTD. FY March 2019 Consolidated P/L Profit Loss/Gain: Net sales and gross profit decreased, and
A2A-LGH Partnership. Milan, September 8 th, Borsa Italiana Italian Infrastructure Day
 A2A-LGH Partnership Milan, September 8 th, 2016 Borsa Italiana Italian Infrastructure Day Partnership Rationale PARTNERSHIP CRITERIA PARTNERSHIP OPPORTUNITIES Territorial leadership Territorial investments
Cosmo Oil Co., Ltd. Presentation on Results for First Quarter of Fiscal 2012 August 2, 2012 Director: Satoshi Miyamoto
 Cosmo Oil Co., Ltd. Presentation on Results for First Quarter of Fiscal 2012 August 2, 2012 Director: Satoshi Miyamoto Copyright 2012 COSMO OIL CO.,LTD. All Rights Reserved. Key Points of Financial Results
Hindalco Industries Limited. Performance Review Q3 FY08 30 th January 08
 Hindalco Industries Limited Performance Review Q3 FY08 30 th January 08 Highlights & Backdrop Backdrop : Q3 FY08 Adverse Global Macro economic factors US Sub prime crisis a double barrel impact: A sharp
INCREASING SALES FOR MINING RELATED BUSINESS
 Investor Relations of PT UNITED TRACTORS Tbk INCREASING SALES FOR MINING RELATED BUSINESS In the first half 2001, the Company managed to record increase in net revenue from IDR 2.32 trillion to IDR 3.54
 General Announcement::Astra's 2017 3rd Quarter Financial Statements http://infopub.sgx.com/apps?a=cow_corpannouncement_content&b=announce... Page 1 of 1 31/10/2017 General Announcement::Astra's 2017 3rd
Financial Data Supplement Q4 2017
 Bank Financial Data Supplement Q4 2017 2 February 2018 Due to rounding, numbers presented throughout this document may not sum precisely to the totals we provide and percentages may not precisely reflect
Lazydays Holdings, Inc. Reports Second Quarter 2018 Financial Results
 News Contact: +1 (813) 204-4099 investors@lazydays.com Lazydays Holdings, Inc. Reports Second Quarter 2018 Financial Results Tampa, FL (August 9, 2018) Lazydays Holdings, Inc. ( Lazydays )(NasdaqCM: LAZY)
282m 75% +575m. Net sales Operating income before non-recurring items. Operating margin before non-recurring items. Net Loss.
 First-Half 2009 Financial Highlights Net sales Operating income before non-recurring items Operating margin before non-recurring items Net Loss Net debt-to-equity ratio Free cash flow** 7,134m 282m 4.0%
FY2017 Results. February 26, 2018
 FY2017 Results February 26, 2018 Our background & development Registered capital increased to 12 MB Started International marine transportation ( Myanmar route ) Registered capital increased to 100 MB
Commercial-in-Confidence Ashton Old Baths Financial Model - Detailed Cashflow
 Year 0 1 2 3 4 5 6 7 8 9 10 11 12 13 Oct-16 Nov-16 Dec-16 Jan-17 Feb-17 Mar-17 Apr-17 May-17 Jun-17 Jul-17 Aug-17 Sep-17 Oct-17 2,038 2,922 4,089 4,349 6,256 7,124 8,885 8,885 8,885 8,885 8,885 8,885 9,107
1 st Half 2018 Results. August 1 st, 2018
 1 st Half 2018 Results August 1 st, 2018 H1 HIGHLIGHTS & CATEGORY SPOTLIGHTS Gonzalve BICH 2 First Half 2018 Key Messages Challenging market and business environment Continued investment in targeted Brand
Total Production by Month (Acre Feet)
") Production by Month (acre-feet) 2008 2009 2010 2011 2012 2013 2014 2015 2016 January 25 339.10 228.90 249.50 297.99 243.06 327.14 247.66 212.37 February 234.00 218.80 212.10 241.52 245.82 279.08 234.16
Production by Month (acre-feet) 2008 2009 2010 2011 2012 2013 2014 2015 2016 January 25 339.10 228.90 249.50 297.99 243.06 327.14 247.66 212.37 February 234.00 218.80 212.10 241.52 245.82 279.08 234.16
Federated States of Micronesia
 IMF Country Report No. 13/17 Federated States of Micronesia 2012 ARTICLE IV CONSULTATION 2012 Statistical Appendix January 29, 2001 January 29, 2001 This Statistical Appendix paper for the Federated States
Preliminary Results 12 May 2009
 Preliminary Results 12 May 2009 Working together for Greener logistics solutions For period ended 28 February 2009 www.stobartgroup.com Highlights Year of growth, laying foundations for the multimodal
Tethys assets. Sweden - Gotland större - Gotland mindre. Lithuania - Gargzdai - Rietavas - Raiseiniai. France - Attila - Permis du Bassin D Alès
 1 Tethys assets Sweden - Gotland större - Gotland mindre Lithuania - Gargzdai - Rietavas - Raiseiniai France - Attila - Permis du Bassin D Alès Oman - Block 3 & 4 - Block 15 2 Tethys Oil - An expanding
A2A Results. Milan, March 23 th, 2012
 A2A 2011 Results Milan, March 23 th, 2012 Agenda 2011 Main financial highlights Non-recurring and extraordinary items From EBITDA to Restated Net Income EBITDA Segment analysis Net debt and Cash Flow This
VGI Global Media Plc. 2015/16 Earnings Presentation 16 May 2016
 VGI Global Media Plc 2015/16 Earnings Presentation 16 May 2016 Disclaimer Investment involves risk. Prospective should understand the characteristics of Securities and study information about VGI Global
PT Astra International Tbk 2018 Third Quarter Financial Statements
 To: Business Editor 29th October 2018 For immediate release PT Astra International Tbk 2018 Third Quarter Financial Statements The following announcement was issued today by the Company s 75%-owned subsidiary,
Metal Bulletin Conference
 Sakura Ferroalloys Project Metal Bulletin Conference Singapore, 01 st April 2015 P R E S E N T E D BY: T I A A N VA N A S W EG E N D I R E C TO R A S S M A N G C H A I R M A N S A KU R A F E R R OALLOY
UMW-OG ACHIEVES PRETAX PROFIT OF RM76M IN 3Q14
 Quarterly Investor UMW-OG ACHIEVES PRETAX PROFIT OF RM76M IN RM million 2Q14 Change (%) Profit Before Taxation 75.8 66.2 14.5% EXECUTIVE SUMMARY financial highlights Group revenue and profit before taxation
Ameren Missouri. AMENDED Renewable Energy Standard Compliance Report Prepared in Compliance with 4 CSR
 Ameren Missouri AMENDED Renewable Energy Standard Compliance Report 2015 Prepared in Compliance with 4 CSR 240-20.100 June 23, 2016 NP Table of Contents Page INTRODUCTION...4 SECTION (8) (A) 1 A: TOTAL
Delivering for our stakeholders. Annual Results May 2018
 1 Delivering for our stakeholders Annual Results 2018 10 May 2018 2 Non Annual Results 2018 Contents 1. Introduction (IF) 2. (WB) 3. Aviation (GJ) 4. Carlisle Lake District Airport (AT) 5. Energy (BW)
TIRATHAI PUBLIC COMPANY LIMITED
 TIRATHAI PUBLIC COMPANY LIMITED OPPORTUNITY DAY ON 26 FEBRUARY 2015 Content 1 Company Profile 2 Vision and Mission 3 Operating Result for the year 2014 4 Business Plan & Investment 5 Forecast for 2015