Delivering for our stakeholders. Annual Results May 2018
|
|
|
- Byron Cain
- 5 years ago
- Views:
Transcription


1 1 Delivering for our stakeholders Annual Results May 2018
2 2 Non Annual Results 2018 Contents 1. Introduction (IF) 2. (WB) 3. Aviation (GJ) 4. Carlisle Lake District Airport (AT) 5. Energy (BW) 6. Rail (RL) 7. Infrastructure (RL) 8. Investments (RL) 9. (RL) 10. Divisional Outlook (WB) 11. Appendix
3 3 Introduction Non Highlights Increased underlying EBITDA to 135.2m All operating divisions improved underlying EBITDA year-on-year Realised cash of 111.9m following the partial disposal of the investment in ESL Returned 74.1m to shareholders via dividends and share buy backs Final dividend of 4.5p being proposed, to be paid in July 2018 Warwick Brady appointed Chief Executive Officer on 1 July 2017 Richard Laycock appointed Chief Officer on 1 February 2018 Nick Dilworth appointed Commercial Director on 30 October 2017
4 4 highlights Increased turnover Turnover increased by 112.6m (87%) with airline included Non Turnover Improved profitability Underlying EBITDA of 135.2m (+294%) Underlying profit before tax of 117.4m Both of these measures include the 123.9m profit on partial disposal of Eddie Stobart Logistics Balance sheet and returns to shareholders Gearing decreased to 9.0% (February 2017: 31.1%) (net debt/total equity) Infrastructure realisations generated 27.3m net cash proceeds (2017: 52.7m) Returned 74.1m to shareholders during the period through dividends and buy backs Final dividend of 4.5p being proposed 242.0m Underlying EBITDA 135.2m Returns to shareholders 74.1m
5 5 Delivery of shareholder value 3 year share price v FTSE 250 Non m % 180% 160% 140% 120% 100% 80% 60% 40% 20% 0% 5 May 15 Sep 15 Jan 16 May 16 Sep 16 Jan 17 May 17 Sep 17 Jan 18 Stobart FTSE 250 Dividends Source: London Stock Exchange website 112.5m of dividends returned to shareholders since 1 March m returned to shareholders in the year, including dividends of 58.1m and share buybacks of 16.0m (net) As said at interims, dividends being supported by asset disposals as operating cash grows -20%

6 6 and objectives Stobart value wheel Key observations Non Stobart Logistics expertise and customer focus Engaged, motivated and skilled workforce Great potential for growth Entrepreneurial company Valuable Superbrand Trusted to deliver Identify and exploit opportunities in Aviation sector, London capacity constraints and customer service Drive efficiencies and growth within Energy division Continue to grow our innovative Rail & Civils division Realise assets and investments at the right time Invest in our people Ambitious growth targets set for divisions
7 7 Stobart Aviation Industry situation Capacity crisis at London airports UK passenger experience needs to improve Aviation growth continues to outperform GDP Opportunities for Stobart across the sector Non The strategy Continue to grow and develop our London airport with great customer service Develop our Aviation Services business Stobart Air to play a leading part in regional airline consolidation Continue to develop our wider aviation businesses such as the Jet Centre
 was the fastest growing UK airport in 2017 29% increase in passenger numbers at LSA Launch of new Stobart Jet Centre Stobart Aviation Services won external contract")
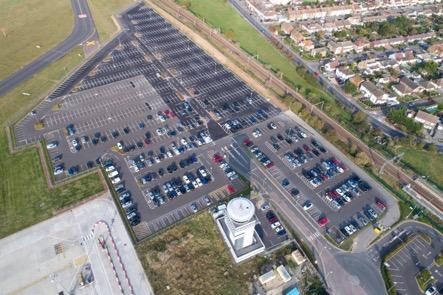
8 8 Stobart Aviation Stobart Aviation aims to deliver a first class passenger experience. Non London Southend Airport (LSA) was the fastest growing UK airport in % increase in passenger numbers at LSA Launch of new Stobart Jet Centre Stobart Aviation Services won external contract 9% increase in passenger numbers on our regional airline Stobart Air Commercial flying from Carlisle Lake District Airport to begin in June 2018 with Loganair We anticipate continued strong growth and have challenging ambitions for 2022
9 9 summary - Aviation Non Aviation m Revenue Underlying EBITDA Passenger numbers LSA 1,126, ,000 Passenger numbers Stobart Air airline 1,684,000 1,542,000 Revenue increase due to airline and Propius being included for the first time Hotel running at 84% occupancy In advanced discussions with F&B operators to introduce national brand concessions in summer 2018 Added three new airlines in the year Investment in relation to awareness, route development, branding, marketing and airline incentive deals

10 10 Stobart Aviation Services case study Non Stobart Aviation Services was successfully awarded first external contract Using logistics brand and knowledge to gain a competitive advantage Appointed Graeme Undy as MD, formerly Eddie Stobart Logistics Long-term contract with easyjet at London Stansted Airport for ground handling services commenced March 2018 Using real time technology, matching activity to resources High level of customer service and attention to detail


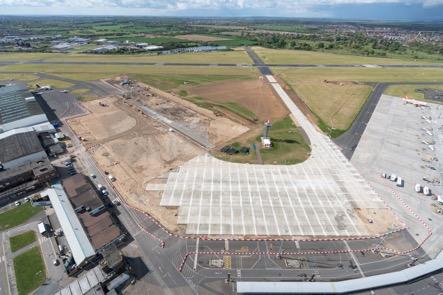
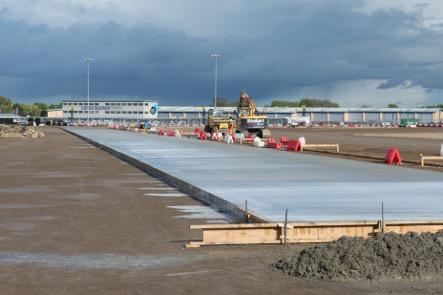
11 11 Carlisle Lake District Airport case study Non Stobart Rail & Civils have delivered regional airport within six months for a significantly reduced cost, without compromising quality Driving property strategy and creating a logistics hub at the airport Increasing connectivity Well located, just off the M6 Motorway

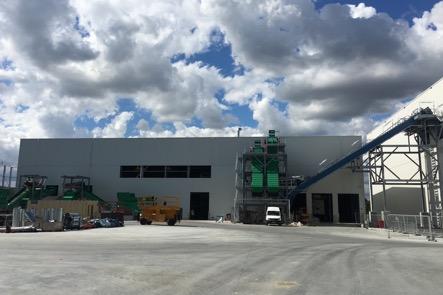
12 12 Stobart Energy Stobart Energy is the number one supplier of biomass in the UK, sourcing, processing and transporting fuel to renewable energy plants under long-term index linked contracts. Non On course to meet 2018 strategic targets 2.0m tonnes annual run rate: 1.3m run rate in the final quarter of year end February 2018 with a further three new plants to come on line in 2018 EBITDA per tonne of 10: at 28 February 2018 proves the business model Key challenges to delivering the plan: Plant performance Environment Agency Repairing / rebuilding supply chains
13 13 summary - Energy Non Energy m Revenue Underlying EBITDA Tonnes sold (number) 887, ,000 Underlying EBITDA per tonne ( ) % increase year-on-year in underlying EBITDA per tonne Revenue decrease due to reduced transport fleet size which will build back up as and when new plants come on line Volume increase of 14,000 tonnes driven by commissioning of new plants offset by one-off customer administration and strategic exit from export market Impact of commissioning issues and delays resulted in 3.8m of non-underlying costs. We have negotiated compensation packages with the new plants to contribute towards some of these costs

14 14 Tilbury example of issues faced Actual v forecast tonnages Non
15 15 Non Contract lengths and annual tonnages top 10 plants Average Length > 14 years Average Annual Tonnes > 170, , , , , , ,000 0 A B C D E F G H I J Years Annual Tonnes Average length Average Tonnes 0
 New business opportunity of over 3m tonnes and growing Widening same offering with innovative Full Service Solution to new and existing plants Full Service Solution driven by desire to innovate")
16 16 Progress towards 2022 plan Drive efficiencies from current operations Target other recycled fibre (RCF) plants Expansion into new waste streams refuse derived fuel (RDF) and solid recovered fuel (SRF) New business opportunity of over 3m tonnes and growing Widening same offering with innovative Full Service Solution to new and existing plants Full Service Solution driven by desire to innovate and challenge traditional ways of operating Non
17 17 Stobart Rail & Civils Stobart Rail & Civils is one of the UK s leading names in rail maintenance, repair and improvement. Non Strong pipeline of work c. 75m Considerable value added at sites; LSA, CLDA and renewable energy processing sites Achieved good margins across all contracts won throughout the year Working with external contract partners Network Rail, BAM Nuttall, AMEY, ARUP Devegetation framework continues to develop strongly Maintained five-star Quality Management System for a fourth consecutive year

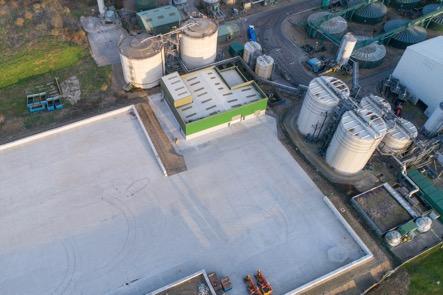
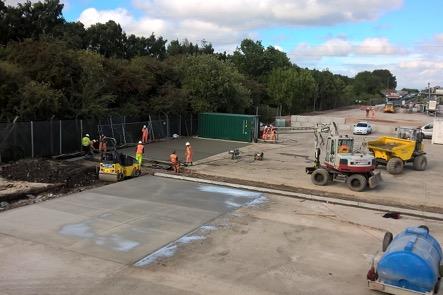
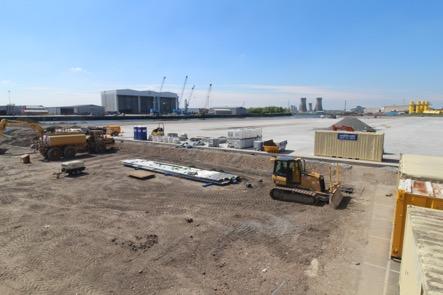

18 18 Rail & Civils supporting internal infrastructure Non
19 19 summary Rail & Civils Non Rail & Civils m Revenue Underlying EBITDA External revenue reduced in the year as a major contract was completed in the prior year, but revenue for work for internal sites increased Profitability has been maintained and improved Profits on internal capital work are eliminated on consolidation

20 20 Stobart Infrastructure Our Infrastructure division has a strong track record of enhancing the value of the s assets. Non Four non-strategic asset disposals in the year generating cash proceeds of 27.3m All disposals at or above book value Advance discussions for further asset disposals
21 21 summary - Infrastructure Non Infrastructure m Revenue Underlying EBITDA Number of disposals 4 3 Net proceeds from disposals 27.3* 52.7 Infrastructure asset values *of which 2.3m remains outstanding at the year end.
 received in addition to 12.5% investment in newly AIM listed Eddie Stobart Logistics Recent results were positive with a 14% increase in revenue and a 17% increase in underlying EBIT to 48.")
22 22 Stobart Investments Stobart Investments holds the s 12.5% investment in Eddie Stobart Logistics. Non Significant profit on partial disposal of 49% investment in Eddie Stobart Cash proceeds of 111.9m (net) received in addition to 12.5% investment in newly AIM listed Eddie Stobart Logistics Recent results were positive with a 14% increase in revenue and a 17% increase in underlying EBIT to 48.5m 0.6m dividend received in the year, with a 4.4p dividend announced, payable in June 2018, totalling 2.0m for the Stobart owns the Eddie Stobart brands and licence them to ESL on a 15 year agreement
23 23 summary - Investments Non Investments m Underlying EBITDA profit on partial disposal of Eddie Stobart Underlying EBITDA Eddie Stobart dividend 0.6 Underlying EBITDA Eddie Stobart share of profits (pre disposal) Underlying EBITDA total
24 24 Income statement Non m revenue Underlying EBITDA by division Energy Aviation Rail & Civils Investments Infrastructure Central costs and eliminations (13.3) (8.1) Underlying EBITDA
 117.4 (9.0) 110 (0.8) 1.3 (4.1) 100 (4.2) 100.")

25 25 Underlying EBITDA to profit before tax bridge Non (1.8) 1.0 (15.3) 120 (1.7) (9.0) 110 (0.8) 1.3 (4.1) 100 (4.2) Underlying EBITDA Foreign exchange Swaps Depreciation Net interest Profit before nonunderlying items New business and contract set up costs Transaction costs Bad debts Litigation and claims Amortisation (non-cash) Profit before tax
26 26 Balance sheet Non m Intangible assets Tangible assets Investment and non-current receivables Current assets (excluding cash) Cash and restricted cash Gross assets Gross liabilities (248.3) (278.5) Net assets Net debt Gearing 9.0% 31.1%
27 27 Cash flow analysis Non m Profit/(loss) before tax from continuing operations (8.0) Add back: Non-cash adjusting items (120.2) 1.9 Working capital movement and tax Cash flow from operating activities (9.5) (1.7) Cash flow from investing activities Cash flow from financing activities (159.0) (17.5) Increase in cash Cash at the beginning of the year Cash at the end of the year
28 28 Divisional outlook Non Aviation Wider strategy in place to invest in aviation sector London Southend was the UK s fastest growing airport in 2017 Aviation Services growing after winning contract for easyjet at Stansted Our regional airline, Stobart Air, is growing and is a valuable asset Energy Short-term delays in the commissioning will not impact long-term volumes focused on further efficiencies and growth Rail & Civils Will continue to build external relationships and add value to the wider Infrastructure and Investments Continue to realise assets and investments at the right time
29 29 Appendix: Operational date of plants Non 2016 Annual Report 2017 Annual Report Plant First wood Commercial takeover Expected volume (tonnes) First wood Commercial takeover Expected volume (tonnes) Mersey Bioenergy Oct 2016 Mar ,614 Dec 2016 May ,561 Tilbury Jan 2017 May ,000 Mar 2017 Jul ,105 Templeborough Jan 2017 May ,813 Jul 2017 Nov ,007 Margam Oct 2016 Jan ,025 Aug 2017 Dec ,970 Port Clarence Aug 2017 Dec ,500 Nov 2017 Mar Cramlington Jan 2018 May ,050 Jul 2017 Dec ,050 1,346, ,693 Latest notification Variance of latest to 2017 Annual Report Plant First wood Commercial takeover Volume to date (tonnes) First wood (months) Commercial takeover (months) Volume (tonnes) Mersey Bioenergy Dec 2016 May , (53,698) Tilbury Mar 2017 May , (251,771) Templeborough Apr 2018 Jul , (197,125) Margam Apr 2018 Jul (175,584) Port Clarence Jun 2018 Sep Cramlington Jul 2017 May , (17,492) 245,023 (695,669)
30
Solid Progress across the Group despite a tough environment Rodney Baker Bates, Non-Executive Chairman
 Solid Progress across the Group despite a tough environment Rodney Baker Bates, Non-Executive Chairman Our strategy to deliver value through our new focussed divisional structure is underway. We have seen
Interim Results and Business Overview 2010
 Introduction and Highlights Stobart Group recently completed its third full year as a Listed Company and I am pleased to be able to report on another period of further progress and increased profitability.
Preliminary Results 12 May 2009
 Preliminary Results 12 May 2009 Working together for Greener logistics solutions For period ended 28 February 2009 www.stobartgroup.com Highlights Year of growth, laying foundations for the multimodal
National Treasury Presentation to the Standing Committee on Finance: South African Airways SOC Ltd ( SAA )
") National Treasury Presentation to the Standing Committee on Finance: South African Airways SOC Ltd ( SAA ) Presenter: National Treasury 18 November 2015 90 day Action Plan In November 2014, the Ministers
National Treasury Presentation to the Standing Committee on Finance: South African Airways SOC Ltd ( SAA ) Presenter: National Treasury 18 November 2015 90 day Action Plan In November 2014, the Ministers
Q Analyst Teleconference. 9 August 2018
 9 August 218 Disclaimer This presentation contains forward-looking statements that reflect the Company management s current views with respect to certain future events. Although it is believed that the
1. Trends in the current fiscal year and previous fiscal year 3. Business overview 2. Secular trends in first quarter financial results
 FY2/19 (March 2018~May 2018) Fact Book 1. Trends in the current fiscal year and previous fiscal year 3. Business overview (1) Performance overview P. 1 (1) No. of students at the end of month P. 6 (2)
2010 1Q Investor Meeting. May 2010
 2010 1Q Investor Meeting May 2010 This presentation contains preliminary figures which may be materially different from the final figures. While the statements in this presentation represent our current
2015 Interim Results Announcement
 China Petroleum & Chemical Corporation 2015 Interim Results Announcement August 27, 2015 Hong Kong Cautionary Statement This presentation and the presentation materials distributed herein include forward-looking
2002/03 Interim Announcement 11 November
 2002/03 Interim Announcement 11 November 2002 www.renold.com Financial Summary First Half First Half 2002/03 2001/02 m m Turnover 91.3 97.6 Trading profit before exceptional items 4.7 3.8 Profit before
TOFAŞ Q ANALYST PRESENTATION
 TOFAŞ Q1 2016 ANALYST PRESENTATION 03.05.2016 1 2016 Q1 AGENDA Highlights Turkish Automotive Industry Production & Capacity Utilization Domestic Market Developments Tofaş Domestic Market Performance Export
AMAG reports revenue and earnings growth in Q3 2015
 Ranshofen, November 3, 2015 AMAG reports revenue and earnings growth in Q3 2015 Shipment volumes up 8 % to 97,600 tonnes Revenue grows 16 % to EUR 233 million EBITDA improves 6 % to EUR 33.9 million Ramp-up
Respect for customers, partners and staff. Service: another name for the respect that a company owes its customers, partners and staff.
 Respect for customers, partners and staff Service: another name for the respect that a company owes its customers, partners and staff. Vehicle glass KEY FIGURES (in EUR million) 2004 2003 % change Total
MONRO MUFFLER BRAKE, INC. PROVIDES FOURTH QUARTER AND FISCAL 2017 FINANCIAL RESULTS
 CONTACT: John Van Heel Chief Executive Officer (585) 647-6400 Robert Gross Executive Chairman (585) 647-6400 FOR IMMEDIATE RELEASE Brian D Ambrosia Senior Vice President Finance Chief Financial Officer
FISCAL YEAR MARCH 2015 FIRST QUARTER FINANCIAL RESULTS. Mazda Roadster 25 th Anniversary Model
 FISCAL YEAR MARCH 2015 FIRST QUARTER FINANCIAL RESULTS Mazda Roadster 25 th Anniversary Model Mazda Motor Corporation July 31, 2014 1 PRESENTATION OUTLINE Highlights Fiscal Year March 2015 First Quarter
Monro, Inc. Second Quarter Fiscal 2019 Earnings Call. October 25, 2018
 Monro, Inc. Second Quarter Fiscal 2019 Earnings Call October 25, 2018 Safe Harbor Statement and Non-GAAP Measures Certain statements in this presentation, other than statements of historical fact, including
FISCAL YEAR MARCH 2015 FIRST HALF FINANCIAL RESULTS. New Mazda Demio
 FISCAL YEAR MARCH 2015 FIRST HALF FINANCIAL RESULTS New Mazda Demio Mazda Motor Corporation October 31, 2014 1 PRESENTATION OUTLINE Highlights Fiscal Year March 2015 First Half Results Fiscal Year March
2Q06 Results. Investor Relations
 2Q06 Results Investor Relations Content 1. 2Q06 Key Results 2. Summarized Income Statement 3. Balance Sheet as of Jun. 2006 4. Outlook for 2006 5. Result & Outlook By Division Appendix : 2Q06 Results Breakdown
FY2/17 (March 2016~February 2017)
") FY2/17 (March 2016~February 2017) Fact Book 1. Trends in the current fiscal year and previous fiscal year 3. Business overview (1) Performance overview P. 1 (1) No. of students at the end of month P. 7
FY2/17 (March 2016~February 2017) Fact Book 1. Trends in the current fiscal year and previous fiscal year 3. Business overview (1) Performance overview P. 1 (1) No. of students at the end of month P. 7
AMAG posts record shipments in 2013; dividend recommendation of 0.60 EUR per share unchanged on last year
 Ranshofen, 28 February 2014 AMAG posts record shipments in 2013; dividend recommendation of 0.60 EUR per share unchanged on last year Shipments at an all-time high of 351,700 tonnes (t) in 2013, compared
FY2/18 (March 2017~February 2018)
") FY2/18 (March 2017~February 2018) Fact Book 1. Trends in the current fiscal year and previous fiscal year 3. Business overview (1) Performance overview P. 1 (1) No. of students at the end of month P. 6
FY2/18 (March 2017~February 2018) Fact Book 1. Trends in the current fiscal year and previous fiscal year 3. Business overview (1) Performance overview P. 1 (1) No. of students at the end of month P. 6
Strong performance by the Bolloré Group s operating activities in 2018 Mr Cyrille Bolloré unanimously appointed Chairman and Chief Executive Officer
 PRESS RELEASE 2018 results (1) March 14, 2019 Strong performance by the Bolloré Group s operating activities in 2018 Mr Cyrille Bolloré unanimously appointed Chairman and Chief Executive Officer Revenue:
Valvoline Fourth-Quarter Fiscal 2016 Earnings Conference Call. November 9, 2016
 Valvoline Fourth-Quarter Fiscal 2016 Earnings Conference Call November 9, 2016 Forward-Looking Statements This presentation contains forward-looking statements within the meaning of Section 27A of the
BURGEONING RESOURCES SECTOR POWERS PACIFIC ENERGY TO ANOTHER RECORD RESULT
 350.4M 15.6M 17 August 2011 175+ MW BURGEONING RESOURCES SECTOR POWERS PACIFIC ENERGY TO ANOTHER RECORD RESULT Highlights $18.0M EBITDA - up 44 per cent on prior twelve-month period $8.4M Adjusted NPAT
KCB GROUP PLC INVESTOR PRESENTATION. Q FINANCIAL RESULTS
 KCB GROUP PLC INVESTOR PRESENTATION. Q3 2018 FINANCIAL RESULTS MACRO-ECONOMIC HIGHLIGHTS Macro-Economic Highlights: Kenya KENYA 4.9% 5.3% GDP Growth Rate (%) 5.6% 5.8% 4.9% 6.3% 6.2% KENYA 2013 2014 2015
CONFERENCE CALL RESULTS Q1 2017
 CONFERENCE CALL RESULTS Q1 2017 May 5, 2017 Marc Bunz (CFO) Nicolas-Fabian Schweizer (CTO) AGENDA Market & Strategy Update Financials 2016 Financials Q1 2017 Outlook SCHWEIZER Share Schweizer Electronic
ANALYST BRIEFING FOR THE THIRD QUARTER ENDED NOV 2016
 ANALYST BRIEFING FOR THE THIRD QUARTER ENDED 2016 21 NOV 2016 MSM Malaysia Holdings Berhad Analyst Briefing Q3 2016 21/11/2016 1 CONTENTS 01 02 03 04 05 Group Financial Highlights Performance Review Sugar
Fiscal Year 2012: Year of record operational performance
 Ranshofen, March 1, 2013 Fiscal Year 2012: Year of record operational performance Year of record operational performance: - 327,800 tons of external shipments - 266,900 tons of scrap charged in Ranshofen
FY2/18 2Q(March 2017~August 2018)
") FY2/18 2Q(March 2017~August 2018) Fact Book 1. Trends in the current fiscal year and previous fiscal year 3. Business overview (1) Performance overview P.1 (1) No. of students at the end of month P.7 (2)
FY2/18 2Q(March 2017~August 2018) Fact Book 1. Trends in the current fiscal year and previous fiscal year 3. Business overview (1) Performance overview P.1 (1) No. of students at the end of month P.7 (2)
Jordan Petroleum Refinery Company Equity Report. Jordan Petroleum Refinery Company June June 14, 2009
 Jordan Petroleum Refinery Company Equity Report June 14, 2009 Serene Zawaydeh Head of Research Awraq Investments szawaydeh@awraq.com P a g e 1 Table of Contents Executive Summary... 1 Financial Highlights...
Months Investor Presentation
 2018 9 Months Investor Presentation 25.10.2018 Disclaimer Ereğli Demir Çelik Fabrikaları T.A.Ş. (Erdemir) may, when necessary, make written or verbal announcements about forward-looking information, expectations,
Q3 Results November 16, 2006 Analyst Presentation
 Q3 Results 2006 November 16, 2006 Analyst Presentation Group Sales (in million Euro) Total Sales 2,395 +3.3% (+2.4%)* 2,474 Split per Business Group (YTD) Specialty Products 7% Q3 797 +1.0% (+2.5%)* 805
FISCAL YEAR MARCH 2018 FIRST HALF FINANCIAL RESULTS
 FISCAL YEAR MARCH 2018 FIRST HALF FINANCIAL RESULTS PRESENTATION OUTLINE Highlights Fiscal Year March 2018 First Half Results Fiscal Year March 2018 Full Year Forecast Progress of Key Initiatives/ Business
TOFAŞ RESULTS WEBCAST PRESENTATION
 TOFAŞ 31.12.2016 RESULTS WEBCAST PRESENTATION 02.02.2017 1 WEBCAST AGENDA Highlights Turkish Automotive Industry Production Domestic Market Developments Tofaş Domestic Market Performance Export Markets
FISCAL YEAR MARCH 2014 FINANCIAL RESULTS
 FISCAL YEAR MARCH 214 FINANCIAL RESULTS Mazda CX-5 Mazda Atenza Mazda Motor Corporation April 25, 214 New Mazda Axela 1 PRESENTATION OUTLINE Highlights Fiscal Year March 214 Results Fiscal Year March 215
Interim Review Q1 2006
 Interim Review Q1 2006 April 26, 2006 April 26, 2006 www.ruukki.com Strategy Moving Ahead Recent Structural Changes Business Environment Financials 1-3/2006 Near-term Outlook Summary 2 April 26, 2006 www.ruukki.com
FY2/17 3Q(March 2016~November2016)
") FY2/17 (March 2016~November2016) Fact Book 1. Trends in the current fiscal year and previous fiscal year 3. Business overview (1) Performance overview P. 1 (1) No. of students at the end of month P. 7
FY2/17 (March 2016~November2016) Fact Book 1. Trends in the current fiscal year and previous fiscal year 3. Business overview (1) Performance overview P. 1 (1) No. of students at the end of month P. 7
2010 Interim Results Presentation. August 23, 2010 Hong Kong
 Sinopec Corp. 21 Interim Results Presentation August 23, 21 Hong Kong Disclaimer i This presentation and the presentation materials distributed herein include forwardlooking statements. All statements,
Martin Laubscher Barloworld Automotive
 Barloworld Limited Investor Day Martin Laubscher Barloworld Automotive 2 February 2009 Business Overview Automotive Division Car Rental Fleet Services Motor Retail Joint Ventures Southern Africa Southern
3 rd Quarter 2017 Results
 Inside your life! 3 rd Quarter 2017 Results October 25, 2017 Mobile Automotive Display Semiconductor IoT LED Contents Ⅰ. Q3 2017 Earnings Summary Ⅱ. Earnings Highlight & Outlook Ⅲ. Results & Outlook by
9M 2003 Financial Results (US GAAP)
") 9M Financial Results (US GAAP) January 2004 LUKOIL Group Crude Oil Production* mln tonnes 82 80 78 76 74 72 70 68 66 64 Crude oil production 3.2 5.5 3.9 76.8 70.3 71.3 2001 Production by subsidiaries Share
9M Financial Results (US GAAP) January 2004 LUKOIL Group Crude Oil Production* mln tonnes 82 80 78 76 74 72 70 68 66 64 Crude oil production 3.2 5.5 3.9 76.8 70.3 71.3 2001 Production by subsidiaries Share
Interim report January 1 September 30, 2017
 Interim report January 1 September 30, 2017 Peter Wågström President and CEO Mattias Lundgren CFO 1 NCC Q3 2017 Lower net sales in NCC Building Impairment losses in NCC Infrastructure Good earnings in
Interim report Q3 2014
 Interim report Q3 2014 CEO Daniel Skjeldam CFO Erik Hansen 6 November 2014 Agenda Highlights and Key Figures Operational & Financial review Outlook Q&A 2 Highlights and key figures NOK 77 million pre tax
2 ND QUARTER 2016 INVESTOR PRESENTATION 26 AUGUST Geir Håøy, President and CEO Hans-Jørgen Wibstad, CFO
 2 ND QUARTER 2016 INVESTOR PRESENTATION 26 AUGUST 2016 Geir Håøy, President and CEO Hans-Jørgen Wibstad, CFO WORLD CLASS - through people, technology and dedication Page 2 HIGHLIGHTS Stable activity level
Laboratory worker at Goedgevonden Coal Mine
 82 Laboratory worker at Goedgevonden Coal Mine Integrated Annual Report 2013 Operational review ARM Coal 83 ARM Coal F2013 F2012 % change ARM Coal attributable sales volumes (000t) Headline earnings Rm
MONRO MUFFLER BRAKE, INC. ANNOUNCES FOURTH QUARTER AND FISCAL 2015 FINANCIAL RESULTS
 CONTACT: John Van Heel Chief Executive Officer (585) 647-6400 Robert Gross Executive Chairman (585) 647-6400 Catherine D Amico Executive Vice President Finance Chief Financial Officer (585) 647-6400 Investors:
282m 75% +575m. Net sales Operating income before non-recurring items. Operating margin before non-recurring items. Net Loss.
 First-Half 2009 Financial Highlights Net sales Operating income before non-recurring items Operating margin before non-recurring items Net Loss Net debt-to-equity ratio Free cash flow** 7,134m 282m 4.0%
JAGUAR LAND ROVER RESULTS FOR THE THREE MONTHS ENDED 31 DECEMBER th FEBRUARY 2017
 JAGUAR LAND ROVER RESULTS FOR THE THREE MONTHS ENDED 31 DECEMBER 2016 14 th FEBRUARY 2017 DISCLAIMER Statements in this presentation describing the objectives, projections, estimates and expectations of
Ricardo plc Ricardo plc Interims presentation 10/11 6 Months to 31 December 2010
 1 Ricardo plc Interims presentation 10/11 6 Months to 31 December 2010 2 H1 HIGHLIGHTS (six months to 31 December 2010) Order book up 16% to 117m, following strong intake (June 10: 101m) Multi-year engineering,
FISCAL YEAR ENDED MARCH 2011 FINANCIAL RESULTS
 FISCAL YEAR ENDED MARCH 211 FINANCIAL RESULTS Mazda Motor Corporation April 28, 211 Mazda MINAGI 1 PRESENTATION OUTLINE Highlights Fiscal Year Ended March 211 Results In Summary Question & Answer Session
1 st Half Joakim Olsson CEO and President July 17, Innovative Vehicle Technology
 1 st Half 2009 Joakim Olsson CEO and President July 17, 2009 Innovative Vehicle Technology 2009-07-17 Summary 1st half 2009 Sales of SEK 2,971m (4,473) Adjusted for currency exchange rates, sales declined
Kongsberg Automotive ASA. Fourth quarter February 28, 2019
 Kongsberg Automotive ASA Fourth quarter - February 28, 2019 Highlights Q4 Sales Revenues grew by 21 (7.3%) YoY to 288 including negative FX effects of 1. We booked new business with 77 in expected annual
2002 Preliminary Announcement 10 June 2002
 2002 Preliminary Announcement 10 June 2002 Financial Review Financial Summary 2002 2001 as restated m m Turnover 190.2 216.7 Trading profit (before exceptionals) 7.8 16.1 Profit before tax (before exceptionals)
BlueScope Steel Limited Consolidated Financial Headlines
 BlueScope Steel Limited Consolidated Financial Headlines 2003 2004 2005 2006 2007 2008 2009 2010 2011 2012 2013 2013 2013 2014 2014 2014 2015 2015 2015 2016 2016 2016 2017 2017 2017 2018 2018 2018 Total
FY2012. H1 Financial Results. November 8, Copyright(C) 2011 Isuzu Motors Limited All rights reserved
 2011 Isuzu Motors Limited All rights reserved") FY2012 H1 Financial Results November 8, 2011 1 Copyright(C) 2011 Isuzu Motors Limited All rights reserved Ⅰ. President and Representative Director : Susumu Hosoi :FY2012 H1 Financial Summary Outline Ⅱ.
FY2012 H1 Financial Results November 8, 2011 1 Copyright(C) 2011 Isuzu Motors Limited All rights reserved Ⅰ. President and Representative Director : Susumu Hosoi :FY2012 H1 Financial Summary Outline Ⅱ.
Financial Data Supplement Q4 2017
 Bank Financial Data Supplement Q4 2017 2 February 2018 Due to rounding, numbers presented throughout this document may not sum precisely to the totals we provide and percentages may not precisely reflect
Lazydays Holdings, Inc. Reports Third Quarter 2018 Financial Results
 News Contact: +1 (813) 204-4099 investors@lazydays.com Lazydays Holdings, Inc. Reports Third Quarter 2018 Financial Results Tampa, FL (November 8, 2018) Lazydays Holdings, Inc. ( Lazydays ) (NasdaqCM:
AMAG posts record shipments in 2013; dividend recommendation of 0.60 EUR per share
 Ranshofen, 28 February 2014 AMAG posts record shipments in 2013; dividend recommendation of 0.60 EUR per share Shipments at an all-time high of 351,700 tonnes (t) in 2013, compared with 344,200 t a year
Clean Air Power Ltd. John Pettitt, Chief Executive Peter Rowse, Finance Director. April 2013
 Clean Air Power Ltd John Pettitt, Chief Executive Peter Rowse, Finance Director April 2013 1 Dual-Fuel Engine Management Software enables heavy duty trucks to operate on a combination of diesel and natural
FISCAL YEAR MARCH 2015 THIRD QUARTER FINANCIAL RESULTS. Updated Mazda CX-5 (Japanese specification model)
") FISCAL YEAR MARCH 2015 THIRD QUARTER FINANCIAL RESULTS Updated Mazda CX-5 (Japanese specification model) Mazda Motor Corporation February 4, 2015 1 PRESENTATION OUTLINE Highlights Fiscal Year March 2015
FISCAL YEAR MARCH 2015 THIRD QUARTER FINANCIAL RESULTS Updated Mazda CX-5 (Japanese specification model) Mazda Motor Corporation February 4, 2015 1 PRESENTATION OUTLINE Highlights Fiscal Year March 2015
FISCAL YEAR MARCH 2018 FIRST QUARTER FINANCIAL RESULTS
 FISCAL YEAR MARCH 2018 FIRST QUARTER FINANCIAL RESULTS PRESENTATION OUTLINE Highlights Fiscal Year March 2018 First Quarter Results Fiscal Year March 2018 Full Year Forecast Structural Reform Stage 2 Progress
Fiscal Year 2012: Year of record operational performance
 Ranshofen, February 28, 2013 Fiscal Year 2012: Year of record operational performance Year of record operational performance: - 327,800 tons of external shipments - 266,900 tons of scrap charged in Ranshofen
JAGUAR LAND ROVER INVESTOR CALL
 JAGUAR LAND ROVER INVESTOR CALL RESULTS FOR THE THREE AND SIX MONTHS ENDED 30 SEPTEMBER 2017 Kenneth Gregor, CFO 9 th NOVEMBER 2017 DISCLAIMER Statements in this presentation describing the objectives,
EROAD HALF YEAR 2018 ANNOUNCEMENT AND UPDATE 28 November 2017 EROAD achieves record sales in New Zealand and US markets
 EROAD HALF YEAR 2018 ANNOUNCEMENT AND UPDATE 28 November 2017 EROAD achieves record sales in New Zealand and US markets Integrated technology, and services provider EROAD Limited says it has enjoyed record
Performance of Wipro Limited for Quarter and Year ended - March 31, 2013
 Performance of Wipro Limited for Quarter and Year ended - March 31, 2013 Suresh Senapaty Executive Director and Chief Financial Officer April 19, 2013 1 Financial Summary for the Year Ended March 31, 2013
Bernstein Strategic Decisions Conference 2018
 Bernstein Strategic Decisions Conference 2018 Forward-Looking Statements Certain statements in this presentation, other than statements of historical fact, including estimates, projections, statements
Paris Tuesday, April 1, Europcar Groupe 2007 Annual Results
 Paris Tuesday, April 1, 2008 Europcar Groupe 2007 Annual Results Speakers Salvatore Catania Chief Executive Officer, Europcar Groupe Charles Desmartis Chief Financial Officer, Europcar Groupe 1 Europcar
Financial Summary for 2Q-FY2017 And Projections for FY2017
 Financial Summary for 2Q-FY2017 And Projections for FY2017 1 INDEX 01 Financial Summary for 2Q-FY2017 02 Performance Forecast for FY2017 03 Topics 2 01 Financial Summary for 2Q-FY2017 3 01 Financial Summary
On track. Investor and Analyst Presentation On the Occasion of the Release of the Preliminary Figures for FY 2011 Hanover, 19 January 2012
 On track. Investor and Analyst Presentation On the Occasion of the Release of the Preliminary Figures for FY 2011 Agenda Delticom at a Glance Business Model Profit & Loss Balance Sheet Outlook 2 Agenda
ANALYST BRIEFING FOR THE FOURTH QUARTER ENDED FEBRUARY 2017
 ANALYST BRIEFING FOR THE FOURTH QUARTER ENDED 2016 22 FEBRUARY 2017 MSM Malaysia Holdings Berhad Analyst Briefing Q4 2016 22/2/2017 1 CONTENTS 01 02 03 04 05 Group Financial Highlights Performance Review
Financial Statements Matti Lievonen, President & CEO 7 February 2017
 Financial Statements 2016 Matti Lievonen, President & CEO Agenda 1 2 3 4 Year 2016 Financials 2016 Segment reviews Current topics 5 Appendix 2 Disclaimer The following information contains, or may be deemed
I remind you that our presentation is available on our website. We can start from the first 2 slides that show Piaggio Group First
 CONFERENCE CALL 2009 1 st HALF RESULTS Good afternoon and welcome to everybody. I remind you that our presentation is available on our website. We can start from the first 2 slides that show Piaggio Group
Healthier Net Profit under Stronger IDR
 Investor Bulletin, First Half 2002 Healthier Net Profit under Stronger IDR As of June 2002, the consolidated revenue in USD increased by 32% y.o.y. Due to IDR strengthening against USD, in IDR revenue
Contents. Automotive Holdings Group Limited
 Automotive Holdings Group Limited Institutional Briefings Year End Results June Contents FY Highlights Corporate Statistics Group Performance Floorplan Financing Automotive Logistics Outlook Appendices
FOURTH QUARTER 2013 RESULTS
 FOURTH QUARTER 213 RESULTS 12 MARCH 214 LUCA BETTONTE, CEO DISCLAIMER This document contains certain forward-looking information that is subject to a number of factors that may influence the accuracy of
GUD Holdings Limited Wilsons Rapid Insights Conference 31st May 2018
 GUD Holdings Limited Wilsons Rapid Insights Conference 31st May 2018 Jonathan Ling Managing Director The GUD group Automotive GUD HOLDINGS Davey Automotive oil, air and fuel filters Heavy duty filters
FY H1 Financial Results
 FY2011 1 H1 Financial Results November 8, 2010 1 Copyright(C) 2010 Isuzu Motors Limited All rights reserved Contents Ⅰ. President and Representative Director : Susumu Hosoi :FY2011 H1 Financial Summary
ANNUAL GENERAL MEETING Jussi Pesonen President and CEO
 ANNUAL GENERAL MEETING 216 Jussi Pesonen President and CEO UPM in transformation Business portfolio, sales 23: integrated paper company 28: towards marketdriven businesses 215: six separate businesses
FY2/16(March 2015~February 2016)
") FY2/16(March 2015~February 2016) 1. Trends in the current fiscal year and the previous fiscal year 3. Business overview (1) Peformance overview P.1 (1) No. of students at the end of month P.7 (2) Cost
FY2/16(March 2015~February 2016) 1. Trends in the current fiscal year and the previous fiscal year 3. Business overview (1) Peformance overview P.1 (1) No. of students at the end of month P.7 (2) Cost
Earnings conference call Q4 & FY 2016
 Earnings conference call Q4 & FY 2016 Bo Annvik, CEO / Åke Bengtsson, CFO February 10, 2016 1 Agenda Business Highlights Market Update Sales Financials Way forward 2 Business Summary FY 2016 A year with
Automotive Holdings Group Limited. Presentation May 2009
 Automotive Holdings Group Limited Presentation May 2009 Contents About AHG Third Quarter 2009 Performance AHG s strategic response to current economic climate Net Debt Position Automotive Logistics Outlook
Roadshow Presentation
 Roadshow Presentation June 2, Wilfried Trepels, CFO 1 SAF-HOLLAND - Components Fifth Wheels Kingpins Suspensions Landing Gear Axle Systems 2 SAF-HOLLAND - Business Units Trailer Systems Powered Vehicle
Pitti Laminations Limited
 Pitti Laminations Limited (BSE: 513519, NSE: PITTILAM) Q3 FY2016 Earnings Presentation 12 February 2016 Cautionary Statement This presentation contains statements that contain forward looking statements
Lazydays Holdings, Inc. Reports Second Quarter 2018 Financial Results
 News Contact: +1 (813) 204-4099 investors@lazydays.com Lazydays Holdings, Inc. Reports Second Quarter 2018 Financial Results Tampa, FL (August 9, 2018) Lazydays Holdings, Inc. ( Lazydays )(NasdaqCM: LAZY)
Investor Relations News
 Investor Relations News Financial year 2017: MTU Aero Engines AG once again posts record figures Earnings forecast for 2017 fully met Outlook for 2018: Moderate earnings increase, cash conversion rate
FY2/15(March 2014~February 2015)
") FY2/15(March 2014~February 2015) 1. Trends in the current fiscal year and the previous fiscal year 3. Business overview (1) Peformance overview P.1 (1) No. of students at the end of month P.7 (2) Cost
FY2/15(March 2014~February 2015) 1. Trends in the current fiscal year and the previous fiscal year 3. Business overview (1) Peformance overview P.1 (1) No. of students at the end of month P.7 (2) Cost
On track. Investor and Analyst Presentation On the Occasion of the Release of the Preliminary Figures for 9M 2011 Hanover, 18 October 2011
 On track. Investor and Analyst Presentation On the Occasion of the Release of the Preliminary Figures for 9M 2011 Agenda Delticom at a Glance Business Model Profit & Loss Balance Sheet Outlook 2 Agenda
INCREASING SALES FOR MINING RELATED BUSINESS
 Investor Relations of PT UNITED TRACTORS Tbk INCREASING SALES FOR MINING RELATED BUSINESS In the first half 2001, the Company managed to record increase in net revenue from IDR 2.32 trillion to IDR 3.54
Selected Unaudited 2018 Third Quarter Financial Data. 25 October, 2018
 Selected Unaudited 2018 Third Quarter Financial Data 25 October, 2018 Executive Summary GEG: Delivered Solid Performance, Driven by Mass, VIP & Operational Execution, Despite Playing Unlucky Q3 Group Net
Morgans Conference. October 2015
 Morgans Conference October 2015 Financial Trends PBT Underlying 80.0 76.3 70.0 60.0 Operating Earnings PBT Underlying 52.1 54.2 59.0 57.8 61.1 61.9 70.1 60.1 58.5 $ million 50.0 40.0 30.0 32.8 28.3 40.6
Financial Highlights Q1 Results of FY 2013 (Fiscal year ending March 2014) August 8, : Avex Group Holdings Inc.
 August 8, : Avex Group Holdings Inc.") Financial Highlights Q1 Results of FY 2013 (Fiscal year ending March 2014) August 8, 2013 7860: Avex Group Holdings Inc. 1 1 Consolidated Results 2 2 Q1 FY 2013 Highlights Record high as a quarterly sales.
Financial Highlights Q1 Results of FY 2013 (Fiscal year ending March 2014) August 8, 2013 7860: Avex Group Holdings Inc. 1 1 Consolidated Results 2 2 Q1 FY 2013 Highlights Record high as a quarterly sales.
Focus on value creation
 Focus on value creation Matti Lievonen President & CEO Capital Markets Day 2011 21 September 2011 Results and outlook EBITDA shows our ability to generate cash flow Comparable EBITDA has been over EUR
Full-year Report 2009
 Full-year Report 2009 Joakim Olsson CEO and President February 12, 2009 Innovative Vehicle Technology 2010-02-12 Summary 2009 Sales of SEK 5,622m (8,403) Adjusted for currency effects sales decreased by
Results for the Three Months ended June 30, 2018
 Reference Translation Results for the Three Months ended June 30, 2018 July 31, 2018 AUTOBACS SEVEN CO., LTD. FY March 2019 Consolidated P/L Profit Loss/Gain: Net sales and gross profit decreased, and
Analyst Presentation Barloworld Automotive 29 February 2008
 Analyst Presentation Barloworld Automotive 29 February 2008 Automotive Division Automotive Division Overview Business Overview Motor Retail Car Rental Fleet Services Importation & Distribution Joint Ventures
Q3 report Joakim Olsson CEO and President October 24, Innovative Vehicle Technology
 Q3 report 2008 Joakim Olsson CEO and President October 24, 2008 Innovative Vehicle Technology 2008-10-24 Summary YTD 2008 Orders Received of 6 401 MSEK (6 077) Currency adjusted orders increased with 9
Commuter Rail Update. October 25, 2018
 Commuter Rail Update October 25, 2018 2 page page 3 State of Commuter Rail Network, July 2014 The 2014 Commuter Rail network had multiple issues and a history of neglect & under-investment FIRST UP? UPGRADES
Third Quarter 2018 Performance and Business Update. October 24, 2018
 Third Quarter 2018 Performance and Business Update October 24, 2018 1 Important Notice Please read this management presentation together with the Company s press release issued earlier today announcing
Interim Review Q1 2007
 Interim Review Q1 2007 25 April 2007 25 April 2007 www.ruukki.com Ruukki today Net sales in 2006: 3.7 billion 13,000 employees in 23 countries Supplies metal-based components, systems and integrated systems
FISCAL YEAR END MARCH 2013 FIRST HALF FINANCIAL RESULTS. New Mazda6 (Atenza)
") FISCAL YEAR END MARCH 2013 FIRST HALF FINANCIAL RESULTS New Mazda6 (Atenza) Mazda Motor Corporation October 31, 2012 1 PRESENTATION OUTLINE Highlights Fiscal Year March 2013 First Half Results Fiscal Year
FISCAL YEAR END MARCH 2013 FIRST HALF FINANCIAL RESULTS New Mazda6 (Atenza) Mazda Motor Corporation October 31, 2012 1 PRESENTATION OUTLINE Highlights Fiscal Year March 2013 First Half Results Fiscal Year
Record CY 2016 EPS-diluted-adjusted of $6.12, an increase of $1.10 Y-O-Y. Q EPS-diluted-adjusted of $1.28, a decrease of $0.11 Y-O-Y.
 1 2 3 Q4 2016 global deliveries up 0.1 million units year-over-year (Y-O-Y), a 3.3% increase. Volume gains primarily in North America and China, offset by reductions in International Operations (excluding