Somboon Advance Technology PCL
|
|
|
- Abraham Cook
- 5 years ago
- Views:
Transcription

1 Somboon Advance Technology PCL Opportunity Day: 2014Q4 Mar 17,
2 Company Overview Industry Overview Sale Performance Financial Highlights Q&A 2
3 Company Overview SAT Paid up 425 million Baht As of Mar 6, 15 Kitaphanich Family 46.03% Others 53.97% 99.99% 99.99% 99.99% 99.99% 99.99% ICP SBM BSK SFT SIJ 21.25% Tsuchiyoshi Somboon Coated Sand 20.00% 2.90% 1.80% Yamada Somboon Nisshinbo Somboon Automotive Somboon Somic Manufacturing 3
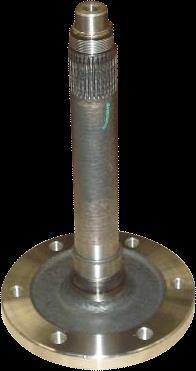
4 Company Overview SAT: Forging: Axle shaft products BSK: Bending & Coiling: Spring products ICP/SBM: Iron casting and machining products Automotive parts products Agricultural Machinery parts products SFT: General forging products SIJ: Representative office in Japan 4
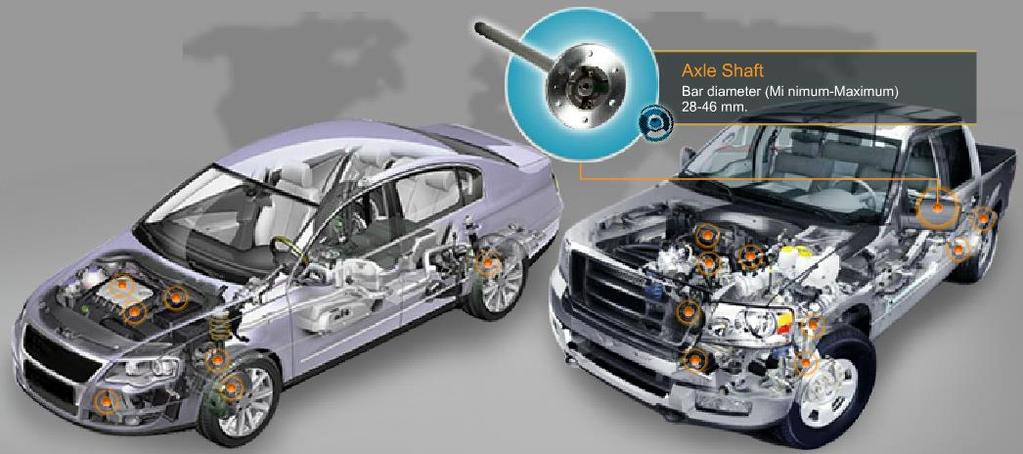
5 Automotive Parts 5


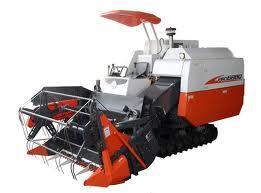


6 Agricultural Machinery Parts 6
7 Company Overview Industry Overview Sale Performance Financial Highlights Q&A 7


8 Car Production 2014 Unit: Thousand cars Unit: Thousand cars Source: Thai Automotive Industry Association QoQ: Car production improved 3% in Q4 2014: Drop 23% (Domestic: -43% and Export: +0%) 8


9 Car Production: by type Unit: Thousand cars QoQ (+3%): Changes in Eco car, Passenger, and Pickup are +15%, +7% and -2% 2014 (-23%): Changes in Eco car, Passenger, and Pickup are -32%, -30 and -16% %Pickup to total production for 2014 accounts for 59% 9
: Changes in Eco car, Passenger, and Pickup")

10 Car Production: Domestic Unit: Thousand cars QoQ (+8%): Changes in Eco car, Passenger, and Pickup are -16%, +23% and +1% 2014: (-43%) : Changes in Eco car, Passenger, and Pickup are -57%, -50 and -33% 10


11 Car Production: Export Unit: Thousand cars QoQ (+1%): Changes in Eco car, Passenger, and Pickup are +32%, -7% and -3% 2014 (+0%): Changes in Eco car, Passenger, and Pickup are +5%, +5% and -3% For 2014, Pickup accounts for 63% of the total export 11

12 Export Destinations Unit: Thousand Cars 12
13 Thailand automotive outlook CAGR =20 % CAGR =6-7 % Thailand Floods & Tsunami in Japan First car scheme Global Financial Crisis Asian Financial Crisis Source: Thai Automotive Industry Association: Actual SBG: Forecast
14 Automotive Industry Overview Tractor Industry Overview Sale Performance Financial Highlights Q&A 14

15 Tractor production by Quarter Unit: in Thousand Source : SBG s Estimate 15
16 Tractor Production outlook Unit: in Thousand CAGR =25% CAGR = 11% Flood Drought Source : SBG s Forecast 16
17 Company Overview Industry Overview Sale Performance Financial Highlights Q&A 17
18 Sale by products (2014) 18
19 Sale by Customers (2014) Others 13% Nissan 3% Honda 4% Isuzu 6% Kubota 17% Toyota 28% Mitsubishi 31% 0% 5% 10% 15% 20% 25% 30% 35% 19

20 Market Share 2014 SMT& Others 20% SAT 80% SBM 29% SBM 26% Aisin& Aisin& Others Others 71% Rear Axle Shaft Y13 = 81 % Disc Brake Y13= 30% 74% Drum Brake Y13= 27% BSK 38% BSK 36% BSK 14% NHK& Others 62% NHK& Others 64% NHK& Coil Spring Y13 = 37 % Stabilizer Bar Y13 = 36% Others Leaf Spring Y13 = 12% 86% 20
21 Capacity & Utilization Production line Q Investment 1 Utilization (%) Capacity pcs /month Utilization (%) Utilization (%) 2014 (mb) 2015 (mb) Axle Shaft 87% 330,000 68% 74% Machining (Auto) 74% 592,000 68% 65% Machining (non-auto) 111% 158, % 113% Coil Spring 2 102% 560,000 38% 51% Stabilizer Bar 70% 180,000 52% 51% 9 0 Leaf Spring 95% 1,100 tons 98% 95% 0 0 General Forging 3-280,000 17% 12% Average/Total 90% 67/78 i % 65/79 i % Capacity is calculated based on 500 hours per month (20 hours x 25 days) Note: 1 Investment figures do not include overhaul/administrative/ R&D 2 Capacity for Cold Coil = 280,000 pcs/month (SOP:Q3) 3 Capacity for General Forging = 280,000 pcs/month (SOP:Q3) i Utilization rate excluding Cold Coil and General Forging 21
22 Company Overview Industry Overview Sale Performance Financial Highlights Q&A 22

23 Sale & Gross Margin 23

24 QoQ: 4Q14 vs 3Q14 Unit: million Baht QoQ Comparison Sale 4.5% COGS 0.5% GP (amount) 26.1% %GP 3.3% Sale increased 91 mb or 4.5% compared to 3% increase for the auto industrial 0% 8% 6% 4% 2% 0% % COGS Gross Margin Sales %GP %GP increased 3.3% mainly driven by increase in sale and better efficiency 24
 improved in line with sale GP (%) improved slightly 0% 8% 6% 4% 2% 0% COGS Gross Margin Sales %GP")
25 YoY: 4Q14 vs 4Q13 Unit: million Baht YoY Comparison Sale 4.3 % COGS 4.2 % GP (amount) 4.7 % GP (%) 0.1% Sale increased 4.3% in 4Q14 GP (amount) improved in line with sale GP (%) improved slightly 0% 8% 6% 4% 2% 0% COGS Gross Margin Sales %GP 25

26 2014 vs 2013 Unit: million Baht YoY Comparison Sale 9.9 % COGS 12.2 % GP (amount) 9.7 % GP (%) 0.0% Higher sale in 2013 was mainly driven by the government s policy 0% 8% 6% 4% 2% 0% COGS Gross Margin Sales %GP Despite Sale drop, %GP was maintained as i) performance improvement and ii) materials reused 26
27 Net Profit 27
28 QoQ: 4Q14 vs 3Q14 1 Note: 1 Others include gain/loss on fx, other incomes, and other expenses 28
29 YoY: 4Q14 vs 4Q : PP&E Impairment reversal (121mb) 2013: Gain on land sale (48mb) 2013: Fx loss reversal (33 mb) 1 Note: 1 Others include gain/loss on fx, other incomes, and other expenses 29
30 2014 vs : PP&E Impairment reversal (121mb) 2013: Gain on land sale (48mb) 1 Note: 1 Others include gain/loss on fx, other incomes, and other expenses 30
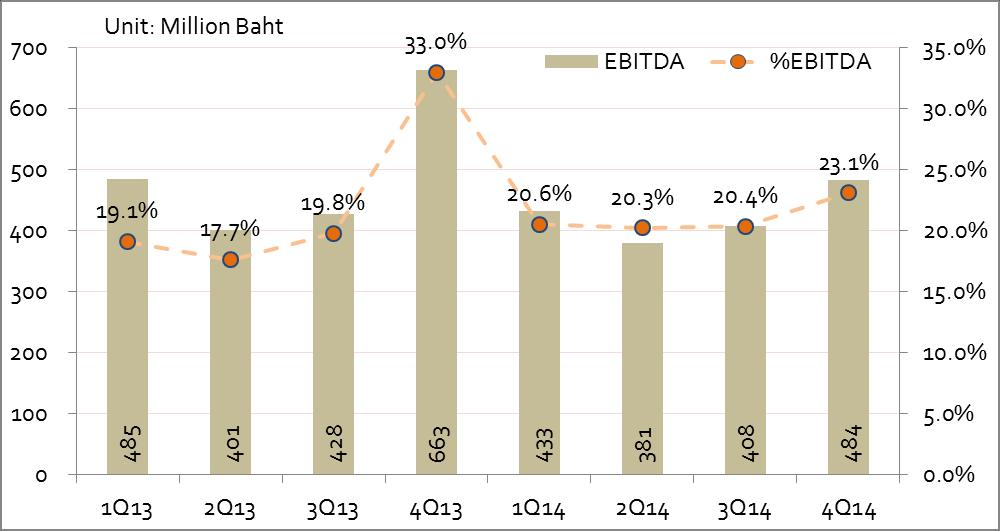
31 EBITDA 31


32 Awards Quality Awards Award of Regional Contribution From Toyota Gold Award 2013 form Hino Quality Improvement Awards from Honda (Zero Claim) Quality Excellence Awards from Thai Honda Cost Reduction Awards from Toyota, Hino, etc. Awards of Quality : Excellence in Zero Defect from Mitsubishi Recognitions & Awards SET Awards of Honor for the excellence as the outstanding Corporate Governance report for a consecutive period from 2009 to 2014 Board of the year 2010/2011 continuous awards #2 from IOD & SET Best Corporate Social Responsibility Awards Outstanding Investor Relations Awards-2014 Best Investor Relations Awards in 50 companies that attract foreign investors to invest in ASEAN stock markets (by ACGA)
33 Company Overview Industry Overview Sale Performance Financial Highlights Q&A 33

34 Q&A THANK YOU 34
35 Financial Highlights Unit : Million Baht 1Q13 2Q13 3Q13 4Q13 1Q14 2Q14 3Q14 4Q14 QoQ YoY Y2012 Y2013 Y2014 YoY Sales 2,535 2,271 2,159 2,008 2,106 1,881 2,003 2, % 4.3% 9,410 8,973 8, % Total Revenue 2,582 2,312 2,194 2,230 2,128 1,926 2,041 2, % -6.5% 9,590 9,318 8, % Gross Margin % 4.7% 1,484 1,566 1, % SG&A % -10.8% % FOREX Gain (Loss) % % % Interest Expense % -10.3% % Net Profit % -48.5% % Net Profit excluding fx % -43.5% % EBITDA % -27.0% 1,754 1,977 1, % Cash Flow from Operating % -13.6% 1,768 1,854 1, % Depreciation % 18.0% % CAPEX % -70.3% 904 1, % Effective Tax Rate 10% 9% 8% 7% 11% 8% 10% 9% -4.3% 34.6% 9% 8% 10% 19.1% Total Assets 10,457 10,440 10,433 9,923 10,078 9,835 9,827 9, % -1.1% 9,421 9,923 9, % Interest Bearing Debt 3,196 3,435 3,316 3,275 3,165 3,176 3,048 2, % -11.1% 3,130 3,275 2, % Total Liabilities 5,453 5,432 5,366 5,050 5,039 4,882 4,823 4, % -9.0% 5,272 5,050 4, % Equity 5,004 5,008 5,068 4,873 5,038 4,953 5,004 5, % 7.1% 4,149 4,873 5, % Key Financial Ratios 1Q13 2Q13 3Q13 4Q13 1Q14 2Q14 3Q14 4Q14 QoQ YoY Y2012 Y2013 Y2014 YoY %GP 17.1% 16.6% 17.4% 18.9% 17.9% 17.4% 15.8% 19.0% -1.6% -1.7% 15.8% 17.5% 17.5% 0.1% %SG&A 7.5% 8.2% 8.8% 7.8% 8.9% 11.0% 8.5% 6.7% -2.5% -0.2% 6.8% 8.0% 8.7% 0.7% %NP 9.1% 6.4% 7.7% 18.4% 7.9% 6.7% 7.0% 10.1% 0.4% -0.7% 8.4% 10.4% 7.9% -2.4% %NP excluding fx 9.2% 8.3% 7.8% 16.9% 7.8% 6.7% 7.0% 10.2% 0.4% -0.8% 8.2% 10.5% 8.0% -2.5% %EBITDA 18.8% 17.3% 19.5% 29.7% 20.3% 19.8% 20.0% 23.2% 0.2% 0.5% 18.3% 21.2% 20.9% -0.4% %ROA 9.4% 5.9% 6.7% 16.4% 6.5% 5.1% 5.6% 8.6% 0.6% -1.0% 8.5% 9.7% 6.6% -3.1% EBITDA/CAPEX % %ROE 20.1% 12.4% 14.0% 33.8% 13.4% 10.3% 11.4% 16.7% 1.1% -2.6% 19.4% 19.8% 12.5% 0.5% %ROIC 14.0% 9.2% 10.4% 22.2% 10.2% 9.8% 8.7% 12.1% -1.1% -1.7% 12.2% 13.7% 9.8% 1.5% Interest bearing Debt/Equity % D/E % EPS (Baht) % BVPS (Baht) % 35
Somboon Advance Technology PCL
 Somboon Advance Technology PCL Opportunity Day 2017Q2 September 12, 2017 1 Company Overview Automotive Industry Overview Tractor Industry Overview Sale Performance Financial Highlights Q&A 2 Company Overview
Somboon Advance Technology PCL Growing in Asia automotive, expertise in design and manufacturing with stakeholders and social responsibility
 Somboon Advance Technology PCL Growing in Asia automotive, expertise in design and manufacturing with stakeholders and social responsibility Opportunity Day June 10, 2013 1 AGENDA 2 Million Thailand, world
SAT. To Become an Auto Parts Manufacturing Leader in ASEAN with Excellent lent Quality. March 16, 2010
 SAT To Become an Auto Parts Manufacturing Leader in ASEAN with Excellent lent Quality March 16, 2010 Agenda Industry Overview Group Business Performance Review Future Outlook Appendices 2009 Car Production
Somboon Advance Technology PCL To Become an Auto Parts Manufacturing Leader in ASEAN with Excellent Quality
 Somboon Advance Technology PCL To Become an Auto Parts Manufacturing Leader in ASEAN with Excellent Quality Aug 2012 1 AGENDA 2 Thousands 130 Thailand, world top auto assembler, is poised for impressive
Somboon Advance Technology PCL To Become an Auto Parts Manufacturing Leader in ASEAN with Excellent Quality
 Somboon Advance Technology PCL To Become an Auto Parts Manufacturing Leader in ASEAN with Excellent Quality Aug 2011 AGENDA Industry Overview Group Business Performance Review Future Outlook Appendices
PTG ENERGY PUBLIC COMPANY LIMITED. Opportunity Day. 2Q/2017 Performance Results
 PTG ENERGY PUBLIC COMPANY LIMITED Opportunity Day 2Q/2017 Performance Results PTG Businesses Retailing and Wholesaling Fuel Products Non-Fuel Products Logistics Business (Fuel logistics and Depot) Renewable
Dynasty Ceramic. We are making the impossible, POSSIBLE.
 Dynasty Ceramic We are making the impossible, POSSIBLE. Contents Road to Success Sales Reports Cost of Production Performance Competitor Analysis Going Forward Q & A 2 Dynasty Ceramic Road to Success DCC
ANALYST BRIEFING FOR THE FOURTH QUARTER ENDED FEBRUARY 2017
 ANALYST BRIEFING FOR THE FOURTH QUARTER ENDED 2016 22 FEBRUARY 2017 MSM Malaysia Holdings Berhad Analyst Briefing Q4 2016 22/2/2017 1 CONTENTS 01 02 03 04 05 Group Financial Highlights Performance Review
1Q17 Highlights. +22%YoY. Officially Launched. PT Maxnitron. Sales Volume 821 Liters 6.1 1,436. Million Members. Stations
 1Q17 Highlights +22%YoY Sales Volume 821 Liters 6.1 Million Members Officially Launched PT Maxnitron 1,436 Stations Agenda Industry Outlook Business Performance Project Update Financial Performance Thailand
FY2/18 (March 2017~February 2018)
") FY2/18 (March 2017~February 2018) Fact Book 1. Trends in the current fiscal year and previous fiscal year 3. Business overview (1) Performance overview P. 1 (1) No. of students at the end of month P. 6
FY2/18 (March 2017~February 2018) Fact Book 1. Trends in the current fiscal year and previous fiscal year 3. Business overview (1) Performance overview P. 1 (1) No. of students at the end of month P. 6
ANALYST BRIEFING FOR THE THIRD QUARTER ENDED NOV 2016
 ANALYST BRIEFING FOR THE THIRD QUARTER ENDED 2016 21 NOV 2016 MSM Malaysia Holdings Berhad Analyst Briefing Q3 2016 21/11/2016 1 CONTENTS 01 02 03 04 05 Group Financial Highlights Performance Review Sugar
July 27, Copyright(C) 2006 Isuzu Motors Ltd. All rights reserved. FORWARD-New Long Term Emission version. ELF-CNG version
 2006 Isuzu Motors Ltd. All rights reserved. FORWARD-New Long Term Emission version. ELF-CNG version") ELF-CNG version FORWARD-New Long Term Emission version 2.5L/3.0L Super Clean & Economy Diesel Isuzu D-MAX GIGA-New Long Term Emission version July 27, 2006 1 Copyright(C) 2006 Isuzu Motors Ltd. All rights
ELF-CNG version FORWARD-New Long Term Emission version 2.5L/3.0L Super Clean & Economy Diesel Isuzu D-MAX GIGA-New Long Term Emission version July 27, 2006 1 Copyright(C) 2006 Isuzu Motors Ltd. All rights
FY2012. H1 Financial Results. November 8, Copyright(C) 2011 Isuzu Motors Limited All rights reserved
 2011 Isuzu Motors Limited All rights reserved") FY2012 H1 Financial Results November 8, 2011 1 Copyright(C) 2011 Isuzu Motors Limited All rights reserved Ⅰ. President and Representative Director : Susumu Hosoi :FY2012 H1 Financial Summary Outline Ⅱ.
FY2012 H1 Financial Results November 8, 2011 1 Copyright(C) 2011 Isuzu Motors Limited All rights reserved Ⅰ. President and Representative Director : Susumu Hosoi :FY2012 H1 Financial Summary Outline Ⅱ.
INCREASING SALES FOR MINING RELATED BUSINESS
 Investor Relations of PT UNITED TRACTORS Tbk INCREASING SALES FOR MINING RELATED BUSINESS In the first half 2001, the Company managed to record increase in net revenue from IDR 2.32 trillion to IDR 3.54
TOFAŞ Q ANALYST PRESENTATION
 TOFAŞ Q1 2016 ANALYST PRESENTATION 03.05.2016 1 2016 Q1 AGENDA Highlights Turkish Automotive Industry Production & Capacity Utilization Domestic Market Developments Tofaş Domestic Market Performance Export
1. Trends in the current fiscal year and previous fiscal year 3. Business overview 2. Secular trends in first quarter financial results
 FY2/19 (March 2018~May 2018) Fact Book 1. Trends in the current fiscal year and previous fiscal year 3. Business overview (1) Performance overview P. 1 (1) No. of students at the end of month P. 6 (2)
FY2/17 3Q(March 2016~November2016)
") FY2/17 (March 2016~November2016) Fact Book 1. Trends in the current fiscal year and previous fiscal year 3. Business overview (1) Performance overview P. 1 (1) No. of students at the end of month P. 7
FY2/17 (March 2016~November2016) Fact Book 1. Trends in the current fiscal year and previous fiscal year 3. Business overview (1) Performance overview P. 1 (1) No. of students at the end of month P. 7
THREE MONTHS REPORT, JAN MARCH 2016
 THREE MONTHS REPORT, JAN MARCH 2016 TELEPHONE CONFERENCE 26 APRIL, 2016, AT 14:30 CET TOMMY ANDERSSON, PRESIDENT AND CEO HELENA WENNERSTRÖM, EVP AND CFO TO PARTICIPATE, PLEASE CALL 5 MINUTES BEFORE THE
LOGO. August 16,2010
 LOGO Opportunity Day TIRATHAI PUBLIC COMPANY LIMITED August 16,2010 Contents Company Profile Business Products Electrical Demand Overview Structure of Income & Q2 Operating Results Business Forecast for
FY2018 Financial Results
 FY2018 Financial Results May 14, 2018 ISUZU MOTORS LIMITED 1 Copyright(C) 2018 Isuzu Motors Limited All rights reserved Contents Ⅰ. President and Representative Director : Masanori Katayama FY2018 and
FY2/18 2Q(March 2017~August 2018)
") FY2/18 2Q(March 2017~August 2018) Fact Book 1. Trends in the current fiscal year and previous fiscal year 3. Business overview (1) Performance overview P.1 (1) No. of students at the end of month P.7 (2)
FY2/18 2Q(March 2017~August 2018) Fact Book 1. Trends in the current fiscal year and previous fiscal year 3. Business overview (1) Performance overview P.1 (1) No. of students at the end of month P.7 (2)
Institutional Presentation August 2011
 Institutional Presentation August 2011 Disclaimer This presentation may include forwardlooking statements representing expectations about future events or anticipated result based on factors such as economic
Subject: Report on the operating results of Country Group Development PCL for the period ended September 30, 2018
 CGD61/0054 Date: November 13, 2018 Subject: Report on the operating results of Country Group Development PCL for the period ended September 30, 2018 To: The President The Stock Exchange of Thailand Country
Analysis of Operating Results and Financial Status
 Analysis of Operating Results and Financial Status 1. Analysis of Operating Results of EGAT and its Subsidiaries Operating results of EGAT and its subsidiaries including associated company and jointly
3 rd Quarter 2017 Results
 Inside your life! 3 rd Quarter 2017 Results October 25, 2017 Mobile Automotive Display Semiconductor IoT LED Contents Ⅰ. Q3 2017 Earnings Summary Ⅱ. Earnings Highlight & Outlook Ⅲ. Results & Outlook by
FY H1 Financial Results
 FY2011 1 H1 Financial Results November 8, 2010 1 Copyright(C) 2010 Isuzu Motors Limited All rights reserved Contents Ⅰ. President and Representative Director : Susumu Hosoi :FY2011 H1 Financial Summary
FISCAL YEAR MARCH 2015 THIRD QUARTER FINANCIAL RESULTS. Updated Mazda CX-5 (Japanese specification model)
") FISCAL YEAR MARCH 2015 THIRD QUARTER FINANCIAL RESULTS Updated Mazda CX-5 (Japanese specification model) Mazda Motor Corporation February 4, 2015 1 PRESENTATION OUTLINE Highlights Fiscal Year March 2015
FISCAL YEAR MARCH 2015 THIRD QUARTER FINANCIAL RESULTS Updated Mazda CX-5 (Japanese specification model) Mazda Motor Corporation February 4, 2015 1 PRESENTATION OUTLINE Highlights Fiscal Year March 2015
Months Investor Presentation
 2018 9 Months Investor Presentation 25.10.2018 Disclaimer Ereğli Demir Çelik Fabrikaları T.A.Ş. (Erdemir) may, when necessary, make written or verbal announcements about forward-looking information, expectations,
Fiscal Year 2015 Financial Results
 Fiscal Year 2015 Financial Results Nissan Motor Co., Ltd May 12, 2016 results FY16 outlook 2 Key performance indicators: financial results (TSE report basis - China JV Equity basis) Net revenue Operating
FY2/17 (March 2016~February 2017)
") FY2/17 (March 2016~February 2017) Fact Book 1. Trends in the current fiscal year and previous fiscal year 3. Business overview (1) Performance overview P. 1 (1) No. of students at the end of month P. 7
FY2/17 (March 2016~February 2017) Fact Book 1. Trends in the current fiscal year and previous fiscal year 3. Business overview (1) Performance overview P. 1 (1) No. of students at the end of month P. 7
FISCAL YEAR MARCH 2015 FIRST HALF FINANCIAL RESULTS. New Mazda Demio
 FISCAL YEAR MARCH 2015 FIRST HALF FINANCIAL RESULTS New Mazda Demio Mazda Motor Corporation October 31, 2014 1 PRESENTATION OUTLINE Highlights Fiscal Year March 2015 First Half Results Fiscal Year March
FY2019 H1 Financial Results. November 2, 2018 ISUZU MOTORS LIMITED. 1 Copyright(C) 2018 Isuzu Motors Limited All rights reserved
 2018 Isuzu Motors Limited All rights reserved") FY2019 H1 Financial Results November 2, 2018 ISUZU MOTORS LIMITED 1 Copyright(C) 2018 Isuzu Motors Limited All rights reserved Contents Ⅰ. President and Representative Director : Masanori Katayama :FY2019
FY2019 H1 Financial Results November 2, 2018 ISUZU MOTORS LIMITED 1 Copyright(C) 2018 Isuzu Motors Limited All rights reserved Contents Ⅰ. President and Representative Director : Masanori Katayama :FY2019
FY2018 H1 Financial Results
 FY2018 H1 Financial Results November 6,2017 1 Copyright(C) 2017 Isuzu Motors Limited All rights reserved Contents Ⅰ. President and Representative Director : Masanori Katayama :FY2018 H1 Financial Summary
P T G E N E R G Y P C L F I S C A L Y E A R 2017 R E S U L T S O P P O R T U N I T Y D A Y - M a r 8 th, 2018
 P T G E N E R G Y P C L F I S C A L Y E A R 2017 R E S U L T S O P P O R T U N I T Y D A Y - M a r 8 th, 2018 1 A G E N D A 2 0 1 8 O U T L O O K 2 0 1 7 O V E R V I E W 2 0 1 7 F I N A N C I A L PERFORMANCE
FY2017 Results. February 26, 2018
 FY2017 Results February 26, 2018 Our background & development Registered capital increased to 12 MB Started International marine transportation ( Myanmar route ) Registered capital increased to 100 MB
FISCAL YEAR END MARCH 2012 FINANCIAL RESULTS. Mazda TAKERI
 FISCAL YEAR END MARCH 212 FINANCIAL RESULTS Mazda TAKERI Mazda Motor Corporation April 27, 212 1 PRESENTATION OUTLINE Highlights FY End March 212 Results FY End March 213 Forecast Summary Progress Toward
1 Copyright(C) 2014 Isuzu Motors Limited All rights reserved
 2014 Isuzu Motors Limited All rights reserved") FY2014 Financial Results May 12, 2014 1 Copyright(C) 2014 Isuzu Motors Limited All rights reserved Contents Ⅰ. President and Representative Director : Susumu Hosoi FY2014 and FY2015 Outlook Overview Ⅱ.
FY2014 Financial Results May 12, 2014 1 Copyright(C) 2014 Isuzu Motors Limited All rights reserved Contents Ⅰ. President and Representative Director : Susumu Hosoi FY2014 and FY2015 Outlook Overview Ⅱ.
Q Analyst Teleconference. 9 August 2018
 9 August 218 Disclaimer This presentation contains forward-looking statements that reflect the Company management s current views with respect to certain future events. Although it is believed that the
FISCAL YEAR MARCH 2018 FIRST HALF FINANCIAL RESULTS
 FISCAL YEAR MARCH 2018 FIRST HALF FINANCIAL RESULTS PRESENTATION OUTLINE Highlights Fiscal Year March 2018 First Half Results Fiscal Year March 2018 Full Year Forecast Progress of Key Initiatives/ Business
Stronger Fundamental and Excellent Growth
 Investor Bulletin, First Half 2004 Stronger Fundamental and Excellent Growth For the first six months of 2004, PT United Tractors Tbk (UT/Company) recorded consolidated net revenue of IDR 4.29 trillion,
Healthier Net Profit under Stronger IDR
 Investor Bulletin, First Half 2002 Healthier Net Profit under Stronger IDR As of June 2002, the consolidated revenue in USD increased by 32% y.o.y. Due to IDR strengthening against USD, in IDR revenue
FY2016 H1 Financial Results
 FY2016 H1 Financial Results November 6, 2015 1 Copyright(C) 2015 Isuzu Motors Limited All rights reserved Contents Ⅰ. President and Representative Director : Masanori Katayama :FY2016 H1 Financial Summary
BlueScope Steel Limited Consolidated Financial Headlines
 BlueScope Steel Limited Consolidated Financial Headlines 2003 2004 2005 2006 2007 2008 2009 2010 2011 2012 2013 2013 2013 2014 2014 2014 2015 2015 2015 2016 2016 2016 2017 2017 2017 2018 2018 2018 Total
Operating Results Q Asian Insulators Public Company Limited
 Operating Results Q2-2010 Asian Insulators Public Company Limited 254 Seri Thai Road, Kannayaow, Bangkok 10230 Thailand http://www.asianinsulators.com Tel. (66) 0-2517-1451 Fax. (66) 0-2517-1465 E-mail
Kongsberg Automotive ASA. Fourth quarter February 28, 2019
 Kongsberg Automotive ASA Fourth quarter - February 28, 2019 Highlights Q4 Sales Revenues grew by 21 (7.3%) YoY to 288 including negative FX effects of 1. We booked new business with 77 in expected annual
Q Financial Results
 Q3 2018 Financial Results 1 Forward-looking statement The statements on the future in this presentation, including expected sales and earnings, are associated with risks and uncertainties and may be affected
FISCAL YEAR END MARCH 2013 FIRST HALF FINANCIAL RESULTS. New Mazda6 (Atenza)
") FISCAL YEAR END MARCH 2013 FIRST HALF FINANCIAL RESULTS New Mazda6 (Atenza) Mazda Motor Corporation October 31, 2012 1 PRESENTATION OUTLINE Highlights Fiscal Year March 2013 First Half Results Fiscal Year
FISCAL YEAR END MARCH 2013 FIRST HALF FINANCIAL RESULTS New Mazda6 (Atenza) Mazda Motor Corporation October 31, 2012 1 PRESENTATION OUTLINE Highlights Fiscal Year March 2013 First Half Results Fiscal Year
Meeting Materials for FY2011
 Meeting Materials for FY2011 (Year ended March 31, 2012) May 17, 2012 Masao Usui Representative Director, President Executive Officer KYB Corporation Meeting Materials for FY2011 May 17, 2012, KYB Corporation
Interim report Q3 2014
 Interim report Q3 2014 CEO Daniel Skjeldam CFO Erik Hansen 6 November 2014 Agenda Highlights and Key Figures Operational & Financial review Outlook Q&A 2 Highlights and key figures NOK 77 million pre tax
1 Copyright(C) 2012 Isuzu Motors Limited All rights reserved
 2012 Isuzu Motors Limited All rights reserved") FY2012 Financial Results May 10, 2012 1 Copyright(C) 2012 Isuzu Motors Limited All rights reserved Contents Ⅰ. President and Representative Director : Susumu Hosoi FY2012 Overview Ⅱ. Director Director
FY2012 Financial Results May 10, 2012 1 Copyright(C) 2012 Isuzu Motors Limited All rights reserved Contents Ⅰ. President and Representative Director : Susumu Hosoi FY2012 Overview Ⅱ. Director Director
Nissan Motor Co., Ltd. February 12 th, 2019
 Nissan Motor Co., Ltd. February 12 th, 2019 NET REVENUE 2,875.5 3,045.7 OPERATING PROFIT *1 NET INCOME 301.6 FREE CASH FLOW (AUTO) NET CASH (AUTO) 1,311.4 1,334.4 US TAX REFORM 207.7 82.4 103.3 93.9 *2
Analysis of Operating Results and Financial Status
 29 Analysis of Operating Results and Financial Status 1. Analysis of Operating Results of EGAT and Its Subsidiaries Operating results of EGAT and its subsidiaries including associated company and joint
FISCAL YEAR ENDING MARCH 2012 FIRST HALF FINANCIAL RESULTS
 FISCAL YEAR ENDING MARCH 2012 FIRST HALF FINANCIAL RESULTS Mazda Motor Corporation November 2, 2011 New Mazda CX-5 (European specifications) 1 PRESENTATION OUTLINE Highlights Fiscal Year Ending March 2012
FY2/16(March 2015~February 2016)
") FY2/16(March 2015~February 2016) 1. Trends in the current fiscal year and the previous fiscal year 3. Business overview (1) Peformance overview P.1 (1) No. of students at the end of month P.7 (2) Cost
FY2/16(March 2015~February 2016) 1. Trends in the current fiscal year and the previous fiscal year 3. Business overview (1) Peformance overview P.1 (1) No. of students at the end of month P.7 (2) Cost
Economic & Steel Market Development in Japan
 1 Economic & Steel Market Development in Japan 68 th OECD Steel Committee Paris May 6-7, 2010 The Japan Iron & Steel Federation 2 Macro-economic overview Steel Supply and Demand v v v Steel Production
FY17 RESULTS BUSINESS UPDATES FY18 OUTLOOK. Nissan Motor Co., Ltd. May 14 th, 2018
 Nissan Motor Co., Ltd. May 14 th, 2018 RESULTS BUSINESS UPDATES FY18 OUTLOOK www.nissan-global.com Copyright NISSAN MOTOR CO., LTD. All rights reserved. 2 GLOBAL 91.81 5.08 TIV * 1 vs. 93.52 GLOBAL +1.9%
On track. Investor and Analyst Presentation On the Occasion of the Release of the Preliminary Figures for FY 2011 Hanover, 19 January 2012
 On track. Investor and Analyst Presentation On the Occasion of the Release of the Preliminary Figures for FY 2011 Agenda Delticom at a Glance Business Model Profit & Loss Balance Sheet Outlook 2 Agenda
Super Convenience Store
 Super Convenience Store Samutprakarn Province Auto SNC Cooling Supply Co., Ltd 8, sqm, 1 factory Air Cond Immortal Parts Co., Ltd 17, sqm, 3 factories Plastic SNC Former PLC. (Branch 2) 18, sqm, 4 factories
Earnings conference call. Q4 and Full year 2015
 Earnings conference call Q4 and Full year 2015 Bo Annvik, CEO / Åke Bengtsson, CFO 11 February 2016 1 Agenda Business Highlights Market Update Sales Financials Outlook 2 2015 in numbers Operating margin
FY17 RESULTS BUSINESS UPDATES FY18 OUTLOOK. Nissan Motor Co., Ltd. May 14 th, 2018
 Nissan Motor Co., Ltd. May 14 th, 2018 RESULTS BUSINESS UPDATES FY18 OUTLOOK www.nissan-global.com Copyright NISSAN MOTOR CO., LTD. All rights reserved. 2 GLOBAL 91.81 5.08 TIV * 1 vs. 93.52 GLOBAL +1.9%
282m 75% +575m. Net sales Operating income before non-recurring items. Operating margin before non-recurring items. Net Loss.
 First-Half 2009 Financial Highlights Net sales Operating income before non-recurring items Operating margin before non-recurring items Net Loss Net debt-to-equity ratio Free cash flow** 7,134m 282m 4.0%
FY2015 First Quarter Financial Results. SUZUKI MOTOR CORPORATION 3 August 2015
 First Quarter Financial Results SUZUKI MOTOR CORPORATION 3 August 2015 Consolidated: Financial Summary Page2 Increased net sales and operating income/ordinary income Decreased net income attributable to
2Q06 Results. Investor Relations
 2Q06 Results Investor Relations Content 1. 2Q06 Key Results 2. Summarized Income Statement 3. Balance Sheet as of Jun. 2006 4. Outlook for 2006 5. Result & Outlook By Division Appendix : 2Q06 Results Breakdown
FISCAL YEAR MARCH 2018 FIRST QUARTER FINANCIAL RESULTS
 FISCAL YEAR MARCH 2018 FIRST QUARTER FINANCIAL RESULTS PRESENTATION OUTLINE Highlights Fiscal Year March 2018 First Quarter Results Fiscal Year March 2018 Full Year Forecast Structural Reform Stage 2 Progress
SOLLERS IFRS RESULTS 1H2017
 SOLLERS IFRS RESULTS 1H2017 28.08.2017 2 1. 1H2017 SOLLERS STRATEGIC DEVELOPMENTS 2. RUSSIAN AUTOMOTIVE MARKET OVERVIEW 3. SOLLERS OPERATING AND FINANCIAL PERFORMANCE IN 1H2017 4. SOLLERS JOINT VENTURES
Operations Financial Recent Update. The largest privately owned tap water producer in Thailand
 Thai Tap Water Supply Public Company Limited 1Q1010 Performance 10 May 2010 1Q10 Performance Operations Financial Recent Update 2 Sales Volume (daily average) PTW 1Q10 increase 2.9% QoQ, 5.4% YoY TTW 1Q10
FY 2008 Second Quarter Results Briefing November 2008
 FY 2008 Second Quarter Results Briefing November 2008 The forecast data presented herein reflects assumed results based on conditions that are subject to change. Nabtesco Corporation does not make representations
Third Quarter Results (ended December 31, 2014)
") Fiscal Year 214 (ending March 31, 215) Third Quarter Results (ended December 31, 214) Brother Industries, Ltd. February 4, 215 Information on this report, other than historical facts, refers to future
Fiscal Year 214 (ending March 31, 215) Third Quarter Results (ended December 31, 214) Brother Industries, Ltd. February 4, 215 Information on this report, other than historical facts, refers to future
TOFAŞ RESULTS WEBCAST PRESENTATION
 TOFAŞ 31.12.2016 RESULTS WEBCAST PRESENTATION 02.02.2017 1 WEBCAST AGENDA Highlights Turkish Automotive Industry Production Domestic Market Developments Tofaş Domestic Market Performance Export Markets
FISCAL YEAR MARCH 2015 FIRST QUARTER FINANCIAL RESULTS. Mazda Roadster 25 th Anniversary Model
 FISCAL YEAR MARCH 2015 FIRST QUARTER FINANCIAL RESULTS Mazda Roadster 25 th Anniversary Model Mazda Motor Corporation July 31, 2014 1 PRESENTATION OUTLINE Highlights Fiscal Year March 2015 First Quarter
Financial Highlights Q1 Results of FY 2013 (Fiscal year ending March 2014) August 8, : Avex Group Holdings Inc.
 August 8, : Avex Group Holdings Inc.") Financial Highlights Q1 Results of FY 2013 (Fiscal year ending March 2014) August 8, 2013 7860: Avex Group Holdings Inc. 1 1 Consolidated Results 2 2 Q1 FY 2013 Highlights Record high as a quarterly sales.
Financial Highlights Q1 Results of FY 2013 (Fiscal year ending March 2014) August 8, 2013 7860: Avex Group Holdings Inc. 1 1 Consolidated Results 2 2 Q1 FY 2013 Highlights Record high as a quarterly sales.
Third Quarter Results (ended December 31, 2013)
") Fiscal Year 213 (ending March 31, 214) Third Quarter Results (ended December 31, 213) Brother Industries, Ltd. February 4, 214 Information on this report, other than historical facts, refers to future
Fiscal Year 213 (ending March 31, 214) Third Quarter Results (ended December 31, 213) Brother Industries, Ltd. February 4, 214 Information on this report, other than historical facts, refers to future
FY2/15(March 2014~February 2015)
") FY2/15(March 2014~February 2015) 1. Trends in the current fiscal year and the previous fiscal year 3. Business overview (1) Peformance overview P.1 (1) No. of students at the end of month P.7 (2) Cost
FY2/15(March 2014~February 2015) 1. Trends in the current fiscal year and the previous fiscal year 3. Business overview (1) Peformance overview P.1 (1) No. of students at the end of month P.7 (2) Cost
FISCAL YEAR END MARCH 2013 FIRST QUARTER FINANCIAL RESULTS
 FISCAL YEAR END MARCH 213 FIRST QUARTER FINANCIAL RESULTS New MAZDA CX-5 Mazda Motor Corporation July 31, 212 1 PRESENTATION OUTLINE Highlights Fiscal Year End March 213 Results Update of Structural Reform
FY2004 FINANCIAL RESULTS
 FY2004 FINANCIAL RESULTS Forward Ultra -Low PM, 4-Star ISUZU MOTORS LIMITED May 20, 2004 1 Copyright(C) 2004 Isuzu Motors Ltd. All rights reserved President & Representative Director Yoshinori Ida 2 Copyright(C)
Financial Summary for 2Q-FY2017 And Projections for FY2017
 Financial Summary for 2Q-FY2017 And Projections for FY2017 1 INDEX 01 Financial Summary for 2Q-FY2017 02 Performance Forecast for FY2017 03 Topics 2 01 Financial Summary for 2Q-FY2017 3 01 Financial Summary
FISCAL YEAR ENDED MARCH 2011 FINANCIAL RESULTS
 FISCAL YEAR ENDED MARCH 211 FINANCIAL RESULTS Mazda Motor Corporation April 28, 211 Mazda MINAGI 1 PRESENTATION OUTLINE Highlights Fiscal Year Ended March 211 Results In Summary Question & Answer Session
PETROBRAS ARGENTINA S.A.
 PETROBRAS ARGENTINA S.A. Second Quarter 2015 Results Buenos Aires, July 30, 2015 Petrobras Argentina S.A. (Buenos Aires: PESA NYSE: PZE) announces the results for the second quarter ended June 30, 2015.
Q3 FY14 Performance and Financial Review February 13, 2014
 INVESTOR PRESENTATION Q3 FY14 Performance and Financial Review February 13, 2014 Contents Highlights and Financial Performance Aluminium Business Copper Business Projects 2 HIGHLIGHTS AND FINANCIAL PERFORMANCE
2007 3Q Investor Meeting. November 2007
 2007 3Q Investor Meeting November 2007 Company Overview Cumulative 3Q 2007 Results Result By Division Appendix Company Overview Overview Doosan Infracore is the largest machinery company in Korea and also
LOCK & LOCK. 2Q 17 Earnings Release. 2 Aug 2017
 LOCK & LOCK 2Q 17 Earnings Release 2 Aug 2017 This document has been prepared by Lock & Lock, Co., Ltd. This document contains forward-looking statements, which are subject to risks, uncertainties, and
2010 1Q Investor Meeting. May 2010
 2010 1Q Investor Meeting May 2010 This presentation contains preliminary figures which may be materially different from the final figures. While the statements in this presentation represent our current
FY2012 third-quarter financial results
 FY2012 third-quarter financial results Nissan Motor Co., LTD. February 8, 2013 Key performance indicators: financial results (billion yen) Net revenue 6,698.4 6,755.2 Operating profit 427.8 Net income
Fiscal Year 2012: Year of record operational performance
 Ranshofen, February 28, 2013 Fiscal Year 2012: Year of record operational performance Year of record operational performance: - 327,800 tons of external shipments - 266,900 tons of scrap charged in Ranshofen
Kongsberg Automotive ASA. Third quarter November 7, 2018
 Kongsberg Automotive ASA Third quarter - November 7, Q3 Highlights Continued improvements in turbulent times Revenues increased YoY by MEUR 18.3 (~8%) to MEUR 259 including negative FX effects of MEUR
As a note, this presentation was released as the dates shown and reflected management views as of these dates. All information in this presentation
 February 2004 1 As a note, this presentation was released as the dates shown and reflected management views as of these dates. All information in this presentation regarding the Company s financial results
FISCAL YEAR MARCH 2018 THIRD QUARTER FINANCIAL RESULTS
 FISCAL YEAR MARCH 2018 THIRD QUARTER FINANCIAL RESULTS PRESENTATION OUTLINE Highlights Fiscal Year March 2018 Nine Month Results Fiscal Year March 2018 Full Year Forecast Progress of Key Initiatives 1
Disclaimer: Jardine Cycle & Carriage accepts no liability whatsoever with respect to the use of this document or its contents.
 Disclaimer: Jardine Cycle & Carriage accepts no liability whatsoever with respect to the use of this document or its contents. Highlights Underlying earnings per share 22% down Astra profit lower and contribution
On track. Investor and Analyst Presentation On the Occasion of the Release of the Preliminary Figures for 9M 2011 Hanover, 18 October 2011
 On track. Investor and Analyst Presentation On the Occasion of the Release of the Preliminary Figures for 9M 2011 Agenda Delticom at a Glance Business Model Profit & Loss Balance Sheet Outlook 2 Agenda
FISCAL YEAR MARCH 2014 FIRST HALF FINANCIAL RESULTS. New Mazda Axela (Overseas name: New Mazda3)
") FISCAL YEAR MARCH 2014 FIRST HALF FINANCIAL RESULTS New Mazda Axela (Overseas name: New Mazda3) Mazda Motor Corporation October 31, 2013 1 PRESENTATION OUTLINE Highlights Fiscal Year March 2014 First Half
FISCAL YEAR MARCH 2014 FIRST HALF FINANCIAL RESULTS New Mazda Axela (Overseas name: New Mazda3) Mazda Motor Corporation October 31, 2013 1 PRESENTATION OUTLINE Highlights Fiscal Year March 2014 First Half
BMW GROUP QUARTERLY REPORT. TO 30 SEPTEMBER 2014
 . BMW GROUP QUARTERLY REPORT. TO 30 SEPTEMBER 2014 THE BMW GROUP IS WELL ON TRACK AND PERFORMS IN LINE WITH THE GUIDANCE. The BMW Group is well on track to reach its targets for 2014. Full year guidance
Earnings conference call Q3 2016
 Earnings conference call Q3 2016 Bo Annvik, CEO / Åke Bengtsson, CFO October 25, 2016 1 Agenda Business Highlights Market Update Sales Financials Outlook Public offer 2 Business Highlights Q3 2016 Solid
The Group is expected to continue benefiting from stable coal prices, but in the car market, competitive pressures are likely to intensify.
 PRESS RELEASE 24th April 2018 PT ASTRA INTERNATIONAL TBK 2018 FIRST QUARTER FINANCIAL STATEMENTS Highlights Net earnings per share down 2 at 123 Lower market share for cars and motorcycles Higher coal
FY 2017 Results. Disclaimer: Jardine Cycle & Carriage accepts no liability whatsoever with respect to the use of this document or its contents.
 FY 2017 Results Disclaimer: Jardine Cycle & Carriage accepts no liability whatsoever with respect to the use of this document or its contents. FINANCIAL HIGHLIGHTS Financial Highlights Underlying earnings
Hindalco. Investor Presentation Q3 FY17 February 13, 2017
 Hindalco Investor Presentation Q3 FY17 February 13, 2017 Forward Looking & Cautionary Statement Certain statements in this report may be forward looking statements within the meaning of applicable securities
Fact Sheet for Q April 22, 2016
 Fact Sheet for Q1 2016 April 22, 2016 Contents Daimler Group Stock Market Information 3 Earnings and Financial Situation 4-13 Information for Divisions Mercedes-Benz Cars 14-17 Daimler Trucks 18-22 Mercedes-Benz
Factbook. Tokyo Electric Power Company Holdings, Inc. August Tokyo Electric Power Company Holdings, Inc. All Rights Reserved.
 Factbook Tokyo Electric Power Company Holdings, Inc. August 2018 (Note) Please note that the following to be an accurate and complete translation of the original Japanese version prepared for the convenience
2015 Interim Results Announcement
 China Petroleum & Chemical Corporation 2015 Interim Results Announcement August 27, 2015 Hong Kong Cautionary Statement This presentation and the presentation materials distributed herein include forward-looking
TOFAŞ RESULTS WEBCAST PRESENTATION
 TOFAŞ 31.12.2017 RESULTS WEBCAST PRESENTATION 02.02.2018 AGENDA Highlights Turkish Automotive Industry Production Domestic Market Developments Tofaş Domestic Market Performance Export Markets & Tofaş Performance
Management Discussion and Analysis
 Management Discussion and Analysis For the Annual Operating Results Ended December 31, 2009 Note: This Management Discussion and Analysis (MD&A) was made to disclose information and the vision of the management