Dynasty Ceramic. We are making the impossible, POSSIBLE.
|
|
|
- Stella Bailey
- 6 years ago
- Views:
Transcription

1 Dynasty Ceramic We are making the impossible, POSSIBLE.


2 Contents Road to Success Sales Reports Cost of Production Performance Competitor Analysis Going Forward Q & A 2
3 Dynasty Ceramic Road to Success


4 DCC Timeline Established on the 1 st of August 1989 Registered as PCL on the 4 th of March st company owned outlet in 1998 Merged with Tile Top Industry at the end of 1997 Forbes Award Best Under a Billion 200 Companies in M M Timeline Dynasty Production Process in M Forbes Award Best Under a Billion 200 Companies in 2006 Computerized Systems in the middle of 2007 Forbes Award Best Under a Billion 200 Companies in M M Ranked 17 th world s Largest Ceramic Tile Manufacturer in 2008 SET Outstanding Performance Award M M M Listing on the SET on the 3 rd of January 1992 Registered Capital of 408 million Baht in 2000 Waste Heat Recovery System in 2007 Dynasty Ceramic on 200 Best Public Companies of the years 2010 Magazine 4

5 Our Growth 9,000 8,000 Forecast , ,000 5,000 4,000 3, Outlet Sales per Outlet Outlet Sales Revenue Agent Sales 2, ,


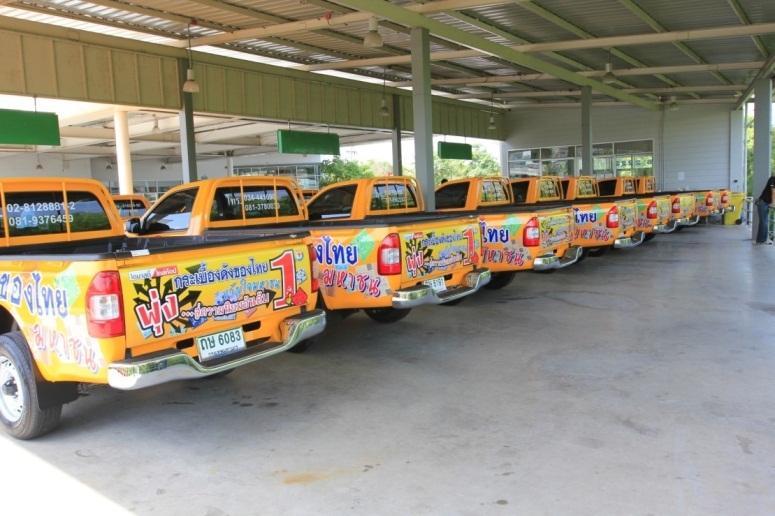


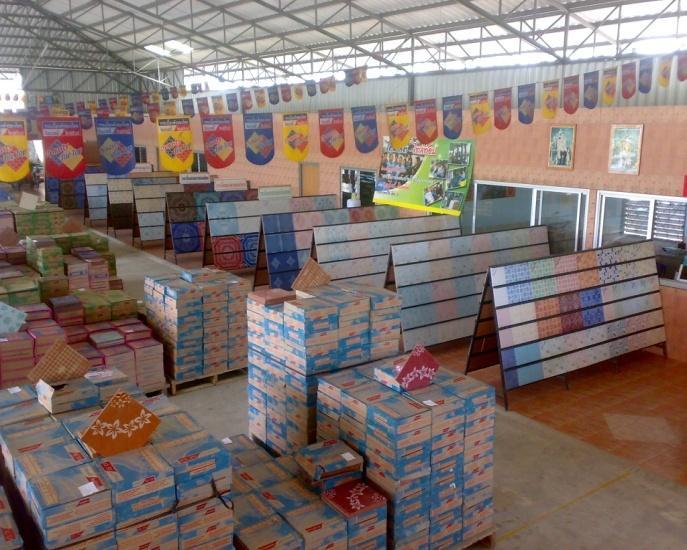

6 DCC with Thai People
7 Dynasty Ceramic Sales Reports
 ACTUAL Y2011 = 55,909 (000'SQM.")
 4,851 4,679 4,850 4,877 4,321 4,369 4,484 4,307 4,538 4,433 4,089 4,087 4,011 3,828 4,188")
8 Sales Volume 7,500 7,000 6,500 6,000 5,500 5,000 4,500 4,000 3,500 3,000 4,973 5,363 5,893 5,889 5,049 5,564 5,010 5,032 ACTUAL JAN-MAR 2012 = 16,229 (000'SQM.) ACTUAL Y2011 = 55,909 (000'SQM.) ACTUAL Y2010 = 50,617 (000'SQM.) 4,851 4,679 4,850 4,877 4,321 4,369 4,484 4,307 4,538 4,433 4,089 4,087 4,011 3,828 4,188 3,735 3,508 3,465 3,360 JAN FEB MAR APR MAY JUN JUL AUG SEP OCT NOV DEC
9 Sales Value 1, ACTUAL JAN-MAR 2012 = 2,093 MB ACTUAL Y2011 = 7,195 MB ACTUAL Y2010 = 6,456 MB JAN FEB MAR APR MAY JUN JUL AUG SEP OCT NOV DEC
 2,014 10.0 5.")
10 Sales Volume & Sales Value 1Q Q12 4Q11 1Q11 SALES VOLUME(M.Sqm.) 2, , SALES VALUE(MB) 2, Q12 4Q11 1Q11 1Q12 4Q11 1Q11 - %GROWTH 29% 2% 28% 4%
11 Outlet Quarterly Sales Performance by Region (MB) NE M E S N Q08 2Q08 3Q08 4Q08 1Q09 2Q09 3Q09 4Q09 1Q10 2Q10 3Q10 4Q10 1Q11 2Q11 3Q11 4Q11 1Q12


12 Outlet Quarterly Sales Performance by Region (%) Q1/2012 (%) North 18% (ล านบาท) Agent 4% Central 23% Agent 6% East 8% Agent 1% Northeast 37% Agent 9% South 14% Agent 2% Q1/2011 North 19% Agent 4% Central 21% Agent 7% East 8% Agent 2% Northe ast 38% Agent 9% South 14% Agent 2% Q2/2011 North Northe 17% ast Central Agent 3% 35% 24% Agent 8% South Agent 5% East 16% 8% Agent 2% Agent 1% Q3/2011 North 17% Agent 3% Central 25% Agent 5% East 9% Agent 2% Northe ast 30% Agent 6% South 19% Agent 3% Q4/2011 North 17% Central Agent 3% 22% Agent 4% East 10% Agent 1% Northe ast 32% Agent6% South 19% Agent 2%
13 Sales Comparison by Distribution Channel Y , 1Q2012 (MB) 1,800 (ล านบาท) 1,600 1,400 1,200 1,000 MB (200) 1Q09 2Q09 3Q09 4Q09 1Q10 2Q10 3Q10 4Q10 1Q11 2Q11 3Q11 4Q11 1Q12 Outlet 1,225 1, ,065 1,373 1, ,040 1,412 1,357 1,244 1,222 1,606 Agent Export Franchise
14 Sales Comparison by Distribution Channel Y , 1Q2012(%) 1Q2012 (ล า Franchise 5% Agent 15% Export 3% Outlet 77% Franchise 6% Agent 18% Y2011 Export 3% Outlet 73% Franchise 7% Agent 19% Y2010 Export 3% Outlet 71%
15 Sales Comparison by Product Type Y ,1Q2012 (MB) 1,500 (ล านบาท) 1,300 1, MB (100) (300) 1Q09 2Q09 3Q09 4Q09 1Q10 2Q10 3Q10 4Q10 1Q11 2Q11 3Q11 4Q11 1Q12 Floor 12 x 12 1, , , Floor 16 x Floor 8 x Wall 8 x Wall 8 x Wall 8 x 12 3 Other


16 Sales Comparison by Product Type Y ,1Q2012 (%) Wall 8 x 8 1% Floor 8 x 8 5% Other 2% 1Q2012 Wall 8 x 12 0% Wall 8 x 10 12% Floor 16 x 16 35% Floor 12 x 12 45% Floor 8 x 8 6% Wall 8 x 8 0% Wall 8 x 10 12% Y2010 Other 2% Floor 8 x 8 5% Wall 8 x 8 1% Wall 8 x 10 11% Y2011 Other 2% Floor 16 x 16 24% Floor 12 x 12 56% Floor 16 x 16 31% Floor 12 x 12 50%
17 Dynasty Ceramic Cost of Production
18 Cost of Production Y2011 Gas 5% 6% 3% 5% 5% 5% 1% 18% 31% 21% Glazing&pigments Body Depreciation Power Labour Fixed Maintenance Packaging Supplies Used 18

19 Cost of Production 1Q2012 6% 4% 4% 1% 6% 6% 2% 16% 21% 33% Gas Glazing&pigments Body Depreciation Power Labour Fixed Maintenance Packaging Supplies Used 19
20 Dynasty Ceramic Performance
21 Notices 30% Tax (1Q11) DCC adopted new accounting standard (2011) TAS19 - Employees Benefit Obligation (1Q11) First 85 Million Baht booked in Liabilities Million Baht per year Sales promotion and commission fee deducted directly from Sales (1Q11) Revising assets and its depreciation (2Q11) 23% Tax (2012) 21

22 M. QUARTERLY PERFORMANCE GROSS PROFIT NET PROFIT (BT) SALES VALUE M Q08 2Q08 3Q08 4Q08 1Q09 2Q09 3Q09 4Q09 1Q10 2Q10 3Q10 4Q10 1Q11 2Q11 3Q11 4Q11 1Q12 0

23 NET PROFIT(MB)/EARNINGS PER SHARE(BAHT) 1Q Q12 4Q11 1Q11 NET PROFIT(MB) EARNINGS PER SHARE(BAHT) % %GROWTH 2% 1Q12 4Q11 1Q11 1Q12 4Q11 1Q11
 4,460 4,475 5,095 5,905 6,531 7,227")
 (3,384) (3,630) (4,143) (1,264) Gross Profit")
 37 39 39 43 44 43 40")
 (347) Net Profit (Bt mil) 567 543 664 994")
 4,452 4,458 5,089 5,884 6,511 7,207")
 34 35 41 47 51 56 16 Average Sales Price")
24 Performance FY06 FY07 FY08 FY09 FY10 FY11 1Q12 Revenue (Bt mil) 4,460 4,475 5,095 5,905 6,531 7,227 2,096 Cost of Goods Sold (Bt mil) (2,829) (2,742) (3,130) (3,384) (3,630) (4,143) (1,264) Gross Profit (Bt mil) 1,631 1,733 1,965 2,521 2,901 3, Gross Profit Margin (percent) SG&A (Bt mil) (742) (791) (978) (1,079) (1,208) (1,237) (347) Net Profit (Bt mil) ,175 1, FY06 FY07 FY08 FY09 FY10 FY11 1Q12 Sales (Bt mil) 4,452 4,458 5,089 5,884 6,511 7,207 2,093 Sales Volume (Sqm. mil) Average Sales Price (Bt/Sqm.)
25 Performance FY06 FY07 FY08 FY09 FY10 FY11 1Q12 Gas Cost of COGS (Bt mil) , Natural Gas Price (Bt/MMBTU) Transportation Cost (Bt mil) Transportation Cost (Bt/Sqm.) Oil Price (Bt/Litre)

26 Key Financial Ratios FY06 FY07 FY08 FY09 FY10 FY11 1Q12 ROE ROA EPS (Baht) D/E P/BV Pay Out Ratio 70% 75% 77% 85% 100% 100% 100% Dividend Per Share
27 Dynasty Ceramic Competitor Analysis
28 Sales Value (MB) 2,500 2,000 1,948 2,018 1,856 2,093 1,500 1, ,698 1,634 1,674 1,618 1,461 1,430 1,467 1,375 1, Q09 2Q09 3Q09 4Q09 1Q10 2Q10 3Q10 4Q10 1Q11 2Q11 3Q11 4Q11 1Q12 DCC TGCI RCI UMI 28
29 Profit (MB) MB (100) (200) 1Q09 2Q09 3Q09 4Q09 1Q10 2Q10 3Q10 4Q10 1Q11 2Q11 3Q11 4Q11 1Q12 DCC TGCI (100) RCI (29) (40) (15) (12) (22) (41) (26) (36) (28) (35) (43) (48) (10) UMI
30 Dynasty Ceramic Going Forward
31 Risk Factors Natural Gas price is said to increase 5% in 2012 Natural Disaster worse than previous year? Government Policies
32 Production Capacity Expansion Plan 2012
33 2012 Outlook Targeting 10% growth in revenue Targeting to open 15 outlets Targeting 42% gross margin Increase ASP to 133 Baht Domestic market share up to 50% Increase 5% in production capacity by modifications More than 95% capacity utilization rate Reduce 5% of labor Reduce SG&A Intensive training programs for all employees 33
34 and Next? Targeting 10 billion Baht Revenue at the end of 2014 Increase same store growth 300 Outlets in 2021 throughout Thailand Reduce 5% of work force every year for the next 5 years Improve gross profit margin Maintain 100% dividend pay out Looking for market opportunity abroad Research, Research, Research


35 Dynasty Ceramic Questions?


36 MARUTH SAENGSASTRA Vice President & C.I.O. Dynasty Ceramic PCL. Tile Top Industry PCL. 37/7 Sutthisarn Rd., Samsennok, Hueykwang BKK maruth@dynastyceramic.com 36
1. Trends in the current fiscal year and previous fiscal year 3. Business overview 2. Secular trends in first quarter financial results
 FY2/19 (March 2018~May 2018) Fact Book 1. Trends in the current fiscal year and previous fiscal year 3. Business overview (1) Performance overview P. 1 (1) No. of students at the end of month P. 6 (2)
FY2/18 2Q(March 2017~August 2018)
") FY2/18 2Q(March 2017~August 2018) Fact Book 1. Trends in the current fiscal year and previous fiscal year 3. Business overview (1) Performance overview P.1 (1) No. of students at the end of month P.7 (2)
FY2/18 2Q(March 2017~August 2018) Fact Book 1. Trends in the current fiscal year and previous fiscal year 3. Business overview (1) Performance overview P.1 (1) No. of students at the end of month P.7 (2)
FY2/18 (March 2017~February 2018)
") FY2/18 (March 2017~February 2018) Fact Book 1. Trends in the current fiscal year and previous fiscal year 3. Business overview (1) Performance overview P. 1 (1) No. of students at the end of month P. 6
FY2/18 (March 2017~February 2018) Fact Book 1. Trends in the current fiscal year and previous fiscal year 3. Business overview (1) Performance overview P. 1 (1) No. of students at the end of month P. 6
FY2/17 3Q(March 2016~November2016)
") FY2/17 (March 2016~November2016) Fact Book 1. Trends in the current fiscal year and previous fiscal year 3. Business overview (1) Performance overview P. 1 (1) No. of students at the end of month P. 7
FY2/17 (March 2016~November2016) Fact Book 1. Trends in the current fiscal year and previous fiscal year 3. Business overview (1) Performance overview P. 1 (1) No. of students at the end of month P. 7
Commercial-in-Confidence Ashton Old Baths Financial Model - Detailed Cashflow
 Year 0 1 2 3 4 5 6 7 8 9 10 11 12 13 Oct-16 Nov-16 Dec-16 Jan-17 Feb-17 Mar-17 Apr-17 May-17 Jun-17 Jul-17 Aug-17 Sep-17 Oct-17 2,038 2,922 4,089 4,349 6,256 7,124 8,885 8,885 8,885 8,885 8,885 8,885 9,107
FY2/17 (March 2016~February 2017)
") FY2/17 (March 2016~February 2017) Fact Book 1. Trends in the current fiscal year and previous fiscal year 3. Business overview (1) Performance overview P. 1 (1) No. of students at the end of month P. 7
FY2/17 (March 2016~February 2017) Fact Book 1. Trends in the current fiscal year and previous fiscal year 3. Business overview (1) Performance overview P. 1 (1) No. of students at the end of month P. 7
ANALYST BRIEFING FOR THE FOURTH QUARTER ENDED FEBRUARY 2017
 ANALYST BRIEFING FOR THE FOURTH QUARTER ENDED 2016 22 FEBRUARY 2017 MSM Malaysia Holdings Berhad Analyst Briefing Q4 2016 22/2/2017 1 CONTENTS 01 02 03 04 05 Group Financial Highlights Performance Review
January Manufacturing Technology Orders Off After a Strong December
 Contact: Bonnie Gurney, AMT, 703-827-5277 bgurney@amtonline.org For Release: March 9, 2015 January Manufacturing Technology Orders Off After a Strong December January U.S. manufacturing technology orders
ANALYST BRIEFING FOR THE THIRD QUARTER ENDED NOV 2016
 ANALYST BRIEFING FOR THE THIRD QUARTER ENDED 2016 21 NOV 2016 MSM Malaysia Holdings Berhad Analyst Briefing Q3 2016 21/11/2016 1 CONTENTS 01 02 03 04 05 Group Financial Highlights Performance Review Sugar
Somboon Advance Technology PCL
 Somboon Advance Technology PCL Opportunity Day: 2014Q4 Mar 17, 2015 1 Company Overview Industry Overview Sale Performance Financial Highlights Q&A 2 Company Overview SAT Paid up 425 million Baht As of
LOGO. August 16,2010
 LOGO Opportunity Day TIRATHAI PUBLIC COMPANY LIMITED August 16,2010 Contents Company Profile Business Products Electrical Demand Overview Structure of Income & Q2 Operating Results Business Forecast for
Somboon Advance Technology PCL
 Somboon Advance Technology PCL Opportunity Day 2017Q2 September 12, 2017 1 Company Overview Automotive Industry Overview Tractor Industry Overview Sale Performance Financial Highlights Q&A 2 Company Overview
KCB GROUP PLC INVESTOR PRESENTATION. Q FINANCIAL RESULTS
 KCB GROUP PLC INVESTOR PRESENTATION. Q3 2018 FINANCIAL RESULTS MACRO-ECONOMIC HIGHLIGHTS Macro-Economic Highlights: Kenya KENYA 4.9% 5.3% GDP Growth Rate (%) 5.6% 5.8% 4.9% 6.3% 6.2% KENYA 2013 2014 2015
FY2/16(March 2015~February 2016)
") FY2/16(March 2015~February 2016) 1. Trends in the current fiscal year and the previous fiscal year 3. Business overview (1) Peformance overview P.1 (1) No. of students at the end of month P.7 (2) Cost
FY2/16(March 2015~February 2016) 1. Trends in the current fiscal year and the previous fiscal year 3. Business overview (1) Peformance overview P.1 (1) No. of students at the end of month P.7 (2) Cost
COMPARISON OF FIXED & VARIABLE RATES (25 YEARS) CHARTERED BANK ADMINISTERED INTEREST RATES - PRIME BUSINESS*
 CHARTERED BANK ADMINISTERED INTEREST RATES - PRIME BUSINESS*") COMPARISON OF FIXED & VARIABLE RATES (25 YEARS) 2 Fixed Rates Variable Rates For Internal Use Only. FIXED RATES OF THE PAST 25 YEARS AVERAGE RESIDENTIAL MORTGAGE LENDING RATE - 5 YEAR* (Per cent) Year
COMPARISON OF FIXED & VARIABLE RATES (25 YEARS) 2 Fixed Rates Variable Rates For Internal Use Only. FIXED RATES OF THE PAST 25 YEARS AVERAGE RESIDENTIAL MORTGAGE LENDING RATE - 5 YEAR* (Per cent) Year
COMPARISON OF FIXED & VARIABLE RATES (25 YEARS) CHARTERED BANK ADMINISTERED INTEREST RATES - PRIME BUSINESS*
 CHARTERED BANK ADMINISTERED INTEREST RATES - PRIME BUSINESS*") COMPARISON OF FIXED & VARIABLE RATES (25 YEARS) 2 Fixed Rates Variable Rates FIXED RATES OF THE PAST 25 YEARS AVERAGE RESIDENTIAL MORTGAGE LENDING RATE - 5 YEAR* (Per cent) Year Jan Feb Mar Apr May Jun
COMPARISON OF FIXED & VARIABLE RATES (25 YEARS) 2 Fixed Rates Variable Rates FIXED RATES OF THE PAST 25 YEARS AVERAGE RESIDENTIAL MORTGAGE LENDING RATE - 5 YEAR* (Per cent) Year Jan Feb Mar Apr May Jun
FY2/15(March 2014~February 2015)
") FY2/15(March 2014~February 2015) 1. Trends in the current fiscal year and the previous fiscal year 3. Business overview (1) Peformance overview P.1 (1) No. of students at the end of month P.7 (2) Cost
FY2/15(March 2014~February 2015) 1. Trends in the current fiscal year and the previous fiscal year 3. Business overview (1) Peformance overview P.1 (1) No. of students at the end of month P.7 (2) Cost
U.S. manufacturing technology orders kick off 2018 on a high note
 Contact: Penny Brown, AMT, 703-827-5275 pbrown@amtonline.org For Release: March 12th, 2018 U.S. manufacturing technology orders kick off 2018 on a high note Orders for manufacturing technology in January
First half (2014/3/1~2014/8/31)
") FY2/15 (March 2014~November 201 4) 1.Trends in current fiscal year and previouse fiscal year 3.Business overview (1)Peformance overview P.1 (1)No. of students at the end of month P.7 (2)Cost of sales breakdown
FY2/15 (March 2014~November 201 4) 1.Trends in current fiscal year and previouse fiscal year 3.Business overview (1)Peformance overview P.1 (1)No. of students at the end of month P.7 (2)Cost of sales breakdown
FY2012. H1 Financial Results. November 8, Copyright(C) 2011 Isuzu Motors Limited All rights reserved
 2011 Isuzu Motors Limited All rights reserved") FY2012 H1 Financial Results November 8, 2011 1 Copyright(C) 2011 Isuzu Motors Limited All rights reserved Ⅰ. President and Representative Director : Susumu Hosoi :FY2012 H1 Financial Summary Outline Ⅱ.
FY2012 H1 Financial Results November 8, 2011 1 Copyright(C) 2011 Isuzu Motors Limited All rights reserved Ⅰ. President and Representative Director : Susumu Hosoi :FY2012 H1 Financial Summary Outline Ⅱ.
NEWS Release. U.S. Manufacturing Technology Orders. Year-to-date U.S. manufacturing technology orders up 4.1% over 2011
 U.S. Manufacturing Technology Orders A statistical program of AMT NEWS Release FOR RELEASE: October 8, 2012 Contact: Pat McGibbon, AMT, 703-827-5255 Year-to-date U.S. manufacturing technology orders up
Monthly Operating Report. September 2016
 Monthly Operating Report September 20 September overview» For the month of September 20 Contact recorded: Electricity, gas and steam sales of 819 GWh (September 2015: 821 GWh) Netback of $79.50/MWh (September
FY H1 Financial Results
 FY2011 1 H1 Financial Results November 8, 2010 1 Copyright(C) 2010 Isuzu Motors Limited All rights reserved Contents Ⅰ. President and Representative Director : Susumu Hosoi :FY2011 H1 Financial Summary
Q Analyst Teleconference. 9 August 2018
 9 August 218 Disclaimer This presentation contains forward-looking statements that reflect the Company management s current views with respect to certain future events. Although it is believed that the
Monthly Operating Report. December 2017
 Monthly Operating Report December 20 December overview» For the month of December 20 Contact recorded: Electricity and gas sales of 571 GWh (December 2016: 582 GWh) Netback of $79.23/MWh (December 2016:
TOFAŞ Q ANALYST PRESENTATION
 TOFAŞ Q1 2016 ANALYST PRESENTATION 03.05.2016 1 2016 Q1 AGENDA Highlights Turkish Automotive Industry Production & Capacity Utilization Domestic Market Developments Tofaş Domestic Market Performance Export
Months Investor Presentation
 2018 9 Months Investor Presentation 25.10.2018 Disclaimer Ereğli Demir Çelik Fabrikaları T.A.Ş. (Erdemir) may, when necessary, make written or verbal announcements about forward-looking information, expectations,
TOFAŞ RESULTS WEBCAST PRESENTATION
 TOFAŞ 31.12.2016 RESULTS WEBCAST PRESENTATION 02.02.2017 1 WEBCAST AGENDA Highlights Turkish Automotive Industry Production Domestic Market Developments Tofaş Domestic Market Performance Export Markets
Monthly Operating Report. February 2018
 Monthly Operating Report February 2018 February overview» For the month of February 2018 Contact recorded: Electricity and gas sales of 534 GWh (February 20: 551 GWh) Netback of $82.16/MWh (February 20:
1 Copyright(C) 2012 Isuzu Motors Limited All rights reserved
 2012 Isuzu Motors Limited All rights reserved") FY2012 Financial Results May 10, 2012 1 Copyright(C) 2012 Isuzu Motors Limited All rights reserved Contents Ⅰ. President and Representative Director : Susumu Hosoi FY2012 Overview Ⅱ. Director Director
FY2012 Financial Results May 10, 2012 1 Copyright(C) 2012 Isuzu Motors Limited All rights reserved Contents Ⅰ. President and Representative Director : Susumu Hosoi FY2012 Overview Ⅱ. Director Director
Results for the Three Months ended June 30, 2018
 Reference Translation Results for the Three Months ended June 30, 2018 July 31, 2018 AUTOBACS SEVEN CO., LTD. FY March 2019 Consolidated P/L Profit Loss/Gain: Net sales and gross profit decreased, and
9M 2003 Financial Results (US GAAP)
") 9M Financial Results (US GAAP) January 2004 LUKOIL Group Crude Oil Production* mln tonnes 82 80 78 76 74 72 70 68 66 64 Crude oil production 3.2 5.5 3.9 76.8 70.3 71.3 2001 Production by subsidiaries Share
9M Financial Results (US GAAP) January 2004 LUKOIL Group Crude Oil Production* mln tonnes 82 80 78 76 74 72 70 68 66 64 Crude oil production 3.2 5.5 3.9 76.8 70.3 71.3 2001 Production by subsidiaries Share
2Q06 Results. Investor Relations
 2Q06 Results Investor Relations Content 1. 2Q06 Key Results 2. Summarized Income Statement 3. Balance Sheet as of Jun. 2006 4. Outlook for 2006 5. Result & Outlook By Division Appendix : 2Q06 Results Breakdown
Second Quarter 2009 Results
 1 Second Quarter 2009 Results Second Quarter 2009 Results Donald W. Seale Executive Vice President and Chief Marketing Officer Railway Operating Revenue Second Quarter 2009 vs. 2008 Revenue Total $1.86
Q3 Results November 16, 2006 Analyst Presentation
 Q3 Results 2006 November 16, 2006 Analyst Presentation Group Sales (in million Euro) Total Sales 2,395 +3.3% (+2.4%)* 2,474 Split per Business Group (YTD) Specialty Products 7% Q3 797 +1.0% (+2.5%)* 805
Analyst Presentation Barloworld Automotive 29 February 2008
 Analyst Presentation Barloworld Automotive 29 February 2008 Automotive Division Automotive Division Overview Business Overview Motor Retail Car Rental Fleet Services Importation & Distribution Joint Ventures
Outlook for Franchised New Car Dealers
 1 Outlook for Franchised New Car Dealers Fourteenth Annual Automotive Outlook Symposium June 1, 2007 Paul Taylor, Ph.D., Chief Economist National Automobile Dealers Association, McLean, VA www.nada.org
PTG ENERGY PUBLIC COMPANY LIMITED. Opportunity Day. 2Q/2017 Performance Results
 PTG ENERGY PUBLIC COMPANY LIMITED Opportunity Day 2Q/2017 Performance Results PTG Businesses Retailing and Wholesaling Fuel Products Non-Fuel Products Logistics Business (Fuel logistics and Depot) Renewable
Contents. Automotive Holdings Group Limited
 Automotive Holdings Group Limited Institutional Briefings Year End Results June Contents FY Highlights Corporate Statistics Group Performance Floorplan Financing Automotive Logistics Outlook Appendices
2010 1Q Investor Meeting. May 2010
 2010 1Q Investor Meeting May 2010 This presentation contains preliminary figures which may be materially different from the final figures. While the statements in this presentation represent our current
Baoshan Iron & Steel Co., Ltd. August 2010
 Baoshan Iron & Steel Co., Ltd. August 2010 1 Disclaimer: The following presentation distributed herewith includes forwardlooking statements. All statements, other than statements of historical facts, that
BUSINESS YEAR 2007 RESULTS
 BUSINESS YEAR 2007 RESULTS EVOLUTION OF THE STAINLESS STEEL WORLD PRODUCTION Million Mt. YEAR 2003 YEAR 2004 YEAR 2005 YEAR 2006 YEAR 2007 (estimated) 9.5 10.6 2.7 9.8 11.9 2.9 9.1 12.5 2.7 10.3 15.1 3.0
FOR IMMEDIATE RELEASE
 Article No. 7433 Available on www.roymorgan.com Roy Morgan Unemployment Profile Friday, 12 January 2018 2.6m Australians unemployed or under-employed in December The latest data for the Roy Morgan employment
MONTHLY PERFORMANCE DASHBOARD
 AUSTIN ENERGY MARCH 21 MONTHLY PERFORMANCE DASHBOARD A report highlighting key Austin Energy metrics for uary FY 21 FINANCIAL HEALTH Standard and Poor s Bond Rating Current AA AA Budget Based Revenues
FOR IMMEDIATE RELEASE
 Article No. 7845 Available on www.roymorgan.com Roy Morgan Unemployment Profile Friday, 18 January 2019 Unemployment in December is 9.7% and under-employment is 8.8% FOR IMMEDIATE RELEASE Australian unemployment
Martin Stopford President, Clarkson Research
 9//5 Current and past policies for expanding maintaining or reducing shipbuilding capacity: OECD Working Party No 6 9 th November 5 Martin Stopford President, Clarkson Research Martin Stopford, Clarkson
1 Copyright(C) 2012 Isuzu Motors Limited All rights reserved
 2012 Isuzu Motors Limited All rights reserved") FY2013 H1 Financial Results November 7, 2012 1 Copyright(C) 2012 Isuzu Motors Limited All rights reserved Contents Ⅰ. President and Representative Director : Susumu Hosoi :FY2013 H1 Financial Summary Outline
FY2013 H1 Financial Results November 7, 2012 1 Copyright(C) 2012 Isuzu Motors Limited All rights reserved Contents Ⅰ. President and Representative Director : Susumu Hosoi :FY2013 H1 Financial Summary Outline
FY 2006 Third Quarter Review
 FY 26 Third Quarter Review February 2, 27 Nissan Motor Co., Ltd 1 Agenda Third quarter news update Sales performance Financial results FY6 Outlook Sustainable growth 2 Third quarter news update Oct 1)
FOR IMMEDIATE RELEASE
 Article No. 7353 Available on www.roymorgan.com Roy Morgan Unemployment Profile Wednesday, 11 October 2017 2.498 million Australians (18.9%) now unemployed or under-employed In September 1.202 million
Cambodia. East Asia: Testing Times Ahead
 Key Indicators Cambodia 68 East Asia: Testing Times Ahead 2002 2003 2004 2005 2006 2007 /e 2008 /p 2009 /p Year Year Year Year Year Year Year Year Real GDP (% change, previous year) 6.5 8.5 10.0 13.5 10.8
Financial Information Details
 FY2012, Year Ended March 31, 2013 Financial Information Details Financial Results (Consolidated) 1 Cash-Flows (Consolidated) 2 Subsidiaries 3 Financial Results of Major Subsidiaries,Other Financial Data
RESILIENCE MBM RESOURCES BERHAD ( V) Analyst Briefing 24 August 2017
 Analyst Briefing 24 August 2017") RESILIENCE MBM RESOURCES BERHAD (284496-V) Analyst Briefing 24 August 217 1 1 DISCLAIMER The information and opinions contained in this presentation are provided as at the date of the document. Certain
RESILIENCE MBM RESOURCES BERHAD (284496-V) Analyst Briefing 24 August 217 1 1 DISCLAIMER The information and opinions contained in this presentation are provided as at the date of the document. Certain
Thursday, March 6, 2014 Houston, TX. 8:30 9:40 a.m. AN ECONOMIST S-EYE VIEW OF THE ENERGY INDUSTRY: HYDROCARBON HAT TRICK
 Thursday, March 6, 214 Houston, TX 8:3 9:4 a.m. AN ECONOMIST S-EYE VIEW OF THE ENERGY INDUSTRY: HYDROCARBON HAT TRICK Presented by Jesse Thompson Business Economist Federal Reserve Bank of Dallas, Houston
Financial Highlights Q1 Results of FY 2013 (Fiscal year ending March 2014) August 8, : Avex Group Holdings Inc.
 August 8, : Avex Group Holdings Inc.") Financial Highlights Q1 Results of FY 2013 (Fiscal year ending March 2014) August 8, 2013 7860: Avex Group Holdings Inc. 1 1 Consolidated Results 2 2 Q1 FY 2013 Highlights Record high as a quarterly sales.
Financial Highlights Q1 Results of FY 2013 (Fiscal year ending March 2014) August 8, 2013 7860: Avex Group Holdings Inc. 1 1 Consolidated Results 2 2 Q1 FY 2013 Highlights Record high as a quarterly sales.
Results for the First Six Months Ended September 30, 2013
 Translation ANALYST MEETING Results for the First Six Months Ended September 30, 2013 November 1, 2013 Setsuo Wakuda Representative Director and CEO AUTOBACS SEVEN CO., LTD. Contents 1. Results for the
Property Market Overview 3Q16 & 9M16
 Property Market Overview 3Q16 & 9M16 9M16 NEWLY LAUNCHED BY UNIT & VALUE 3 3Q16 NEWLY LAUNCHED BY UNIT & VALUE 4 3Q16 RESIDENTIAL MARKET Source : REIC Housing Transfer by Value (MB) Type 3Q16 QoQ YoY 9M16
Honda FY2011 Rating Review
 Honda Information Meeting 213 Spring Honda FY211 Rating Review 214 Acura MDX 1 1 Honda Information Meeting Honda FY211 Rating Review Current Honda Business Business Strategy Automobile Business Motorcycle
FY 2010 first-half financial results
 FY 2010 first-half financial results November 4, 2010 Nissan Motor Co., Ltd. first-half financial results Key performance indicators: Financial results (billion yen) Net revenue Operating profit Net income
INVESTOR PRESENTATION. February 2011
 INVESTOR PRESENTATION February 2011 Agenda Ford Otosan Overview Turkish Automotive Industry Overview Competitive Advantages Key Operating Data ISE Performance 2 Investor Presentation February 2011 FORD
Accounting Overview for 2 nd Quarter of FY2014
 1/15 Accounting Overview for 2 nd Quarter of FY2014 October 29, 2013 Yasuhiko Ichihashi President, Member of Board Hino Motors, Ltd. Photos: Vehicles scheduled to be on display at 43rd Tokyo Motor Show
FY2015 First Quarter Financial Results. SUZUKI MOTOR CORPORATION 3 August 2015
 First Quarter Financial Results SUZUKI MOTOR CORPORATION 3 August 2015 Consolidated: Financial Summary Page2 Increased net sales and operating income/ordinary income Decreased net income attributable to
TOFAŞ RESULTS WEBCAST PRESENTATION
 TOFAŞ 31.12.2017 RESULTS WEBCAST PRESENTATION 02.02.2018 AGENDA Highlights Turkish Automotive Industry Production Domestic Market Developments Tofaş Domestic Market Performance Export Markets & Tofaş Performance
282m 75% +575m. Net sales Operating income before non-recurring items. Operating margin before non-recurring items. Net Loss.
 First-Half 2009 Financial Highlights Net sales Operating income before non-recurring items Operating margin before non-recurring items Net Loss Net debt-to-equity ratio Free cash flow** 7,134m 282m 4.0%
Global Monthly March 2019
 Global Monthly March 19 Percent of world bonds outstanding 3 5 15 5 Jan-1 Jun-1 Nov-1 Apr-15 Sep-15 Feb-1 Jul-1 Dec-1 May-17 Oct-17 Mar-1 Aug-1 Dec-1 Mar-19 March 19 Percent, year-on-year 7 5 3 1 1Q1 1Q
Martin Laubscher Barloworld Automotive
 Barloworld Limited Investor Day Martin Laubscher Barloworld Automotive 2 February 2009 Business Overview Automotive Division Car Rental Fleet Services Motor Retail Joint Ventures Southern Africa Southern
Docket No. DE Dated: 05/04/2015 Attachment CJG-1 Page 1
 Docket No. DE - Dated: 0/0/0 Attachment CJG- Page 8 9 Summary of Forecasted Energy Service 0 Cost For January 0 Through December 0 TOTAL COST Cents per KWH Reference Fossil energy costs $ 9,9 $. Attachment
Monro, Inc. Second Quarter Fiscal 2019 Earnings Call. October 25, 2018
 Monro, Inc. Second Quarter Fiscal 2019 Earnings Call October 25, 2018 Safe Harbor Statement and Non-GAAP Measures Certain statements in this presentation, other than statements of historical fact, including
Monthly Operating Report. January 2019
 Monthly Operating Report January 2019 January overview For the month of January 2019» The Customer business recorded: Mass market electricity and gas sales of 281 GWh (January 20: 282 GWh) Mass market
MONTHLY PERFORMANCE DASHBOARD
 AUSTIN ENERGY JULY MONTHLY PERFORMANCE DASHBOARD A report highlighting key Austin Energy metrics for e FY FINANCIAL HEALTH Standard and Poor s Bond Rating Austin Energy Rating AA AA Budget Based Revenues
Port Botany Trade Statistics Bulletin. 1 July May 2017
 Port Botany Trade Statistics Bulletin 1 July 2016 31 May 2017 YTD May 2017 Port Botany Container Trade Jul 2016 Aug 2016 Sep 2016 Oct 2016 Nov 2016 Dec 2016 Jan 2017 Feb 2017 Mar 2017 Apr 2017 May 2017
PET Outlook. Chase Willett Director Polyester & Polyester Raw Materials CMAI USA. Houston London Singapore Dubai 2004 Plastic Processors Conference
 PET Outlook Chase Willett Director Polyester & Polyester Raw Materials CMAI USA Global PET Demand Americas Asia Europe, MDE & Africa 23 28 1998 21% 45% 34% Tot Dem : 5.6 Mil Tons 24% 39% 37% Tot Dem :
Subject: Report on the operating results of Country Group Development PCL for the period ended September 30, 2018
 CGD61/0054 Date: November 13, 2018 Subject: Report on the operating results of Country Group Development PCL for the period ended September 30, 2018 To: The President The Stock Exchange of Thailand Country
Earnings conference call Q4 & FY 2016
 Earnings conference call Q4 & FY 2016 Bo Annvik, CEO / Åke Bengtsson, CFO February 10, 2016 1 Agenda Business Highlights Market Update Sales Financials Way forward 2 Business Summary FY 2016 A year with
Balance from your previous bill $0.00 Meter # Basic Charge: 17 $ /day 3.23* Energy charge:¹ 2
 11983979 Jun 19, 217 1 124 962 Jul 11, 217 $24.34 Meter Reading Previous Bill. Balance from your previous bill $. Meter # 552711 May 3 19813 Account Account charge 12.4* Charges 17 days 82 Jun 15 19895
MONTHLY PERFORMANCE DASHBOARD
 AUSTIN ENERGY MONTHLY PERFORMANCE DASHBOARD A report highlighting key Austin Energy metrics for uary FY 219 FINANCIAL HEALTH Standard and Poor s Bond Rating Austin Energy Rating AA AA Budget Based Revenues
Investors Guide. August Shimamura Co.,Ltd.
 Investors Guide August-2018 Shimamura Co.,Ltd. Ⅰ.Shimamura Co., Ltd. (Consolidated) 1.Consolidated Financial Summary and Forecast (1)Consolidated Profit and loss statement (2)Selling, General and Administrative
Pitti Laminations Limited
 Pitti Laminations Limited (BSE: 513519, NSE: PITTILAM) Q3 FY2016 Earnings Presentation 12 February 2016 Cautionary Statement This presentation contains statements that contain forward looking statements
SAT. To Become an Auto Parts Manufacturing Leader in ASEAN with Excellent lent Quality. March 16, 2010
 SAT To Become an Auto Parts Manufacturing Leader in ASEAN with Excellent lent Quality March 16, 2010 Agenda Industry Overview Group Business Performance Review Future Outlook Appendices 2009 Car Production
Institutional Presentation August 2011
 Institutional Presentation August 2011 Disclaimer This presentation may include forwardlooking statements representing expectations about future events or anticipated result based on factors such as economic
Hindalco Industries Limited. Performance Review Q3 FY08 30 th January 08
 Hindalco Industries Limited Performance Review Q3 FY08 30 th January 08 Highlights & Backdrop Backdrop : Q3 FY08 Adverse Global Macro economic factors US Sub prime crisis a double barrel impact: A sharp
Operating Results Q Asian Insulators Public Company Limited
 Operating Results Q2-2010 Asian Insulators Public Company Limited 254 Seri Thai Road, Kannayaow, Bangkok 10230 Thailand http://www.asianinsulators.com Tel. (66) 0-2517-1451 Fax. (66) 0-2517-1465 E-mail
Global Network Investment Competition
 Global Network Investment Competition 2017-18 Bhinneka Investment Group Juli Hartawan 1606938416 Julius V Sihombing 1606851075 Teja Amanda Putra 1606938901 Teuku Fahmi Ariandar 1606851693 Yulius Kurniawan
Port Botany. Trade Statistics Bulletin 1 July June 2018
 Port Botany Trade Statistics Bulletin 1 July 2017 30 June 2018 FY 2017/18 Port Botany Container Trade Jul 2017 Aug 2017 Sep 2017 Oct 2017 Nov 2017 Dec 2017 Jan 2018 Feb 2018 Mar 2018 Apr 2018 May 2018
January-March 2017 Customer Switching Report for the Electricity and Gas Retail Markets
 January- Customer Switching Report for the Electricity and Gas Retail Markets DOCUMENT TYPE: REFERENCE: Information Note CER/17102 DATE PUBLISHED: QUERIES TO: 28th April 2017 gkelly@cer.ie The Commission
Earnings conference call
 Earnings conference call Full year 2017 Åke Bengtsson, President & CEO Andreas Ekberg, Acting CFO February 14, 2018 1 Agenda Business Summary Market Update Sales Financials Way forward 2 Business Summary
MONTHLY PERFORMANCE DASHBOARD
 AUSTIN ENERGY MONTHLY PERFORMANCE DASHBOARD A report highlighting key Austin Energy metrics for ember FY 219 FINANCIAL HEALTH Standard and Poor s Bond Rating Austin Energy Rating AA AA Budget Based Revenues
Passenger Car and Light Commercial Vehicle Market Showed a Decrease of 59% in January 2019.
 February 4th, 2019 PRESS REVIEW Passenger Car and Light Commercial Vehicle Market Showed a Decrease of 59% in January 2019. Passenger Car Market Decreased By %59, Light Commercial Vehicle Market Decreased
FISCAL YEAR MARCH 2018 FIRST HALF FINANCIAL RESULTS
 FISCAL YEAR MARCH 2018 FIRST HALF FINANCIAL RESULTS PRESENTATION OUTLINE Highlights Fiscal Year March 2018 First Half Results Fiscal Year March 2018 Full Year Forecast Progress of Key Initiatives/ Business
ENERGY SLIDESHOW. Federal Reserve Bank of Dallas
 ENERGY SLIDESHOW Updated: January 16, 2019 ENERGY PRICES www.dallasfed.org/research/energy Brent & WTI & Crude Brent Oil Crude Oil Dollars per barrel 140 120 100 Brent (Jan 11 = $58.64) WTI (Jan 11 = $50.78)
Company. Jonathan Smoke Remarketing Big Picture 2017 and Beyond
 Company Jonathan Smoke Remarketing Big Picture 2017 and Beyond Economic Expansion Continues 10.00 REAL GROSS DOMESTIC PRODUCT (SAAR) % GROWTH BY QUARTER 8.00 6.00 4.00 3.1 2.00 0.00-2.00-4.00-6.00-8.00-10.00
Investors Guide. February Shimamura Co.,Ltd.
 Investors Guide February-2018 Shimamura Co.,Ltd. Ⅰ.Shimamura Co., Ltd. (Consolidated) 1.Consolidated Financial Summary and Forecast (1)Consolidated Profit and loss statement (2)Selling, General and Administrative
ASTRA AGRO LESTARI PT (AALI IJ) BHINNEKA INVESTMENT GROUP
 BHINNEKA INVESTMENT GROUP") 1-Nov-16 1-Dec-16 1-Jan-17 1-Feb-17 1-Mar-17 1-Apr-17 1-May-17 1-Jun-17 1-Jul-17 1-Aug-17 1-Sep-17 1-Oct-17 ASTRA AGRO LESTARI PT (AALI IJ) BHINNEKA INVESTMENT GROUP PT Astra Agro Lestari Tbk operates
1-Nov-16 1-Dec-16 1-Jan-17 1-Feb-17 1-Mar-17 1-Apr-17 1-May-17 1-Jun-17 1-Jul-17 1-Aug-17 1-Sep-17 1-Oct-17 ASTRA AGRO LESTARI PT (AALI IJ) BHINNEKA INVESTMENT GROUP PT Astra Agro Lestari Tbk operates
Third Quarter Results (ended December 31, 2013)
") Fiscal Year 213 (ending March 31, 214) Third Quarter Results (ended December 31, 213) Brother Industries, Ltd. February 4, 214 Information on this report, other than historical facts, refers to future
Fiscal Year 213 (ending March 31, 214) Third Quarter Results (ended December 31, 213) Brother Industries, Ltd. February 4, 214 Information on this report, other than historical facts, refers to future
Global Monthly February 2018
 Global Monthly February 18 3 1-year Treasury yields 1-year breakeven inflation rate 1 1 15 16 17 18 February 18 5 3 Global GDP growth Composite PMI (RHS) Index 56 5 5 1 5 1 13 1 15 16 17 18 3..5. 1.5 1.
Port Botany Trade Statistics Bulletin. 1 July April 2017
 Port Botany Trade Statistics Bulletin 1 July 2016 30 April 2017 YTD April 2017 Port Botany Container Trade Jul 2016 Aug 2016 Sep 2016 Oct 2016 Nov 2016 Dec 2016 Jan 2017 Feb 2017 Mar 2017 Apr 2017 Export
FY2018 Financial Results
 FY2018 Financial Results May 14, 2018 ISUZU MOTORS LIMITED 1 Copyright(C) 2018 Isuzu Motors Limited All rights reserved Contents Ⅰ. President and Representative Director : Masanori Katayama FY2018 and
Factory activity accelerated further in our region this month, posting its highest composite reading since 2011, said Wilkerson.
 FOR RELEASE Thursday, October 26, 17 EMBARGOED FOR A.M. CENTRAL TIME CONTACT: Pam Campbell 45-27-8617 Pam.Campbell@kc.frb.org TENTH DISTRICT MANUFACTURING ACTIVITY POSTS STRONG GROWTH Federal Reserve Bank
RIDERSHIP TRENDS. March 2017
 RIDERSHIP TRENDS March 2017 Prepared by the Division of Strategic Capital Planning May 2017 Table of Contents Executive Summary...1 Ridership...3 Estimated Passenger Trips by Line...3 Estimated Passenger
3Q 2016 Analyst Presentation
 3Q 2016 Analyst Presentation November 18, 2016 This presentation includes forward-looking statements. Actual future conditions (including economic conditions, energy demand, and energy supply) could differ
For personal use only Coal & Allied Industries Limited
 Coal & Allied Industries Limited Presentation to the Financial Community Half Year Results 30 June 2011 Bill Champion 29 July 2011 Mount Thorley Warkworth Mount Thorley Warkworth Mount Thorley Warkworth