Shady Grove. Station Access Improvement Study. Final Report July Washington Metropolitan Area Transit Authority
|
|
|
- Brett Hardy
- 5 years ago
- Views:
Transcription


1 Shady Grove Station Access Improvement Study Final Report July 2011 Washington Metropolitan Area Transit Authority
2
3 Acknowledgements Washington Metropolitan Area Transit Authority Station Area Planning and Asset Management Steven E. Goldin, Director Robin McElhenny-Smith, Manager of Station Area Planning Scott Peterson, Senior Transit Facilities Planner John Magarelli, Senior Civil Engineer Sara Benson P.E., Civil Engineer 600 5th Street NW Washington, DC 20001
4
5 Contents Executive Summary Existing Station Characteristics Future Station Characteristics Station Improvement Alternatives Evaluation of Alternatives ES-1 ES-2 ES-3 ES-4 ES-4 Introduction Planning Context Study Area Study Purpose Existing Station Characteristics Existing Station Area Land Use Existing Ridership Existing Station Facilities Existing Access Future Station Characteristics Shady Grove Sector Plan Future Transit Service Future Access Future Streetscape Station Capacity Analysis Ridership Projections Vertical Circulation Capacity Analysis Faregate Capacity Analysis Station Improvement Alternatives Vertical Circulation Capacity and Expansion Evaluation of Alternatives References 75 Contents i
6 List of Figures Figure ES-1: Shady Grove Station Area Figure ES-2: Shady Grove Station Today Figure ES-3: Shady Grove Station Area - Town Square Figure ES-4: Shady Grove Station Platform Figure 1: Shady Grove and Red Line Figure 2: Shady Grove Metrorail Station Figure 3: Site Plan with Property Boundary Figure 4: Existing Land Use Figure 5: Number of Daily Boardings by Mode of Access Figure 6: Platform Queueing Figure 7: Platform Escalator and Stairs Figure 8: Faregates and Fare Vending Machines Figure 9: Existing Conditions - Mezzanine Plan Figure 10: Existing Conditions - Partial Platform Plan Figure 11: West Side - Entrance Figure 12: East Side - Entrance Figure 13: Bike Racks Figure 14: Bus Route Map (East Side of Station) Figure 15: Bus Route Map (West Side of Station) Figure 16: King Farm Shuttle Bus Figure 17: Kiss & Ride - East Side Figure 18: Park & Ride - East Side Figure 19: Parking Garage - East Side Figure 20: Distribution of Parking by SmarTrip Data Figure 21: Existing Roadway Network Figure 22: Shady Grove Station - East and North Sides Figure 23: Shady Grove Metro Neighborhoods Figure 24: Shady Grove Future Land Use Figure 25: Shady Grove Station - Metro Boulevard Figure 26: Site Plan with Future Build-Out Figure 27: Route Bus Transit Service Map Figure 28: Route Bus Transit Service Map Figure 29: CCT Study Area Map Figure 30: Shady Grove Access Bike Plan Figure 31: Shady Grove Station Surface Parking Lots Figure 32: Shady Grove Station - Town Square ES-1 ES-2 ES-3 ES ii Contents
7 Figure 33: Station West Side - Metro West Neighborhood Figure 34: Shady Grove Station - East Side Figure 35: Station East Side - Metro North Neighborhood Figure 36: Insuffi cient Vertical Circulation Capacity Figure 37: Queuing on Platform during Peak Period Figure 38: Platform Clearance Time for Existing Condtiions Figure 39: Shady Grove Platform during Peak Period Figure 40: Platform Clearance Time for Future No-Build Condition Figure 41: Platform Clearance Time for Future Build Conditions Figure 42: Shady Grove Station Faregates Figure 43: Alternative 1A - Additional Vertical Circulation (Mezzanine Plan) Figure 44: Alternative 1A - Additional Vertical Circulation (Longitudinal Section) Figure 45: Alternative 1A - Additional Vertical Circulation (Partial Platform Plan) Figure 46: Alternative 1B - Additional Faregates (Mezzanine Plan) Figure 47: Alternative 2 - New Mezzanine (Mezzanine Plan) Figure 48: Alternative 2 - New Mezzanine (Partial Platform Plan) Figure 49: Alternative 2 - New Mezzanine (Partial Longitudinal Section) Figure 50: Alternative 3A - New Second Entrance (New Mezzanine Plan) Figure 51: Alternative 3A - New Second Entrance (Longitudinal Section) Figure 52: Alternatives 3A & 3B - New Entrance Pavilion (Plans and Elevations) Figure 53: Alternative 3B - New Second Entrance with LRT (Mezzanine Plan) Figure 54: Alternative 3B - New South Entrance with Grade Separated LRT (Cross Section) Figure 55: Alternative 3B - New South Entrance with Pedestrian Bridge Connecting to LRT (Cross Section) Figure 56: Alternative 3C - New Station Entrance Connecting to Redland Road (Partial Plan and Longitudinal Section) List of Tables Table ES-1: 2008 Average Daily Rail Boardings by Mode of Access Table ES-2: Evaluation for Improvement Alternatives Table 1: Average Weekday Ridership Table 2: Station Site Facilities Table 3: Bus Routes Serving Shady Grove Station Table 4: Future Kiss & Ride Capaicty and Space Allocation Table 5: Vertical Circulation Capacity Table 6: Faregate Capacity Analysis - Existing Conditions Table 7: Faregate Capacity Analysis Conditions Table 8: Summary of Vertical Circulation Table 9: Evaluation for Improvement Alternatives ES-3 ES Contents iii
8


9 Executive Summary Existing Station Characteristics Future Station Characteristics Station Capacity Analysis Evaluation of Alternatives Shady Grove Station Access Improvement Study
10

11 Executive Summary The Shady Grove Metrorail Station opened in 1984 as the terminus of the Red Line in Montgomery County, Maryland located just east of Frederick Avenue/Route 355. The Shady Grove Station has good access to I-270, provides one of the highest numbers of park-and-ride spaces in the entire Metrorail system and has numerous Metro and Ride On buses serving both regional and local riders. Ridership at this station is steadily increasing. As residential development continues to expand in northern Montgomery County, Frederick County and beyond, the station will continue to serve riders living in neighborhoods adjacent to the station as well as riders from as far away as West Virginia and Pennsylvania. Maryland s vision to increase mobility throughout the State includes transit and roadway improvements that help relieve the burden of congestion in the State s most heavily traveled corridors. The Maryland Department of Transportation (MDOT) has two projects underway in Montgomery County that would connect to the Shady Grove Station: the Intercounty Connector (ICC) and the I-270 Corridor Cities Transitway (CCT). The Shady Grove Station is considered an important transportation node in both of these projects and will continue to Figure ES-1: Shady Grove Station Area Source: WMATA GIS Executive Summary ES-1

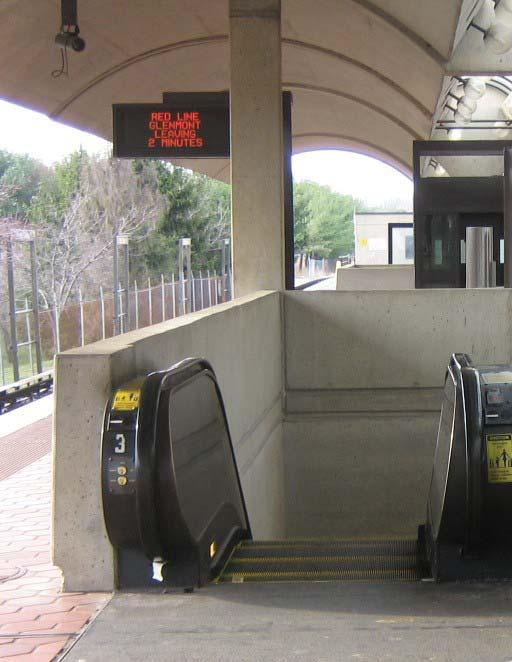
12 be a vital link in improving mobility in this area of Montgomery County. Planning Context The Shady Grove Sector Plan adopted in March 2006, defines the future development of the Shady Grove area and envisions transforming the area around the existing station into a lively mixed-use community. The Sector Plan provides the framework for this study with respect to land use, streetscape plan and urban design objectives around the station. This study aims to identify the access needs and capacity improvements required to respond to the vision for the Shady Grove Community seeking to make transit the mode of choice as development occurs. The scope of this study represents a narrow focus based on the development parameters established in the Sector Plan and does not consider access and capacity needs under alternative land use and development scenarios. Purpose Existing Station Characteristics The Shady Grove area can be characterized as a transit hub, an industrial center and home to 2,600 households. The Shady Grove Station is located in a suburban area with industrial uses and strip shopping centers. Established residential communities are located to the east and higher density residential development is to the west. The station has a single entrance at the north end of the platform with a center platform and a single mezzanine that can be accessed from both the east and west. There are two escalators, one stairway and one elevator from the mezzanine to the platform, and nine faregates two of which are ADA accessible. Metrobus and Ride On provide significant bus service at the Shady Grove Station with 1,365 bus trips per weekday. The station has only the minimal vertical transportation system elements between the mezzanine and the platform resulting in crowding on the platform, particularly during the PM peak period. From field observations, the faregates are currently operating at an acceptable level-of-service. The faregates have an acceptable flow rate in the PM peak period because queuing occurs on the platform with passengers waiting to board the escalator not at the mezzanine level. Ridership at the Shady Grove Station has increased nearly 50% in the last 10 years. The station carried an average of approximately 29,100 passengers per weekday in 2009, with roughly 14,800 boardings and 14,300 alightings. Ridership is greatest in the AM and PM peak periods demonstrating that the station is primarily used for commuting The purpose of this study is to identify and evaluate options to improve station access and to evalute the feasibility for a second station entrance to serve existing and future demand. These improvements must serve the needs of both long distance commuters and those who live close, be compatible with the vision established in the Sector Plan and accommodate the transit service plans under consideration in the CCT and ICC corridor projects. This study will provide Metro, MDOT and Montgomery County with a baseline of the existing and future infrastructure needs at the Shady Grove Station and identify capital improvements required to support existing and future demand at the station. Figure ES-2: Shady Grove Station Today Source: Shady Grove Sector Plan (March 2006) ES-2 Executive Summary
13 purposes, with the highest number of boardings occurring during the morning peak when riders are traveling to work and the highest number of alightings occurring during the evening peak when riders are traveling home. Table ES-1: 2008 Average Daily Rail Boardings by Mode of Access Access Mode Walk Bus Drop Offs Drove/ Parked Other (Bike, Taxi) Totals Mode Share (%) 4% 32% 12% 51% 1% 100% Boardings by Mode 578 4,621 1,733 7, ,441 According to Metro s 2007 Passenger Survye, 51% of passengers boarding a train at the Shady Grove drove to the station and parked, 32% rode a bus, 12% were dropped off, 4% walked and 1% carpooled, rode a bike or took a taxi. As an end-of-line station, driving and parking represents a high mode of access at Shady Grove which is expected to continue in the future (Table ES-1). However, as more mixed used development occurs in the Shady Grove area along with enhanced bus service and improved pedestrian and bike access, the percentages for non-auto mode access are expected to increase. Future Station Characteristics The Sector Plan envisions Shady Grove as a mixed-use community with a residential focus supported by commercial and community serving retail uses at the station, with a technology corridor along Shady Grove Road to the north, and a buffer area of parks, schools and other public institutions to the east between the station area and the established residential community of Derwood. Between 2000 and 2030, 6,340 new households and 7,000 new jobs are projected in the Sector Plan area representing roughly an increase of 240% and 50%, respectively. Ridership projections developed in the 2008 WMATA Station Access and Capacity Study show that ridership at the Shady Grove Station will increase to approximately 40,000 in the year 2030, a 45% increase in ridership over the next 20 years. Metro owns approximately 60 acres with development potential at Shady Grove. In the future, Metro in partnership with Montgomery County and the State will advance development under the Metro joint development program. Metro s joint development goals include creating transit oriented development (TOD) at Metro stations that are walkable, mixed used communities which integrate transit facilities and provide mobility options to reduce auto dependency. These goals are largely consistent with the vision identified in the Sector Plan. Implementing the Sector Plan will require redevelopment of Metro s property, including reconfiguring Metro s bus, Kiss & Ride and parking facilities. Any reconfiguration of Metro s transit and station access facilities would occur as part of Metro s future joint development and would need close coordination to ensure that Metro s operational requirements for bus service, Kiss & Ride, parking facilities, pedestrian, and bicycle access are met. Additional capacity at the station will be needed to accommodate the new riders generated from the new development identified in the Sector Plan. Figure ES-3: Shady Grove Station Area - Town Square Source: Shady Grove Sector Plan (March 2006) Executive Summary ES-3

14 Station Capacity Analysis Section 4, Station Capacity Analysis, provides a detailed analysis of both the vertical transportation and faregate systems for the existing and future demand. A summary of this analysis is provided below. Vertical Circulation Observations of existing vertical circulation show excessive passenger queuing at the platform level during the PM peak hours. The vertical circulation analysis was conducted and involved assessing the existing capacity and demand for the escalators, determining the volume to capacity (v/c) ratio and corresponding Level of Service (LOS). Trains arriving in the peak direction generate the largest surge of passengers accessing the escalators, so the highest number of passengers unloading in the peak 15-minute period was used to calculate the escalator volume to capacity (v/c) ratio. The analysis based on the existing ridership showed the v/c ratio to be 0.63; corresponding to a LOS D, which represents significant restrictions in circulation. At least one additional escalator and stairway should be added to meet the existing demand. An analysis of the future no-build and two-build conditions was conducted. The two future build conditions included: (1) adding one escalator/stair array between the existing mezzanine and platform, and (2) adding a new south entrance mezzanine. The v/c ratio for the no-build conditions was shown to be 0.75 which also corresponds to LOS D. The v/c ratios for both build conditions were shown to be 0.50; corresponding LOS would be C, which represents some restriction to circulation during the peak period. To further reduce crowding for the future demand two escalators and one-stair could be added between the platform and mezzanine rather than one escalator and one stairway. A second platform elevator should also be added to the existing entrance to guarantee continuous accessibility to the station platform for customers using wheelchairs during periods of service disruptions for repair and maintenance. Faregates There are nine faregates and one ADA accessible faregate at the existing entrance. From field observations, faregates are operating at an acceptable LOS. The average queuing time is less than 15 seconds. However, during afternoon peak hours, the passenger arrival rates at the faregate area are constrained by the capacity of the vertical transportation system. An analysis for calculating the minimum number of faregates was conducted based on: (1) the existing ridership using the unconstrained arrival rates at the faregate area, and (2) future ridership at the existing entrance. The analysis showed that a minimum of eight faregates are required to handle existing demand and nine faregates are required for the future demand. Therefore, the existing nine faregates at the existing entrance are sufficient to handle the projected demands and no additional faregates are required. If a second south entrance were built the ridership demand would be split between the existing entrance and the new entrance reducing the demand at the existing entrance. WMATA s Standard and Criteria mandate a minimum of four faregates in an array, one being ADA accessible. Therefore, a new south entrance would be required to have four faregates which would be sufficient to handle the projected demand. Figure ES-4: Shady Grove Station Platform The capacity analysis does not take into account the future Corridor Cities Transitway (CCT) ridership. According to the CCT ridership analysis, there would be 9,480 passengers transferring from the CCT BRT service and 10,830 passengers transferring from the LRT CCT service to Metrorail during the AM peak period. This additional ES-4 Executive Summary
15 Table ES-2: Evaluation for Improvement Alternatives Evaluation Criteria 1A - Additional Vertical Circulation 1B - Additional Faregates 2 - Additional Vertical Circulation and Faregates 3A - Second Entrance East Side 3B - Second Entrances East & West Sides 3C - Second Entrance to Redland Road Increase convenience of Metrorail Yes Somewhat Yes Yes Yes Somewhat Increase Metrorail Riders No No No Yes Yes Somewhat Increase Pedestrian Safety Yes No Yes Yes Yes Yes Increase Attractiveness to Developers and Residents Somewhat No Somewhat Yes Yes Somewhat Decrease Emergency Evaculation Time Somewhat No Yes Yes Yes Yes Estimated Project Cost FY10$(M)* * Estimates include construction, planning, engineering, construction management, and administrative costs and are considered order of magnitude in scale for planning purposes only. Estimates originally in FY08$ have been escalated to FY10$ using a 4% escalation factor. demand would contribute further to the capacity issues at the station and would reinforce the need for additional vertical transportation and potentially additional faregates. Station Improvment Alternatives Alternatives were developed for increasing station capacity representing different levels of capital investments in order to accommodate projected growth in ridership at the Shady Grove Station. These alternatives range from providing additional vertical circulation at the existing station entrance to providing a second entrance to the south. Improvement 1 adds vertical circulation and faregates at the existing mezzanine entrance to accommodate passenger arrivals during the PM peak. 1A adds vertical circulation between the mezzanine and platform including an escalator/ stair array and a new elevator. 1B relocates the existing kiosk to provide space for additional faregates at the existing faregate array. Improvement 2 is a new mezzanine entrance located directly north of the existing kiosk that adds faregates and vertical circulation between the mezzanine and platform including an escalator/ stair array and a new elevator.. Improvement 3 is a second entrance at the south end of the station platform. Three sub-alternatives are provided, one that connects to the east side of the station (3A), one that connects to both the east side of the station and to a potential LRT platform west of the station (3B) and one that connects to Redland Road (3C). All alternatives would be accessible from the street level via elevators, escalators and stairs. Evaluation of Alternatives The alternatives were analyzed to assess future station capacity according to Metro standards and capacity criteria. The current station infrastructure is constrained in its ability to handle the existing passenger loads and additional vertical circulation would improve the platform congestion significantly. The addition of a new entrance to the south would further improve the station carrying capacity, improve the egress of the station and expand the capture area for walkers. Table ES-2 compares the potential improvements with respect to evaluation criteria derived from study goals. Evaluation criteria are reported on a relative scale and are meant for qualitative purposes only. Overall Improvement 1 would increase capacity at the existing mezzanine entrance. Improvement 1A would extend the existing mezzanine to the south to add new vertical circulation. Improvement 1B would add new faregates to the existing faregate array. Improvement 2 would increase capacity and provide a new access point by extending the existing mezzanine to the north to add vertical circulation and faregates. Improvement 1 (1A and 1B) and 2 provide similar benefits. Improvement 1A costs more than Improvement 2 due to the need to relocate existing service rooms to make space for adding the vertical circulation. Improvement 3 would increase capacity at the station by adding a Executive Summary ES-5
16 new station entrance to the south of the existing entrance. While Improvements 3A, 3B and 3C are the more costly, these improvements would provide more access points and relieve the demand at the existing entrance. They could also generate an increase in Metro riders, primarily due to the expanded capture area for walkers. All three would decrease emergency evacuation time from the station because they provide another exit point. The new access points for Improvements 3A and 3B connect to the proposed new development to the east and west and the access point for Improvement 3C connects to the Redland Road Bridge to the south. Summary There are capacity issues today at the Shady Grove Station based on existing demand and ridership growth is expected to continue straining the capacity at the station. Additional vertical circulation is needed to address this crowding. This study provides alternatives requiring different levels of capital investment for increasing capacity within the Shady Grove Station. Improving access to the Shady Grove Station is a critical component of implementing the Sector Plan recommendations. In general, the access improvements identified in the Sector Plan meet Metro s operational needs for pedestrian, bicycle, bus, Kiss & Ride, and parking. As development occurs the access improvements will be further refined to ensure that sufficient space is available for Metro s transit operations. The access study is based on the development footprint recommended in the adopted Sector Plans. Access alternatives based on other development scenarios have not been considered. ES-6 Executive Summary
17 Executive Summary ES-7

18


19 Introduction Planning Context Study Area Study Purpose Shady Grove Station Access Improvement Study Section 1
20 Draft Report Shady Grove Station Access Improvment Study

21 Introduction The Shady Grove Metrorail Station opened in 1984 as the terminus of the Red Line in Montgomery County, Maryland located just east of Frederick Avenue/Route 355. The Shady Grove area can be characterized as a transit hub, an industrial center and home to 2,600 households. The Shady Grove Station has good access to I-270, provides one of the highest numbers of park-and-ride spaces in the entire Metrorail system and has numerous Metro and Ride On buses serving both regional and local riders. Ridership at this station is steadily increasing. As residential development continues to expand in northern Montgomery County, Frederick County and beyond, the station will continue to serve riders living in neighborhoods adjacent to the station as well as riders from as far away as West Virginia and Pennsylvania. Maryland s vision to increase mobility Figure 1: Shady Grove and Red Line Source: WMATA throughout the State includes transit and roadway improvements that help relieve the burden of congestion in the State s most heavily traveled corridors. The Maryland Department of Transportation (MDOT) has two projects underway in Montgomery County that would connect to the Shady Grove Station: the Intercounty Connector (ICC) and the I-270 Corridor Cities Transitway (CCT). The Shady Figure 2: Shady Grove Metrorail Station Section 1 1
22 Final Report Grove Station is considered an important transportation node in both of these projects and will continue to be a vital link in improving mobility in this area of Montgomery County. Planning Context The Shady Grove Sector Plan adopted in March 2006 defines the future development in the Shady Grove area and envisions transforming the area around the Shady Grove Metro Station into a lively mixed-use community. The Sector Plan provides the framework for this study with respect to land use, streetscape plan and urban design objectives around the station. This study aims to identify the access needs and capacity improvements required to respond to the vision for the Shady Grove community seeking to make transit the mode of choice as development occurs. The station access and capacity improvements made at the Shady Grove Station must serve the future needs of both long distance commuters and those who live close, be compatible with the vision established in the Sector Plan, and integrate the transit service plans under consideration in the CCT and ICC corridor projects. Study Area The study area consists of the Shady Grove Metrorail Station including the east and west bus, Kiss & Ride and parking facilities, access roads, and pedestrian and bicycle access within 1-mile of the station. (Refer to Figure 3 Site Plan with Property Boundary). Study Purpose The purpose of this study is to identify and evaluate options that will improve station accessibility and to evaluate the feasibility for a second station entrance to serve existing and future demand. In general, improving access to Metro is critical to meeting ridership goals and serving customer needs. Potential riders may be lost if access constraints mean the door-to-door journey involving Metro becomes more time consuming, unreliable or frustrating than an alternate means of travel. This study will provide Metro, MDOT and Montgomery County Figure 3: Site Plan with Property Boundary Source: Montgomery County GIS 2 Section 1
23 with a baseline of the existing and future infrastructure needs at the Shady Grove Station and identify capital improvements needed to support existing and future demand as well as future joint development at the station including: Identifying existing station access deficiencies and capacity constraints. Identifying Metro s future access needs to support the Sector Plan. Developing conceptual plans to increase the capacity of the station and maximize convenience for Metro riders. Refining the station access improvements identified in the Sector Plan to ensure compliance with Metro requirements. The scope represents a narrow focus based on the development parameters established in the Sector Plan and does not consider access and capacity needs under alternative land use and development scenarios. Section 1 3

24


25 Existing Station Characteristics Existing Station Area Land Use Existing Ridership Existing Station Facilities Existing Access Shady Grove Station Access Improvement Study Section 2
26 Draft Report Shady Grove Station Access Improvment Study 6 Section 2
27 Existing Station Characteristics The Shady Grove station is located on the Red Line in Rockville, Maryland. The station has a single entrance at the north end of the platform. Existing Station Area Land Use Shady Grove is a transportation hub with a network of roadways, the CSX rail line and the Shady Grove Station. The Shady Grove Station area is surrounded by light industrial land uses including the County Service Park, the Vehicle Emissions Inspection facility, and various industrial businesses. Along Frederick Avenue/ MD 355, there is a mix of commercial retail development including car dealerships, gas stations, fast food service, and auto repair businesses. Located to the northwest of the station are the Metro maintenance and rail yard and Montgomery County s Solid Waste Transfer Station. The established residential Derwood Community is located to the east and southeast and has 2,600 dwelling units: 58% singlefamily residences, 32% townhouses and 10% multi-family units. Newer development includes King Farm, a 430-acre mixed-use development, located west of Frederick Avenue/ MD 355 which opened in This development added 3,200 dwelling units to the area, significantly increasing housing in the surrounding area. Existing Ridership The Shady Grove station served an average of approximately 29,100 passengers per weekday in 2009, with approximately 14,800 boardings and 14,100 alightings. This represents nearly a 50 percent ridership increase in the last 10 years. Compared to other stations along the Red Line in Montgomery County, Shady Grove has a high number of boarding Metrorail passengers. Ridership data shows that 29% of the daily station entries and 5% of the daily exits occur in the AM peak hour and 26% of the daily exits and 5% of the daily entries occur during the PM peak hour. This high percentage of AM entries and PM exits shows that Shady Grove is primarily a commuter station. According to Metro s 2007 Metrorail Passenger Survey, approximately 51% of passengers boarding a train at Shady Grove drove to the station and parked, 32% rode a bus, 12% were dropped off, 4% walked and 1% carpooled, rode a bike or took a taxi. As an end-of-the line station driving and parking represents a high mode Table 1: Average Weekday Ridership Time Period Entry Exit AM Peak 10, AM Off-Peak 2,726 1,415 PM Peak 1,545 8,457 PM Off-Peak 428 3,688 Total 14,782 14,348 Section 2 7
 8 Section")
28 Figure 4: Existing Land Use Source: Shady Grove Sector Plan (March 2006) 8 Section 2
 Figure 6: Platform Queueing 12% Figure 5: Number of Daily Boardings by Mode of Access Source: WMATA Metrorail Passenger Survey, 2007 of access at Shady Gorve which is expected to continue.")

29 1% 4% Walk 51% 32% Bus Drop Offs Drove and Parked Other (Bike, Taxi etc.) Figure 6: Platform Queueing 12% Figure 5: Number of Daily Boardings by Mode of Access Source: WMATA Metrorail Passenger Survey, 2007 of access at Shady Gorve which is expected to continue.as more mixeduse development occurs at the Shady Grove Station along with enhanced bus service and improved pedestrian and bicycle access to existing communities, the percentages for non-auto mode access are expected to increase. Existing Station Facilities The Shady Grove Station is built on a roadway embankment and has a center platform and a single mezzanine located below the platform and tracks. The station can be accessed from both the east and west (Figures 9 and 10). Passengers enter the station at-grade from the east and walk through a pedestrian passageway that crosses under the railroad tracks to reach the mezzanine. Passengers enter the station from the west via an escalator/ stair array or elevator that connects the pedestrian passageway to the buses, Kiss & Ride and parking. The MARC and Amtrak trains run on tracks just east of the Metrorail tracks between the station, bus, Kiss & Ride and parking facilities on the east. Internal Station Circulation The following facilities are located within the station: Vertical circulation from station mezzanine to platform o Two escalators o One set of stairs o One elevator Vertical circulation to station mezzanine from the west o One escalator o One set of stairs o One elevator Nine faregates (two ADA accessible) Nine fare machines Two exit fare machines Three SmarTrip vending machines Currently, there is crowding on the platform particularly during the PM peak period with passengers waiting to board the escalators. The faregates are currently operating at an acceptable level of service with an average queue time of less than 15 seconds. However, in the afternoon peak periods passenger arrival rates at the faregates Figure 7: Platform Escalator and Stairs Figure 8: Faregates and Fare Vending Machines are constrained by the capacity of the platform escalators. Faregates have acceptable flow rates because the queuing occurs on the platform. Station Site Facilities The site facilities extend to the east and west of the station and include bus bays, Kiss & Ride facilities, parking, taxi stands, bike racks and lockers, and pedestrian connections. Table 2 show the station site facilities. On the west side there is a one-way bus loop with Kiss & Ride, short-term and long-term parking, and a taxi stand Section 2 9
30 Figure 9: Existng Conditions - Mezzanine Plan (NTS) 10 Section 2
31 Figure 10: Existing Conditions - Partial Platform Plan (NTS) Section 2 11


32 located in the center of the loop. The bus bays are located on the loop road near the station entrance. Motorcycle parking is located to the north just beyond the bus bays. Bicycle racks and lockers are located on the plaza area near the bus bays. Shuttle bus activity occurs on the loop road near the motorcycle parking. Both bus and vehicular traffic exit the facility using the one-way loop. These facilities are accessed from either Somerville Drive or directly from Frederick Avenue/ MD 355 via the Metro Access Road. On the east side there is a one-way bus loop with the Kiss & Ride, short-term parking and the taxi stands located in the center of the loop. Bus bays are located on the north side of the loop road. Bicycle facilities are located on the plaza area near the station entrance. Motorcycle parking is located near the loop road entry and exit. Bus and vehicular traffic mix on exiting the facility. Bus layover occurs on the south side of the loop. However, with the ICC opening in early 2011, there are plans to increase express bus service serving the Shady Grove station requiring two additional bus bays to be located where the current layover occurs. Adjustments to the layover location will be needed. Parking is located in two surface lots and two parking garages. Entry and exit into the parking facilities is via the I-370 spur from the north and via Redland Road from the south. Figure 11: West Side - Entrance Figure 12: East Side - Entrance Table 2: Station Site Facilities Facility Bus Bays West Side 3 bus bays with shelter and bench; 1 layover space (MetroBus and Ride On service) Descriptions East Side 6 bus bays with shelter and bench; 3 layover spaces (Ride On service) Kiss and Ride - short term parking 40 spaces 36 spaces and 10 driver attended spaces Park and Ride 922 spaces 4,823 spaces located in 2 parking garages and 2 surface lots Taxi Stand 7 curbside spaces 8 curbside spaces Motorcycle 15 spaces 15 spaces Bicycle Racks/Lockers 16 racks/36 lockers 16 racks/24 lockers 12 Section 2
.")
33 Existing Access Pedestrian and Bicycle Access Pedestrian access was examined through a visual assessment around the entire station site. Overall pedestrian access to the station is limited which is reflected in the low walk access mode share for transit (4%). There is little pedestrian traffic from the east which is not surprising given the existing roadway network, moderate distances to the surrounding Derwood neighborhoods and limited sidewalk connections. From the west, pedestrian activity is increasing as a result of the recently built King Farm mixed-use development across Frederick Avenue/ MD Route 355 from the station. Access from King Farm is direct with unfragmented sidewalks, and crosswalks with pedestrian countdowns signals located at the intersection of Frederick Avenue/MD Route 355, King Farm Boulevard and the Metro Access Road, and also at the intersection of MD 355/ Frederick Avenue and Redland Road. There currently are no dedicated bicycle trails or lanes connecting the station to the surrounding area. Cyclists must ride in vehicle travel lanes or share sidewalks with pedestrians. Montgomery County has development plans for a bicycle trail along the east side of the I-370 spur connecting Shady Grove Road to the station. There are a total of 60 bicycle lockers at the Shady Grove station, 41 of which are utilized. Of the 24 lockers at the east entrance 23 are utilized and of the 36 lockers at the west entrance 18 are utilized. Given that there are more residential developments east of the station it is understandable that the utilization is higher at the east entrance. There are 16 bicycle racks at the east entrance with 32 bike spaces, 16 of which were used Figure 13: Bike Racks during our site survey. The bike racks have been replaced with inverted U racks and are in good condition. Table 3: Bus Routes Serving Shady Grove Station Routes Peak Hour Headways (Minutes) Peak Hour Departures Station Bus Service A high percentage of passengers arrive at the station by bus. While a large percentage of these riders are transferring to Metrorail a significant number of passengers are transferring to another bus. Metrobus, Ride On and MTA operate 24 bus routes and provide 1,365 weekday trips at the Shady Grove station. Currently there are approximately 6,800 passenger boardings and 6,600 passenger Bus Stop Type (and Direction) Bus Bay Assignments/ Capacity East Side Ride-On Start/Terminus A 150% Ride-On Start/Terminus A 150% MTA Thru NB and SB A 150% Ride-On Start/Terminus B 67% Ride-On Start/Terminus B 67% Ride-On Start/Terminus C 150% Ride-On Start/Terminus C 150% Ride-On Start/Terminus C 150% Ride-On Start/Terminus D 167% Ride-On Start/Terminus D 167% Ride-On Start/Terminus D 167% Ride-On Start/Terminus E 200% Ride-On Start/Terminus F 117% Ride-On Start/Terminus F 117% Ride-On Start/Terminus F 117% MTA Thru NB and SB G 33% MTA Thru NB and SB G 33% West Side Ride-On Start/Terminus A 200% Ride-On Start/Terminus A 200% Ride-On Start/Terminus A 200% Ride-On Start/Terminus A 200% Ride-On Start/Terminus A 200% Ride-On Start/Terminus B 183% Ride-On Thru NB and SB B 183% Ride-On Thru NB and SB B 183% Metrobus Q1, Q2, Q5, and Q Start/Terminus C 100% Section 2 13
34 Figure 14: Bus Route Map (East Side of Station) Final Report 14 Section 2
35 Figure 15: Bus Route Map (West Side of Station) Final Report Section 2 15


36 alightings the Ride On buses, and 976 passenger boardings and 920 passenger alightings on the Metro Q1, Q2, Q5 and Q6 bus at the Shady Grove Station. Overall Ride On has experienced a yearly ridership growth of approximately 7% per year in recent years. Metrobus has experienced a yearly ridership growth approaching 4% on the Q2 over the past five years. This rate of growth is expected to continue. Metro implemented bus service changes to the Q2 Route in 2009 which involved breaking the Q2 into five separate routes, with four of the routes, Q1, Q2, Q5, and Q6, servicing the Shady Grove Station. Figures 14 and 15 show the Metrobus, Ride On and MTA bus routes serving the Shady Grove Station. The bus facilities on the east side have eight bus bays serving 13 Ride On and three MTA bus routes. The bus facilities on the west side have three bus bays serving seven Ride- On and one Metrobus bus routes. The bus bays are near capacity and additional bus bays will be required in the future to accommodate growth in bus service. Two MTA routes were Figure 16: King Farm Shuttle Bus recently added to accommodate express buses operating on the ICC. Bus shuttles also serve the Shady Grove Station including the King Farm shuttle as well as several other smaller shuttles. The King Farm shuttle operates on 20-minute headways Monday through Friday and serves the Shady Grove Station. Passengers board and alight on the west side of the station along the curb. There is no designated bus bay for the King Farm shuttle service or any other smaller shuttle. Kiss and Ride Access The existing Kiss & Ride facilities are located on both the east and west sides of the station. There is significant activity during the PM peak period particularly on the east side. There are 40-metered spaces on the east side. Entry and exit into the Kiss and Ride facility is via the I-370 spur for access from the north and from Redland Road for access from the south. One shelter Figure 17: Kiss & Ride - East Side is available on the east side for waiting passengers. During the PM peak period approximately 250 passengers exiting the station are going to the K&R area. Based on field observations, upwards of vehicles wait in a queue to pick up these arriving passengers rather than parking in the short-term spaces. This creates a very congested area during peak periods particularly where the vehicles merge at the Kiss and Ride exit and then merge with the buses on the loop road. On the west side, there are 14-metered spaces. Entry and exit into the Kiss & Ride facility is from Redland Road and Sommerville Drive or directly from Frederick Avenue/MD 355 and the Metro Access Road. There are 22, 12-hour metered spaces along the Metro Access Road, which fill by 8:30 AM with occasional vacancies throughout the day. The metered spaces in the Kiss & Ride lots are restricted to 7-hours maximum and fill between 9-9:15 AM. While the majority of the Kiss & Ride activity is on the east side, vehicles also queue informally in the westside Kiss & Ride lot in the PM peak to wait for arriving passengers. Park & Ride Access The existing parking lots are located on both the east and west sides of the station. On the east, there are two parking garages and two surface parking lots with a total of 4,823 spaces. The north garage and surface lot (No.1) fill between 7:45-8:00 AM. The south garage and surface lot (No. 2) fill between 8:30-8:45 AM. Entry into and exit outof the parking facilities is from the I-370 spur for access from the north and from Redland Road for access from the south. The west surface lot (No. 3) provides 922 surface parking spaces and fills between 7:30-7:45 AM. Access to this lot is from Redland Road via Sommerville Drive or directly from Frederick Avenue/MD 355 and the Metro Access Road. Pedestrian access to the surface lot is well marked with crosswalks and vehicles wre observed yielding to pedestrians. However, pedestrians must cross the bus loop road and the Kiss & Ride lot to reach their vehicle. Once in the parking lot, there are no curb cuts. Those with strollers or luggage must navigate around the edge of the parking lot Figure 18: Park & Ride - East Side 16 Section 2


37 to reach their car or negotiate the curbs between the parking aisles. No conflicts within the surface lots or parking garages were noted, other than capacity shortage and some queuing to exit the parking lots during PM peak hours. There are good direct pedestrian connections to the parking garages on the east side and no conflicts were noted between people cutting through the Kiss & Ride or bus areas Figure 19: Parking Garage - East Side Figure 20: Distribution of Parking by SmarTrip Data Source: WMATA 2011 Section 2 17

38 to access the garages or surface lots. Figure 20 shows the distribution of people who park at the Shady Grove station by Smartrip data. While a significant number of people parking come from within 3 miles of the station the majority come from farther distances. External Station Access The Shady Grove Station has good vehicular access due to close proximity to I-370, Shady Grove Road, Frederick Avenue/MD Route 355, Crabbs Branch Way and Redland Road. However, traffic is congested along many of the roadways during peak periods and the limited crossings of the CSX tracks constrain local access and overall mobility in the Shady Grove area. The existing roadway network includes: I-370 is a 3-mile spur off of I-270 and Sam Eig Highway that provides access to the east parking lots directly connecting to the north and south parking facilities as well as to the Kiss & Ride and short-term parking facilities at the Shady Grove Station. I-370 will become part of the ICC that will connect to I-95 in Laurel. MD 355/Frederick Avenue runs from Friendship Heights to Clarksburg, Maryland. In the Shady Grove area this six-lane roadway, Frederick Avenue, is considered an urban boulevard with a divided median and enhanced streetscape emphasizing pedestrian safety and access. Frederick Avenue provides access from the north and south into the bus, Park & Ride and Kiss & Ride facilities on the west side of the station. Crabbs Branch Way is a significant travel route between Gude Drive and Shady Grove Road providing access to residential neighborhoods, the Metro Station and the County Service Park. Shady Grove Road is a major traffic route through the Shady Grove area connecting I-270 and I-370. Shady Grove Road connects to the station via Crabbs Branch Way. Redland Road runs east to west connecting Muncaster Mill Road and Frederick Avenue/MD 355 south of the Shady Grove Station. Redland Road is a four-lane roadway between Crabbs Branch Way and Frederick Avenue/ MD 355 and two-lane roadway between Crabbs Brach Way and Muncaster Mill Road. Redland Road provides access to the parking facilities located both to the east and west sides of the Shady Grove Station. On the west side of the station access is provided via the two-lane Sommerville Road. The Metro Access Road provides access directly from Frederick Avenue/MD 355 to the Metro Park & Ride surface lot and Kiss & Ride on the west side of the Shady Grove Station. It is a two-lane roadway with parking on both sides. Figure 21: Existing Roadway Network Source: Shady Grove Sector Plan (March 2006) 18 Section 2
39 Section 2 19
40


41 Future Station Characteristics Shady Grove Sector Plan Future Transit Service Future Access Future Streetscape Shady Grove Station Access Improvement Study Section 3
42 Draft Report Shady Grove Station Access Improvment Study 22 Section 3

43 Future Station Characteristics Shady Grove Sector Plan The Shady Grove Sector Plan establishes the vision and framework for development in the Shady Grove area over the next 25 years. The plan envisions Shady Grove as a mixeduse community with a residential focus supported by commercial and community serving retail uses at the station, a technology corridor along Shady Grove Road to the north, and a buffer area of parks, schools and other public institutions to the east between the station area and the established residential community of Derwood. The intent is to redevelop properties around the station to create a series of neighborhoods, envisioned as urban villages, that provide a vibrant sense of place with a distinct identity, a mix of uses, open spaces, and a pedestrian-friendly environment that link to the station. These Metro Neighborhoods, as the Sector Plan identifies them, include: Metro West, Metro South, Metro North and Metro East/Old Derwood (Figure 23). Transportation is an important component of the station area today. The Sector Plan recommends that the Shady Grove Station be redeveloped as an efficient and attractive transit center, connecting to communities with improved pedestrian and bicycle access, and increased transit service to reduce future traffic congestion while also serving as a regional transportation hub. Key objectives include improving mobility and increasing transit ridership within the context of a pedestrian friendly environment. The Sector Plan envisions significant increase in transit ridership due in large part to the household and employment Figure 22: Shady Grove Station - East and North Side Source: Shady Grove Sector Plan (March 2006) Section 3 23
 24")
44 Figure 23: Shady Grove Metro Neighborhoods Source: Shady Grove Sector Plan (March 2006) 24 Section 3

45 Figure 24: Shady Grove Future Land Use Source: MNCPPC Section 3 25

46 growth in the station area. The plan includes a 35% transit ridership goal for the new residential development and has identified the following strategies to help achieve this goal: Maintain bus priority treatments, including consideration of an exclusive bus lane. Provide car sharing and rental car program in station area. Increase satellite Park & Ride lots at appropriate locations served by bus to encourage Metro access via transit. Provide additional Metro parking if parking does not negatively affect housing opportunities or intersection congestion. Increase Metrorail service frequency including the elimination of the turnback at the Grosvenor Station. Build a new in-fill Metrorail station near the Montgomery College Rockville Campus. Incorporate a transit store in the station area to coordinate transit services and promote transit use. Planning Context Metro has a Joint Development program to promote and implement transit-oriented development (TOD) at Metro stations to create vibrant mixed-use developments to attract new riders, create a source of revenue and help local jurisdictions capture value of the transit investment. The Joint Development program adheres to smart growth principles including: Create vibrant mixed use communities Reduce auto dependency Figure 25: Shady Grove Station - Metro Boulevard Source: Shady Grove Sector Plan (March 2006) Increase pedestrian/bicycle oriented transit trips Foster safe station areas Enhance surrounding area connections to transit stations, including bus access Provide opportunities to obtain goods and services near transit stations Offer active mixed use public space Metro s Joint Development goals are consistent with recommendations included in the Sector Plan. The Sector Plan recommendations for Metro owned property at Shady Grove include redevelopment and reconfiguration of access facilities that would occur as part of a future joint development. Design Parameters The existing bus, Kiss & Ride and Park & Ride facilities on both sides of the Shady Grove station would need to be reconfigured as part of redevelopment in the station area to create the mixeduse residential community envisioned in the Sector Plan. The specific recommendations in the Sector Plan are: Increase the number of bus bays serving the Metro station in coordination with WMATA s required program needs. Redesign access to bus facilities on both sides of the Shady Grove Station to minimize walking distances, ensure pedestrian safety and minimize conflicts between vehicles and pedestrians. Provide Kiss & Ride facilities on the east side of the station in garages to provide shelter and avoid conflicts with the bus facilities. On the west side, integrate the Kiss & Ride facilities with the bus facility. Expand and improve the pedestrian connection between the east and the west side of the station. Replace the existing Metro surface parking with new multilevel parking garages in locations that minimize walking distance to Metro and mitigate rail noise. Metro s number one priority is to ensure that the transit operations 26 Section 3
47 Figure 26: Site Plan with Future Build-Out Adapted from Approved Shady Grove Sector Plan Section 3 27
48 Old Old czog nine 29 1 Stony Run Old Stoney Run 29 1 Carina Baltimore-Washington Parkway UV 170 Baltimore-Washington Parkway Engstrom Tower Erskine Tower Caine Canine Emory Canine Caine Caine Wray chr Johnson Emory Creed Hall Co 1 Fort George Meade Wenger ane Kel Samford ley Baker Ames Chesney Science 295 West Meade Elementary School Antolak Defranzo Madden Love Nelson O lson 29th Division Peden Van Noy Perimeter Carr Ray 175 Sheridan Thorne Power Terry Childrens World Learning CTR Love 175 Boyce Will Young Rockenbach Galt 100 Grant 100 Barry High Pershing Hill Elementary SCH Fort Meade Golf Course Sargent Ellis Cayer land Mills Scott Dodd Kenyo n Cain Simmonds Sidman Mackall Muir Dutt 27th Gordon UV 170 York Elm Wise Andover MacArthur Middle School Hodges Warren Baltimore-Washington Intl Warren a Broad F ry Ninninger Shea Bian chi Ruffner Foot r Bundy Burr Reece Curtis Cargo Ernie Pyle Chatillon Pike Leyte Gard e Endl Red Cloud Manor View Elementary School Inchon Fairmount Main 23rd Olive Okane North Andover Park Lyman 295 MeadeHighSchool B Upton Mckay Wright Doyle 22nd 21st Long Fernandez Rose ner Burba Lake Parsons Buck Rock th th Wilson Clark H 19th 18th B G Morrison I Y H 17th St 20 1/ th 4 1/2 Z Chisolm 20th 5th 13th Mapes I 15th 9th Fox 1 2th 10th 4th Huber Walker 6th 5 1/2 3rd Final Report function well, now and in the future. Design parameters for station and site facilities including transit, pedestrian and bicycle facilities, parking and Kiss & Ride facilities were established to guide future planning efforts for joint development at the Shady Grove station. Future Transit Service Bus Service The Shady Grove station has significant bus service with plans for expanded service in the future to enhance crosscounty connections. It is also a terminal station for a majority of the bus routes serving the station, resulting in longer dwell times for bus layovers. Bus facilities play a critical role in ensuring that the buses operate efficiently and accommodate the future growth in ridership. Key considerations are: Efficient layout of the off-street bus facility with recirculation and adequate number of bus bays and layover spaces. Enhanced customer amenities at off-street bus facilities including: continuous platform shelters with canopies, adequate seating, lighting, windscreens, trash receptacles, maps, and signage. Canopies should extend to the station entrance via the pedestrian pathway wherever possible and should completely cover the walkway, the bus shelters and extend above the front door of the bus. Facilitis designed to accommodate bus access and capacity demand during the PM peak hour period, when transit headways are more frequent and passenger boardings are greatest. New ICC bus service recently began operation to serve the new Federal Food and Drug Administration (FDA) M Germantown MARC ICC Bus Routes Route 201- BWI Airport Metropolitan Grove MARC M Quince Orchard Rd Great P Gaithersburg Seneca Bus Route Key: Route 201 Transit Key: 99 Montgomery Transit Ride-On J7 WMATA Metrobus A CTC - Connect-A-Ride Red Howard Transit MTA99 MTA Bus Service 17 Prince George s The Bus Gaithersburg J7, J9 Gaithersburg Park and Ride Rd. Shady Grove Rd. West 53,55,57,59, 63,66,67,Q2 Legend: Intercounty Connector ICC Bus Route P Park and Ride M MARC Rail Station M WMATA Metro Station L 355 MTA Light Rail ICC Bus Stop M 124 Shady Grove Metro Rockville Metro/MARC M Rockville 270 East 43,58,60,61,64, 65,71,74,76,78, 79,90,100, MTA991 M North Bethesda Bethesda Brookeville P Norbeck Park and Ride Norbeck 51,Y5,Y7 Silver Spring Figure 27: Route Bus Transit Service Map Source: MTA M Germantown MARC Metropolitan Grove MARC M Quince Orchard Rd Great P Gaithersburg Seneca Bus Route Key: Route 202 Transit Key: 99 Montgomery Transit Ride On J7 WMATA Metrobus A CTC - Connect-A-Ride C60 Annapolis Transit Red Howard Transit MTA99 MTA Bus Service 17 Prince George s TheBus Gaithersburg J7, J9 Gaithersburg Park and Ride Rd. Shady Grove Rd. West 53,55,57,59, 63,66,67,Q2 Legend: Intercounty Connector ICC Bus Route P Park and Ride M MARC Rail Station M WMATA Metro Station L 355 MTA Light Rail Proposed Bus Stop M 124 Shady Grove Metro East 43,58,60,61,64, 65,71,74,76,78, 79,90,100, MTA991 Rockville Metro/MARC M Rockville 270 M North Bethesda Figure 28: Route Bus Transit Service Map Source: MTA Research Center at White Oak and the Base Realignment and Closure (BRAC) changes at Fort Meade. The FDA facility will accommodate 7,700 employees and Fort Meade will accommodate an additional 10,500 employees. Expanding bus service to these facilities is a key strategy for reducing the number of auto trips to these facilities. ICC Bus Route 201 operates between the Gaithersburg Park and Ride lot and the BWI/Thurgood Marshall Airtport. ICC Bus Route 202 operates between the Gaithersburg Park and Ride lot and Rockville Pike Georgetown Rd. Rockville Pike Georgetown Rd. Bethesda M 108 Norbeck Park and Ride (future) Norbeck Rd. M White Flint Metro 108 M Norbeck Park and Ride (future) Norbeck Rd. White Flint Metro M P Medical Center Metro P Medical Center Metro 495 M Brookeville P Norbeck Park and Ride Norbeck 51,Y5,Y7 495 M Glenmont Metro ICC Bus Routes Route DOD/Ft. Meade Glenmont Metro Silver Spring New Hampshire Ave INTERCOUNTY CONNECTOR New Hampshire Ave. 29 Dahlgreen Rd. FDA Langley Park 650 INTERCOUNTY CONNECTOR Dahlgreen Rd. FDA Langley Park Burtonsville Park and Ride Burtonsville Z6,Z9,Z29, D, MTA915,929 Cherry Hill Rd. P Sellman Rd. Rhode Island Ave 95 Beltsville College Park College Park M M Metro / MARC Cherry Hill Rd. Sellman Rd. Rhode Island Ave 95 Beltsville College Park College Park M M Metro / MARC M Columbia Town Center Columbia Muirkirk MARC 198 Laurel 1 New Carrollton M Columbia Town Center Columbia Muirkirk MARC 198 Laurel 1 New Carrollton 29 BWI M MARC/ 195 Amtrak Amtrack Marc 29 D C Training School Little Patuxent River M Amtrak 295 Laurel MARC Savage Savage Purple Fort Meade DOD NSA Bald Eagle Dennis Erskin e Little Patuxent River 175 Jessup Fort Meade. (Refer to Figures 27 and 28) Both of these routes links Shady Grove Station with points north and east. Additional Ride On bus service is proposed to Clarksburg, Maryland from the Shady Grove Station to serve forecasted increases in employment and population in the Clarksburg area. Ride On currently operates limited service to the employment area of Clarksburg and plans to increase service as development occurs. The Sector Plan proposes to increase Colony 7 Brownell Eubanks Eubanks Patuxent Fournier Christian Lobaugh Nursery 100 Elkridge Landing Harrison Fort Meade BWI Airport Maryland Dorsey MARC White M 95 1 BWI Airport Miles Watertank 3rd Cavalry Grandea 295 3rd Cavalry Van Noy Airfield Jessup 32 Obrien 2nd Calvary Mapes Harris Michael Zimborski Chapultepec Dorsey MARC DOD DOD F Taylor Hopkins M 95 Fort Meade Cooper DISA Fort Meade Miles Redmount Cooper Officers Club Mcwhorter DMA Williams Midway Thorson Cooper Branch Cooper Leonard Wood Downs L Elm Friendship Pierce Lauffer St e wart Macarthur Mcgee English 2nd Army Air Cargo Llewellyn Redwood Franklin Bran ch Est ridg e Roberts Wooddale M BWI MARC/ AMTRAK Rail Station Reece Buckner Butler HQ Washington Odenton Odenton MARC M Odenton Franklin Branch Hawkins Morrison Fort George Meade Kimbrough L BWI Airport BWI Airport B30, MTA17, Light Rail, Silver BWI Bu District L L BWI Airport Patton ADJ/ EPA/ UPM Chisolm Pepper 28 Section 3
49 the number of bus bays at the Shady Grove Station to 18, 10 bus bays on the east side and eight bus bays on the west side, doubling the current number. These additional bus bays should provide a sufficient increase in capacity to accommodate the anticipated growth in bus service at the Shady Grove Station; however, a detailed bus facility assessment should be conducted to confirm the number of bus bays required. Corridor City Transitway The Sector Plan includes the incorporation of the Corridor Cities Transitway (CCT) at the Shady Grove station area. The CCT is part of the I-270/US 15 Multi-Modal corridor study which seeks to identify and select highway and transit alternatives that relieve congestion, provide transit options and improve safety. The transitway has been designed as a dedicated facility with only limited interaction with vehicular traffic at local street crossings to accommodate either Light Rail transit (LRT) or Bus Rapid transit (BRT). The 14-mile CCT would provide transit from the Shady Grove station to the COMSAT facility just south of Clarksburg and includes 13 stations (Figure 29). alignments developed as part of the CCT design work and an aerial LRT alignment developed as part of this study. The goal is to maximize the convenience to passengers transferring between the two transit modes and minimize travel time delays while maintaining the integrity of the existing bus service and access for Metrorail and Metrobus riders. MTA estimated the CCT ridership to be 29,000 37,000 for BRT and 34,000 42,000 for LRT on typical weekday: 9,480 BRT passengers and 10,830 LRT passengers would be transferring to Metrorail at the Shady Grove station resulting in additional future demand on the station. The Draft Environmental Impact Statement (DEIS) was completed in Following completion, SHA determined that new alternatives involving express toll lanes should be included which led to a new AA/ EA released in 2009 for these new alternatives. Recently, MTA refined the transitway alignment and station locations to better serve the Life Science Center redevelopment identified in the Gaithersburg West Master Plan. A key consideration of the MTA planning effort has been how the CCT interfaces with the Shady Grove station. Including an at-grade BRT and LRT Figure 29: CCT Study Area Map Source: MTA Section 3 29

50 Future Access Pedestrian and Bicycle Access Pedestrian and bicycle access to the Shady Grove station is given primary importance in the Sector Plan and in Metro s overall goal for improving access to stations. For pedestrian pathways connecting to a station site, it is generally recognized that providing a safe and convenient walking environment that includes clear, unfragmented, and integrated pedestrian paths to the station will encourage more customers to walk and bike. Designate a path for bicyclists to enter and exit the station. Striping lanes for bicycles on access roads and direct, marked roadway crossings are important improvements. Provide better wayfinding onsite to bicycle parking and on paths/sidewalks leading to the station. Bicyclists need to know where they should be riding and/ or parking their bicycles. Provide cover for the bicycle racks. Ensure that bicycle parking solutions are safe and secure. Provide additional bicycle racks to replace any outdated racks and to accommodate future demand. As bicycle usage increases consider implementing a bike cage or bike station. Montgomery County has plans to construct a trail on the east side of the station along the Shady Grove access road to provide better bicycle and pedestrian access from the Derwood community. This trail will encourage more passengers to access the station by bicycle. Metro recently developed a Bicycle and Pedestrian Improvements Plan that identifies strategies to improve pedestrian and bicycle facilities at and around Metrorail stations. The following is a range of proposed improvements aimed at eliminating bicycle and pedestrian barriers, improving bicycle parking, and improving signage/wayfinding. Within the station, add bicycle gutters along stairs so bicyclists can use the stairs to get in and out of the system, rather than the elevators. Ensure that the paths throughout the station area are direct and not circuitous. Figure 30: Shady Grove Access Bike Path Source: Montgomery County Planning Continue coordination with Montgomery County on the planned Shady Grove trail on the east of the station. 30 Section 3
51 Kiss & Ride Access The Kiss & Ride facility is primarily used for dropping off and picking up Metrorail passengers and also includes space for short-term parking, car sharing vehicles, taxi stands, motorcycle parking, paratransit vehicles, and private shuttle buses. For optimum function, the Kiss & Ride facility should have a direct visual connection with the station entrance, where a waiting driver can quickly locate their passenger exiting the station. Kiss & Ride facilities must be convenient for both pedestrians and automobiles to encourage use. Currently there is a high Kiss & Ride demand at the Shady Grove station particularly on the east side. Metro s guidelines for calculating Kiss & Ride capacity is based on the average PM peak hour Kiss & Ride arrivals for two consecutive trains. To reflect real world conditions a peak hour factor of 0.85 is used to consider the impact of peak surge conditions. Ridership forecasts project there will be 4,450 passengers exiting the Shady Grove Station in 2030 during the PM peak hour. To accommodate the future Kiss & Ride, Metro s Station Site and Access Planning Manual recommends providing the 84 spaces as shown in Table 4. This table shows the tabulation of the future K&R capacity along with projected capacity for curb side spaces for automobile pick up and drop off, taxi queue, shuttles and motorcycle spaces. The 84 Kiss & Ride spaces include the driver-attended spaces, short term metered spaces and ADA spaces, and excludes spaces for curbside pick-up and drop-off, taxis, bus shuttles, and motorcycles. Based on this analysis, the existing 86 Kiss & Ride spaces adequately meet the future demand for driver attended, short term parking and ADA spaces. Also, the existing 14 taxi spaces and 30 motorcycle spaces meet the future demand. Additional space is needed for curb-side pick-up and drop-off and shuttle bus pick-up and dropoff. The need for these spaces should be evaluated within the context of pedestrian and bicycle improvements, joint development and the future CCT transit service; all of which should improve options for both local residents and commuters to access the station by methods other than the automobile. The existing Kiss & Ride spaces are distributed between the east side and west side: 41 spaces are on the west side representing 48% and 45 spaces are on the east side representing 52%. It is anticipated that the same distribution should be maintained in the future. The Sector Plan shows relocation of the Kiss & Ride facilities on the east side of the station into the new parking structure. While the Metro Design Criteria and Standards permit locating Kiss & Ride facilities within a parking structure under certain conditions, it would be difficult at the Shady Grove Station given the high Kiss & Ride activity during peak periods, especially on the east side. A key requirement is that the Kiss & Ride facility have separate access and egress from Park & Ride vehicles. Further study of the Kiss & Ride function will be required to ensure that it is well planned to accommodate the high future demand. Table 4: Future Kiss & Ride Capacity and Space Allocation Number of Trains/Hour 15 N: Number of Peak Hour Arrivals in ,450 Peak Hour Factor 0.85 Formula: 2*(N/Trains per Hour/Peak Hour Factor) 698 Kiss & Rode Mode Share 12% Spaces Required (SR) 84 Future No. of Spaces Existing No. of Spaces Spaces Required (SR) Driver Attended Spaces (SR/2) Short-Term Spaces (SR/2) Pick-Up/Drop-Off (SR/6) Taxi Queue Spaces (SR/6) Motorcycle Parking (SR/5) Shuttle Parking (SR/10) 9 - Car Sharing Spaces (varies) - 6 Note: Number of spaces was rounded up to the next whole number where applicable. Key considerations for locating Kiss & Ride inside a parking structure include: Kiss & Ride facilities are located on the level of the structure with the most direct pedestrian access to the station entrance and have direct vehicular access to an adjacent street. Kiss & Ride facilities are clearly visible from the street and other areas of the site to enhance passenger safety. Kiss & Ride facilities are adequately ventilated. Kiss & Ride facilities have separate access and egress from Park & Ride vehicles. Section 3 31
52 The parking structure provides a 12-foot minimum clearance. Metro s experience shows that when the Kiss & Ride facility is not conveniently located people will not use it and the Kiss & Ride functions will occur informally at the curbside often causing significant congestion during peak periods. Park & Ride Access The Sector Plan shows new mixeduse development planned for the existing surface lots both east and west of the station. (Note that the two existing parking structures remain unchanged.) These surface parking lots are to be replaced with two new parking structures, one east of the station and one west of the station. There are 1,373 surface parking spaces on the east side and 922 surface parking spaces on the west side that are expected to be replaced. The Shady Grove Station has considerable unmet parking demand today. The utilization rate is consistently above 90%; industry standards consider 85% full utilization. This utilization rate means that between 5 AM and 2 PM Metro collects parking revenue for over 90% of the parking spaces and doesn t account for passengers arriving before 5 AM or after 2 PM. The Shady Grove parking garages and surface lots are full on all workdays. The area identified for a replacement parking structure on the west side is on County-owned land adjacent to the existing entry road to the rail maintenance yard. The footprint identified in the Sector Plan was too small to meet Metro requirements for layout and circulation. Figure 33 shows the footprint increased to accommodate Metro s requirements. The new area is approximately 63,000 square feet, which would accommodate 210 spaces per level. A five-level parking structure would provide 1,050 spaces, which would accommodate the 922 replacement spaces and provide an additional 128 new spaces. The Sector Plan allows for an increase in parking as long as it does not displace or negatively impact housing and does not contribute to local intersection congestion. Several options exist to accommodate future parking demand. The new parking structure on the west side could be constructed with two additional levels to provide an extra 420 parking spaces. In addition, the Sector Plan shows the potential for a third new parking structure located on the east side adjacent to the CSX and Metrorail tracks that could also accommodate future demand. Metro s Joint Development Policies and Guidelines support goals for smart growth developments such as reduced automobile dependency, increased pedestrian/bicycle originated transit trips and better bus access. In general, Metro transit facilities have been replaced one-for-one in joint development projects to serve existing passenger access needs. However, Metro s 2008 Joint Development Policies and Guidelines allow for changes in replacement strategies to reflect the transformation of the station and the area around it to pedestrianfriendly transit-oriented community. Given that Shady Grove is an end-ofline regional station and numerous development plans are in the pipeline, the demand for parking will remain. However, when joint development occurs at Shady Grove Station shared The Sector Plan identified parking replacement strategies. The area identified for a replacement parking structure on the east side is approximately 63,000 square feet, which would accommodate 210 parking spaces per level. A seven-level parking structure would provide 1,470 spaces, which would accommodate the 1,373 replacement spaces and provide an additional 97 new spaces. Figure 31: Shady Grove Station Surface Parking Lots Source: WMATA GIS 32 Section 3

53 parking and lower cost strategies to meet the parking demand should be explored, particularly for those people living within two miles of the station. As previously pointed out pedestrian and bicycle access improvements and the future CCT transit service will provide options to both local residents and commuters to access the station by methods other than the automobile. Future Streetscape The Sector Plan includes the creation of an urban streetscape throughout the Metro Neighborhoods including a new street network with landscaping, pedestrian scaled lighting, street furniture, sidewalks, and crosswalks to create a safe walking environment. Station West Side ( Metro West Neighborhood ) The Sector Plan identifies the Metro West Neighborhood as the center of the urban village with a mix of uses including a public Town Square, midand high-rise apartment buildings, offices, a hotel, and street level retail. Specific recommendations pertaining to the Metro West Neighborhood include: Create a landscaped boulevard that leads to the Metro Station. It should reflect the regreening of Shady Grove theme by establishing a garden character in the medians. Provide streetscape around the Town Square, shade trees and seating areas to create a green urban park. Redevelop and expand Metrobus, Kiss & Ride and taxi service directly adjacent to the station in a way that is compatible with new development and meets WMATA s program requirements. Support Metro parking in a multi-level parking garage north of King Farm Boulevard, adjacent to the Solid Waste Transfer Station. Implementing this plan will require redevelopment of Metro owned property, reconfiguration of Metro s bus facility and Kiss & Ride facilities, and relocation of Metro s surface parking lot into multi-level parking structures (Refer to Figure 33 Station West Side - Metro West Neighborhood). The Sector Plan shows the bus and Kiss & Ride facilities located directly adjacent to the station entrance to minimize walking distances for transit riders and a Park & Ride structure located approximately 1,200 feet from the Metro entrance. This layout is compatible with the Metro Design Criteria and Standards. The Sector Plan shows the layout of the proposed urban street network in the Metro Neighborhoods. With respect to bus and Kiss & Ride access from the west, Ride On, Metro buses and Kiss & Ride vehicles would enter the station site directly from MD 355 on the new Urban Boulevard or from Redland Road on either the new Promenade or new local road through the Metro West Neighborhood. The plan allows for bus re-circulation on the local streets which is important for accommodating bus layovers. The parking structure is proposed off the new Main Street so access is similar to the Kiss & Ride access. Refer to the Kiss & Ride and Park & Ride Sections for a discussion on parking requirements. Figure 32: Shady Grove Station - Town Square (Metro West Neighborhood) Source: Shady Grove Sector Plan (March 2006) The proposed Town Square is approximately 1.2 acres and is on Metro owned property. Metro s Station Site and Access Manual encourages public space in front of the station entrance to create a central focal point, however, creating open space that is too large will displace transit facilities which will inconvenience transit customers. Metro Joint Development must conform to the FTA joint development guidelines that call for highest and best transit use. Given this parcel s proximity to the station entrance, the question remains Section 3 33

 Figure 33:")


54 = Connects to existing roadway * = Walkway Canopy (Above) Figure 33: Station West Side - Metro West Neighborhood Source: Shady Grove Sector Plan (March 2006) 34 Section 3

55 of whether open space of this size is the highest and best use of Metro property. In addition, implementing a Town Square would reduce the source of revenue Metro would realize from the sale or lease of this property. Station East Side ( Metro North Neighborhood ) The east side of the Shady Grove station includes Metro and County owned property that the Sector Plan envisions redeveloping into the Metro North Neighborhood, with a mix of residential, office and retail uses. Specific recommendations from the Sector Plan pertaining to the Metro facilities in the Metro North Neighborhood include: Redevelop Metro property as a mixed-use residential neighborhood with a range of housing types. Create a main street between the intersection of Yellowstone Drive and Redland Road and the current County Service Park. Signalize the intersection at Redland Road to ensure safe pedestrian crossing from the Old Derwood neighborhood. parking on the east side of the Metro station because of its convenient access via I-370. Implementing this plan will require redevelopment of Metro owned property, reconfiguration of Metro s bus facility and Kiss & Ride facilities, relocation of Metro s surface parking lots into multi-level parking structures, and the redesign of the Metro access road (Refer to Figure 35 Station East Side - Metro North Neighborhood). The Sector Plan shows a redesigned bus loop located adjacent to the station entrance that minimizes walking distances for bus riders. The plan allows for bus re-circulation on the local streets, which is important for accommodating bus layovers. The plan also shows relocation of the Kiss & Ride and surface parking facilities into a new parking structure located on existing Metro property adjacent to the existing north Metro parking structure. The proposed location for the new parking structure is within 500 feet of the station entrance, which complies with the Metro Design Criteria and Standards. However, locating the Kiss & Ride facility within a parking structure at the Shady Grove station would be problematic given the high Kiss & Ride activity during peak periods. Refer to the Kiss & Ride and Park & Ride sections for a more detailed discussion on parking requirements. Vehicular access including bus, Kiss & Ride and Park & Ride, to the station area would be directly from Redland Road on the new Promenade or from the Shady Grove Road Connection, which connects to new local roads through the Metro North Neighborhood. This reconfigured access is predicated on a redesign of the Metro access road to provide two-way traffic. Further discussion with Montgomery County is required to develop implementation and funding strategies for these roadway improvements. The pedestrian and bicycle trail on the east side of the Metro access road is advancing. This improvement includes a pedestrian activated signalized crossing at the entrance to the Metro Kiss & Ride facility. The plan proposes a new roadway (Promenade) adjacent to the access for the north parking structure and Redesign the Metro access road for two-way traffic connecting to Redland Road, improving access to the parking garages and the residential neighborhood. Provide an at-grade pedestrian and bike crossing of the redesigned Metro access road where the new street grid creates an intersection. The crossing should connect to the trail system provided around the storm water management pond. Provide the majority of Metro Figure 34: Shady Grove Station - East Side Source: Shady Grove Sector Plan (March 2006) Section 3 35

 Figure 35:")


56 = Connects to existing roadway * = Walkway Canopy (Above) Figure 35: Station East Side - Metro North Neighborhood Source: Shady Grove Sector Plan (March 2006) 36 Section 3
57 developmnet on the entrance and exit lanes. There is not sufficient space inside the north parking structure to create the required entrance and exit areas so these lanes are envisioned to continue to be required. Any new roadway and development must preserve the access to the parking structure(s). In conclusion, Metro supports redevelopment at Shady Grove; however, there are several concerns related to the development plans shown in the Sector Plan including the proposed Town Square; roadway infrastructure changes on the east side of the station involving the redesign of the Metro Access Road; creation of the urban street grid; and design of the proposed partial interchange at the Metro Access Road and Crabbs Branch Way. This infrastructure will require significant capital investment to implement and Metro does not foresee development of its property creating enough value at the densities proposed to fund the proposed road network. As the Sector Plan moves towards implementation, Metro recommends collaboration with Montgomery County and MNCPPC to identify opportunities to incorporate open space into a mixed-use development and develop a strategy for implementing the roadway network changes to create a more urban pedestrian friendly environment that is supportive of transit and station access needs. Section 3 37

58


59 Station Capacity Analysis Ridership Projections Vertical Circulation Capacity Analysis Faregate Capacity Analysis Shady Grove Station Access Improvement Study Section 4
60 Draft Report Shady Grove Station Access Improvment Study 40 Section 4

61 Station Capacity Analysis Ridership Projections As part of the 2008 Metrorail Station Access and Capacity Study, ridership for 2030 was forecasted at all Metrorail stations using the MWCOG Round 7 regional model as a base. The projected ridership at the Shady Grove station in 2030 is 19,258 daily rail boardings and 19,356 daily alightings. This represents a 45% increase in ridership over the next 20 years. In 2030 the projected number of passengers boarding trains during the AM peak hour would be 4,950 and projected number of passengers alighting in the PM peak hour would be 4,450. Assessment of infrastructure requirements at the Shady Grove station were evaluated based on existing and projected ridership levels to determine the capacity needed to meet existing and future demand. Existing Operations Currently the peak headway on the Red Line is three minutes between the Grosvenor and Silver Spring stations and the peak headway is six minutes for the Red Line stations beyond the Grosvenor and Silver Spring. During Figure 36: Insuffi cient Vertical Circulation Capacity the peak hour nine, 6-car trains and three, 8-car trains arrive and depart from the Shady Grove Station. Based on an average rail car capacity of 100 passengers the total capacity during the peak hour is 7,800 passengers. To ease the problem of rail car and platform crowding, in October 2006 WMATA eliminated the turn backs at the Grosvenor station during the off-peak reducing the headways from 12 minutes to six minutes. Future Operations To increase rail car capacity and to ease the problem of railcar crowding in the future, 8-car trains are planned to operate on the Red Line at a 4-minute headway resulting in 15 trains per hour during the peak period. Assuming all 15 trains were 8-cars with 100 passengers per car, there would be an increase in capacity of 4,200 passengers per hour, for a total of 12,000 passengers per hour on the Red Line during peak periods. There are future plans to eliminate the train turnbacks at the Grosvenor Station during the peak periods. Both of these operational changes would require additional rail cars. Vertical Circulation Capacity Analysis Existing Demand Observations of existing station conditions show excessive passenger queuing at the platform level during the PM peak hours. To determine whether there is sufficient capacity for existing demand, the vertical transportation Section 4 41

62 system was analyzed under normal and emergency operations. The faregate capacity was also analyzed based on existing demand. Analysis of Existing Vertical Circulation under Normal Operations Based on the industry standard criteria the two escalators, one stairway and one elevator connecting the platform and mezzanine provide a capacity of 134 passengers per minute for the peak passenger flow direction (8,040 passengers per hour/60 min/ hour). The capacity for the peak flow direction is shown in Table 5. Existing conditions were analyzed to determine whether the escalators have an acceptable Level of Service (LOS) to meet existing demand. The escalator LOS is based on the platform clearance time, the maximum queuing length and the total passenger wait time for boarding an escalator immediately after a train is unloaded. Trains arriving in the peak direction generate the largest surge of passengers accessing the escalators. The highest Table 5: Vertical Circulation Capacity Vertical Circulation Element Nominal Capacity number of passengers unloading in the peak 15-minute period is used to calculate the escalator volume to capacity (v/c) ratio and LOS. This volume is compared to the capacity of the vertical transportation elements, and a time-space methodology is employed to determine the volume of passengers in the queue and the length of time to dissipate the queue. During the PM peak hour of the 4,529 passengers that use the station, 3,738 alight. This equates to 935 passengers during the peak 15-minutes. Based on five-minute headways, nine 6-car trains and three 8-car trains arrive at Shady Grove during the peak hour, which equates to 312 passengers per train. Given the distance from the first and last car doors to the escalators/ Reduction Factor Capacity/ Hour Escalator * 4,200/hour N/A 4,200 Stairway ** 4,080/hour 10% 3,672 Elevator 168/hour N/A 168 Total Capacity 8,040 *One of the two escalators would be used to serve non-peak direction passengers. **Assumes less than 10% of the passengers using the stairway are heading in the opposite direction. stairs, and the average walk speed of 4 feet/second, all passengers arrive at the escalator/stairs after 45 seconds. Within 45 seconds the vertical circulation can accommodate 100 passengers resulting in a queue of 212 passengers. It takes approximately an additional 95 seconds for all passengers to clear the platform. The volume to capacity ratio would reach 0.65 and the corresponding LOS is D, which represents significant restriction in circulation. Refer to Figure 38 - Platform Clearance Time for Existing Conditions (Normal Operations). Based on a peaking factor of 0.75 the total number of passengers could reach 1,248 during the peak 15-minutes. In this worst-case scenario 416 passengers could exit a single train. This would result in a maximum passenger queue of 316 and a maximum waiting time of approximately 128 seconds. The volume to capacity ratio could reach 0.85 and the corresponding LOS is approaching E, which represents severe restriction in circulation. Pedestrians would experience reduction in walking speed and intermittent stoppages. Refer to Figure 38 - Platform Clearance Time for Existing Conditions (Worst Case Scenario). Figure 37: Queuing on platform during Peak Period Theoretically, 1,730 passengers can be accommodated on the platform based on the assumption that the desirable standing space is 10 square feet per passenger and the size of the platform is 17,300 square feet excluding warning edges, stairwell and escalators. However, a queue of 214 to 42 Section 4
63 Figure 38: Platform Clearance Time for Existing Conditions Section 4 43

64 along a platform to a stairway must be less than 300 feet. One escalator and one stairway provide sufficient capacity to clear 407 passengers from the platform in four minutes during emergency conditions. Future Demand Analysis of Future No- Build Conditions under Normal Operations (2030) Figure 39: Shady Grove Platform during Peak Period 292 passengers would occupy a 1,070 to 1,460 square feet space around the stairway and escalator area assuming five square feet per passenger when passengers congregate at the stairway and escalator area waiting to go down. There would be minimal circulation space on the platform around the stairway/escalators as they occupy the majority of the platform width. The queue would temporarily block movements along this section of the platform as can be seen in Figure 39. At least one additional escalator and stairway should be added to the existing system to accommodate the existing ridership. Alternatively, a wide stairway could be added, which is preferable in many ways because it can handle the capacity requirements of an escalator while affording the benefit of lower installation, maintenance and operating costs. It would also eliminate service disruptions associated with escalator service, which is a major inconvenience to Metro customers. An additional platform elevator should also be added to guarantee continuous accessibility to the station platform for customers using wheelchairs during periods of service disruptions for repair and maintenance. Analysis of Existing Vertical Circulation under Emergency Operations Exit requirements under emergency conditions are based on the National Fire Protection Act, NFPA 130. The main requirements are: NFPA requires that all passengers clear the platform in less than 4 minutes; Passengers move more quickly on stairs than under normal operating conditions, increasing the capacity from 10 PFM (foot-per-minute) to approximately 19 PFM; One of the escalators must be assumed to be out of service, and the capacity of the remaining escalators is assumed to be the same as a stair; Escalators can not make up more than 50% of the exit capacity; The longest walk distance Based on four-minute headways, fifteen 8-car trains would arrive at Shady Grove during the peak hour. With 4,450 passengers alighting in this period, there would be an average of 296 passengers per train. Given the distance from the first and last car doors to the escalators/stairs, and the average walk speed, all passengers arrive at the escalator/stairs after 60 seconds. Within 60 seconds the vertical circulation can accommodate 133 passengers resulting in a queue of 163 passengers. It takes approximately an additional 70 seconds for all passengers to clear the platform. The volume to capacity ratio would reach 0.75 and the corresponding LOS would be D, which represents significant restriction in circulation. Refer to Figure 40 Platform Clearance Time for Future No- Build Conditions (Normal Operations). Based on a peaking factor of 0.75, the total number of passengers exiting the trains could reach 1,483 during the peak 15-minutes. In this worstcase scenario 395 passengers could exit a single train. This would result in a maximum passenger queue of 262 and a maximum waiting time of approximately 115 seconds. The volume to capacity ratio could reach over 1 with the corresponding LOS of E, which represents severe restriction in circulation. Pedestrians would experience serious reductions in walking speed and intermittent 44 Section 4
65 Figure 40: Platform Clearance Time for Future No-Build Conditions Section 4 45
66 Figure 41: Platform Clearance Time for Future Build Conditions (Additional Vertical Circulation at Existing Entrance) 46 Section 4
67 stoppages. Reverse traffic would also have serious conflicts. Without facility improvements, any train delay would result in a break-down of pedestrian traffic flow. Refer to Figure 40 Platform Clearance Time for Future No- Build Conditions (Worst Case Scenario). Based on a standing space of five square feet per passenger, a queue of 163 to 260 passengers would occupy an 815 to 1,300 square feet space around the stairway and escalator area when passengers congregate while waiting to go down. There would be little circulation space on the platform around the stair/ escalators as they occupy the majority of the platform width. The queue would temporarily block movements along this section of the platform. Evaluation of Future Build Conditions under Normal Operations (2030) Two future build conditions were evaluated: (1) adding one escalator/ stair array between the existing mezzanine and platform and (2) adding a new south entrance mezzanine. For both build conditions under normal operations during the PM peak hour 4,450 passengers would alight at the Shady Grove Station. Using the average of 296 passengers per train calculated above and uniform passenger distribution on an 8-car train, there would be 37 passengers per car. New Escalator/Stair Array: Given the location of the existing vertical circulation and the proposed location for the new escalator/stair array on the platform, it is assumed that the passengers in the first five cars would use the existing escalator (185 passengers) and stairs while passengers in the last three cars (111 passengers) would use the new escalator. Note: the new escalator would be operating in the peak direction (e.g. in the down direction during the PM peak period and in the up direction in the AM peak period) and the stairs would be primarily used for the non-peak direction. Given the distance from the first and last car doors to the escalators/ stairs, and the average walk speed, all passengers would arrive at the respective escalators and stairs after 45 seconds. The existing vertical circulation could accommodate 100 passengers within 45 seconds resulting in a queue of 85 passengers. It would take approximately an additional 40 seconds for the passengers to clear the platform. Refer to Figure 41 Platform Clearance Time for Future Build/Additional Vertical Circulation at Existing Entrance. The new escalator could accommodate 40 passengers within 45 seconds resulting in a queue of 71 passengers. It would take approximately an additional 80 seconds for the passengers to clear the platform. The overall volume to capacity ratio for both the existing and new escalator/stair arrays would be 0.50 and the corresponding LOS would be C, which represents some restriction to circulation during the peak period. To further reduce crowding for the future demand, two escalators and one-stair could be added between the platform and mezzanine rather than one escalator and one stairway. New South Entrance: The second build condition assumes that a new aerial mezzanine would be built on the south end of the platform with a pedestrian bridge connecting the new mezzanine to the east over the Metro and CSX tracks. The mezzanine would connect to the platform with one escalator/stair array, and two elevators. Given that the new vertical circulation elements for this south entrance are the same as the new vertical circulation elements described for the existing entrance, the overall operating conditions would be the same. The overall volume to capacity ratio would be 0.50 with a corresponding LOS of C. As with the new vertical circulation elements for the existing entrance adding a second escalator at this south entrance could further reduce crowding and ease congestion. Faregate Capacity Analysis There are nine faregates and one ADA accessible faregate at the existing entrance. From field observations, faregates are operating at an acceptable LOS. The average queuing time is less than 15 seconds. However, during afternoon peak hours, the passenger arrival rates at the faregate area are constrained by the capacity of the vertical transportation system. Table 6 and Table 7 show the analysis for calculating the minimum number of faregates based on: (1) the existing ridership using the unconstrained arrival rates at the faregate area, and (2) future ridership at the existing entrance. Based on flow rate observations one faregate can clear 35 passengers per minute. The peak hour factor of 0.8 is used to account for a non-uniform distribution of passenger arrival at the faregates. Table 6 and Table 7 show that a minimum of eight and nine faregates are required to handle existing and future demand, respectively during the 15-minute peak period. Therefore, the existing nine faregates at the existing entrance are sufficient to handle the projected demands. If a second south entrance were built the ridership demand would be split between the existing entrance and the new entrance reducing the demand Section 4 47
68 Table 6: Faregate Capacity Analysis - Existing Conditions Item Assumptions: A Peak Hour Trains 12 rains B Faregate service rate 35 passengers/minute C Volume to capacity ratio 0.7 Level of Service D D Peak Hour Factor 0.8 Peak 15 minute passenger volumes: E Entries 976 passengers F Exits 935 passengers Number of Fargates for Entries G Adjusted entry volume (E/D) 1220 passengers H Capacity required (G/15 min/c) 116 passengers/minute I Number of faregates required (H/B) 3.3 faregates Number of Faregates for Exits J Adjusted entry volume (F/D) 1169 passengers K Capacity requred (J/15 min/c) 111 passengers/minute L Number of faregates required (K/B) 3.2 faregates Total Number of Faregates Required M (H/B) Entry 3.3 N (K/B) Exit 3.2 O ADA 1 P Total (M+N+O) 8 minimum (rounded up) Table 7: Faregate Capacity Analysis Conditions Item Assumptions: A Peak Hour Trains 15 rains B Faregate service rate 35 passengers/minute C Volume to capacity ratio 0.7 Level of Service D D Peak Hour Factor 0.8 Peak 15 minute passenger volumes: E Entries 1153 passengers F Exits 1113 passengers Number of Fargates for Entries G Adjusted entry volume (E/D) 1441 passengers H Capacity required (G/15 min/c) 137 passengers/minute I Number of faregates required (H/B) 3.9 faregates Number of Faregates for Exits J Adjusted entry volume (F/D) 1391 passengers K Capacity requred (J/15 min/c) 132 passengers/minute L Number of faregates required (K/B) 3.8 faregates Total Number of Faregates Required M (H/B) Entry 3.9 N (K/B) Exit 3.8 O ADA 1 P Total (M+N+O) 9 minimum (rounded up) 48 Section 4

69 Table 8: Summary of Vertical Circulation Existing No Build New Escalator and Stair Build New Mezzanine at South End of Station Peak Direction Passenger Flow PM Peak Hour 3,738 4,450 4,450 4,450 PM Peak 15-Min ,112 1,112 1,112 No. of Trains/Hour Platform, Escalator and Stair v/c Ratio Condition Signfi cant restriction in circulation during peak 5-minutes. Signifi cant restriction in circulation with temporary blocking of movement during peak 5-minutes. Reduce crowding on platform during peak of the peak hour. Reduce crowding on platform during peak of the peak hour. at the existing entrance. WMATA s Standard and Criteria mandate a minimum of four faregates in an array, one being ADA accessible. Therefore, a new south entrance would be required to have four faregates which would be sufficient to handle the projected demand. The capacity analysis does not take into account the future Corridor Cities Transitway (CCT) ridership. According to the CCT ridership analysis there would be 9,480 passengers transferring from the CCT BRT service and 10,830 passengers transferring from the LRT CCT service to Metrorail during the AM peak period. This additional demand would contribute further to the capacity issues at the station and would reinforce the need for additional vertical transportation and potentially additional faregates. Figure 42: Shady Grove Station Faregates Section 4 49
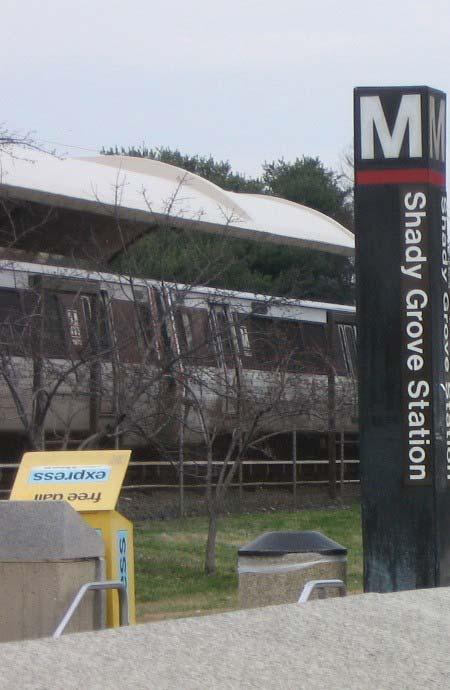
70

71 Station Improvement Alternatives Vertical Circulation Capacity and Expansion Evaluation of Alternatives Shady Grove Station Access Improvement Study Section 5
72 Draft Report Shady Grove Station Access Improvment Study 52 Section 5
73 Station Improvement Alternatives The design alternatives developed for station capacity improvements for this study are based on the recommendations of the Sector Plan and have been refined to meet Metro station access requirements. Station Capacity Enhancement Alternatives Alternatives for increasing the capacity of the station were developed to accommodate the projected growth in ridership at the Shady Grove Station, and represent different levels of capital and operating investments.these alternatives range from providing additional vertical circulation at the existing station entrance to providing a second entrance to the south. Improvement 1 adds vertical circulation and faregates at the existing mezzanine entrance to accommodate passenger arrivals during the PM peak. 1A adds vertical circulation between the mezzanine and platform including an escalator/ stair array and a new elevator. 1B - relocates the existing kiosk to provide space for additional faregates at the existing faregate array. Improvement 2 is a new mezzanine entrance located directly north of the existing kiosk that adds faregates and vertical circulation between the mezzanine and platform including an escalator/stair array and a new elevator. Improvement 3 is a second entrance at the south end of the station platform. Three sub-alternatives are provided, one that connects to the east side of the station (3A), one that connects to both the east side of the station and to a potential LRT platform west of the station (3B) and one that connects to Redland Road (3C). All alternatives would be accessible from the street level via elevators, escalators and stairs. Vertical Circulation Capacity and Expansion The existing escalators from the mezzanine and the platform do not have sufficient capacity to meet the existing demand during the PM peak period. Expanding the existing mezzanine to add space for an escalator/stair array would increase the capacity between the mezzanine and platform and relieve existing platform crowding during peak periods. In addition, the one elevator between the mezzanine and platform is insufficient and should be expanded. This is the case at many other Metrorail stations as well. Customers with mobility challenges who rely on elevator service cannot access the station when the platform elevator is out of service. When elevators are out of service at a Metrorail station these customers must use the elevators at the next nearest station, and then transfer to their destination station using Metrobus shuttle service which is inconvenient to the customer and increases Metro s operating costs. Section 5 53
74 During any elevator outage, customers using strollers, wheeled luggage, and seniors with balance problems are forced to use the escalator, which is not only in violation of Metro policy but is unsafe as well. Current Metro design criteria for the planning of new or expanded Metrorail station facilities require guaranteed elevator service between all levels of a station. When a minimum of two elevators is provided between each level in a station, access for these customers can be provided even if one of the elevators is shut down for repairs or maintenance. Alternative 1A shows additional vertical circulation capacity from the mezzanine and platform and an additional elevator between the street-level on the west side and the passageway. Mezzanine Capacity The size of the station mezzanine and the number of faregates should be adequate to handle the projected future demand. Crowding is not currently a major issue at the faregate area due to the fact that the passenger flow is constrained at the platform level. Based on unconstrained passenger flow, two additional faregates are required to reduce the crowding at the mezzanine level. As ridership grows, crowding will become even more problematic during peak periods. Currently there is no space for additional faregates; therefore an option to relocate the kiosk to provide space for two additional faregates was developed (Alternative 1B). Improvement 1 - Additional Vertical Circulation and Faregates Improvement 1 includes enhancements in the vertical circulation elements (Improvement 1A) and additional faregates (Alternative 1B). Alternative 1A provides for an additional escalator/stair array and an additional elevator between the platform and the mezzanine. In addition, Alternative 1A provides an additional elevator between street-level and the west passageway (Refer to Figures 43, 44 and 45, Alternative 1A: Additional Vertical Circulation). The increased vertical circulation capacity would alleviate platform crowding around the existing escalator/stair array and ensure elevator availability even when one elevator was out-of-service for maintenance or repair. Alternative 1A involves: (1) excavating, cutting through the existing south end concrete wall structure and building footings, exterior walls and roof slab for the mezzanine extension, (2) demolishing the existing service rooms, (3) building interior walls for relocated service rooms in the extended mezzanine, (4) cutting through the platform to construct escalator/stair array and new elevator between mezzanine and platform, (5) demolishing a section of the west passageway to construct new elevator between passageway and street-level, and (6) installing required mechanical, electrical, HVAC, and systems equipment to support the extended mezzanine. The existing service rooms that would need to be relocated include: fire equipment cabinet room, communications cabinet room, electrical cabinet room, women s washroom, men s washroom, cleaner and ejector room, electrical room, and elevator machine room. The equipment located in these rooms would have to be relocated and upgraded as required to support the expanded mezzanine area and the new vertical transportation elements. The existing mezzanine extends under the inbound and outbound Metrorail tracks. Extending the mezzanine to the south would require a structural support system to protect the existing Metrorail tracks in place during construction and there would be restrictions to the construction work schedule given the proximity to the operating Metrorail system. Alternative 1B involves relocating the existing kiosk to provide space for an additional three faregates to be installed. A significant number of communication conduits run under the paver tiles in the mezzanine floor slab, which connects to communication panels in the kiosk. In addition to physically relocating the kiosk and installing new faregates, Alternative 1B would require rerouting these cables to the relocated kiosk (Refer to Figure 46, Alternative 1B: Additional Faregates). Implementing the station capacity and enhancements identified in Alternatives 1A and 1B at the same time would maximize the capacity at the existing station mezzanine; however, implementing these capacity enhancements could be phased. Expanded Mezzanine - Alternative 1A One new platform to mezzanine elevator One new passageway to street elevator One new escalator/stair array Relocated service rooms Paver tile floor Lighting CCTV Signage Trash receptacle Additional Faregates - Alternative 1B Relocated Kiosk 54 Section 5
75 Figure 43: Alternative 1A - Additional Vertical Circulation (NTS) Mezzanine Plan Section 5 55
76 Figure 44: Alternative 1A - Additional Vertical Circulation (NTS) Longitudinal Section 56 Section 5
77 Figure 45: Alternative 1A - Additional Vertical Circulation (NTS) Partial Platform Plan Section 5 57
78 Figure 46: Alternative 1B - Additional Faregates (NTS) Mezzanine Plan 58 Section 5
79 New faregates New Mezzanine Entrance Alternative 2 expands the existing mezzanine northward to add space for a new escalator/stair array and new elevator between the mezzanine and platform plus new faregates and fare vending machines. (Refer to Figures 47, 48 and 49, Alternative 2: New Mezzanine). The additional vertical circulation capacity would alleviate platform crowding around the existing escalator/stair array and ensure elevator availability even when one elevator was out-of-service for maintenance or repair. Alternative 2 involves: (1) cutting through the existing mezzanine north end concrete wall to excavate and build footings, exterior walls and roof slab for the for the new mezzanine; (2) cutting through the existing mezzanine west side concrete wall and passageway to excavate and build footings, exterior walls and roof slab to expand the existing mezzanine to house the relocated fare vending machines; (3) cutting through the platform to construct escalator/stair array and new elevator between mezzanine and platform, and (4) installing required mechanical, electrical, HVAC, and systems equipment to support the new mezzanine. On the platform level, the canopy would need to be extended approximately 130 feet to extend coverage to the end of the platform. The existing service rooms would not be relocated in this alternative. New Mezzanine Faregates, one accessible Service gates One new elevator One new escalator/stair array Relocated fare vending machines and Smartrip dispensers Relocated exit fare machines Relocated map case with telephones (one text telephone) Paver tile floor Lighting CCTV Signage Trash receptacle New Second Entrance Given the extent of mixed-use development envisioned in the Shady Grove Sector Plan, a second entrance to the south should be part of a long-term station improvement plan. A southern entrance would improve access to the Shady Grove station and enhance the connection to the Metro South Neighborhood and Metro East/Old Derwood Neighborhood identified in the Sector Plan. In addition, a second entrance would relieve crowding at the existing entrance by balancing the station demand between the two entrances. Three alternatives were developed to show concepts for a second entrance to the south (Alternatives 3A, 3B and 3C). Alternative 3A New Station Entrance Connecting to East Alternative 3A provides a new southern aerial mezzanine built over the existing Shady Grove Station platform and connects to the east side of the Shady Grove Station in the vicinity of the existing southern parking structure. Alternative 3A includes: (1) a new aerial mezzanine, (2) a pedestrian bridge over the outbound Metrorail and CSX tracks; and (3) a new elevator entrance pavilion (Refer to Figures 50, 51 and 52: Alternative 3A and 3B New Second Entrance). This new entrance involves constructing a new elevator entrance pavilion on the east side of the station providing elevator and stair access to the new mezzanine via a pedestrian bridge. The pedestrian bridge and mezzanine would be supported by columns. New vertical circulation would provide access between the new mezzanine and the existing platform. Service rooms would be built to support the operation and maintenance of the new mezzanine. The new entrance pavilion, pedestrian bridge and mezzanine would have a metal framed glass enclosure and metal framed glass roof canopy. The size and design of the new mezzanine would be based on the ultimate demand. The number of escalator/stair arrays, elevators and fare collection equipment shown in the conceptual plans are estimates based on initial projections. A more detailed demand analysis to determine the forecasted ridership at the Shady Grove station would be needed. New Station Mezzanine Kiosk Faregates, one accessible Two elevators and one escalator/stair array New service rooms Fare vendors and Smartrip dispensers Exit fare machines Map case with telephones (one text telephone) Paver tile floor Lighting CCTV Passenger Information Displays (PIDS) Signage Trash receptacle Pedestrian Bridge Section 5 59
80 Figure 47: Alternative 2 - New Mezzanine (NTS) Mezzanine Plan 60 Section 5
81 Figure 48: Alternative 2 - New Mezzanine (NTS) Partial Platform Plan Section 5 61
82 Figure 49: Alternative 2 - New Mezzanine (NTS) Partial Longitudinal Section 62 Section 5
83 Approximately 20 wide x 75 long Canopy CCTV equipment Lighting Signage Paver tile floor New Entrance Pavilion Two elevators One stairway Service rooms CCTV equipment Lighting Signage Alternative 3B New Station Entrance Connecting to East and West Alternative 3B builds on Alternative 3A and connects to the potential CCT LRT station, (Refer to Figures 53, 54 and 55). In this alternative the LRT platform would be located above the pedestrian bridge with elevators providing access between the pedestrian bridge and LRT platform to allow LRT passengers to transfer to the new Metro mezzanine without crossing the LRT tracks or vice versa. However, it is not uncommon for LRT passengers to cross LRT tracks atgrade provided a safe access condition is available. While the primary design concept in this study shows the LRT and pedestrian bridge at different elevations a section is included that shows the LRT and pedestrian at the same elevation (Refer to Figure 55). In addition to the program elements described in Alternative 3A, Alternative 3B would include: LRT Station (To be provided by others) LRT platform 35 wide and 300 long Two elevators connecting the pedestrian bridge to the LRT platform Two elevators between the LRT platform and the sidewalk Two escalator/stairs arrays between the LRT platform and the sidewalk Two windscreens and benches Service Rooms CCTV equipment Two off-vehicle fare vendors Two SmarTrip Vendors Signage and lighting Pedestrian Bridge Connecting to LRT Platform Approximately long and 20 wide (depending on LRT station design) Canopy CCTV equipment Signage and lighting Paver tile floor New service rooms would be built to support operation and maintenance of the new mezzanine. The new entrance pavilion, pedestrian bridge and mezzanine would have a metal framed glass enclosure and metal framed glass roof canopy. The size and design of the new LRT station would be based on the ultimate demand. The number of escalator/stair arrays, elevators and fare collection equipment shown are estimates based on initial projections. A more detailed demand analysis to determine the forecasted ridership at the Shady Grove station would be needed. Improvement 3C New Station Entrance Connecting to Redland Road Improvement 3C provides a new southern aerial mezzanine built over the existing Shady Grove platform and connects to the Redland Road Bridge via a pedestrian bridge located on the east side of the Metrorail tracks (Refer to Figure 56: Improvement 3C New Station Entrance Connecting to Redland Road). The functionality and design elements of the new mezzanine in Improvement 3C are the same as in Improvement 3B. The difference is the location of the pedestrian bridge. The pedestrian bridge in Improvement 3C crosses over the existing Metrorail inbound tracks and extends approximately 300 feet south from the Shady Grove Station then connects to Redland Road. The new mezzanine layout is similar to Improvement 3B with respect to the kiosk, fare gates, elevators, and escalator stair array. However, the service rooms and fare vending machines are configured to adapt to the location for the pedestrian bridge. The electrical and mechanical requirements would also be similar to those described in Improvement 3B. The size and design of the new mezzanine, pedestrian bridge and the new entrance at Redland Road Bridge would be based on the ultimate demand. The number of escalator/stair arrays, elevators and fare collection equipment shown are estimates based on initial projections. A more detailed demand analysis to determine the forecasted ridership at the Shady Grove station would be needed. The existing Redland Road Bridge is 70 feet wide with 10 feet sidewalks located in both the eastbound and westbound direction. Access to the pedestrian bridge is an important consideration. Modifications to the Redland Road Bridge would be required to connect to the new pedestrian bridge and to provide good pedestrian access. Sidewalk improvements would be needed along Redland Road to ensure a safe walking environment. Since much of the new development this entrance Section 5 63
84 Figure 50: Alternative 3A - New Second Entrance (NTS) New Mezzanine Plan 64 Section 5
85 Figure 51: Alternative 3A - New Second Entrance (NTS) Longitudinal Section Section 5 65
86 Figure 52: Alternatives 3A & 3B - New Entrance Pavilion (NTS) Plan and Elevation Views 66 Section 5
87 Figure 53: Alternative 3B - New Second Entrance with LRT (NTS) Mezzanine Plan Section 5 67
88 would serve is located south of Redland Road, crossing Redland Road is an important factor. Consideration must be given to the location of crosswalks and pedestrian activated signals to ensure a pedestrian friendly environment. New Station Mezzanine Kiosk Fare gates, one accessible Two elevators One escalator/stair array Service Rooms Fare vendors and Smartrip dispensers Exit fare machines Map case with telephones (one text telephone) Advertising panels and dioramas Paver tile floor Lighting and signage CCTV equipment Passenger Information Displays (PIDS) Trash receptacle Pedestrian Bridge Approximately 20 wide x 200 long with canopy Paver tile floor CCTV equipment Signage and lighting New service rooms would be built to support the maintenance and operation of the new mezzanine. Evaluation of Alternatives Table 10 compares the potential improvements with respect to evaluation criteria derived from study goals. Evaluation criteria are reported on a relative scale and are meant for qualitative comparison only. Currently there is crowding on the Shady Grove station platform during peak periods, which will only worsen with increased ridership. Additional vertical circulation is needed to serve existing demand as well as future demand. Alternative 1 (1A and 1B) would provide additional vertical circulation and faregate capacity at the existing mezzanine to reduce the platform and mezzanine crowding. Due to the need to relocate the service rooms, there is significant infrastructure cost required to add new vertical circulation and all the passengers would still enter the station mezzanine from the same access point. Expanding the existing mezzanine (Alternative 2) to add new faregates and vertical circulation to the north is a lower cost option given the service rooms would not have to be relocated. The advantage of this alternative is that the expanded mezzanine would better accommodate the passenger volumes. However, all the passengers would still enter the station from the existing passageways. Building a second entrance is another alternative (Alternatives 3A, 3B and 3C) for serving the future demand. The advantage of an additional entrance is that it would distribute the demand between two entrances and would better serve future development to the south. A second entrance could also accommodate a direct connection to the potential CCT LRT alignment, optimizing passenger convenience. The estimated costs of Alternatives 1, 3A and 3B are similar due to the extent of infrastructure work required to add vertical circulation at the existing entrance. Summary There are capacity issues today at the Shady Grove Station based on existing demand. Ridership growth is expected to continue straining the capacity at the station. Additional vertical circulation is needed to address this crowding. One of Metro s roles as regional transit agency is to study station access alternatives and evaluate their effectiveness.. This study provides alternatives requiring different levels of capital investment for increasing capacity within the Shady Grove Station. The Sector Plan provides a framework for future development of the Shady Grove area that will transform the area into a lively mixed-use community. Improving access to the Shady Grove Station is a critical component to implementing the Sector Plan recommendations. In general, the access improvements identified in the Sector Plan meet Metro s operational needs for pedestrian, bicycle, bus, Kiss & Ride, and parking. As development occurs the access improvements will be further refined as part of the site plan development process to ensure that Metro s transit operations and access needs are met. This access study is based on the development footprint recommended in the adopted Sector Plans. Access alternatives based on other development scenarios have not been considered. The decision about whether to modify the station and/or which Alternative to construct will be a collaborative one between Metro, MDOT, Montgomery County, and other stakeholders. As part of that process, those groups would determine which improvement is most desirable and feasible. As discussed, all alternatives would provide benefits related to the study goals to varying degrees. 68 Section 5
89 Figure 54: Alternative 3B - New South Entrance with Grade Separated LRT (NTS) Cross Section Figure 55: Alternative 3B - New South Entrance with Pedestrian Bridge Connecting to LRT (NTS) Cross Section Section 5 69
90 Figure 56: Alternative 3C - New Station Entrance Connecting to Redland Road (NTS) Partial Plan and Logitudinal Section 70 Section 5
91 Table 9: Evaluation for Improvement Alternatives Evaluation Criteria Increase convenience of Metrorail Increase Metrorail Riders Increase Pedestrian Safety Increase Attractiveness to Developers and Residents Decrease Emergency Evaculation Time Estimated Project Cost FY10$(M)* 1A - Additional Vertical Circulation 1B - Additional Faregates 2 - Additional Vertical Circulation and Faregates 3A - Second Entrance East Side 3B - Second Entrances East & West Sides 3C - Second Entrance to Redland Road Yes Somewhat Yes Yes Yes Somewhat No No No Yes Yes Somewhat Yes No Yes Yes Yes Yes Somewhat No Somewhat Yes Yes Somewhat Somewhat No Yes Yes Yes Yes * Estimates include construction, planning, engineering, construction management, and administrative costs and are considered order of magnitude in scale for planning purposes only. Estimates originally in FY08$ have been escalated to FY10$ using a 4% escalation factor. Section 5 71

92


93 References References Shady Grove Station Access Improvement Study
Bi-County Transitway/ Bethesda Station Access Demand Analysis
 Bi-County Transitway/ Bethesda Station Access Demand Analysis Prepared for: Washington Metropolitan Area Transit Authority Office of Planning and Project Development May 2005 Prepared by: in conjunction
Acknowledgements. Lead Agency: Consultant: Washington Metropolitan Area Transit Authority Station Area Planning and Asset Management
 Acknowledgements Lead Agency: Consultant: Washington Metropolitan Area Transit Authority Station Area Planning and Asset Management Steven E. Goldin, Director Robin McElhenny, Manager of Station Area Planning
Maryland Gets to Work
 I-695/Leeds Avenue Interchange Reconstruction Baltimore County Reconstruction of the I-695/Leeds Avenue interchange including replacing the I-695 Inner Loop bridges over Benson Avenue, Amtrak s Northeast
NAVY YARD BALLPARK STATION ACCESS IMPROVEMENTS STUDY. Final Report. Washington Metropolitan Area Transit Authority
 NAVY YARD BALLPARK STATION ACCESS IMPROVEMENTS STUDY Final Report Washington Metropolitan Area Transit Authority Office of Real Estate and Station Planning April 2016 [This page intentionally left blank]
CEDAR AVENUE TRANSITWAY Implementation Plan Update
 CEDAR AVENUE TRANSITWAY Implementation Plan Update EECUTIVE SUMMARY DECEMBER 2015 Executive Summary In 2013, the Twin Cities metropolitan area s first bus rapid transit (BRT) line, the METRO Red Line,
ANDERSON PROPERTY SITE ANALYSIS
 ANDERSON PROPERTY SITE ANALYSIS Introduction The Montgomery County Department of Transportation (MCDOT) initiated a feasibility study in the fall of 2012 to evaluate the need for transit service expansion
METRO Orange Line BRT American Boulevard Station Options
 METRO Orange Line BRT American Boulevard Station Options Bloomington City Council Work Session November 18, 2013 Christina Morrison BRT/Small Starts Project Office Coordinating Planning and Design AMERICAN
EUGENE-SPRINGFIELD, OREGON EAST WEST PILOT BRT LANE TRANSIT DISTRICT
 EUGENE-SPRINGFIELD, OREGON EAST WEST PILOT BRT LANE TRANSIT DISTRICT (BRIEF) Table of Contents EUGENE-SPRINGFIELD, OREGON (USA)... 1 COUNTY CONTEXT AND SYSTEM DESCRIPTION... 1 SYSTEM OVERVIEW... 1 PLANNING
Address Land Use Approximate GSF
 M E M O R A N D U M To: Kara Brewton, From: Nelson\Nygaard Date: March 26, 2014 Subject: Brookline Place Shared Parking Analysis- Final Memo This memorandum presents a comparative analysis of expected
Executive Summary. Draft Environmental Impact Statement/Environmental Impact Report ES-1
 Executive Summary Introduction The Eastside Transit Corridor Phase 2 Project is a vital public transit infrastructure investment that would provide a transit connection to the existing Metro Gold Line
Executive Summary. Treasure Valley High Capacity Transit Study Priority Corridor Phase 1 Alternatives Analysis October 13, 2009.
 Treasure Valley High Capacity Transit Study Priority Corridor Phase 1 Alternatives Analysis October 13, 2009 Background As the Treasure Valley continues to grow, high-quality transportation connections
Public Meeting. City of Chicago Department of Transportation & Department of Housing and Economic Development
 Public Meeting City of Chicago Department of Transportation & Department of Housing and Economic Development Funded by Regional Transportation Authority September 12, 2011 In partnership with Presentation
5. OPPORTUNITIES AND NEXT STEPS
 5. OPPORTUNITIES AND NEXT STEPS When the METRO Green Line LRT begins operating in mid-2014, a strong emphasis will be placed on providing frequent connecting bus service with Green Line trains. Bus hours
RTSP Phase II Update
 Washington Metropolitan Area Transit Authority RTSP Phase II Update Presentation to the Technical Advisory Group July 18, 2013 Meeting 1 Presentation Outline RTSP Integration with Momentum RTSP Process
Click to edit Master title style
 Nelson/Nygaard Consulting Associates SERVICE IMPROVEMENT STRATEGIES September 22, 2015 1 PROJECT OVERVIEW & WORK TO DATE 1. Extensive stakeholder involvement Throughout 2. System and market assessment
Waco Rapid Transit Corridor (RTC) Feasibility Study
 Feasibility Study") Waco Rapid Transit Corridor (RTC) Feasibility Study Chris Evilia, Director of Waco Metropolitan Planning Organization Allen Hunter, General Manager Waco Transit System Jimi Mitchell, Project Manager AECOM
Waco Rapid Transit Corridor (RTC) Feasibility Study Chris Evilia, Director of Waco Metropolitan Planning Organization Allen Hunter, General Manager Waco Transit System Jimi Mitchell, Project Manager AECOM
BROWARD BOULEVARD CORRIDOR TRANSIT STUDY
 BROWARD BOULEVARD CORRIDOR TRANSIT STUDY FM # 42802411201 EXECUTIVE SUMMARY July 2012 GOBROWARD Broward Boulevard Corridor Transit Study FM # 42802411201 Executive Summary Prepared For: Ms. Khalilah Ffrench,
Chapter 4 : THEME 2. Transportation
 Chapter 4 : THEME 2 Strengthen connections to keep the Central Area easy to reach and get around 55 Figure 4.2.1 Promote region-wide transit investments. Metra commuter rail provides service to the east,
US 29 Bus Rapid Transit Planning Board Briefing. February 16, 2017
 US 29 Bus Rapid Transit Planning Board Briefing February 16, 2017 Project Goals Improve the quality of transit service Improve mobility opportunities and choices Enhance quality of life Support master
Appendix B. Tier 2 Final Environmental Assessment I-66 Transit/TDM Technical Report
 Tier 2 Final Environmental Assessment I-66 Transit/TDM Technical Report Appendix B Bus Bay, Maintenance, and Storage Capacity Analysis Technical Memorandum FINAL MAY 2016 INTRODUCTION This technical memorandum
King County Metro. Columbia Street Transit Priority Improvements Alternative Analysis. Downtown Southend Transit Study. May 2014.
 King County Metro Columbia Street Transit Priority Improvements Alternative Analysis Downtown Southend Transit Study May 2014 Parametrix Table of Contents Introduction... 1 Methodology... 1 Study Area...
Location Concept Plan Amendment Recommendation Approved 2011 Concept Plan
 Valley Line West LRT Concept Plan Recommended Amendments Lewis Farms LRT Terminus Site Location Concept Plan Amendment Recommendation Approved 2011 Concept Plan Lewis Farms LRT terminus site, 87 Avenue/West
Transit Hub Case Study: Owings Mills Metro Station. By: Kathleen Cary Rose, J. Luke Byrne and Catherine Buhler
 Executive Summary Transit Hub Case Study: Owings Mills Metro Station By: Kathleen Cary Rose, J. Luke Byrne and Catherine Buhler The purpose of the Transit Hub Case Study is to identify and evaluate the
Service Quality: Higher Ridership: Very Affordable: Image:
 Over the past decade, much attention has been placed on the development of Bus Rapid Transit (BRT) systems. These systems provide rail-like service, but with buses, and are typically less expensive to
Green Line Long-Term Investments
 Enhancements Short-term improvements to keep Austin moving. Investments Long-term projects to support our future. Mobility Hubs MetroRapid MetroRail MetroExpress Connectors Circulators Project Connect
Letter EL652 City of Mercer Island. Page 1. No comments n/a
 Letter EL652 City of Mercer Island Page 1 No comments n/a Page 2 Response to comment EL652 1 Section 4.5.3 of the Final EIS presents the range of potential impacts of the project. This project also lists
UCLA Lake Arrowhead Conference. October 18, 2010
 BART Click to Capacity edit Master Overview title style for UCLA Lake Arrowhead Conference October 18, 2010 0 BART Basics 360,000 daily riders 104 miles 43 stations 1.3 billion annual passenger miles 1
UTA Transportation Equity Study and Staff Analysis. Board Workshop January 6, 2018
 UTA Transportation Equity Study and Staff Analysis Board Workshop January 6, 2018 1 Executive Summary UTA ranks DART 6 th out of top 20 Transit Agencies in the country for ridership. UTA Study confirms
A Transit Plan for the Future. Draft Network Plan
 A Transit Plan for the Future Draft Network Plan Project Overview and Status Completed Market Analysis and Service Evaluation. Developed Plan Framework and Guiding Principles. Developed a draft Five Year
ConnectGreaterWashington: Can the Region Grow Differently?
 Washington Metropolitan Area Transit Authority ConnectGreaterWashington: Can the Region Grow Differently? Transportation Planning Board (TPB) Travel Forecasting Subcommittee July 17, 2015 1 Alternatives
Kendall Drive Premium Transit PD&E Study Project Kick-Off Meeting SR 94/Kendall Drive/SW 88 Street Project Development and Environment (PD&E) Study
 Study") Florida Department of Transportation District Six Kendall Drive Premium Transit PD&E Study Project Kick-Off Meeting SR 94/Kendall Drive/SW 88 Street Project Development and Environment (PD&E) Study What
Florida Department of Transportation District Six Kendall Drive Premium Transit PD&E Study Project Kick-Off Meeting SR 94/Kendall Drive/SW 88 Street Project Development and Environment (PD&E) Study What
Project Status Update January 2017
 Project Status Update January 2017 1 What is the Purple Line? A new 16 mile east-west light rail line Operates mostly on the surface with 21 stations Connects New Carrollton in Prince George s County and
UCLA Lake Arrowhead Conference. October 18, 2010
 BART Click to Capacity edit Master Overview title style for UCLA Lake Arrowhead Conference October 18, 2010 0 BART Basics 360,000 daily riders 104 miles 43 stations 1.3 billion annual passenger miles 1
UCLA Lake Arrowhead Conference. October 18, 2010
 BART Click to Capacity edit Master Overview title style for UCLA Lake Arrowhead Conference October 18, 2010 0 BART Basics 360,000 daily riders 104 miles 43 stations 1.3 billion annual passenger miles 1
FREQUENTLY ASKED QUESTIONS
 FREQUENTLY ASKED QUESTIONS 2018 What is the More MARTA Atlanta program? The More MARTA Atlanta program is a collaborative partnership between MARTA and the City of Atlanta to develop and implement a program
Franconia Springfield Station Vision Plan
 Franconia Springfield Station Vision Plan September 2008 Prepared for the Washington Metropolitan Area Transit Authority (Metro) Washington Metropolitan Area Transit Authority TABLE OF CONTENTS SECTION
Countywide Transit Corridors Functional Master Plan. Appendix 13 BRT Station Typology
 Countywide Transit Corridors Functional Master Plan Appendix 13 BRT Station Typology Tower 1, 10 th Floor 100 S. Charles Street Baltimore, MD 21201-2727 (410) 727-5050 Memorandum To: Larry Cole, M-NCPPC
Traffic Management Plan and Queuing Analysis Lakehill Preparatory School Z Hillside Drive, Dallas, TX October 27, 2015
 Traffic Management Plan and Queuing Analysis Lakehill Preparatory School Z145-235 2720 Hillside Drive, Dallas, TX October 27, 2015 Introduction: The Lakehill Preparatory School is located on the northeast
4.0 TIER 2 ALTERNATIVES
 4.0 TIER 2 ALTERNATIVES The Tier 2 Alternatives represent the highest performing Tier 1 Alternatives. The purpose of the Tier 2 Screening was to identify the LPA utilizing a more robust list of evaluation
Key Transfer Stations - Technical Memo
 DOCUMENT 5 October 2008 Key - Technical Memo 1.0 INTRODUCTION In May 2008 Council approved a Primary Rapid Transit Network which includes both Light Rail Transit (LRT) and Bus Rapid Transit (BRT) corridors.
CLRP. Performance Analysis of The Draft 2014 CLRP. Long-Range Transportation Plan For the National Capital Region
 NATIONAL CAPITAL REGION TRANSPORTATION PLANNING BOARD Item 12 CLRP Financially Constrained Long-Range Transportation Plan For the National Capital Region 2014 Performance Analysis of The Draft 2014 CLRP
QUALITY OF LIFE EXECUTIVE SUMMARY REPORT I O N S TAT I O N
 QUALITY OF LIFE EXECUTIVE SUMMARY REPORT UN I O N S TAT I O N T R AV E L by TR A I N Published September 2017 2015 PROGRESS MAP This document reports FasTracks progress through 2015 BACKGROUND RTD The
Develop ground transportation improvements to make the Airport a multi-modal regional
 Project Overview TRANSPORTATION IMPROVEMENTS WHAT ARE THE PROJECT GOALS? Transportation transportation hub. Develop ground transportation improvements to make the Airport a multi-modal regional Land Use
West Broadway Transit Study. Community Advisory Committee September 17, 2015
 West Broadway Transit Study Community Advisory Committee September 17, 2015 Introductions Community Engagement Summer Outreach Fall Outreach Technical Analysis Process Update Alternatives Review Economic
Alternatives Analysis Findings Report
 6.0 This chapter presents estimates of the potential capital, operations and maintenance costs associated with the alternatives carried forward for detailed evaluation. The methodology used to develop
Pedestrians, Cars, Buses and Trains? Considerations for Rapid Transit Service at Western University
 Pedestrians, Cars, Buses and Trains? Considerations for Rapid Transit Service at Western University Shift: The City of London s Rapid Transit Proposal Shift: The City of London s Rapid Transit Proposal
Preliminary Definition of Alternatives. 3.0 Preliminary Definition of Alternatives
 3.0 What preliminary alternatives are being evaluated? The alternatives for the East San Fernando Valley Transit Corridor project that were considered for screening include the No Build Alternative, Transportation
APPENDIX VMT Evaluation
 APPENDIX 2.7-2 VMT Evaluation MEMORANDUM To: From: Mr. Jonathan Frankel New Urban West, Incorporated Chris Mendiara LLG, Engineers Date: May 19, 2017 LLG Ref: 3-16-2614 Subject: Villages VMT Evaluation
August 2, 2010 Public Meeting
 Public Meeting LYMMO Expansion Alternatives Analysis Study Purpose of study is to provide a fresh look at potential LYMMO expansion, following Federal Transit Administration (FTA) Alternatives Analysis
Attachment 5. High Speed Transit Planning Study REPORT SUMMARY. Prepared by: City of Edmonton Transportation Planning Branch. Stantec Consulting Ltd.
 Attachment 5 High Speed Transit Planning Study Prepared by: City of Edmonton Transportation Planning Branch Stantec Consulting Ltd. Transportation Management & Design, Inc. with Lea Consulting Ltd. [135-35130]
Transit City Etobicoke - Finch West LRT
 Delcan Corporation Transit City Etobicoke - Finch West LRT APPENDIX D Microsimulation Traffic Modeling Report March 2010 March 2010 Appendix D CONTENTS 1.0 STUDY CONTEXT... 2 Figure 1 Study Limits... 2
Analysis of Radial and Trunk Feeder Transit System Configurations in Downtown Charlottesville
 Analysis of Radial and Trunk Feeder Transit System Configurations in Downtown Charlottesville 1. Introduction During the stakeholder input sessions of Charlottesville Area Transit s (CAT) Transit Development
East Falls Church Ballston-MU Virginia Sq-GMU
 Arlington Cou Fairfax C ORANGE LINE Vienna/Fairfax-GMU Dunn Loring-Merrifield West Falls Church-VT/UVA East Falls Church Ballston-MU Virginia Sq-GMU Clarendon Court House Prepared for Arlington County,
The Engineering Department recommends Council receive this report for information.
 CORPORATE REPORT NO: R161 COUNCIL DATE: July 23, 2018 REGULAR COUNCIL TO: Mayor & Council DATE: July 19, 2018 FROM: General Manager, Engineering FILE: 8740-01 SUBJECT: Surrey Long-Range Rapid Transit Vision
Transit Access to the National Harbor
 Transit Access to the National Harbor December 2014 Table of Contents Executive Summary... 3 Introduction and Project Purpose... 6 Methodology.. 9 Definition of Alternatives..... 9 Similar Project Implementation
Troost Corridor Transit Study
 Troost Corridor Transit Study May 23, 2007 Kansas City Area Transportation Authority Agenda Welcome Troost Corridor Planning Study Public participation What is MAX? Survey of Troost Riders Proposed Transit
FINAL. Sound Transit Long-Range Plan Update. Issue Paper S.1: Tacoma Link Integration with Central Link. Prepared for: Sound Transit
 Sound Transit Long-Range Plan Update Issue Paper S.1: Tacoma Link Integration with Central Link Prepared for: Sound Transit Prepared by: Quade & Douglas, Inc. FINAL March 2005 Foreword This issue paper
Bus Rapid Transit. Jennifer Flynn and Cheryl Thole Senior Research Associates Commuter Choice Workshop January 2012 Tampa, FL
 Bus Rapid Transit Jennifer Flynn and Cheryl Thole Senior Research Associates Commuter Choice Workshop January 2012 Tampa, FL What is Bus Rapid Transit? BRT is an enhanced bus system that operates on bus
2.0 Development Driveways. Movin Out June 2017
 Movin Out June 2017 1.0 Introduction The proposed Movin Out development is a mixed use development in the northeast quadrant of the intersection of West Broadway and Fayette Avenue in the City of Madison.
CITY OF LONDON STRATEGIC MULTI-YEAR BUDGET ADDITIONAL INVESTMENTS BUSINESS CASE # 6
 2016 2019 CITY OF LONDON STRATEGIC MULTI-YEAR BUDGET ADDITIONAL INVESTMENTS BUSINESS CASE # 6 STRATEGIC AREA OF FOCUS: SUB-PRIORITY: STRATEGY: INITIATIVE: INITIATIVE LEAD(S): BUILDING A SUSTAINABLE CITY
I-20 EAST TRANSIT INITIATIVE Tier 1 and Tier 2 Alternatives Screening Report EXECUTIVE SUMMARY
 EXECUTIVE SUMMARY The purpose of this report is to document the results of the Tier 1 and Tier 2 Screening of alternatives for the I-20 East Transit Initiative. The two-tier screening process presented
THE WAY WE MOVE LRT FOR EVERYONE
 THE WAY WE MOVE LRT FOR EVERYONE 2 LRT for Everyone LRT FOR EVERYONE Light rail is about more than transit; it s about transforming Edmonton. As the city grows, so do its transportation needs. LRT is an
HDR Engineering. HART North / South. Tampa Bay Applications Group Meeting May 14, 2009
 HDR Engineering HART North / South BRT Corridor PD&E Tampa Bay Applications Group Meeting May 14, 2009 1 Agenda Update on Project Development and Environment (PD&E) Study Project Overview System Branding
Help shape your community investment in Wake Transit. Fiscal Year 2019 Draft Work Plan Summary
 Help shape your community investment in Wake Transit Fiscal Year 2019 Draft Work Plan Summary Wake County, growth and transit The Triangle is one of the fastest-growing regions in the nation. Wake County
San Francisco Transportation Plan Update
 San Francisco Transportation Plan Update SPUR August 1, 2011 www.sfcta.org/movesmartsf twitter.com/sanfranciscota www.facebook.com/movesmartsf How does the RTP relate to the SFTP? Regional Transportation
1 Downtown LRT Connector: Draft Concept
 Downtown LRT Connector: Draft Concept Plan November 2010 We re moving forward. Get involved. On June 21, 2010, City Council approved a street-level downtown LRT route, including a connector for the future
Table of Contents INTRODUCTION... 3 PROJECT STUDY AREA Figure 1 Vicinity Map Study Area... 4 EXISTING CONDITIONS... 5 TRAFFIC OPERATIONS...
 Crosshaven Drive Corridor Study City of Vestavia Hills, Alabama Table of Contents INTRODUCTION... 3 PROJECT STUDY AREA... 3 Figure 1 Vicinity Map Study Area... 4 EXISTING CONDITIONS... 5 TRAFFIC OPERATIONS...
Station Evaluation. Durham-Orange Light Rail Transit Project Spring 2012
 Station Evaluation Durham-Orange Light Rail Transit Project Spring 2012 Key Ingredients for Station Development Platform Designs UNC Hospitals Station The UNC Hospitals Station Option D would be the westerly
Presentation Overview. Stop, Station, and Terminal Capacity
 Stop, Station, and Terminal Capacity Mark Walker Parsons Brinckerhoff Presentation Overview Brief introduction to the project Station types & configurations Passenger circulation and level of service Station
Mercer Island Center for the Arts Parking Management Plan
 Parking Stalls Mercer Island Center for the Arts Parking Management Plan June 15, 2016 This Parking Management Plan (P) covers all tenants at the Mercer Island Center for the Arts (MICA) campus, including
Madison BRT Transit Corridor Study Proposed BRT Operations Plans
 Madison BRT Transit Corridor Study Proposed BRT Operations Plans This paper presents a description of the proposed BRT operations plan for use in the Madison BRT Transit Corridor Study. The objective is
BERKELEY DOWNTOWN AREA PLAN PROGRAM ENVIRONMENTAL IMPACT REPORT TRAFFIC IMPACT ANALYSIS
 BERKELEY DOWNTOWN AREA PLAN PROGRAM ENVIRONMENTAL IMPACT REPORT TRAFFIC IMPACT ANALYSIS Prepared for: City of Berkeley Prepared by: REVISED JANUARY 9, 2009 Berkeley Downtown Area Plan Program EIR Traffic
Midtown Corridor Alternatives Analysis Key Issues Memo
 Midtown Corridor Alternatives Analysis Key Issues Memo 1/4/2013 Prepared by the SRF Consulting Group Team for Table of Contents Introduction... 1 1. Markets... 1 External Markets... 1 Intra-Corridor Travel...
TBARTA USF to Wesley Chapel Express Bus Service Operating Plan. Draft 3/25/2014
 TBARTA USF to Wesley Chapel Express Bus Service Operating Plan Draft 3/25/2014 March 2014 Table of Contents 1.0 Introduction... 1 2.0 Study Area... 1 3.0 Existing Available Service... 3 4.0 Proposed Service...
V03. APTA Multimodal Operations Planning Workshop August Green Line LRT
 V03 APTA Multimodal Operations Planning Workshop August 2016 Green Line LRT 2 Presentation Outline Past Present Future 3 16/03/2016 RouteAhead Update 4 4 16/03/2016 RouteAhead Update 5 5 16/03/2016 6 6
Chapter 7: Travel Demand Analysis. Chapter 8. Plan Scenarios. LaSalle Community Center. Image Credit: Town of LaSalle
 Chapter 7: Travel Demand Analysis Chapter 8 Plan Scenarios LaSalle Community Center. Image Credit: Town of LaSalle 164 Chapter 8: Plan Scenarios Moving Ahead for Progress in the 21 st Century Act (MAP
This letter summarizes our observations, anticipated traffic changes, and conclusions.
 Mr. David Jorschumb Project Manager Boulder Valley School District Re: Review of proposed school access improvements at the Foothills Elementary School in Boulder Dear Mr. Jorschumb, At your request, the
Downtown Transit Connector. Making Transit Work for Rhode Island
 Downtown Transit Connector Making Transit Work for Rhode Island 3.17.17 Project Evolution Transit 2020 (Stakeholders identify need for better transit) Providence Core Connector Study (Streetcar project
Pace Bus Depot Location Analysis
 Pace Bus Depot Location Analysis Key Notes 1. Options refer to conceptual sketches prepared by Kimley Horn. 2. The depot is assumed to accommodate Pace routes as they currently exist: 17 routes on the
Tempe Streetcar. March 2, 2016
 Tempe Streetcar March 2, 2016 Tempe Profile 40 sq. miles, highest density in state University Town, center of region Imposed growth boundaries (density increase) Mixed use growth/intensifying land use
West Broadway Reconstruction/LRT Design. March 19, 2015
 West Broadway Reconstruction/LRT Design March 19, 2015 1 Meeting Agenda 6:05 6:30 PM Brief presentation What we heard Project overview 6:30 8:00 PM Visit Six Topic Areas Road and LRT design elements Pedestrian
Intermodal Regional Planning INTERCITY BUS PILOT PROGRAM. October 1, 2010 Presentation Bob Kuhns, Clark Nexsen (Washington, DC)
") Intermodal Regional Planning INTERCITY BUS PILOT PROGRAM October 1, 2010 Presentation Bob Kuhns, Clark Nexsen (Washington, DC) Intercity Bus (Service) Features FTA Definition Over-the-road bus Regularly
Intermodal Regional Planning INTERCITY BUS PILOT PROGRAM October 1, 2010 Presentation Bob Kuhns, Clark Nexsen (Washington, DC) Intercity Bus (Service) Features FTA Definition Over-the-road bus Regularly
Chicago Transit Authority Service Standards and Policies
 Chicago Transit Authority Service Standards and Policies Overview and Objectives The Chicago Transit Authority (CTA) has revised its Service Standards and Policies in accordance with Federal Transit Administration
APPENDIX B Traffic Analysis
 APPENDIX B Traffic Analysis Rim of the World Unified School District Reconfiguration Prepared for: Rim of the World School District 27315 North Bay Road, Blue Jay, CA 92317 Prepared by: 400 Oceangate,
Capital Needs Assessment Riders Advisory Council July2, 2008
 Capital Needs Assessment 2011-2020 Riders Advisory Council July2, 2008 1 Outline I. Capital Improvement Plan History II. Capital Improvement Plan Update III. Capital Needs Assessment State of Good Repair
CTfastrak Expansion. Stakeholder Meeting #4 Manchester Town Hall June 3, 2016
 CTfastrak Expansion Stakeholder Meeting #4 Manchester Town Hall June 3, 2016 Today s Agenda Phase I Update 2016 Service Plan Implementation Schedule & Cost Update Phase II Services Timeline Market Analysis
6/6/2018. June 7, Item #1 CITIZENS PARTICIPATION
 June 7, 2018 Item #1 CITIZENS PARTICIPATION 1 Item #2 APPROVAL OF MINUTES Item #3 TRAC GOALS, FRAMEWORK & AGENDA REVIEW 2 COMMITTEE GOALS Learn about Southern Nevada s mobility challenges, new developments
Capital Metro Downtown Multimodal Station
 Capital Metro Downtown Multimodal Station Stakeholder Briefing December 11, 2015 Agenda 1 2 3 4 5 Project Summary Downtown Station Concept Evaluation 4 th Street Traffic Analysis 5 th Street Traffic Analysis
Public Meeting. March 21, 2013 Mimosa Elementary School
 Public Meeting March 21, 2013 Mimosa Elementary School Today s Meeting Purpose 2 Where We Are The Process What We ve Heard and Findings Transit Technologies Station Types Break-out Session Where We Are
WARES. October, 2018
 WARES October, 2018 1 Project Overview A new 16 mile east-west light rail line between Bethesda in Montgomery County and New Carrollton in Prince George s County Operates mostly on the surface with 21
RESU ULTS. nt & Delivery
 TRAVEL FORECASTSS RESU ULTS TECHNICAL REPORT August 2013 Transit Developmen nt & Delivery 100 South Charles Street Tower Two, Suite 700 Baltimore, Maryland 21201 August 2013 TABLE OF CONTENTS 1. Introduction...
CITY OF ANN ARBOR, MICHIGAN 301 E. Huron St., P.O. Box 8647 Ann Arbor, Michigan
 Date: Wednesday, June 18, 2014 Location: Ann Arbor District Library Attendees: 14 citizen attendees Ann Arbor Station Environmental Review Citizen Working Group Meeting Notes Meeting #3 The third meeting
Parks and Transportation System Development Charge Methodology
 City of Sandy Parks and Transportation System Development Charge Methodology March, 2016 Background In order to implement a City Council goal the City of Sandy engaged FCS Group in January of 2015 to update
Needs and Community Characteristics
 Needs and Community Characteristics Anticipate Population and Job Growth in the City Strongest density of population and jobs in Ann Arbor are within the Study Area Population expected to grow 8.4% by
appendix 4: Parking Management Study, Phase II
 appendix 4: Parking Management Study, Phase II A4-1 A4-2 Eastlake Parking Management Study Final Phase 2 Report Future Parking Demand & Supply January 6, 2017 Submitted by Denver Corp Center III 7900 E.
Metro Reimagined. Project Overview October 2017
 Metro Reimagined Project Overview October 2017 Reimagining Metro Transit Continuing our Commitment to: Provide mobility based on existing and future needs Value the role of personal mobility in the quality
VIRGINIA RAILWAY EXPRESS MANASSAS PARK STATION PARKING EXPANSION. Site Evaluation & Recommendation. October 18, 2016
 MANASSAS PARK STATION PARKING EXPANSION Site Evaluation & Recommendation October 18, 2016 1 INFORMATION ITEM Project Overview Parking Demand Site Evaluation VRE Recommended Preferred Alternative Next Steps
Energy Technical Memorandum
 Southeast Extension Project Lincoln Station to RidgeGate Parkway Prepared for: Federal Transit Administration Prepared by: Denver Regional Transportation District May 2014 Table of Contents Page No. Chapter
Point A Point B Point C Point D. Fulton County Board of Commissioners and Mayors Meeting December 14, 2017
 Fulton County Board of Commissioners and Mayors Meeting December 14, 2017 Master Plan Overview Phase 1 Community Vision and Existing Transit Conditions Phase 2 Scenario Development Phase 3 Transit Master
We Want Your Input! Review the design alternatives and tell us what s important to you in the design of these areas of the approved BRT Network:
 We Want Your Input! Review the design alternatives and tell us what s important to you in the design of these areas of the approved BRT Network: Richmond North of Oxford Street Richmond Row Dundas Street