NAVY YARD BALLPARK STATION ACCESS IMPROVEMENTS STUDY. Final Report. Washington Metropolitan Area Transit Authority
|
|
|
- Ashlie Carpenter
- 5 years ago
- Views:
Transcription


1 NAVY YARD BALLPARK STATION ACCESS IMPROVEMENTS STUDY Final Report Washington Metropolitan Area Transit Authority Office of Real Estate and Station Planning April 2016
2 [This page intentionally left blank]
3 Table of Contents Executive Summary... ES 1 1. Introduction Study Purpose and Overview Background Study Process Previous Studies Existing and Future Conditions Station Area Overview Land Use and Demographics Demographics Ridership Existing Station Facilities and Layout Observed Passenger Movements Simulation Modeling of Existing and Future Conditions Methodology Measures of Effectiveness (MOEs) Comparison of Existing Conditions and No Build Summary of No Build 2025 Conditions Design Options Agency and Stakeholder Feedback Initial Design Options Engineering Scan Existing Utilities and Station Vents Potential Engineering and Constructability Concerns Simulation Modeling of Build Alternatives Methodology Build Alternative Simulation Results by Measures of Effectiveness (MOEs) Summary of Build 2025 Simulations Conceptual Capital Cost Estimates Evaluation of Design Options Final Report i April 2016
4 9. Conclusions and Next Steps Conclusions Next Steps List of Figures Figure 1: Navy Yard Ballpark Station Study Area... 2 Figure 2: Site of Proposed Second East Entrance (Under Construction for Temporary Use)... 2 Figure 3: Future Land Use (DC Comprehensive Plan)... 5 Figure 4: Navy Yard Ballpark Station 10 Year Historic Ridership... 7 Figure 5: Navy Yard East Entrance (New Jersey Ave, SE and M Street, SE)... 9 Figure 6: Navy Yard West Entrance (Half Street and M Street, SE)... 9 Figure 7: East Mezzanine Faregates Figure 8: West Mezzanine Faregates Figure 9: Navy Yard Ballpark Station Mezzanine and Platform Plans Figure 10: Navy Yard Ballpark Station Section Figure 11: Existing East Entrance Peak Period Pedestrian Movements Figure 12: AM Peak Station Faregate Configurations Figure 13: AM Peak Passenger Congestion within Navy Yard Ballpark Station Figure 14: AM Peak 15 Minutes Pedestrian LOS for Passageways Platform Level Figure 15: AM Peak 15 Minutes Pedestrian LOS for Passageways Mezzanine Level Figure 16: Navy Yard Pedestrian Density Analysis Zones Figure 17: Location of Second East Entrance Design Options at Street Level Figure 18: Existing East Mezzanine Knockout Panel Figure 19: Entrance Location Figure 20: Entrance Location Figure 21: Entrance Location Figure 22: Navy Yard Ballpark Station East Mezzanine Improvements Figure 23: Proposed Locations of East Mezzanine Improvements Figure 24: Navy Yard Ballpark Station Section with Existing Station Vent and Proposed New Infrastructure (East Entrance Location 3) Figure 25: Build 2025, Alternative 1 New Complete Station Entrance Figure 26: Build 2025, Alternative 2 New Elevator Only Station Entrance Figure 27: AM Peak 15 Minutes Pedestrian LOS for Passageways Platform Level (Build 2025, Alternatives 1 and 2) Figure 28: AM Peak 15 Minutes Pedestrian LOS for Passageways Mezzanine Level (Build 2025, Alternatives 1 and 2) Figure 29: Navy Yard Pedestrian Density Analysis Zones Figure 30: Location of Selected VCEs within Navy Yard Ballpark Station (Build 2025, Alternative 1) Final Report ii April 2016
5 List of Tables Navy Yard Ballpark Station Access Improvements Study Table 1: Capitol Riverfront Development Summary: Future Build out... 6 Table 2: Navy Yard Ballpark Station Area Demographics... 6 Table 3: Forecast Average Weekday Boardings at Navy Yard Ballpark Station... 8 Table 4: Navy Yard Ballpark Station Mezzanine Facilities Table 5: AM Peak 15 Minutes Station Entries and Exits Existing Conditions, No Build Table 6: AM Peak Hour % LOS E and F Existing Conditions and No Build Table 7: Alighting Passenger Journey Time Existing Conditions and No Build 2025 (AM Peak) Table 8: Average AM Peak 15 Minutes Escalator Clearance Time Existing Conditions and No Build Table 9: Summary of Design Improvement Concepts per Build Alternative Table 10: AM Peak 15 Minutes Station Entries and Exits Build 2025 Alternatives Table 11: AM Peak Hour % Combined LOS E and F Existing Conditions, No Build 2025, and Build Table 12: Alighting Passenger Journey Time (AM Peak) Existing Conditions, No Build 2025, and Build Table 13: VCEs Selected for Queue Clearance Time Analysis Table 14: Average AM Peak 15 Minutes VCE Clearance Time Existing Conditions, No Build 2025, and Build Table 15: Conceptual Capital Cost Estimate Summary Table 16: Conceptual Capital Cost Estimate Summary Excavation Portion Only Table 17: Design Objectives and Corresponding Evaluation Criteria and Measures Table 18: East Mezzanine Improvements: Options 1A and 1B Table 19: Second East Entrance: Locations 1, 2, and Appendices Appendix A: Appendix B: Appendix C: Appendix D: Appendix E: Appendix F: Appendix G: Distribution of Station Entries and Exits for Existing Conditions, No Build 2025, and Build 2025 Simulations Existing and Future Metrorail Operating Plan Vertical Circulation Element (VCE) Capacity Analysis Faregate Capacity Analysis Detailed Engineering Scan Existing Station Area Utility Site Plans Detailed Capital Cost Estimates Additional Volumes Navy Yard Station Access Improvements Study Drawing Set Final Report iii April 2016
6 [This page intentionally left blank]
.")
.")

7 Executive Summary Introduction The Navy Yard Ballpark Station Access Improvements Study ( the study ) was conducted by the Washington Metropolitan Area Transit Authority (WMATA or Metro ) to conduct an analysis of the required station and access facilities for a second East Entrance at the Navy Yard Ballpark Metrorail station ( the station ). The station is located in Southeast, Washington, DC, and served by the Metrorail Green Line. The underground station is located along M Street, SE with entrances at New Jersey Avenue, SE, and Half Street, SE, in the Capitol Riverfront neighborhood (see Figure ES 1). The study examined typical non game day operations at the station and focused primarily on passenger activity at the East Mezzanine and East Entrance. As of 2014, the station had more than 10,000 passenger boardings on an average weekday. Ridership is expected to continue to increase to nearly 14,000 average daily passenger boardings by 2025 as additional phases of The Yards redevelopment and other nearby projects are constructed. A second East Entrance was considered for the southwest corner of New Jersey Avenue, SE and M Street, SE. The entrance would take advantage of a knockout panel located on the East Mezzanine and would be located on the site of a Planned Unit Development (PUD) to be developed by Forest City as part of The Yards redevelopment. This study conducted an analysis of the required station and access facilities to implement the proposed second East Entrance as described above. Site of second East Entrance with USDOT Headquarters in the background Knockout Panel on East Mezzanine to be used for second East Entrance Final Report ES 1 April 2016


 or east toward the Navy")


8 Navy Yard Ballpark Station Access Improvements Study Figure ES 1: Navy Yard Ballpark Station Study Area Existing Conditions and Passenger Movements Most passengers were seen exiting the station via the East Entrance during the AM peak, traveling towards the U.S. Department of Transportation (USDOT) or east toward the Navy Yard. During the PM peak, most passengers were seen entering the station via the East Entrance from the direction of the USDOT or from the east towards the Navy Yard. Within the station, congestion and queuing occurred during the AM peak at the East Mezzanine faregates and along the platform (particularly near the base of the escalator leading up to the East Mezzanine). During the PM peak, there was little to no congestion or queueing at either the East Mezzanine or Platform. Additionally, there was no congestion or queuing at the West Mezzanine during non game day operations for both the AM and PM peak. Congestion at East Mezzanine Faregates (left) and station platform (right) Final Report ES 2 April 2016
9 Existing (2015) and Future No Build (2025) Simulations Methodology Navy Yard Ballpark Station Access Improvements Study Station ridership was forecasted based on 2014 faregate data and adjusted for the future year (2025), simulating station entries and exits to account for future area population and employment growth. Metrorail operations assumed trains running every 6 minutes during peak periods and every 12 minutes during off peak periods (no change between 2015 and 2025). Simulation Results The Existing Conditions and No Build 2025 simulations resulted in increased congestion along the station platform (see Figure ES 2) and increased travel time for passengers exiting the station as well as waiting to board escalators, stairs, and elevators (see Table ES 1). Figure ES 2: AM Peak Passenger Congestion within Navy Yard Ballpark Station Existing Conditions No Build 2025 Crowding at base of escalator worsens Final Report ES 3 April 2016
10 Table ES 1: Passenger Journey Time and VCE Queue Clearance Time, AM Peak 15 Minutes, Existing Conditions and No Build 2025 Simulation Passenger Journey Time Platform to East Entrance (Minutes:Seconds) Escalator Queue Clearance Time (Minutes:Seconds) Platform to East Entrance Platform to East Mezzanine Existing Conditions 2:47 1:03 No Build :31 2:41 Design Options Three locations for a second East Entrance and two East Mezzanine improvement options were developed based on the No Build 2025 simulation results to provide access to the street level via the existing East Mezzanine knockout panel and to address future internal station deficiencies. Coordination with local agencies and stakeholders was helpful in providing specific guidance on station accessibility and design requirements, as well as potential entrance locations and site related concerns. Figure ES 3 shows the street level locations of the proposed second East Entrance. Figure ES 4 shows the potential East Mezzanine improvements. Figure ES 3: Proposed Second East Entrance Locations (Street Level) Existing East Entrance M Approximate Location of Knockout Panel Entrance Location 3 Complete Entrance Entrance Location 2 Elevator Only Entrance Location 1 Compete Entrance Final Report ES 4 April 2016

11 Figure ES 4: East Mezzanine Improvement Options (Mezzanine Level) Navy Yard Ballpark Station Access Improvements Study Engineering Scan None of the three East Entrance locations are likely serious conflicts to existing utility lines that run parallel to New Jersey Avenue, SE as well as M Street, SE. In addition, all three locations clear the existing station vents located along the south side of M Street, SE (see Figure ES 5), which extend just over 19 feet below street level (the station and new passageway ceiling sits at approximately 22 feet below street level). Figure ES 5: Navy Yard Ballpark Station Section with Existing Station Vent and Proposed New Infrastructure (Entrance Location 3) All three locations would require new elevator machine rooms, while Entrance Locations 1 and 3 would require new escalator control rooms. General electrical and mechanical upgrades would also be required as construction and installation of new equipment progresses. Final Report ES 5 April 2016
12 Simulation Modeling of Build Alternatives Navy Yard Ballpark Station Access Improvements Study Build Alternatives were developed to test the different second East Entrance locations and East Mezzanine improvement options and evaluate the benefits of proposed station improvements (see Figure ES 6). Figure ES 6: Build 2025 Alternatives (Mezzanine Level) Alternative 1 Alternative 2 Final Report ES 6 April 2016
13 Methodology The Build 2025 simulation model uses the same methodology, Metrorail train operations, and peak hour boardings and alightings as the No Build 2025 simulation. East Entrance entries and exits were adjusted based on the type of proposed station entrance: Build 2025, Alternative 1 Complete Entrance: Passengers were distributed equally between the existing and second East Entrance during the peak hours based on projected travel patterns to area destinations Build 2025, Alternative 2 Elevator Entrance: Passengers were assumed to be more likely to use the existing East Entrance during peak hours due to elevator wait times. Based on observed use of the new elevator only entrance at Rosslyn, approximately 25% of the passengers would use the second East Entrance. Simulation Results The Build 2025 simulations resulted in reduced platform congestion (see Figure ES 7), minimal time savings impacts for those exiting the station during the AM peak 15 minutes (see Table ES 2), and reduced wait times at platform to mezzanine escalators (see Table ES 3). Figure ES 7: AM Peak 15 Minutes Pedestrian LOS for Passageways Platform Level (Build 2025, Alternative 1) Table ES 2: Passenger Journey Time (AM Peak 15 Minutes) Platform to Existing East Entrance (Minutes: Seconds) Platform to Second East Entrance (Minutes: Seconds) Existing Conditions 2:47 No Build :31 Build 2025, Alternative 1 3:01 2:56 Build 2025, Alternative 2 3:04 3:30 Reduced crowding compared to No Build Final Report ES 7 April 2016
14 Table ES 3: Escalator/Stair Queue Clearance Time (AM Peak 15 Minutes) Platform to East Mezzanine Escalator (Existing) Navy Yard Ballpark Station Access Improvements Study Platform to East Mezzanine Stair (New) Existing Conditions 1:03 N/A * No Build :41 N/A * Build 2025, Alternative 1 0:37 0:37 Build 2025, Alternative 2 0:37 0:37 *Stair not included as part of the Existing Conditions or No Build simulations. Capital Cost Estimates Conceptual capital cost estimates were developed based on WMATA specifications and industry practices (see Table ES 4). Construction costs are based on current year dollars. Table ES 4: Capital Cost Estimate Summary Total Project Cost Conclusions Second East Entrance: Location 1 (Complete) Second East Entrance: Location 2 (Elevator Only) Station Entrance Canopy East Mezzanine Improvements: Option 1A East Mezzanine Improvements: Option 1B $36,036,000 $22,165,000 $2,574,000 $14,872,000 $17,875,000 By 2025, the Navy Yard Ballpark Metrorail station will experience increased passenger congestion based on Metrorail passenger forecasts, pedestrian simulation models, and projected future development within the Capital Riverfront neighborhood. To accommodate the increase in station activity, internal station improvements at the East Mezzanine are needed. Construction of an additional platform tomezzanine stair and elevator would improve internal passenger conditions and should be the primary focus of any capital improvements proposed for the station. A second East Entrance, while helpful in providing an additional entry and egress point for passengers, is not a priority capacity investment. However, should WMATA wish to include a new station entrance as part of its future plans, coordination between WMATA and the developer of the site will be necessary. Final Report ES 8 April 2016
15 1. Introduction This report summarizes the findings and conclusions of the Navy Yard Ballpark Station Access Improvements Study ( the study ) conducted by the Washington Metropolitan Area Transit Authority (WMATA or Metro ). 1.1 Study Purpose and Overview The purpose of this study was to conduct an analysis of the required station and access facilities for a second East Entrance at the Navy Yard Ballpark Metrorail station ( the station ). The existing East Entrance is currently located on the northwest corner of New Jersey Avenue, SE and M Street, SE, facing east. The proposed new entrance would be located on the southwest corner of New Jersey Avenue and M Street, SE. This new entrance would take advantage of an existing knockout panel located on the East Mezzanine opposite the pathway to the existing East Entrance, and provide additional access to accommodate development and attractions in the Capital Riverfront area. The study also identified additional infrastructure needed within the station, including potential new vertical circulation elements (VCEs), mezzanine extensions, and faregates to accommodate future ridership. Although the station serves Nationals Park, the study did not address game day conditions, focusing only on typical, nongame day conditions. Based on the study purpose, three goals were established in order to select the best station improvements: 1. Reduce crowding and improve passenger flows within the station 2. Guide timely future development and support the Capitol Riverfront neighborhood vision 3. Minimize construction impacts and provide cost effective solutions 1.2 Background The station is located in southeast Washington, DC, and served by the Metrorail Green Line. The underground station is located along M Street, SE with entrances at both ends of the Platform at New Jersey Avenue, SE, and Half Street, SE, in the Capitol Riverfront neighborhood. As of 2014, the station has more than 10,000 passenger boardings on an average weekday. Anchored by the Nationals Park Stadium, recent redevelopment in the Capitol Riverfront neighborhood has resulted in station ridership increasing by more than 50% over the past six years. Ridership is expected to continue to grow as additional phases of The Yards redevelopment and other nearby projects are constructed. The site of the second East Entrance for the Navy Yard Ballpark station, the southwest corner of New Jersey Avenue, SE and M Street, SE, is also the site of a Planned Unit Development (PUD) to be developed by Forest City as part of The Yards redevelopment. The site is currently under construction for interim uses, with new streetscapes anticipated in the short term and office development anticipated in the long term. Design options for the second East Entrance, as well as the entrance configuration and orientation, will ultimately depend on the PUD s long term program and future Final Report 1 April 2016
16 Navy Yard Ballpark Station Access Improvements Study tenants. Figure 1 shows the study area with the PUD and The Yards redevelopment highlighted. Figure 2 shows the site as it exists currently. Figure 1: Navy Yard Ballpark Station Study Area Figure 2: Site of Proposed Second East Entrance (Under Construction for Temporary Use) Final Report 2 April 2016
17 1.3 Study Process To understand internal capacity constraints, related safety concerns, and opportunities for improved access, WMATA analyzed existing conditions, ridership forecasts, and completed pedestrian simulation modeling for 2015 and Based on these simulation results, along with the coordination with area stakeholders, three design options were developed for a second East Entrance and two design options were developed for the East Mezzanine. From these design options, two Build Alternative simulations were developed, designed to test the benefits of specific station improvements shown in the Entrance locations and East Mezzanine improvements. MOEs were also used to compare the two Build Alternative simulations. 1.4 Previous Studies The current study references the following previous studies: M Street SE/SW Transportation Study (District Department of Transportation, 2012) The M Street SE/SW Transportation Study (2012) identified existing and future transportation challenges and solutions for the area along M Street SE/SW and the Southwest riverfront. Specific recommendations were developed for improving pedestrian access points to transit facilities and stations, capacity enhancements for the station, and improvements to the Metrorail Green Line. Capital Riverfront Urban Design Framework Plan (Capitol Riverfront BID, 2013) The Capitol Riverfront Urban Design Framework Plan (2013) is a strategic plan to guide public and private investment towards a vibrant neighborhood of urban density, regional attractions, and distinct local amenities. Specific recommendations from the plan that relate to the current study include providing a direct premium rapid transit link through the Capitol Riverfront neighborhood and providing a new station entrance south of the existing East Entrance along M Street, SE to allow for a more direct connection to the Anacostia River. Final Report 3 April 2016
18 2. Existing and Future Conditions This section summarizes the existing and future conditions at the Navy Yard Ballpark Metrorail station, including the surrounding neighborhood context, land use and demographics, historic and existing ridership, station facilities and layout, and observed passenger movements. 2.1 Station Area Overview The station is located in the Capitol Riverfront neighborhood in Southeast Washington, DC. The Capitol Riverfront neighborhood has experienced an increased amount of redevelopment over the past decade. Both public and private investment has transformed the mostly underutilized industrial land into a vibrant urban neighborhood with high density residential and commercial uses, regional attractions, and major employers. Neighborhood anchors include Nationals Park Stadium, the U.S. Department of Transportation (USDOT), and the Washington Navy Yard. 2.2 Land Use and Demographics Land Use and Zoning The area surrounding the station is zoned for a mix of uses, varying from lower density housing farther away from the Metrorail station entrances to higher density housing and commercial development closest to the station entrances. The immediate area around the station entrances is a mix of vacant lots awaiting redevelopment, and new medium to high density residential and office buildings built within the past 5 years. The DC Comprehensive Plan identifies blocks surrounding the Metrorail station to be developed into high density mixed use buildings. In addition, the Capitol Gateway Overlay and Southeast Federal Center Overlay districts provide additional guidance for development within the study area. Figure 3 identifies the future land use for parcels within the study area, as well as adjacent overlay zones. Final Report 4 April 2016

 Final")
19 Navy Yard Ballpark Station Access Improvements Study Figure 3: Future Land Use (DC Comprehensive Plan) Final Report 5 April 2016
20 According to the Capitol Riverfront Business Improvement District (BID), at full build out, the area is expected to have over 35,000,000 square feet of office, retail, and residential development. Table 1 outlines the existing and future development of the Capitol Riverfront BID area. Table 1: Capitol Riverfront Development Summary: Future Build out Office Retail Residential Hotel Estimated Delivery Sq. Ft. Sq. Ft. Units Rooms Existing 7,331, ,000 3, Under Construction 225, ,000 3, Active Pipeline (2016 Groundbreaking) 283, ,000 2,662 0 Planned 4,744, ,000 5, Source: Capitol Riverfront BID 4Q Demographics Totals 12,583,000 1,168,000 14,611 1,262 Within ½ mile of the Navy Yard Ballpark station, both population and employment are forecast to increase between 2015 and 2025 with the addition of approximately 8,700 residents and 8,000 jobs. Table 2 shows the existing and projected population and employment forecasts for the ½ mile station area. According to the MWCOG Round 8.3 Cooperative Forecasting model, most of the population and employment density increases are expected to occur in the area east of South Capitol Street, SE, adjacent to the Navy Yard Ballpark Station entrances along M Street, SE within the Capitol Gateway Overlay and Southeast Federal Center Overlay districts. Table 2: Navy Yard Ballpark Station Area Demographics Demographic Total Change ( ) Percent Change ( ) Population 11,500 20,200 8, % Employment 21,000 29,000 8, % Source: MWCOG Round 8.3 Cooperative Forecasting, DC GIS 2014 Final Report 6 April 2016
21 2.4 Ridership Figure 4 shows the station s 10 year historic ridership. Ridership dramatically increased in 2008 with the opening of the West Entrance and Nationals Park Stadium. Figure 4: Navy Yard Ballpark Station 10 Year Historic Ridership Average Weekday Daily Boardings 12,000 10,000 8,000 6,000 4,000 2,000 3,000 Nationals Park Stadium Entrance Opening 10,500 0 Year Source: WMATA Historic Ridership Data (2014) An average of 10,500 daily boardings occurs at Navy Yard Ballpark station, with 89% of all passenger traffic arriving to the station by either walking or biking. While this average (10,500) takes into account the Ballpark activity, a typical day (non game day) sees approximately 6,200 daily boardings, with peak periods coinciding with expected daily commuting patterns for a residential and commercial district (8:00 9:00 AM for the AM peak hour and 5:00 6:00 PM for the PM peak hour). Mezzanine faregate data indicates that approximately 80% of the people entering and exiting the station use the East Entrance in both the morning and evening peak hours. By the year 2025, the average weekday daily boardings at the station is expected to rise to 14,000, an increase of 33% compared to Table 3 shows the projected future average weekday daily and AM peak 15 minutes boardings at the station Final Report 7 April 2016
22 Table 3: Forecast Average Weekday Boardings at Navy Yard Ballpark Station Total Change ( ) Percent Change ( ) Average Weekday Daily Boardings 10,500 11,600 14,000 3, % Source: MWCOG 2.3 version 57 (Travel Demand Model) 2.5 Existing Station Facilities and Layout Station Entrance Locations East Entrance The East Entrance is located at the northwest corner of the intersection of New Jersey Avenue, SE and M Street, SE (Figure 5). The East Entrance features a formal canopy oriented towards New Jersey Avenue, SE, and generally serves residents and office workers with origins and destinations located to the east of the station (such as USDOT). West Entrance The West Entrance is located on the ground floor of 55 M Street, SE, at the southeast corner of the intersection of Half Street and M Street, SE (Figure 6). The entrance features faregates, ticket machines, and the station kiosk at street level, and generally serves visitors to the Nationals Park Stadium, located one block south of the entrance. Final Report 8 April 2016

 Final Report 9 April")
23 Navy Yard Ballpark Station Access Improvements Study Figure 5: Navy Yard East Entrance (New Jersey Ave, SE and M Street, SE) Figure 6: Navy Yard West Entrance (Half Street and M Street, SE) Final Report 9 April 2016


24 Station Entrance Facilities and Vertical Circulation Elements Navy Yard Ballpark Station Access Improvements Study The Navy Yard Ballpark station has two mezzanines, East and West, connected by a center platform that runs under M Street, SE. The West Mezzanine entrance facilities are located at street level, while the East Mezzanine entrance facilities are located below grade, above the platform level. Table 4 summarizes the faregates and vertical circulation elements for each mezzanine. Figure 7 and Figure 8 show the faregate arrangement at the East and West mezzanine, respectively. Figure 9 and Figure 10 depict the mezzanine and platform level plans, and the station section, respectively. Table 4: Navy Yard Ballpark Station Mezzanine Facilities Mezzanine Faregates Standard ADA Street to Mezzanine Vertical Circulation Elements Escalator Elevator Stairs Mezzanine to Platform Street to Mezzanine Mezzanine to Platform Mezzanine to Platform East 7* West *At the time of this study, the East Mezzanine has five operating standard faregates and one standard faregate reserved for New Payment Testing. The study assumes that during normal operations there are seven operating standard faregates. Figure 7: East Mezzanine Faregates Figure 8: West Mezzanine Faregates Final Report 10 April 2016


25 Figure 9: Navy Yard Ballpark Station Mezzanine and Platform Plans Figure 10: Navy Yard Ballpark Station Section Final Report 11 April 2016
26 2.6 Observed Passenger Movements Site visits were made on two consecutive weekdays in February 2015 to observe station conditions and passenger movements. Passenger movements at the East Entrance street level were observed for 15 minutes during the AM and PM peak periods. Station activity was observed during the AM and PM peak periods for the East and West Mezzanines, corresponding faregate areas, and train platform areas. Station observations focused on areas of crowding, movement conflicts, and any potential safety issues related to station passenger circulation. East Entrance During the AM peak, more passengers exit the station than enter. The majority of exiting traffic walked towards the southeast corner of New Jersey Avenue, SE and M Street, SE, near the USDOT Headquarters. The second largest group of exiting traffic continued east along M Street, SE. Most of the entering traffic arrived from the north along New Jersey Avenue, SE. During the PM peak, more passengers enter the station than exit. Movements during this time period mirror the AM peak, with the majority of entering traffic coming from the southeast corner of New Jersey Avenue, SE and M Street, SE, followed by entering traffic from the east along M Street, SE. Most of the exiting traffic continued north along New Jersey Avenue, SE. Figure 11 shows the distribution of passengers entering and exiting the station via the East Entrance both during the AM and PM peak periods. Final Report 12 April 2016
27 Figure 11: Existing East Entrance Peak Period Pedestrian Movements Navy Yard Ballpark Station Access Improvements Study AM Peak Period PM Peak Period Source: Based on Pedestrian Observation during AM and PM peak periods, AECOM. Final Report 13 April 2016
28 Mezzanines Figure 12 shows the faregate alignment for both the East Mezzanine and West Mezzanine. On the East Mezzanine, moderate queueing at the faregates was observed for passengers exiting and entering the station during the AM peak (Figure 13). No queuing was observed at the faregates during the PM peak. On the West Mezzanine, no queuing was observed at the faregates or near any of the VCEs during the AM and PM peak periods. Figure 12: AM Peak Station Faregate Configurations East Mezzanine West Mezzanine Final Report 14 April 2016


, and passengers using the stairs to")


29 Platform During the AM peak hour, approximately 80% of observed passengers exited southbound trains towards the East Mezzanine, with boardings for northbound trains spread across the Platform. Significant queues and crowding also developed at the bottom of the platform escalator and stairs to exit the station via the East Mezzanine. Queues were observed that backed up to approximately the halfway point of the Platform (Figure 13), and passengers using the stairs to exit conflicted with those using the stairs to get down to the Platform. During the PM peak period, passengers were spread evenly across the Platform to board northbound trains. In addition, there was typically a rush to board the last few cars from passengers entering from the East Mezzanine. Figure 13: AM Peak Passenger Congestion within Navy Yard Ballpark Station Moderate Congestion at East Mezzanine Faregates Platform Congestion and Queuing at Platform to Mezzanine VCEs Final Report 15 April 2016
30 3. Simulation Modeling of Existing and Future Conditions Navy Yard Ballpark Station Access Improvements Study This section summarizes the existing year (2015) and future year (2025) conditions for the Navy Yard Ballpark Metrorail station. The simulated conditions are based on pedestrian simulation modeling of existing ( Existing Conditions ) and forecast ( No Build 2025 ) passenger volumes with current station facilities. While the current station does not experience severe crowding during typical operations, anticipated Metrorail ridership growth and future development in the area could result in passenger overcrowding and movement conflicts on platforms, mezzanines, and vertical circulation elements (VCEs). 3.1 Methodology The simulations were conducted using Legion SpaceWorks software, modeling conditions during the AM and PM peak hours for the two time periods (2015 and 2025) based on the existing station layout. Based on the station entries and exits and travel demand forecast, the AM peak hour is 7:30 AM to 8:30 AM, while the AM peak 15 minutes is 8:00 AM to 8:15 AM. The PM peak hour is 4:30 PM to 5:30 PM, while the PM peak 15 minutes is 5:15 PM to 5:30 PM. Ridership The study analyzed station ridership for both the Existing Conditions and the No Build 2025 simulation, based on existing and future population and employment for the area within ½ mile radius of the station. For the Existing Conditions, the study used 2014 WMATA faregate data to determine the distribution of Metrorail boardings and alightings and station entries and exits for passengers accessing the station via the East or West Entrance. For the No Build 2025 simulation, the study used 2025 TAZ data to distribute Metrorail boardings and alightings between the East and West Entrances based on future population and employment within the station area. In addition, the distribution of station entries and exits between the East and West Entrances accounts for future population and employment growth within the station area for the No Build 2025 simulation. Table 5 shows the number of total entries and exits during the AM peak 15 minutes at the station (using both the East and West Entrances). Appendix A contains the full distribution of passengers using the East and West Entrances for boarding and alighting, as well as the number of station entries and exits for both the Existing Conditions and No Build 2025 simulation. Final Report 16 April 2016
31 Table 5: AM Peak 15 Minutes Station Entries and Exits Existing Conditions, No Build 2025 Existing Conditions No Build 2025 East Entrance West Entrance East Entrance West Entrance Entries Exits Source: October WMATA Faregate Data for Existing Condition, MWCOG 2.3 version 57 (Travel Demand Model) with Round 8.3 Cooperative Land Use Forecast Data for No Build 2025 simulation. Metrorail Operations The Existing Condition modeling was conducted based on the current Metrorail train operating plan (effective July 2014), with Green Line trains serving the station every 6 minutes during peak periods and every 12 minutes during off peak periods. The No Build 2025 simulation is based on the 2018 operating plan, which uses the same frequency for Green Line trains as the 2014 plan. Appendix B contains the full Metrorail operating plans for both 2014 and Final Report 17 April 2016
 for Passageways (AM peak 15 minutes) Determines the LOS along the Platform and on the mezzanines, and evaluates percentage of passengers experiencing LOS E and F")
32 3.2 Measures of Effectiveness (MOEs) The following MOEs were used to evaluate station performance for both the Existing Condition and the No Build 2025 simulation: 1. Pedestrian Level of Service (LOS) for Passageways (AM peak 15 minutes) Determines the LOS along the Platform and on the mezzanines, and evaluates percentage of passengers experiencing LOS E and F within specific zones within the station. Passenger density maps were established for the peak 15 minutes during the AM peak hour. The following key shows the different LOS ratings as illustrated by the maps: Using criteria in the Transportation Research Board s Transit Capacity and Quality of Service Manual (2 nd Edition), the typical design target for pedestrian walking space, including platforms and mezzanines, is LOS C (green), with LOS D (yellow) being acceptable. Areas of orange and red denote LOS E and F, respectively, which indicate unacceptable conditions. 2. Alighting Passenger Journey Time (AM peak) Measures the average journey time for passengers leaving trains to reaching the station entrance, in minutes and seconds. 3. Vertical Circulation Element (VCE) Queue Clearance Time (AM peak 15 minutes) Measures the average time required to completely clear the queue for a VCE within the station, in minutes and seconds. 3.3 Comparison of Existing Conditions and No Build 2025 Pedestrian LOS for Passageways (AM Peak 15 Minutes) Figure 14 and Figure 15 illustrate the LOS for the AM peak 15 minutes at the Platform and mezzanines, respectively, for the Existing Conditions and the No Build 2025 simulation, respectively. Areas of LOS E and F (significant congestion) are highlighted on the figures. Simulations for the PM peak 15 minutes are not shown due to the lack of any significant congestion. Final Report 18 April 2016

33 Figure 14: AM Peak 15 Minutes Pedestrian LOS for Passageways Platform Level Existing Conditions No Build 2025 Crowding at base of escalator worsens Final Report 19 April 2016

34 Figure 15: AM Peak 15 Minutes Pedestrian LOS for Passageways Mezzanine Level Existing Conditions No Build 2025 Final Report 20 April 2016
. Significant congestion also occurs along the platform edge for southbound trains in the No Build 2025 simulation, particularly in the narrow area just south of the escalator leading up to the")
35 The significant congestion that occurs on the Platform at the base of the escalator leading up to the East Mezzanine in the Existing Conditions is exacerbated in the No Build 2025 simulation (Figure 14). Significant congestion also occurs along the platform edge for southbound trains in the No Build 2025 simulation, particularly in the narrow area just south of the escalator leading up to the West Mezzanine (this does not appear in the Existing Conditions). No significant congestion occurs on either of the Mezzanines or at the VCEs leading to either the West or East Entrances during the AM peak in both the Existing Conditions and No Build 2025 simulation (Figure 15). Zone Analysis Densities The following pages summarize the density analysis results for Navy Yard Ballpark Station. Figure 16 depicts the analysis zones of key pedestrian circulation areas used for calculating the percentages of passengers in LOS E and F from the simulations. Table 6 lists the average LOS E and F during the AM peak period. Figure 16: Navy Yard Pedestrian Density Analysis Zones East Mezzanine Platform Table 6: AM Peak Hour % LOS E and F Existing Conditions and No Build 2025 East Mezzanine Combined LOS E & F Peak Hour Peak 15 Minutes Platform Combined LOS E & F Peak Hour Peak 15 Minutes Existing Conditions No Build The amount of significant congestion along the platform is greatly increased in the No Build 2025 simulation compared to the Existing Conditions. During the AM peak 15 minutes, 22% of the station platform experiences LOS E or F, over triple the amount of significant congestion compared to the Existing Conditions during the same time period (7%). The East Mezzanine experiences virtually no change in significant congestion between the Existing Conditions and the No Build 2025 simulation. Final Report 21 April 2016
36 Faregate Analysis The study evaluated faregate capacity relative to passenger entry and exit volumes (see Appendix C). Based on the faregate analysis using WMATA s Design Criteria, two additional faregates are needed at the East Mezzanine to accommodate AM peak hour usage. Alighting Passenger Journey Time (AM Peak) Table 7 shows the alighting journey time for passengers traveling from the Platform to the street level via the existing East Entrance during the AM peak. Table 7: Alighting Passenger Journey Time Existing Conditions and No Build 2025 (AM Peak) Peak Hour Platform to East Entrance (Minutes: Seconds) Peak 15 Minutes Existing Conditions 2:42 2:47 No Build :06 3:31 Compared to the Existing Conditions, alighting time both during the peak hour and peak 15 minutes increases significantly, with the peak 15 minutes alighting time increasing by 44 seconds. VCE Queue Clearance Time The busiest VCEs were analyzed to determine the resulting queue clearance times for the Existing Conditions and No Build simulations; other VCEs that were viewed to have no significant queuing during the peak hours were excluded from the detailed analysis. Table 8 lists the average VCE queue clearance times (recorded in minutes:seconds) derived from the simulations. Table 8: Average AM Peak 15 Minutes Escalator Clearance Time Existing Conditions and No Build 2025 Platform to East Mezzanine (Minutes: Seconds) East Mezzanine to Street Level (Minutes: Seconds) Existing Conditions 1:03 No Queue No Build :41 No Queue The queue clearance time for the platform to East Mezzanine escalator increases sharply from the Existing Conditions to the No Build 2025, adding over 90 seconds to the clearance time. No queues appear at East Mezzanine to street level escalator/stair during the Existing Conditions or the No Build 2025 simulation. Final Report 22 April 2016
37 VCE Analysis The study evaluated escalator and stairway capacity relative to passenger volumes within the station (see Appendix D). Based on the VCE analysis using WMATA s Design Criteria, the study determined that additional VCEs are needed between the East Mezzanine and Platform. 3.4 Summary of No Build 2025 Conditions The Existing Conditions and No Build 2025 simulations yielded the following results: Increased Congestion along Station Platform During the AM peak period, significant congestion worsened along the Platform, increasing the overall LOS E&F along the Platform to 22% in the No Build 2025 simulations. The bulk of the congestion occurred at the base of the platform to East Mezzanine escalator. Increased Travel Time Both passenger alighting time and VCE queue clearance time for the platform to East Mezzanine escalator increased significantly during the AM peak period from the Existing Conditions to the No Build 2025 simulation. Increased Safety Concerns The simulated increases in congestion, travel time, and queue clearance time signify that the existing Platform and East Mezzanine would not be able to adequately handle future passenger traffic in 2025, increasing potential safety risks within the station. Final Report 23 April 2016
38 4. Design Options This section summarizes the agency and stakeholder feedback, as well as the design options considered for both the East Mezzanine improvements and the new East Entrance. Improvements to the West Mezzanine and West Entrance were not considered as there were no significant congestion issues at either location for both the Existing Conditions and No Build 2025 simulations. 4.1 Agency and Stakeholder Feedback WMATA Office of ADA Policy and Planning (ADAP) ADAP provided specific guidance on station accessibility and design requirements related to elevators, accessible pathways, emergency egress facilities, and other station elements. District Department of Transportation (DDOT) DDOT requested that a new station entrance be integrated into the future Forest City development at the southwest corner of New Jersey Avenue, SE and M Street, SE within private property. DC State Historic and Preservation Office (SHPO) The SHPO expressed the importance of maintaining the New Jersey Avenue, SE viewshed to the U.S. Capitol, discouraging the use of public space for elevators and canopies. The construction of these elements could potentially block views of the U.S. Capitol along New Jersey Avenue, SE. Forest City Forest City provided feedback on the need to allow for flexibility of designing the second East Entrance, as its long term development plans have not been finalized. For example, New Jersey Avenue and M Street, SE could become a valuable retail corner or the future tenant of this location could be a Federal government agency, requiring additional security. Capitol Riverfront BID The Capitol Riverfront BID expressed their support for a second East Entrance at the station, stating their preference for a complete station entrance as opposed to an elevator only option. Final Report 24 April 2016


39 4.2 Initial Design Options Second East Entrance Three second East Entrance locations were developed. Figure 17 shows the location of the proposed locations at the street level, including the orientation of proposed complete entrances and elevator only options. All three locations take advantage of the existing knockout panel located on the south end of the East Mezzanine (Figure 18). Figure 17: Location of Second East Entrance Design Options at Street Level Existing East Entrance M Approximate Location of Knockout Panel Entrance Location 3 Complete Entrance Entrance Location 2 Elevator Only Entrance Location 1 Complete Entrance Figure 18: Existing East Mezzanine Knockout Panel Final Report 25 April 2016
40 Entrance Location 1: Complete Entrance Facing New Jersey Avenue, SE Two new escalators and a stair connect the East Mezzanine to the street, with a new complete station entrance on the corner of New Jersey Avenue, SE and M Street, SE, facing New Jersey Avenue, SE. A new passageway connects the new mezzanine to street VCEs via the existing East Mezzanine knockout panel. Two new elevators also connect the East Mezzanine to the street, facing M Street, SE. The new entrance may feature either a station canopy or be included as part of the future development. Entrance Location 2: Elevator Only Midblock Entrance Facing M Street, SE Three new mezzanine to street elevators connect to the existing East Mezzanine via a new passageway and the existing East Mezzanine knockout panel. An emergency exit stair is also included. The elevators at street level are located just west of the intersection of New Jersey Avenue, SE and M Street, SE. Entrance Location 3: Complete Midblock Entrance Along M Street, SE Two new escalators and a stair connect the East Mezzanine to the street, with a new complete station entrance located just south of M Street, SE, facing the midblock. A new passageway connects the new mezzanine to street VCEs via the existing East Mezzanine knockout panel. Two new elevators also connect the East Mezzanine to the street, facing M Street, SE. The new entrance may feature either a station canopy or be included as part of the future development. Figure 19 through Figure 21 illustrate Entrance Locations 1, 2, and 3 both at the mezzanine and street levels, respectively. Final Report 26 April 2016

41 Figure 19: Entrance Location 1 Mezzanine Level Street Level Final Report 27 April 2016

42 Figure 20: Entrance Location 2 Mezzanine Level Street Level Final Report 28 April 2016

43 Figure 21: Entrance Location 3 Mezzanine Level Street Level Final Report 29 April 2016
44 Other Locations Considered But Not Advanced Two other locations for the new East Entrance were also considered: Navy Yard Ballpark Station Access Improvements Study Second East Entrance with Stair Only A second East Entrance featuring a mezzanine to street stair with no escalator or elevator service. While this location could help reduce costs associated with a new entrance, this option would be less desirable from an access standpoint due to the change in elevation between the East Mezzanine and street level. Second East Entrance Located Closer to the Riverfront A longer new pedestrian passageway connecting the East Mezzanine at the knockout panel to points south of the station near the riverfront. While this location could increase entrance usage near the riverfront, such a long passageway would be considerably more expensive to build compared to the other locations above. Final Report 30 April 2016
45 East Mezzanine Improvements The proposed improvements for the East Mezzanine include the following: Expanded Mezzanine and Vertical Circulation Capacity An expanded East Mezzanine would allow for more passengers to move off the Platform and onto the mezzanine, helping to separate boarding and alighting passengers, and moving more passengers away from active train tracks. A new platform to mezzanine stair would connect the Platform to the expanded East Mezzanine while a new escalator would replace the existing platform to mezzanine stair (next to the existing escalator). In addition, a new elevator would also connect the Platform to the East Mezzanine, providing a second ADA pathway. The new VCEs would help to relieve crowding along the Platform, decrease alighting journey time, reduce queues at the platform to East Mezzanine VCEs, and improve overall safety along the platform. Potential New Faregates Based on the WMATA Design Criteria, two additional faregates for the East Mezzanine. However, spatial constraints on the existing East Mezzanine limit the feasibility of adding faregates. Figure 22 identifies the two East Mezzanine improvements options recommended for the station. Both options include the extended East Mezzanine, new platform to mezzanine stair, and new platform tomezzanine escalator. Option 1A includes a new platform to mezzanine elevator adjacent to the existing elevator, while Option 1B includes a new platform to mezzanine elevator, relocates the existing platform to mezzanine elevator, and relocates the existing station kiosk. Figure 23 illustrates the location of the proposed East Mezzanine improvements within the station. Final Report 31 April 2016

46 Figure 22: Navy Yard Ballpark Station East Mezzanine Improvements Navy Yard Ballpark Station Access Improvements Study East Mezzanine Improvements: Option 1A East Mezzanine Improvements: Option 1B Final Report 32 April 2016


47 Navy Yard Ballpark Station Access Improvements Study Figure 23: Proposed Locations of East Mezzanine Improvements East Mezzanine Extension New Platform to Mezzanine Elevator, Mezzanine Level New Platform to Mezzanine Escalator, Platform Level New Platform to Mezzanine Elevator, Platform Level Final Report 33 April 2016
48 5. Engineering Scan This section provides a summary of the potential engineering and constructability concerns. Appendix E provides a more detailed version of the engineering and constructability concerns. Appendix F provides site plans illustrating the location of the existing station infrastructure, utility lines, and area for the proposed second East Entrance. 5.1 Existing Utilities and Station Vents There are multiple utility lines, including storm drains, sanitary, gas, water, phone, and electric lines within the roadway that run parallel to M Street, SE as well as New Jersey Avenue, SE. Additionally, there are three large Metrorail vents adjacent to the sidewalk on eastbound M Street, SE near the corner of New Jersey Avenue, SE, including one vent near the location of the existing knockout panel. Based upon site observation and the existing as built drawings of the station area, it does not appear that any other utilities exist at the knockout panel location. Figure 24 illustrates the new passageway and elevators as they relate to the existing station vent and infrastructure. None of the three East Entrance locations suggest serious utility complications and all options clear the existing station vent, both horizontally and vertically. The existing station vents extend to just over 19 feet below street level, while the top of the ceiling for the East Mezzanine and new passageway sits at approximately 22 feet below street level. Figure 24: Navy Yard Ballpark Station Section with Existing Station Vent and Proposed New Infrastructure (East Entrance Location 3) Final Report 34 April 2016
49 5.2 Potential Engineering and Constructability Concerns Mechanical and Electric Considerations Navy Yard Ballpark Station Access Improvements Study East Entrance Locations 1 and 3 both require new escalator control rooms, and all three locations require new elevator machine rooms. Drainage systems will be required for elevators, escalators, and stairwells. Further consideration will be necessary to determine the feasibility of connection into the existing station drainage system or if a new connection to nearby storm drainage is necessary, which would require sump pumps. Because the station is below grade and interconnects underground tracks on both ends of the station, the proposed new entrance may impact both the normal and emergency ventilation. Further study should be provided to determine any impacts and mitigation. Existing AC switchboards will be sufficient to power new mechanical equipment and lighting required by a new station entrance, although other new electrical equipment would be added to handle additional electrical loads. System and Structural Considerations All three East Entrance locations will require upgrades to CCTV, intrusion detection, smoke and fire detection, public address speakers, public information display systems, station kiosk modifications, and upgraded restrooms to comply with ADA standards. Structural considerations based on the existing site conditions are minimal; the proposed entrance location is currently a vacant lot and each of the design options connects to the existing East Mezzanine knockout panel. However, structural design of the new entrance will rely greatly on the developer s site plans and will need to address adjacent building designs. WMATA will need to coordinate with the developer for studies during the joint development process. Final Report 35 April 2016
50 6. Simulation Modeling of Build Alternatives Navy Yard Ballpark Station Access Improvements Study The Build Alternative simulation was developed to evaluate the benefits of proposed station improvements. Two Build Alternatives were developed to test the different second East Entrance locations and East Mezzanine improvement options. Each Build Alternative tests station access by way of a new complete station entrance or elevator only entrance, as well as some of the internal station improvements developed in the East Mezzanine improvement options 1. The Build Alternative simulations include: Build 2025, Alternative 1 A new complete station entrance is located on the corner of New Jersey Avenue and M Street, SE, with the station entrance facing New Jersey Avenue, SE (Entrance Location 1). East Mezzanine improvements include the extended East Mezzanine with new platform to mezzanine stair, new platform to mezzanine escalator, relocated platform tomezzanine elevator, and a new platform to mezzanine elevator. Build 2025, Alternative 2 Three new mezzanine to street elevators, facing M Street, SE, connect the East Mezzanine to the street (Entrance Location 2). East Mezzanine Improvements are the same as Build 2025, Alternative 1, but also include a relocated station kiosk, relocated ADA faregate, and two new standard faregates.) Although Entrance Location 3 also features a complete station entrance, it was not modeled as part of the Build 2025 Alternatives. Table 9 identifies the design options included in each of the Build Alternatives. Figure 25 and Figure 26 show the improvements included in each Build Alternative within the station. 1 Platform to Mezzanine elevator operations were not analyzed as part of the study as elevator usage provides minimal impact to passenger movement. The orientation of these elevators in the Build Alternatives is for illustrative purposes only. Final Report 36 April 2016
51 Table 9: Summary of Design Improvement Concepts per Build Alternative Navy Yard Ballpark Station Access Improvements Study Design Improvement Concept New Station Entrance Build 2025, Alternative 1 Build 2025, Alternative 2 New Passageway New Escalators New Stair New Elevators Emergency Escape Stair East Mezzanine Improvements (2 escalators) (2 elevators) (3 elevators) Extended East Mezzanine New Escalator New Stair New Elevator Relocated Existing Elevator Relocated Station Kiosk New Faregates Relocated ADA Faregate (2 faregates) Final Report 37 April 2016
52 Figure 25: Build 2025, Alternative 1 New Complete Station Entrance Navy Yard Ballpark Station Access Improvements Study Figure 26: Build 2025, Alternative 2 New Elevator Only Station Entrance Final Report 38 April 2016
53 6.1 Methodology The Build 2025 pedestrian simulation model uses the same methodology and Metrorail train operations as described in Section 3.1 for the No Build 2025 simulation. The following sections below describe specific components of the Build 2025 pedestrian simulation model: Ridership For the Build 2025 simulations, the study assumed the same Metrorail boardings and alightings as the No Build 2025 simulation (see Appendix A), but adjusted the distribution of East Entrance entries and exits to account for the new East Entrance: Build 2025, Alternative 1 East Entrance entries and exits were split evenly between the existing and new East Entrances for East Mezzanine passenger traffic (50% of passengers to each exit) during peak hours. This assumes that passengers would be equally likely to use either complete station entrance when entering/exiting the station. Build 2025, Alternative 2 East Entrance entries and exits were not split evenly, using the existing elevator configuration at Rosslyn Metrorail station elevators as a model to determine the split and configuration 2. Elevators generally attract fewer users compared to complete entrances. Using this model, passengers were split 29% and 71% between the Second and existing East Entrance, respectively, during AM exits, and split 21% and 79% between the Second and existing East Entrance, respectively, during PM entries. Table 10 below shows the number of total entries and exits during the AM peak 15 minutes at the station (using both the East and West Entrances), for both of the Build Alternatives. Refer back to Table 5 to compare with the total entries and exits for the Existing Conditions and No Build 2025 simulation. Table 10: AM Peak 15 Minutes Station Entries and Exits Build 2025 Alternatives Build 2025, Alternative 1 Build 2025, Alternative 2 East Entrance New East Entrance West Entrance East Entrance New East Entrance West Entrance Entries Exits Source: October WMATA Faregate Data for Existing Condition, MWCOG 2.3 version 57 (Travel Demand Model) with Round 8.3 Cooperative Land Use Forecast Data for No Build 2025 simulation. 2 The Rosslyn Metrorail station features three 6 x 9 elevators, measuring 54 ft 2 each, and assumes 2.5 ft 2 per passenger (rush hour crush load), 21 passengers per elevator, and 63 passengers per one complete elevator cycle (90 seconds). Final Report 39 April 2016
54 6.2 Build Alternative Simulation Results by Measures of Effectiveness (MOEs) Detailed MOE results for the Build Alternative simulations are reported below for the following: 1. Pedestrian LOS for Passageways (AM peak 15 minutes) 2. Alighting Journey Time (AM peak) 3. VCE Queue Clearance time (AM peak 15 minutes) Pedestrian LOS for Passageways (AM Peak 15 Minutes) Figure 27 and Figure 28 illustrate the LOS for the AM peak 15 minutes at the Platform and mezzanines for the Build 2025 simulations (Alternatives 1 and 2), respectively. Areas of LOS E and F (significant congestion) are highlighted on both figures. As with the No Build Simulation, no significant congestion occurs during the PM peak 15 minutes during either Build 2025 simulation. Refer back to Figure 14 and Figure 15 in Section 3.3 to view the Pedestrian LOS for Passageways maps for both the Existing Conditions and No Build 2025 simulations. Final Report 40 April 2016

55 Figure 27: AM Peak 15 Minutes Pedestrian LOS for Passageways Platform Level (Build 2025, Alternatives 1 and 2) Build 2025, Alternative 1 Navy Yard Ballpark Station Access Improvements Study Reduced crowding compared to No Build Build 2025, Alternative 2 Reduced crowding compared to No Build Final Report 41 April 2016
56 Figure 28: AM Peak 15 Minutes Pedestrian LOS for Passageways Mezzanine Level (Build 2025, Alternatives 1 and 2) Build 2025, Alternative 1 Build 2025, Alternative 2 Minor crowding at base of escalator Final Report 42 April 2016
57 Build 2025 Alternative 1 Density Map Comparison During the AM peak 15 minutes, the additional VCE between the Platform and the East Mezzanine (Figure 27) moderately reduces Platform congestion from the No Build 2025 simulation. However, minor queuing occurs at the East Mezzanine faregate array due to the additional flow from the Platform. Additional VCEs (via the new East Entrance) between the East Mezzanine and street level provide increased capacity access to the station, resulting in the mezzanine area performing within the recommended threshold (Figure 28). Build 2025 Alternative 2 Density Map Comparison During the AM peak 15 minutes, the additional VCE between the Platform and the East Mezzanine (Figure 28) moderately reduces Platform congestion from the No Build 2025 simulation. However, the additional faregate array flow at the East Mezzanine results in minor queuing at the base of the existing escalators leading from the East Mezzanine to the existing East Entrance (Figure 28). Zone Analysis Densities The following pages summarize the density analysis results for Navy Yard Ballpark station. Figure 29 depicts the analysis zones of key pedestrian circulation areas used for calculating the percentages of passengers in LOS E and F from the simulations. Table 11 lists the average LOS E and F during the AM peak period. Final Report 43 April 2016

58 Figure 29: Navy Yard Pedestrian Density Analysis Zones Navy Yard Ballpark Station Access Improvements Study East Mezzanine Platform Table 11: AM Peak Hour % Combined LOS E and F Existing Conditions, No Build 2025, and Build 2025 East Mezzanine Peak Hour Peak 15 Minutes Peak Hour Platform Peak 15 Minutes Existing Conditions No Build Build 2025, Alternative Build 2025, Alternative Both Build 2025 Alternatives greatly reduce amount of space on the Platform experiencing combined LOS E & F, reducing it from 22% during the peak 15 minutes to 8 and 9% for Build 2025 Alternatives 1 and 2, respectively, and completely eliminating any spaces experiencing LOS F. Final Report 44 April 2016
59 Alighting Passenger Journey Time (AM Peak) Navy Yard Ballpark Station Access Improvements Study Table 12 shows the alighting journey time for passengers traveling from the Platform to the street level via either the existing or second East Entrance during the AM peak. Table 12: Alighting Passenger Journey Time (AM Peak) Existing Conditions, No Build 2025, and Build 2025 Platform to Existing East Entrance (Minutes: Seconds) Peak Hour Peak 15 Minutes Peak Hour Platform to New East Entrance (Minutes: Seconds) Peak 15 Minutes Existing Conditions 2:42 2:47 No Build :06 3:31 Build 2025, Alternative 1 2:55 3:01 2:50 2:56 Build 2025, Alternative 2 3:00 3:04 3:25 3:30 Both Build 2025 Alternatives improve the passenger journey time from the Platform to the existing East Entrance compared to the No Build 2025 simulation, in particular during the peak 15 minutes between the No Build and Build Alternative 1, in which passenger journey time is reduced by 30 seconds. However, both Build 2025 Alternatives have a longer passenger journey time compared to the Existing Conditions, both during the peak hour and peak 15 minutes. In addition, the Build 2025, Alternative 2 journey time from the Platform to the new East Entrance is more than 30 seconds longer compared to Build 2025, Alternative 1. Final Report 45 April 2016
60 VCE Queue Clearance Time (AM Peak 15 Minutes) Navy Yard Ballpark Station Access Improvements Study The busiest VCEs were analyzed to determine the resulting queue clearance times for the Existing Conditions, No Build, and Build 2025 simulations; other VCEs that were viewed to have no significant queuing during the peak hours were excluded from the detailed analysis. Table 13 lists the VCEs selected for further analysis. Figure 30 identifies the location of each of the VCEs selected for further analysis. Table 14 lists the average VCE queue clearance times (recorded in minutes:seconds) derived from the simulations. Table 13: VCEs Selected for Queue Clearance Time Analysis VCE No. Existing/New Location Type Direction 1 Existing Platform to East Mezzanine Escalator Up 2 Existing East Mezzanine to Street (East Entrance) Escalator Up 3 New Platform to East Mezzanine Stairs Up 4 New East Mezzanine to Street (New East Entrance) Escalator/Stair Up Figure 30: Location of Selected VCEs within Navy Yard Ballpark Station (Build 2025, Alternative 1) VCE #2 VCE #3 VCE #1 VCE #4 Final Report 46 April 2016
61 Table 14: Average AM Peak 15 Minutes VCE Clearance Time Existing Conditions, No Build 2025, and Build 2025 VCE #1 (Existing) (Minutes: Seconds) VCE #2 (Existing) (Minutes: Seconds) VCE #3 (New) (Minutes: Seconds) VCE #4 (New) (Minutes: Seconds) Existing Conditions 1:03 No Queue N/A * N/A * No Build :41 No Queue N/A * N/A * Build 2025, Alternative 1 0:37 No Queue 0:37 No Queue Build 2025, Alternative 2 0:37 No Queue 0:37 N/A *VCE not included as part of the Existing Conditions or No Build simulations. Mezzanine to Street Elevators for Build 2025, Alternative 2 were not selected for VCE Queue Clearance Time Analysis The addition of VCE #3 in both Build 2025 Alternatives helps to reduce the queue clearance time at the base of VCE #1. For both Build 2025 Alternatives, the queue clearance time for VCE #1 is reduced by 26 seconds compared to the Existing Conditions, and reduced by 2 minutes and 4 seconds compared to the No Build 2025 simulation. Final Report 47 April 2016
62 6.3 Summary of Build 2025 Simulations The Build 2025 simulations yielded the following results: Reduced Platform Congestion Platform congestion is reduced from 22% combined LOS E & F in the No Build 2025 simulation to between 8% and 9% in Build 2025, Alternatives 1 and 2, respectively. Minimal Impact on Alighting Passenger Journey Time The addition of a new complete station entrance in Build 2025, Alternative 1 reduced alighting passenger journey time by way of the existing East Entrance by as much as 30 seconds compared to the No Build during the AM peak 15 minutes, but was still longer compared to the same trip during the Existing Conditions for both the AM peak hour and 15 minutes. The new elevator only entrance in Build 2025, Alternative 2 yielded marginal travel time saving benefits for the existing East Entrance compared to the No Build 2025 simulation, and also created long queues at the Second East Entrance. Reduced Platform to Mezzanine VCE Queue Clearance Time The new platform to East Mezzanine VCEs helped to reduce queuing by as much as just over 2 minutes at the base of the existing platform to East Mezzanine escalator in the Build 2025 Alternatives compared to both the Existing Conditions and No Build 2025 simulation. Reduced Safety Concerns The simulated decreases in Platform congestion and queue clearance time for platform to mezzanine VCEs indicate safer conditions along the Platform and near train loading/unloading areas. As a result, the increased internal infrastructure is better equipped to handle the simulated increase in passenger traffic. Final Report 48 April 2016
63 7. Conceptual Capital Cost Estimates Navy Yard Ballpark Station Access Improvements Study This section summarizes the conceptual capital cost estimates for each of the East Mezzanine improvements (Options 1A and 1B) as well as new East Entrance Locations 1 and 2. Cost estimates are also included for a station entrance canopy to be used for a free standing complete station entrance. Conceptual capital cost estimates were developed based on WMATA specifications and industry practices. Construction costs are based on current year dollars. No escalation or year of expenditure costs are included. Professional Services are assumed to be 30% of construction costs. Unallocated contingency is assumed to be 10%. Construction costs also include allocated contingencies, contractor mark up, profit, sales tax, subcontractor mark ups, and current Washington DC Davis Bacon labor rates. Cost estimates were not prepared for new East Entrance Location 3, but the anticipated cost is comparable new East Entrance Location 1, which also calls for a complete entrance. Table 15 summarizes the estimated construction and total project costs. Table 16 summarizes the excavation portion only. The complete cost estimate is provided in Appendix G. Table 15: Conceptual Capital Cost Estimate Summary Second East Entrance: Entrance Location 1 (Complete) (Figure 26) Second East Entrance: Entrance Location 2 (Elevator Only) (Figure 27) Construction Total Professional Services Cost Unallocated Contingency Total Project Cost $10,700,000 $3,210,000 $1,391,000 $15,301,000 $6,700,000 $2,010,000 $871,000 $9,581,000 Station Entrance Canopy $ 1,800,000 $540,000 $234,000 $2,574,000* East Mezzanine Improvements: Option 1A (Mezzanine Extension; one $10,400,000 $3,120,000 $ 1,352,000 $14,872,000 additional elevator) (Figure 22, Top) East Mezzanine Improvements: Option 1B (Mezzanine Extension; one additional elevator and one relocated elevator and kiosk) (Figure 22, Bottom) $12,500,000 $3,750,000 $1,625,000 $17,875,000 *Station Entrance Canopy only applies to Entrance Location 1, not needed if new entrance is included in building envelope. Final Report 49 April 2016
64 Table 16: Conceptual Capital Cost Estimate Summary Excavation Portion Only Second East Entrance: Entrance Location 1 (Complete) (Figure 26) Second East Entrance: Entrance Location 2 (Elevator Only) (Figure 27) Construction Total Professional Services Cost Unallocated Contingency Total Project Cost $10,700,000 $3,210,000 $1,391,000 $15,301,000 $6,700,000 $2,010,000 $871,000 $9,581,000 Typical contract costs for excavation include utility relocation, support of excavation (SOE), excavation, dewatering, concrete shell, waterproofing, fencing, and quality control and assurance. For planning purposes, the excavation costs minus the concrete shell would be $7,436,000 for Entrance Location 1 and $4,433,000 for Entrance Location 2. Final Report 50 April 2016
65 8. Evaluation of Design Options This section summarizes the evaluation criteria and measures used to evaluate each of the East Mezzanine improvement options as well as the new East Entrance locations. The design options were evaluated based on the degree to which they would achieve the study s design objectives as described in Section 4.1, informed by the results of the Build 2025 Alternative simulation results in Section 6.2. Table 17 below outlines the general evaluation criteria and specific evaluation measures developed for the design objectives. Table 18 and Table 19 summarize the evaluation results for the design options: East Mezzanine Improvements: Option 1A and 1B Second East Entrance: Entrance Locations 1, 2, and 3 Table 17: Design Objectives and Corresponding Evaluation Criteria and Measures Design Objectives Evaluation Criteria Evaluation Measures 1. Reduce crowding and improve passenger flows within the station. 2. Guide timely future development and support Capital Riverfront neighborhood vision. 3. Minimize construction impacts and provide cost effective solutions. Internal Station Performance Station Access Visual Impacts Construction Cost and Feasibility High Level Comparison of No Build and Build 2025 Pedestrian Simulation Modeling Results Comparison of Entrance Options Responsiveness to Developer and Neighborhood Vision Conceptual Capital Cost Order of Magnitude capital costs Constructability Potential architectural/engineering constraints Final Report 51 April 2016
66 Table 18: East Mezzanine Improvements: Options 1A and 1B Evaluation Measures Internal Station Performance Comparison of No Build and Build 2025 Pedestrian Simulation Modeling Station Access Summary Findings Significantly reduces overall Platform congestion, particularly during AM peak 15 minutes. Helps to separate boarding and alighting passengers by providing additional Platform egress points and an extended mezzanine. Reduces queues at existing platform to mezzanine VCEs. Second platform to mezzanine elevator provides alternate entry/egress path in case of mechanical breakdown (redundancy). Improves overall safety along the Platform. Comparison of Entrance Options No impact on location of Second East Entrance. Visual Impacts Responsiveness to Developer and Neighborhood Vision No impact on developer and neighborhood vision. Engineering Cost and Feasibility Order of Magnitude Capital Cost Potential Architectural/ Engineering Constraints Option 1A $14.9 M Option 1B $17.9 M No room presently to include two additional faregates. Further study needed to ensure no engineering constraints/problems in relocating station kiosk and installing new elevator (Option 1B only). Space between kiosk door, new elevator, and faregates is too cramped; does not allow passengers to easily access station manager from paid area (Option 1B only). Final Report 52 April 2016
67 Table 19: Second East Entrance: Locations 1, 2, and 3 Evaluation Measures Internal Station Performance Comparison of No Build and Build 2025 Pedestrian Simulation Modeling Summary Findings Entrance Location 1 Entrance Location 2 Entrance Location 3 Reduces alighting journey time compared to No Build Does not reduce alighting journey time compared to the Existing Conditions. No effect on reducing VCE queues from the East Mezzanine to the street level. Slightly increases crowding at base of escalators at the existing East Entrance during the AM peak 15 mins compared to No Build Does not improve alighting journey time during the AM peak hour or 15 minutes compared to No Build No effect on reducing VCE queues from the East Mezzanine to the street level. Same as Entrance Location 1. Station Access Comparison of Entrance Options Provides an additional complete station entrance (including an additional ADA pathway) for passengers entering and exiting the station to and from points east. Allows for more direct access to USDOT and the riverfront. Provides an additional ADA pathway for passengers entering and exiting the station to and from points east. Potential conflict with proposed elevators facing existing station vents, option exists for elevator entrance to face away from station vents. Provides an additional complete station entrance (including an additional ADA pathway) for passengers entering and exiting the station. Directs passengers towards Nationals Park. Final Report 53 April 2016
68 Evaluation Measures Visual Impacts Summary Findings Entrance Location 1 Entrance Location 2 Entrance Location 3 Responsiveness to Developer and Neighborhood Vision Station entrance canopy discouraged as it would block viewsheds along New Jersey Avenue, SE. Corner entrance location would displace desirable retail opportunity for proposed PUD. Mid block location does not displace corner real estate or overlap with New Jersey Avenue, SE viewshed. Smaller footprint allows for easier inclusion into proposed PUD. Station canopy (if needed) would not block existing viewsheds along New Jersey Avenue, SE or M Street, SE. New entrance would not displace corner retail opportunity for proposed PUD. Engineering Cost and Feasibility Order of Magnitude Capital Cost $36 $38.6 M (without and with station entrance canopy). $22.2 M. $36 $38.6 M (without and with station entrance canopy). Design will rely greatly on developer plans for the site. Design will rely greatly on developer plans for the site. Same as Entrance Location 1. Potential Architectural/ Engineering Constraints New escalator control rooms and new elevator machine rooms required. General electrical and mechanical upgrades required, refer to the Engineering Scan (Appendix D). New elevator machine rooms required. General electrical and mechanical upgrades required, refer to the Engineering Scan (Appendix D). Final Report 54 April 2016
69 9. Conclusions and Next Steps This section discusses the overall conclusions based on the findings of this report, as well as the next steps and future considerations for further study relating to the Navy Yard Ballpark Metrorail station. 9.1 Conclusions By 2025, the station will experience increased passenger congestion based on Metrorail passenger forecasts, pedestrian simulation models, and projected future development within the Capital Riverfront neighborhood. To accommodate the increase in station activity, internal station improvements at the East Mezzanine are needed. Implementation of the East Mezzanine improvements (either Option 1A or 1B) will improve internal passenger conditions and should be the primary focus of any capital improvements proposed for the station. A second East Entrance, while helpful in providing an additional entry and egress point for passengers, is not a priority capacity investment. However, should WMATA wish to include a new station entrance as part of its future plans, coordination between WMATA and the developer will be necessary. East Mezzanine Improvements The East Mezzanine Improvements provide the greatest relief to Platform congestion and reducing VCE queues within the station: East Mezzanine Extension Provides the greatest relief to Platform congestion and reducing platform to mezzanine VCE queues. The additional space separates boarding and alighting passengers, reducing LOS E & F on the Platform in the Build 2025 simulation compared to the No Build 2025 simulation. Additional Platform to Mezzanine VCEs Reduces queuing at the existing platform tomezzanine escalator without creating additional queues. Also allows for more passengers to exit the Platform, reducing overall congestion and improving safety. New Faregates Additional faregates at the East Mezzanine are not necessary. However, new faregates would allow for increased passenger capacity and mitigate congestion caused by an out of service faregate. Second East Entrance Each of the second East Entrance locations demonstrates unique strengths and weaknesses: Entrance Location 1 (Complete Station Entrance, facing New Jersey Avenue, SE) Provides a highly visible complete station entrance with direct access towards points east (including the Navy Yard and USDOT). However, Location 1 removes a valuable retail opportunity for the developer and is the most expensive location to build (along with Location 3). Final Report 55 April 2016
70 Entrance Location 2 (Elevator Only Option, midblock of M Street, SE) Is the least expensive location to construct construct and preserves the corner retail opportunity at New Jersey Avenue, SE and M Street, SE. However, Location 2 lacks high pedestrian visibility and would not attract as many passengers as a complete station entrance, potentially increasing congestion at the mezzanine level of the existing East Entrance. Entrance Location 3 (Complete Station Entrance, midblock of M Street, SE) Provides a complete station entrance and preserves the corner retail opportunity at New Jersey Avenue, SE and M Street, SE. However, Location 3 is lacks high pedestrian visibility, does not provide direct access to points east (including the Navy Yard and USDOT) and is the most expensive location (along with Location 1). 9.2 Next Steps Further Architectural Analysis for new East Mezzanine Faregate Based on simulation results, a new East Mezzanine faregate is not necessary, but recommended to mitigate passenger congestion caused by an out of service faregate. Presently, the spatial configuration of the East Mezzanine prevents the installation of additional faregates at the faregate array. Further study would be needed to determine how the East Mezzanine could be modified to accommodate an additional standard faregate. Timely Coordination with Developer Regarding New Entrance Location Other entrance configurations and locations may provide benefits to passengers entering and exiting the station via the East Mezzanine, as well as the surrounding neighborhood and future development. It is important that timely coordination with the developer be carried out as soon as possible determine the optimal orientation for mezzanine to street elevators for passengers entering and exiting at the street level, ensuring that elevators will fit seamlessly into the developer s proposed long term plans. Furthermore, a new entrance south of East Entrance Locations 1, 2, and 3 could be considered as an alternative to provide a more direct connection with the Anacostia River and promote future riverfront redevelopment. Further study would be needed to determine the new entrance s design, feasibility, and cost. Final Report 56 April 2016
71 Appendices Final Report April 2016
72 Appendix A: Distribution of Station Entries and Exits for Existing Conditions, No Build 2025, and Build 2025 Simulations Final Report April 2016
73 Distribution of Station Entries and Exits for Existing Conditions, No Build 2025, and Build 2025 Simulations Existing Conditions No Build 2025 AM Exits/ PM Entries AM Entries/ PM Exits AM Exits/ PM Entries AM Entries/ PM Exits Navy Yard Ballpark Station Access Improvements Study AM Exits/ PM Entries Build 2025, Alternative 1 AM Entries/ PM Exits AM Exits/ PM Entries Build 2025, Alternative 2 AM Entries/ PM Exits East Entrance 82% 64% 70% 53% 35% 26.5% 50% 42% Second East Entrance 35% 26.5% 20% 11% West Entrance 18% 36% 30% 47% 30% 47% 30% 47% Source: October 2014 WMATA Faregate Data for Existing Conditions, For the No Build 20A25 distribution, 2025 TAZ Data for the No Build 2025 simulation. Peak Hour Station Entries and Exits for Existing Conditions, No Build 2025 East Entrance Existing Conditions No Build 2025 AM Peak Hour PM Peak Hour AM Peak Hour West Entrance East Entrance West Entrance East Entrance West Entrance East Entrance PM Peak Hour West Entrance Entries , , Exits 1, , Source: October WMATA Faregate Data for Existing Condition, MWCOG 2.3 version 57 (Travel Demand Model) with Round 8.3 Cooperative Land Use Forecast Data for No Build 2025 simulation. Peak Hour Station Entries and Exits for Build 2025 Alternatives East Ent. Build 2025, Alternative 1 Build 2025, Alternative 2 AM Peak Hour PM Peak Hour AM Peak Hour PM Peak Hour Second Second Second Second West East West East West East East East East East Ent. Ent. Ent. Ent. Ent. Ent. Ent. Ent. Ent. Ent. Entries ,064 1, , Exits 1,133 1, , Source: Based on Pedestrian Observation Data and Simulation Forecast Modeling, AECOM West Ent. Final Report April 2016
74 Appendix B: Existing and Future Metrorail Operating Plan Metrorail Operating Service Plans: 2014 and 2018 Origin Destination 2014 (Silver Phase I) 2018 & Beyond (Silver Phase II) Peak Off Peak Peak Off Peak Headway Route Name Shady Grove Glenmont WMREDA Grosvenor Silver Spring WMREDB Greenbelt Branch WMGRNA Mt. Vernon Sq. UDC (peak only) Ft. Totten (off peak only) Franconia Springfield Franconia Springfield Huntington 6 6 Huntington WMYELA (Peak) WMYELA (Off Peak) Largo WMBLUA Greenbelt WMYELB (Peak) Vienna New Carrollton WMORN Dulles Greenway Largo 6 12 WMSILV Wiehle Ave Largo 6 12 WMSILV Final Report April 2016
75 Appendix C: Faregate Capacity Analysis No Build 2025 AM Peak Hour Analysis East Mezzanine (East Entrance) Criteria Output and Unit Methodology Design Capacity of Each Faregate per Minute (Worst Case Scenario) 35 Passengers/minute A Exits Flow 215 Passengers/minute B Faregates Required for Exits (minimum = 1) 7 Gates C = A/B Entry Flow 9 Passengers/minute D Faregates Required for Entries 1 Gate E = D/A ADA Gate (minimum = 1 per array) 1 Gate F Redundant Gate (minimum = 1 per array) 1 Gate G Total Faregates Required 10 Gates H = C+E+F+G Faregates Provided 8 Gates (queue) I No Build 2025 AM Peak Hour Analysis West Mezzanine (West Entrance) Criteria Output and Unit Methodology Design Capacity of Each Faregate per Minute (Worst Case Scenario) 35 Passengers/minute A Exits Flow 92 Passengers/minute B Faregates Required for Exits (minimum = 1) 3 Gates C = A/B Entry Flow 10 Passengers/minute D Faregates Required for Entries 1 Gate E = D/A ADA Gate (minimum = 1 per array) 1 Gate F Redundant Gate (minimum = 1 per array) 1 Gate G Total Faregates Required 6 Gates H = C+E+F+G Faregates Provided 12 Gates (pass) I Final Report April 2016
76 No Build 2025 PM Peak Hour Analysis East Mezzanine (East Entrance) Navy Yard Ballpark Station Access Improvements Study Criteria Output and Unit Methodology Design Capacity of Each Faregate per Minute (Worst Case Scenario) 35 Passengers/minute A Exits Flow 47 Passengers/minute B Faregates Required for Exits (minimum = 1) 2 Gates C = A/B Entry Flow 37 Passengers/minute D Faregates Required for Entries 2 Gates E = D/A ADA Gate (minimum = 1 per array) 1 Gate F Redundant Gate (minimum = 1 per array) 1 Gate G Total Faregates Required 6 Gates H = C+E+F+G Faregates Provided 8 Gates (pass) I No Build 2025 PM Peak Hour Analysis West Mezzanine (West Entrance) Criteria Output and Unit Methodology Design Capacity of Each Faregate per Minute (Worst Case Scenario) 35 Passengers/minute A Exits Flow 42 Passengers/minute B Faregates Required for Exits (minimum = 1) 2 Gates C = A/B Entry Flow 16 Passengers/minute D Faregates Required for Entries 1 Gate E = D/A ADA Gate (minimum = 1 per array) 1 Gate F Redundant Gate (minimum = 1 per array) 1 Gate G Total Faregates Required 5 Gates H = C+E+F+G Faregates Provided 12 Gates (pass) I Final Report April 2016
77 Appendix D: Vertical Circulation Element (VCE) Capacity Analysis No Build 2025 AM Peak Hour Analysis Escalator Number and Direction E2 (Down) E3 (Up) Location West Mezzanine to Platform Platform to West Mezzanine Passenger Volume Required Per Demand Clearance Time (Seconds) Result OK OK E4 (Up) 1 Platform to East Mezzanine QUEUE 1 Includes both escalator and stair demand (both directions) No Build 2025 PM Peak Hour Analysis Escalator Number and Direction E2 (Down) E3 (Up) Location West Mezzanine to Platform Platform to West Mezzanine Passenger Volume Required Per Demand Clearance Time (Seconds) Result OK OK E4 (Up) 1 Platform to East Mezzanine OK 1 Includes both escalator and stair demand (both directions) Final Report April 2016
78 Appendix E: Detailed Engineering Scan 1. Purpose This memorandum outlines the proposed entrance alternatives and provides an engineering assessment of the structural, electrical, and mechanical systems of the Navy Yard Ballpark Metrorail station ( Navy Yard Ballpark station or the station ) in addition to existing street utilities at the proposed entrance locations. 2. Design Options 2.1 Entrance Location 1 Complete Entrance Facing New Jersey Avenue, SE Entrance Location 1 is located on the southwest corner of M Street, SE and New Jersey Avenue, SE, providing a mirror image of the existing entrance to the north. The proposed entrance includes two escalators and one stairway, which lead to the mezzanine level and connect at the existing knock out panel. The footprint of the additional underground walkway is minimal, limiting overall land disturbance. In addition to the escalator entrance, two elevators to the mezzanine would be added to comply with design standards. The east facing elevators are located on M Street, SE in the corner of the proposed parcel limit. 2.2 Entrance Location 2 Elevator Only Midblock Entrance Facing M Street, SE Entrance Location 2 is an elevator only option. This alternative includes three new elevators as well as an emergency stairway all located in the northwest corner of the proposed east parcel. The entrance at the corner of M Street, SE and First Street, SE opens to the north. The stairway and all three elevators will connect at the mezzanine level. This option has the smallest footprint due to the lack of escalators. The proposed passageway connects at the existing knockout panel. 2.3 Entrance Location 3 Complete Midblock Entrance Along M Street, SE Entrance Location 3 is located near the southeast corner of M Street, SE and First Street, SE and opens to the west. As with Entrance Location 1, this option is located in the same developable parcel and incorporates two escalators and one stairway. Two additional elevators would be included in the western adjacent parcel, opening to the north on M Street, SE. All points of access connect at the mezzanine level. The underground passageway, which connects at the existing knockout panel, is slightly larger in this alternative and creates a larger combined footprint. 3. Existing Subsurface Utilities Existing utility information was determined based on as built records. There are multiple utility lines within the roadway that run parallel to M Street, SE as well as New Jersey Avenue, SE. These utilities Final Report April 2016
79 include storm drains, sanitary, gas, water, phone, and electric lines. Sizing varies greatly, from approximately 6 inches to 30 inches in diameter. Information regarding the depth of these utility lines would need to be investigated further. Additionally, there are three large Metrorail vents adjacent to the sidewalk on the southern edge of M Street, SE near the corner of New Jersey Avenue, SE. One of these vents is located above where the knockout panel exists. From a survey of existing utilities, it does not appear that any other utilities exist at the knockout panel location. Farther east, and between two of the vents, there are two 12 inch water lines that run perpendicular across the sidewalk on M Street, SE. None of the three proposed locations suggest serious utility complications. Each option is located outside of the air vent location, both horizontally and vertically. At this level of study it appears that the passageways could be created without interference or with minor modifications. In addition, the conflicting utility lines could most likely be relocated to accommodate construction. Further utility coordination will be required during the joint development process. 4. Mechanical Considerations Elevators and escalators each require machinery rooms to house required electrical and mechanical equipment. These machinery rooms will contain electrical distribution equipment, fire detection, exhaust ventilation, intrusion detection and control at the kiosk. Entrance Locations 1 and 3 both require new escalator control rooms and all three locations require new elevator machine rooms. Drainage will be required for elevators, escalators, and stairwells. Further consideration will be necessary to determine the feasibility of connection into the existing station drainage system or if a new connection to nearby storm drainage is necessary, which would require sump pumps. The Navy Yard Ballpark station is a below grade station which interconnects underground train ways on both ends of the station. The proposed new entrance may impact both the normal and emergency ventilation and further study should be provided to determine any impacts and mitigation. Final Report April 2016
80 5. Electrical Considerations Electrical power will be required for the mechanical equipment, lighting, emergency lighting, and convenience receptacles. Power would be obtained from the existing AC switchboard rooms with electrical feeders installed in conduit to the new machine room electrical distribution equipment. Electrical work would include adding circuit breakers and evaluating the impact of additional loads on the existing normal and emergency (UPS) electrical equipment. 6. System Considerations In addition to standard mechanical and electrical considerations, there are multiple new or revised components that each proposed alternative would require in order to function safely and efficiently. All alternatives will require the following: Closed Circuit Television (CCTV) cameras to monitor the proposed entrance area. Conduits and cables will be required between the CCTV cameras and the existing communications room. Intrusion detection will be required on the machinery room doors. Conduits and cables will be required between the sensors and the existing communication room. Smoke and fire detection will be required in the machinery rooms. Conduits and cables will be required between the detectors and the existing fire alarm panel. Public address speakers will be required in the proposed entrance area. Conduits and cables will be required between the detectors and the existing communication room. Public information display system (PIDS) should be considered for the proposed entrance area. Conduits and cables will be required between the detectors and the existing communication room. Station kiosk modifications will be required to accommodate the additional elevators, escalators, CCTV cameras, intrusion detection, and fire detection devices. Public restroom will need to be updated to comply with current ADA standards. 7. Structural Considerations The current structural considerations are minimal due to the fact that the location of the proposed entrance is a demolished vacant lot. Each of the proposed new East Entrance Locations will connect to the existing station via the knock out panel, which also reduces structural restrictions. There is an existing slurry wall located adjacent to the knockout panel, which will need to be modified based on the extended passageway. However, structural considerations will arise, as the site is part of a development parcel and planned to be developed. The structural design will rely greatly on the developer s plans for the site. WMATA will need to coordinate with the developer for studies during the joint development process. Final Report April 2016
81 Appendix F: Existing Station Area Utility Site Plans Final Report April 2016
82 Final Report April 2016
83 Final Report April 2016
84 Final Report April 2016
85 Final Report April 2016
86 Appendix G: Detailed Capital Cost Estimates Final Report April 2016


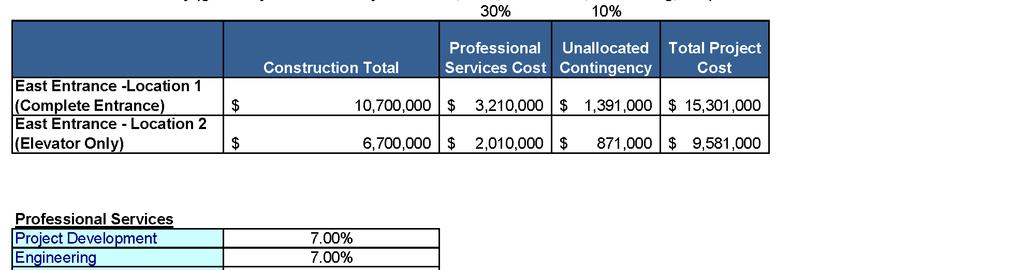
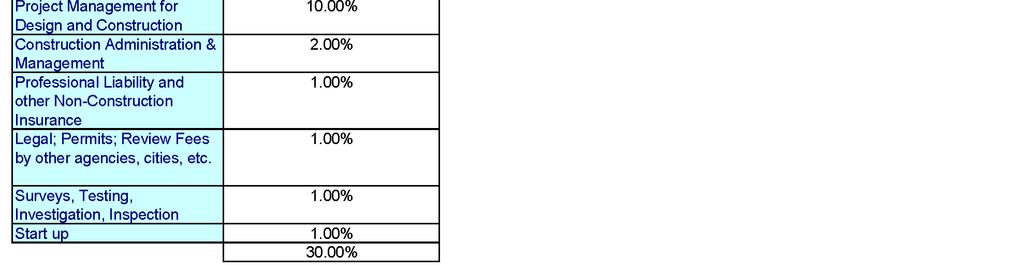
87 Final Report April 2016
88 Final Report April 2016
89 Final Report April 2016
90 Final Report April 2016
91 Final Report April 2016


92 Final Report April 2016


93 Final Report April 2016


94 Final Report April 2016
Bi-County Transitway/ Bethesda Station Access Demand Analysis
 Bi-County Transitway/ Bethesda Station Access Demand Analysis Prepared for: Washington Metropolitan Area Transit Authority Office of Planning and Project Development May 2005 Prepared by: in conjunction
King County Metro. Columbia Street Transit Priority Improvements Alternative Analysis. Downtown Southend Transit Study. May 2014.
 King County Metro Columbia Street Transit Priority Improvements Alternative Analysis Downtown Southend Transit Study May 2014 Parametrix Table of Contents Introduction... 1 Methodology... 1 Study Area...
King Soopers #116 Thornton, Colorado
 Traffic Impact Study King Soopers #116 Thornton, Colorado Prepared for: Galloway & Company, Inc. T R A F F I C I M P A C T S T U D Y King Soopers #116 Thornton, Colorado Prepared for Galloway & Company
ANDERSON PROPERTY SITE ANALYSIS
 ANDERSON PROPERTY SITE ANALYSIS Introduction The Montgomery County Department of Transportation (MCDOT) initiated a feasibility study in the fall of 2012 to evaluate the need for transit service expansion
METRO Orange Line BRT American Boulevard Station Options
 METRO Orange Line BRT American Boulevard Station Options Bloomington City Council Work Session November 18, 2013 Christina Morrison BRT/Small Starts Project Office Coordinating Planning and Design AMERICAN
Chapter 4 : THEME 2. Transportation
 Chapter 4 : THEME 2 Strengthen connections to keep the Central Area easy to reach and get around 55 Figure 4.2.1 Promote region-wide transit investments. Metra commuter rail provides service to the east,
TORONTO TRANSIT COMMISSION REPORT NO.
 Form Revised: February 2005 TORONTO TRANSIT COMMISSION REPORT NO. MEETING DATE: October 24, 2012 SUBJECT: DOWNTOWN RAPID TRANSIT EXPANSION STUDY (DRTES) PHASE 1 STRATEGIC PLAN ACTION ITEM RECOMMENDATIONS
EXECUTIVE SUMMARY. The following is an outline of the traffic analysis performed by Hales Engineering for the traffic conditions of this project.
 EXECUTIVE SUMMARY This study addresses the traffic impacts associated with the proposed Shopko redevelopment located in Sugarhouse, Utah. The Shopko redevelopment project is located between 1300 East and
CEDAR AVENUE TRANSITWAY Implementation Plan Update
 CEDAR AVENUE TRANSITWAY Implementation Plan Update EECUTIVE SUMMARY DECEMBER 2015 Executive Summary In 2013, the Twin Cities metropolitan area s first bus rapid transit (BRT) line, the METRO Red Line,
BROWARD BOULEVARD CORRIDOR TRANSIT STUDY
 BROWARD BOULEVARD CORRIDOR TRANSIT STUDY FM # 42802411201 EXECUTIVE SUMMARY July 2012 GOBROWARD Broward Boulevard Corridor Transit Study FM # 42802411201 Executive Summary Prepared For: Ms. Khalilah Ffrench,
Alpine Highway to North County Boulevard Connector Study
 Alpine Highway to North County Boulevard Connector Study prepared by Avenue Consultants March 16, 2017 North County Boulevard Connector Study March 16, 2017 Table of Contents 1 Summary of Findings... 1
Waco Rapid Transit Corridor (RTC) Feasibility Study
 Feasibility Study") Waco Rapid Transit Corridor (RTC) Feasibility Study Chris Evilia, Director of Waco Metropolitan Planning Organization Allen Hunter, General Manager Waco Transit System Jimi Mitchell, Project Manager AECOM
Waco Rapid Transit Corridor (RTC) Feasibility Study Chris Evilia, Director of Waco Metropolitan Planning Organization Allen Hunter, General Manager Waco Transit System Jimi Mitchell, Project Manager AECOM
2.0 Development Driveways. Movin Out June 2017
 Movin Out June 2017 1.0 Introduction The proposed Movin Out development is a mixed use development in the northeast quadrant of the intersection of West Broadway and Fayette Avenue in the City of Madison.
appendix 4: Parking Management Study, Phase II
 appendix 4: Parking Management Study, Phase II A4-1 A4-2 Eastlake Parking Management Study Final Phase 2 Report Future Parking Demand & Supply January 6, 2017 Submitted by Denver Corp Center III 7900 E.
5. OPPORTUNITIES AND NEXT STEPS
 5. OPPORTUNITIES AND NEXT STEPS When the METRO Green Line LRT begins operating in mid-2014, a strong emphasis will be placed on providing frequent connecting bus service with Green Line trains. Bus hours
Shady Grove. Station Access Improvement Study. Final Report July Washington Metropolitan Area Transit Authority
 Shady Grove Station Access Improvement Study Final Report July 2011 Washington Metropolitan Area Transit Authority Acknowledgements Washington Metropolitan Area Transit Authority Station Area Planning
Location Concept Plan Amendment Recommendation Approved 2011 Concept Plan
 Valley Line West LRT Concept Plan Recommended Amendments Lewis Farms LRT Terminus Site Location Concept Plan Amendment Recommendation Approved 2011 Concept Plan Lewis Farms LRT terminus site, 87 Avenue/West
This letter summarizes our observations, anticipated traffic changes, and conclusions.
 Mr. David Jorschumb Project Manager Boulder Valley School District Re: Review of proposed school access improvements at the Foothills Elementary School in Boulder Dear Mr. Jorschumb, At your request, the
CITY OF ANN ARBOR, MICHIGAN 301 E. Huron St., P.O. Box 8647 Ann Arbor, Michigan
 Date: Wednesday, June 18, 2014 Location: Ann Arbor District Library Attendees: 14 citizen attendees Ann Arbor Station Environmental Review Citizen Working Group Meeting Notes Meeting #3 The third meeting
TRAFFIC IMPACT ANALYSIS
 TRAFFIC IMPACT ANALYSIS Emerald Isle Commercial Development Prepared by SEPI Engineering & Construction Prepared for Ark Consulting Group, PLLC March 2016 I. Executive Summary A. Site Location The Emerald
TRANSPORTATION REVIEW
 TRANSPORTATION REVIEW - PROPOSED MIX OF LAND USES IS CONSISTENT WITH THE CITY S UNDER THE GRANVILLE BRIDGE POLICIES THAT AIM TO MEET NEIGHBOURING RESIDENTS SHOPPING NEEDS AND REDUCE RELIANCE ON AUTOMOBILE
Kendall Drive Premium Transit PD&E Study Project Kick-Off Meeting SR 94/Kendall Drive/SW 88 Street Project Development and Environment (PD&E) Study
 Study") Florida Department of Transportation District Six Kendall Drive Premium Transit PD&E Study Project Kick-Off Meeting SR 94/Kendall Drive/SW 88 Street Project Development and Environment (PD&E) Study What
Florida Department of Transportation District Six Kendall Drive Premium Transit PD&E Study Project Kick-Off Meeting SR 94/Kendall Drive/SW 88 Street Project Development and Environment (PD&E) Study What
2 EXISTING ROUTE STRUCTURE AND SERVICE LEVELS
 2 EXISTING ROUTE STRUCTURE AND SERVICE LEVELS In the Study Area, as in most of the Metro Transit network, there are two distinct route structures. The base service structure operates all day and the peak
Mr. Leif Dormsjo Director, District Department of Transportation 55 M Street, SE Washington, DC July 10, Dear Director Dormsjo,
 Adams Morgan BID Capitol Hill BID Capitol Riverfront BID Coalition for Smarter Growth Destination DC Downtown BID Events DC Federal City Council Georgetown BID Golden Triangle BID Greater Greater Washington
Traffic Impact Analysis West Street Garden Plots Improvements and DuPage River Park Garden Plots Development Naperville, Illinois
 Traffic Impact Analysis West Street Garden Plots Improvements and DuPage River Park Garden Plots Development Naperville, Illinois Submitted by April 9, 2009 Introduction Kenig, Lindgren, O Hara, Aboona,
Transit Access to the National Harbor
 Transit Access to the National Harbor December 2014 Table of Contents Executive Summary... 3 Introduction and Project Purpose... 6 Methodology.. 9 Definition of Alternatives..... 9 Similar Project Implementation
Mercer Island Center for the Arts Parking Management Plan
 Parking Stalls Mercer Island Center for the Arts Parking Management Plan June 15, 2016 This Parking Management Plan (P) covers all tenants at the Mercer Island Center for the Arts (MICA) campus, including
Table of Contents INTRODUCTION... 3 PROJECT STUDY AREA Figure 1 Vicinity Map Study Area... 4 EXISTING CONDITIONS... 5 TRAFFIC OPERATIONS...
 Crosshaven Drive Corridor Study City of Vestavia Hills, Alabama Table of Contents INTRODUCTION... 3 PROJECT STUDY AREA... 3 Figure 1 Vicinity Map Study Area... 4 EXISTING CONDITIONS... 5 TRAFFIC OPERATIONS...
TRAFFIC IMPACT STUDY. USD #497 Warehouse and Bus Site
 TRAFFIC IMPACT STUDY for USD #497 Warehouse and Bus Site Prepared by: Jason Hoskinson, PE, PTOE BG Project No. 16-12L July 8, 216 145 Wakarusa Drive Lawrence, Kansas 6649 T: 785.749.4474 F: 785.749.734
FOR IMMEDIATE RELEASE January 17, CONTACT: Mayor s Press Office
 FOR IMMEDIATE RELEASE January 17, 2012 CONTACT: Mayor s Press Office 312.744.3334 press@cityofchicago.org MAYOR EMANUEL OPENS NEWLY-RENOVATED GRAND AVENUE RED LINE STATION Announces New Green Line Station
UCLA Lake Arrowhead Conference. October 18, 2010
 BART Click to Capacity edit Master Overview title style for UCLA Lake Arrowhead Conference October 18, 2010 0 BART Basics 360,000 daily riders 104 miles 43 stations 1.3 billion annual passenger miles 1
QUALITY OF LIFE EXECUTIVE SUMMARY REPORT I O N S TAT I O N
 QUALITY OF LIFE EXECUTIVE SUMMARY REPORT UN I O N S TAT I O N T R AV E L by TR A I N Published September 2017 2015 PROGRESS MAP This document reports FasTracks progress through 2015 BACKGROUND RTD The
FINAL. Sound Transit Long-Range Plan Update. Issue Paper S.1: Tacoma Link Integration with Central Link. Prepared for: Sound Transit
 Sound Transit Long-Range Plan Update Issue Paper S.1: Tacoma Link Integration with Central Link Prepared for: Sound Transit Prepared by: Quade & Douglas, Inc. FINAL March 2005 Foreword This issue paper
Pace Bus Depot Location Analysis
 Pace Bus Depot Location Analysis Key Notes 1. Options refer to conceptual sketches prepared by Kimley Horn. 2. The depot is assumed to accommodate Pace routes as they currently exist: 17 routes on the
ConnectGreaterWashington: Can the Region Grow Differently?
 Washington Metropolitan Area Transit Authority ConnectGreaterWashington: Can the Region Grow Differently? Transportation Planning Board (TPB) Travel Forecasting Subcommittee July 17, 2015 1 Alternatives
TECHNICAL MEMORANDUM. Part A: Introduction
 TECHNICAL MEMORANDUM To: David J. Decker Decker Properties, Inc. 5950 Seminole Centre Ct. Suite 200 Madison, Wisconsin 53711 608-663-1218 Fax: 608-663-1226 www.klengineering.com From: Mike Scarmon, P.E.,
Presentation Overview. Stop, Station, and Terminal Capacity
 Stop, Station, and Terminal Capacity Mark Walker Parsons Brinckerhoff Presentation Overview Brief introduction to the project Station types & configurations Passenger circulation and level of service Station
Green Line Long-Term Investments
 Enhancements Short-term improvements to keep Austin moving. Investments Long-term projects to support our future. Mobility Hubs MetroRapid MetroRail MetroExpress Connectors Circulators Project Connect
Construction Realty Co.
 MEMORANDUM TO: FROM : Jeff Pickus Construction Realty Co. Luay R. Aboona, PE Principal 9575 West Higgins Road, Suite 400 Rosemont, Illinois 60018 p: 847-518-9990 f: 847-518-9987 DATE: May 22, 2014 SUBJECT:
UCLA Lake Arrowhead Conference. October 18, 2010
 BART Click to Capacity edit Master Overview title style for UCLA Lake Arrowhead Conference October 18, 2010 0 BART Basics 360,000 daily riders 104 miles 43 stations 1.3 billion annual passenger miles 1
UCLA Lake Arrowhead Conference. October 18, 2010
 BART Click to Capacity edit Master Overview title style for UCLA Lake Arrowhead Conference October 18, 2010 0 BART Basics 360,000 daily riders 104 miles 43 stations 1.3 billion annual passenger miles 1
Energy Technical Memorandum
 Southeast Extension Project Lincoln Station to RidgeGate Parkway Prepared for: Federal Transit Administration Prepared by: Denver Regional Transportation District May 2014 Table of Contents Page No. Chapter
Environmental Assessment Derry Road and Argentia Road Intersection
 Air and Noise Study Environmental Assessment Derry Road and Argentia Road Intersection Project 11-4295 City of Mississauga, Region of Peel October 17, 2014 1 Region of Peel Environmental Assessment for
Subarea Study. Manning Avenue (CSAH 15) Corridor Management and Safety Improvement Project. Final Version 1. Washington County.
 Corridor Management and Safety Improvement Project. Final Version 1. Washington County.") Subarea Study Manning Avenue (CSAH 15) Corridor Management and Safety Improvement Project Final Version 1 Washington County June 12, 214 SRF No. 138141 Table of Contents Introduction... 1 Forecast Methodology
Subarea Study Manning Avenue (CSAH 15) Corridor Management and Safety Improvement Project Final Version 1 Washington County June 12, 214 SRF No. 138141 Table of Contents Introduction... 1 Forecast Methodology
Traffic Management Plan and Queuing Analysis Lakehill Preparatory School Z Hillside Drive, Dallas, TX October 27, 2015
 Traffic Management Plan and Queuing Analysis Lakehill Preparatory School Z145-235 2720 Hillside Drive, Dallas, TX October 27, 2015 Introduction: The Lakehill Preparatory School is located on the northeast
Appendix B CTA Transit Data Supporting Documentation
 RED ED-PURPLE BYPASS PROJECT ENVIRONMENTAL ASSESSMENT AND SECTION 4(F) EVALUATION Appendix B CTA Transit Data Supporting Documentation 4( Memorandum Date: May 14, 2015 Subject: Chicago Transit Authority
Executive Summary. Draft Environmental Impact Statement/Environmental Impact Report ES-1
 Executive Summary Introduction The Eastside Transit Corridor Phase 2 Project is a vital public transit infrastructure investment that would provide a transit connection to the existing Metro Gold Line
PROJECT: Wilkinson Road Corridor Improvement Traffic Management Planning Project SUBJECT: Traffic Analysis
 TECHNICAL MEMORANDUM DATE: September 10, 2014 PROJECT 5861.03 NO: PROJECT: Wilkinson Road Corridor Improvement Traffic Management Planning Project SUBJECT: Traffic Analysis TO: Steve Holroyd - District
LAWRENCE TRANSIT CENTER LOCATION ANALYSIS 9 TH STREET & ROCKLEDGE ROAD / 21 ST STREET & IOWA STREET LAWRENCE, KANSAS
 LAWRENCE TRANSIT CENTER LOCATION ANALYSIS 9 TH STREET & ROCKLEDGE ROAD / 21 ST STREET & IOWA STREET LAWRENCE, KANSAS TRAFFIC IMPACT STUDY FEBRUARY 214 OA Project No. 213-542 TABLE OF CONTENTS 1. INTRODUCTION...
Traffic Engineering Study
 Traffic Engineering Study Bellaire Boulevard Prepared For: International Management District Technical Services, Inc. Texas Registered Engineering Firm F-3580 November 2009 Executive Summary has been requested
Transit in Bay Area Blueprint
 Rail~Volution 2010 Click to edit Master title style Transit in Bay Area Blueprint October 21, 2010 0 Bottom Line State-of-Good Repair essential for reliable transit service large funding shortfalls BART
Needs and Community Characteristics
 Needs and Community Characteristics Anticipate Population and Job Growth in the City Strongest density of population and jobs in Ann Arbor are within the Study Area Population expected to grow 8.4% by
Newmarket GO Station Mobility Hub Study. Open House #1 MAY 18, 2017
 Newmarket GO Station Mobility Hub Study Open House #1 Naren Garg Metrolinx Advisor, RER Project Planning Amy Shepherd IBI Group Associate, Manager, Planning INTRODUCTIONS - METROLINX Metrolinx is an agency
Public Meeting. City of Chicago Department of Transportation & Department of Housing and Economic Development
 Public Meeting City of Chicago Department of Transportation & Department of Housing and Economic Development Funded by Regional Transportation Authority September 12, 2011 In partnership with Presentation
Key Findings and Recommendations Introduction and Overview Task 1 Existing Conditions Analysis Task 2 Parking Demand Analysis...
 Table of Contents Introduction and Overview... 1 Key Findings and Recommendations... 1 Task 1 Existing Conditions Analysis... 1 Task 2 Parking Demand Analysis... 1 Task 3 Facilities Cost Analysis... 2
RE: A Traffic Impact Statement for a proposed development on Quinpool Road
 James J. Copeland, P.Eng. GRIFFIN transportation group inc. 30 Bonny View Drive Fall River, NS B2T 1R2 May 31, 2018 Ellen O Hara, P.Eng. Project Engineer DesignPoint Engineering & Surveying Ltd. 200 Waterfront
Interstate Operations Study: Fargo-Moorhead Metropolitan Area Simulation Output
 NDSU Dept #2880 PO Box 6050 Fargo, ND 58108-6050 Tel 701-231-8058 Fax 701-231-6265 www.ugpti.org www.atacenter.org Interstate Operations Study: Fargo-Moorhead Metropolitan Area 2015 Simulation Output Technical
CTA Blue Line Study Area
 CTA Blue Line Study Area HISTORY OF THE CTA BLUE LINE / I-290 SYSTEM Blue Line / I-290 infrastructure is 55 years old First integrated transit / highway facility in the U.S. PROJECT STUDY AREA EXISTING
TEXAS CITY PARK & RIDE RIDERSHIP ANALYSIS
 TEXAS CITY PARK & RIDE RIDERSHIP ANALYSIS This document reviews the methodologies and tools used to calculate the projected ridership and parking space needs from the proposed Texas City Park & Ride to
Executive Summary. Treasure Valley High Capacity Transit Study Priority Corridor Phase 1 Alternatives Analysis October 13, 2009.
 Treasure Valley High Capacity Transit Study Priority Corridor Phase 1 Alternatives Analysis October 13, 2009 Background As the Treasure Valley continues to grow, high-quality transportation connections
Downtown Lee s Summit Parking Study
 Downtown Lee s Summit Parking Study As part of the Downtown Lee s Summit Master Plan, a downtown parking and traffic study was completed by TranSystems Corporation in November 2003. The parking analysis
V. DEVELOPMENT OF CONCEPTS
 Martin Luther King, Jr. Drive Extension FINAL Feasibility Study Page 9 V. DEVELOPMENT OF CONCEPTS Throughout the study process several alternative alignments were developed and eliminated. Initial discussion
Green Line LRT: Beltline Segment Update April 19, 2017
 Green Line LRT: Beltline Segment Update April 19, 2017 Quick Facts On April 11, 2017, City Council approved Administration s recommendation for the Green Line to be underground in the Beltline from 2 Street
TRAFFIC PARKING ANALYSIS
 TRAFFIC PARKING ANALYSIS NAPA FLEA MARKET COUNTY OF NAPA Prepared for: Tom Harding Napa-Vallejo Flea Market 33 Kelly Road American Canyon, CA 9453 Prepared by: 166 Olympic Boulevard, Suite 21 Walnut Creek,
Fresno County. Sustainable Communities Strategy (SCS) Public Workshop
 Public Workshop") Fresno County Sustainable Communities Strategy (SCS) Public Workshop Project Background Senate Bill 375 Regional Transportation Plan (RTP) Greenhouse gas emission reduction through integrated transportation
Fresno County Sustainable Communities Strategy (SCS) Public Workshop Project Background Senate Bill 375 Regional Transportation Plan (RTP) Greenhouse gas emission reduction through integrated transportation
Appendix C. Parking Strategies
 Appendix C. Parking Strategies Bremerton Parking Study Introduction & Project Scope Community concerns regarding parking impacts in Downtown Bremerton and the surrounding residential areas have existed
Parking Management Element
 Parking Management Element The State Transportation Planning Rule, adopted in 1991, requires that the Metropolitan Planning Organization (MPO) area implement, through its member jurisdictions, a parking
US 29 Bus Rapid Transit Planning Board Briefing. February 16, 2017
 US 29 Bus Rapid Transit Planning Board Briefing February 16, 2017 Project Goals Improve the quality of transit service Improve mobility opportunities and choices Enhance quality of life Support master
Update on Bus Stop Enhancements
 Customer Service and Operations Committee Board Information Item III-A February 2, 2012 Update on Bus Stop Enhancements Page 3 of 15 Washington Metropolitan Area Transit Authority Board Action/Information
Develop ground transportation improvements to make the Airport a multi-modal regional
 Project Overview TRANSPORTATION IMPROVEMENTS WHAT ARE THE PROJECT GOALS? Transportation transportation hub. Develop ground transportation improvements to make the Airport a multi-modal regional Land Use
TIMBERVINE TRANSPORTATION IMPACT STUDY FORT COLLINS, COLORADO JANUARY Prepared for:
 TIMBERVINE TRANSPORTATION IMPACT STUDY FORT COLLINS, COLORADO JANUARY 2014 Prepared for: Hartford Companies 1218 W. Ash Street Suite A Windsor, Co 80550 Prepared by: DELICH ASSOCIATES 2272 Glen Haven Drive
STH 60 Northern Reliever Route Feasibility Study Report
 #233087 v3 STH 60 Northern Reliever Route Feasibility Study Report Washington County Public Works Committee Meeting September 28, 2016 1 STH 60 Northern Reliever Route Feasibility Study Hartford Area Development
VIRGINIA RAILWAY EXPRESS MANASSAS PARK STATION PARKING EXPANSION. Site Evaluation & Recommendation. October 18, 2016
 MANASSAS PARK STATION PARKING EXPANSION Site Evaluation & Recommendation October 18, 2016 1 INFORMATION ITEM Project Overview Parking Demand Site Evaluation VRE Recommended Preferred Alternative Next Steps
RTSP Phase II Update
 Washington Metropolitan Area Transit Authority RTSP Phase II Update Presentation to the Technical Advisory Group July 18, 2013 Meeting 1 Presentation Outline RTSP Integration with Momentum RTSP Process
Restoration of Historic Streetcar Services in Downtown Los Angeles
 Restoration of Historic Streetcar Services in Downtown Los Angeles Early Scoping Meeting for Alternatives Analysis (AA) May 17, 2011 Introduction Key players Local lead agency: Metro Federal lead agency:
Parks and Transportation System Development Charge Methodology
 City of Sandy Parks and Transportation System Development Charge Methodology March, 2016 Background In order to implement a City Council goal the City of Sandy engaged FCS Group in January of 2015 to update
EXECUTIVE SUMMARY SEPTEMBER 2005
 DISTRICT OF COLUMBIA TRANSIT ALTERNATIVES ANALYSIS EXECUTIVE SUMMARY SEPTEMBER 2005 DISTRICT OF COLUMBIA DEPARTMENT OF TRANSPORTATION WASHINGTON METROPOLITAN AREA TRANSIT AUTHORITY WHY DOES THE DISTRICT
Address Land Use Approximate GSF
 M E M O R A N D U M To: Kara Brewton, From: Nelson\Nygaard Date: March 26, 2014 Subject: Brookline Place Shared Parking Analysis- Final Memo This memorandum presents a comparative analysis of expected
APPENDIX E. Traffic Analysis Report
 APPENDIX E Traffic Analysis Report THIS PAGE INTENTIONALLY BLANK EAGLE RIVER TRAFFIC MITIGATION PHASE I OLD GLENN HIGHWAY/EAGLE RIVER ROAD INTERSECTION IMPROVEMENTS TRAFFIC ANALYSIS Eagle River, Alaska
IMPROVEMENT CONCEPTS
 IMPROVEMENT CONCEPTS for the South Novato Transit Hub Study Prepared by: January 11, 2010 DKS Associates With Wilbur Smith Associates IMPROVEMENT CONCEPTS Chapter 1: Introduction 1. INTRODUCTION The strategic
Mountainland Association of Governments SPRINGVILLE-SPANISH FORK AREA TRANSPORTATION STUDY APRIL 2012
 Mountainland Association of Governments SPRINGVILLE-SPANISH FORK AREA TRANSPORTATION STUDY APRIL 2012 PLANNING FOR OUR FUTURE Planners with the Mountainland Association of Governments (MAG) have evaluated
US 81 Bypass of Chickasha Environmental Assessment Public Meeting
 US 81 Bypass of Chickasha Environmental Assessment Public Meeting March 14, 2013 Introductions ODOT FHWA SAIC Meeting Purpose Present need for bypass Provide responses to 10/04/11 public meeting comments
To Infill or Not to Infill?
 To Infill or Not to Infill? Mark Fuhrmann Program Director, Rail New Starts Metropolitan Council/Metro Transit MarySue Abel Deputy Project Director, METRO Blue Line Extension Metropolitan Council/Metro
THE CORNERSTONE APARTMENTS TRAFFIC IMPACT STUDY R&M PROJECT NO
 THE CORNERSTONE APARTMENTS SITUATED AT N/E/C OF STAUDERMAN AVENUE AND FOREST AVENUE VILLAGE OF LYNBROOK NASSAU COUNTY, NEW YORK TRAFFIC IMPACT STUDY R&M PROJECT NO. 2018-089 September 2018 50 Elm Street,
Maryland Gets to Work
 I-695/Leeds Avenue Interchange Reconstruction Baltimore County Reconstruction of the I-695/Leeds Avenue interchange including replacing the I-695 Inner Loop bridges over Benson Avenue, Amtrak s Northeast
Green Line LRT: Beltline Recommendation Frequently Asked Questions
 Green Line LRT: Beltline Recommendation Frequently Asked Questions June 2017 Quick Facts Administration has evaluated several alignment options that would connect the Green Line in the Beltline to Victoria
EUGENE-SPRINGFIELD, OREGON EAST WEST PILOT BRT LANE TRANSIT DISTRICT
 EUGENE-SPRINGFIELD, OREGON EAST WEST PILOT BRT LANE TRANSIT DISTRICT (BRIEF) Table of Contents EUGENE-SPRINGFIELD, OREGON (USA)... 1 COUNTY CONTEXT AND SYSTEM DESCRIPTION... 1 SYSTEM OVERVIEW... 1 PLANNING
THE WAY WE MOVE LRT FOR EVERYONE
 THE WAY WE MOVE LRT FOR EVERYONE 2 LRT for Everyone LRT FOR EVERYONE Light rail is about more than transit; it s about transforming Edmonton. As the city grows, so do its transportation needs. LRT is an
APPENDIX C1 TRAFFIC ANALYSIS DESIGN YEAR TRAFFIC ANALYSIS
 APPENDIX C1 TRAFFIC ANALYSIS DESIGN YEAR TRAFFIC ANALYSIS DESIGN YEAR TRAFFIC ANALYSIS February 2018 Highway & Bridge Project PIN 6754.12 Route 13 Connector Road Chemung County February 2018 Appendix
Acknowledgements. Lead Agency: Consultant: Washington Metropolitan Area Transit Authority Station Area Planning and Asset Management
 Acknowledgements Lead Agency: Consultant: Washington Metropolitan Area Transit Authority Station Area Planning and Asset Management Steven E. Goldin, Director Robin McElhenny, Manager of Station Area Planning
Chicago Transit Authority Service Standards and Policies
 Chicago Transit Authority Service Standards and Policies Overview and Objectives The Chicago Transit Authority (CTA) has revised its Service Standards and Policies in accordance with Federal Transit Administration
Traffic Impact Statement (TIS)
") Traffic Impact Statement (TIS) Vincentian PUDA Collier County, FL 10/18/2013 Prepared for: Global Properties of Naples Prepared by: Trebilcock Consulting Solutions, PA 2614 Tamiami Trail N, Suite 615 1205
Traffic Impact Statement (TIS) Vincentian PUDA Collier County, FL 10/18/2013 Prepared for: Global Properties of Naples Prepared by: Trebilcock Consulting Solutions, PA 2614 Tamiami Trail N, Suite 615 1205
Restoration of Historic Streetcar Services in Downtown Los Angeles
 Restoration of Historic Streetcar Services in Downtown Los Angeles Alternatives Analysis Community Update Meeting August 2, 2011 Introduction Key players Local lead agency: Metro Federal lead agency: Federal
Traffic Impact Study Speedway Gas Station Redevelopment
 Traffic Impact Study Speedway Gas Station Redevelopment Warrenville, Illinois Prepared For: Prepared By: April 11, 2018 Table of Contents 1. Introduction... 1 2. Existing Conditions... 4 Site Location...
Highway 18 BNSF Railroad Overpass Feasibility Study Craighead County. Executive Summary
 Highway 18 BNSF Railroad Overpass Feasibility Study Craighead County Executive Summary October 2014 Highway 18 BNSF Railroad Overpass Feasibility Study Craighead County Executive Summary October 2014 Prepared
Dulles Corridor Air Rights Study Investigation
 Dulles Corridor Air Rights Study Investigation Fairfax County Board of Supervisors Transportation Committee September 17, 2013 1 On March 19, 2013 the Fairfax County Board of Supervisors asked FCDOT staff
CITY OF OMAHA OMAHA, NEBRASKA
 DOWNTOWN PARKING NEEDS ASSESSMENT UPDATE CITY OF OMAHA OMAHA, NEBRASKA Prepared for: City of Omaha Parking Division October 15, 2014 FINAL REPORT TABLE OF CONTENTS EXECUTIVE SUMMARY... 1 Study Purpose...
CORE AREA SPECIFIC PLAN
 only four (A, B, D, and F) extend past Eighth Street to the north, and only Richards Boulevard leaves the Core Area to the south. This street pattern, compounded by the fact that Richards Boulevard is
Appendix C-5: Proposed Refinements Rail Operations and Maintenance Facility (ROMF) Traffic Impact Analysis. Durham-Orange Light Rail Transit Project
 Traffic Impact Analysis. Durham-Orange Light Rail Transit Project") Appendix C-5: Proposed Refinements Rail Operations and Maintenance Facility (ROMF) Traffic Impact Analysis Durham-Orange Light Rail Transit Project July 25, 218 ROMF Transportation Impact Analysis Version
Appendix C-5: Proposed Refinements Rail Operations and Maintenance Facility (ROMF) Traffic Impact Analysis Durham-Orange Light Rail Transit Project July 25, 218 ROMF Transportation Impact Analysis Version
TRAIN, BUS & TRANSIT
 TRAIN, BUS & TRANSIT Input Metra 1 Metra does not want to add parking because of space; maxed out on number of cars per train. Developments on Rt. 59 will affect. 2 Should do studies regarding what the