METRO BOARD OF DIRECTORS Public Safety, Customer Service, and Operations
|
|
|
- Alison Singleton
- 5 years ago
- Views:
Transcription
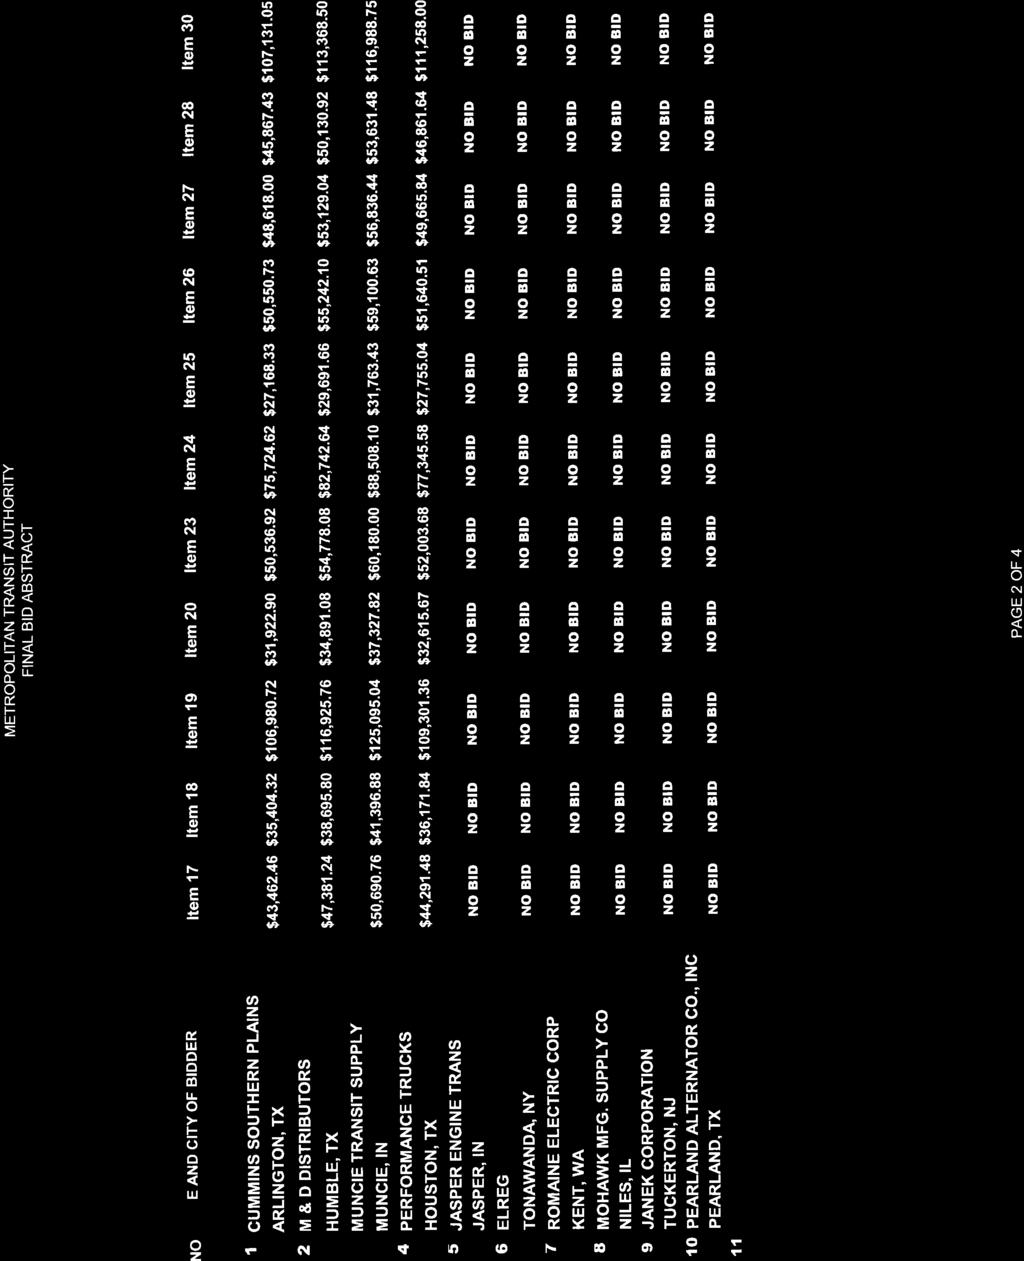
1 Thomas C. Lambert PRESIDENT & CEO METRO BOARD OF DIRECTORS Public Safety, Customer Service, and Operations Working Committee Meeting METRO Board Rm, 2 nd Floor October 24, 2016, 3:30 PM COMMITTEE MEMBERS Jim Robinson, Chair Lisa Castañeda Lex Frieden Don Elder Monthly Safety Message S. Cagan ACTION 1. DELETED A. Skabowski 2. Request Board authorization for the President & CEO to issue purchase cards to vanpool groups for approved purchases of operating expenses including fuel, parking, tolls and minor services. A. Skabowski 3. Request Board authorization to allocate from contingency non allocated Capital Funds included in the FY2017 approved budget to be used for the purchase and installation of a new Wheel Truing Machine. A. Skabowski 4. Request Board authorization for the President & CEO to execute and deliver a requirements contract with the lowest responsive bidders Cummins Southern Plains, LLC and M&D Distributors for the purchase and delivery of Cummins engine parts for METRO s transit vehicles. M. Kyme 5. Request Board authorization for the President & CEO to execute and deliver a one year contract with the lowest responsive bidder Siemens Industry Inc., for the purchase and delivery of central processing units and cable sets for METRO s Rail Signal and Communication System. M. Kyme BRIEFINGS 6. Monthly Public Safety, Customer Service, and Operations Report T. Kelly 7. HOT Lanes FY2017 Budget T. Kelly 8. Monthly Board Speaker Follow-up D. Whitaker Page 1

2

3
4 METRO STAR Vanpool Fuel Card Program Public Safety, Customer Service & Operations Committee October 2016
5 New METRO Vanpool Fuel Card METRO STAR uses fuel cards for the purchase of fuel, parking, tolls, and minor services for remote operation of vanpools. STAR vanpools currently utilize fuel cards arranged through 2Plus of Texas, Inc. (METRO s contractor). The FY2017 budget includes $1,240,913 for establishing a new METRO vanpool fuel card program to begin in November. METRO has included this same amount in passenger fare revenues for FY2017, as these operating expenses are paid by the riders. Purchase cards will be issued under METRO s agreement with Wells Fargo Bank. Cards are assigned to individual vanpool groups for approved purchases. Page 2
6 Card Management and Controls STAR pre-bills groups monthly for leases and estimated fuel, parking, tolls and operating expenses. Restrictions are applied via Merchant Category Codes for all cards. Credit card spending limits are set per transaction, day and month. Credit card transaction limits are set per day and month. Monitoring is provided through online transaction review, card management and detailed reporting. Actual vs. estimated usage adjustments are billed in subsequent periods. Collection procedures are used as needed for delinquent accounts and card abuses. Page 3
7 Staff Recommendation Authorization to create a vanpool fuel card program and issue purchase cards to vanpool groups for approved purchases of fuel, parking, tolls, and minor services. Authorization to modify the contract with 2Plus to remove fuel card issuance responsibility (does not impact contract value). Page 4

8


9 October 2016
, and is over 12 years old.")
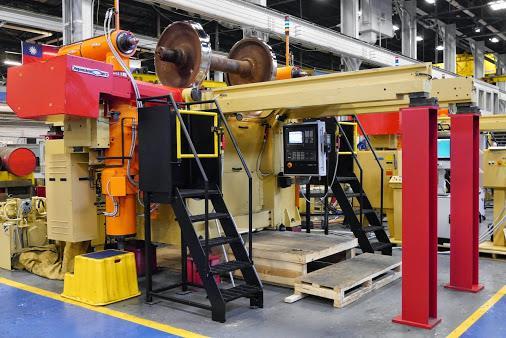
10 Refinishes train wheels by slowly rotating and cutting the wheels surface to make them smooth and even. Existing METRO owned Wheel Truing Machine is located at the Rail Operating Facility (ROC), and is over 12 years old. On average METRO does about 280 vehicle cuts per year since the opening of the new corridors. U Underfloor Wheel Lathe Existing Truing Machine has typically operated for approx hrs./yr. or 12 hrs./day. 2
11 Annual Fleet miles has increased significantly: 900,000 miles/year (18 original LRVs) 3,600,000 miles/year (76 current LRVs) Current Maintenance Contract (Sole Source): Simmons Machine Tool P : Awarded $61,472 1 YR ( ) Calibration and Repair of Equipment (Quarterly & Annual Maintenance) P : Awarded $24,500 Expired ( ) - Total amount of funds have been spent. Recent Failures: 44% down time within past year (System inoperable 23 weeks over the past 12 months) Routine Maintenance can no longer keep the machine operational Machine has reached it end of useful life and is in need of replacement 3

 Dramatic increase in operating budget Increased possibility of derailment Reduced vehicle availability")
12 Cost with Truing Machine: In-House wheel repair costs are approximately $319 per vehicle, and renders a vehicle inoperable for up to one (1) day Cost of 3 rd Party Cutting Wheels: Impact/risks on daily operations: Considerable cost to remove wheels and send offsite Material - $9,600 per vehicle METRO Labor - $11,970 per vehicle Annual Cost - $3.3M (Workforce requirement of 15) Dramatic increase in operating budget Increased possibility of derailment Reduced vehicle availability Reduction in Wheel Life Increase in customer complaints due to rough train rides. 4
13 Option 1: Purchase (1) new U Wheel Truing Machine for the ROC Pros Reliable wheel truing capabilities No out of service time for on site wheel truing New units with state of the art controls, features and components Purchase price includes new Car Mover New Purchase Repair Warranty (2 YR) Turnkey Installation Avoids costs for 3 rd Party Outsourcing for 4-6 month teardown, rebuild & re-installation Payback on investment = 13 months Cons Delivery timeframe months. TOTAL COST: $3,503,000 5
14 Option 2: Go straight to 3 rd Party for Cutting Wheels Pros No up front capital from METRO No Preventative Maintenance Cost $61,472 yearly Cons Wheel Truing Costs are $9,600 for material per vehicle due wheels being shipped off-site for truing. Ship out 100 Cars sets per year total Material Cost $960,000 for truing Head Count increase of 15 needed to support removal and installation tires to be shipped out for truing. Annual labor $1,260,000 Renders vehicle inoperable for 3 to 5 days for one vehicle Need 4 car sets of wheels to start campaign $109,000 and minimize vehicle down time. Outsource Vendor needs to have multiple sets of wheels before schedule truing Reduction of vehicle availability Reduction in ride Quality Significantly higher Operating Cost vs. One time Capital Expenditure 5 year Operating cost impact $16.5M TOTAL COST: $3,300,000 Yearly 6
15 Recommend Option #1. 7


16

17

18

19
20

21

22
23

24

25

26

27

28

29
30

31
32 BOARD BRIEFING SUMMARY SUBJECT: AGENDA ITEM #: Monthly Report - Public Safety, Customer Service & Operations AGENDA DATE: DEPARTMENT: Safety, Police, Customer Service & Operations PRESENTER: Timothy H. Kelly SUMMARY: A monthly report of Key Performance Indicators (KPIs) for METRO's: - Safety - Police - HOV/HOT Lanes - Customer Contact Center - Customer & Ridership Services - Operations (Bus, Rail, METROLift, STAR Vanpool)

33
34 Public Safety, Customer Service, Operations Board Committee Meeting Monthly Report Report Content & Page Number 3 SAFETY 4 POLICE 7 HOV / HOT LANES 8 CUSTOMER CONTACT CENTER 9 CUSTOMER & RIDERSHIP SERVICES 10 OPERATIONS OPERATIONS - BUS OPERATIONS - STAR VANPOOL OPERATIONS - RAIL OPERATIONS - METROLIFT Page 2 of 14
35 Oct Nov Dec Jan Feb Mar Apr May Jun Jul Aug Sep Oct Nov Dec Jan Feb Mar Apr May Jun Jul Aug Sep Public Safety, Customer Service, Operations Board Committee Meeting Monthly Report SAFETY MEASURE DEFINITION Benchmark Bus Accidents Transit incident with passenger injuries that requires immediate medical treatment away from the scene or a collision between a bus and an object such that the amount of damage exceeds $1, FY15 FY16 Benchmark Oct Nov Dec Jan Feb Mar Apr May Jun Jul Aug Sep FY FY Benchmark Preventable Non-Preventable MEASURE DEFINITION Benchmark Rail Accidents Reflect collisions between METRORail and other vehicles, pedestrians or bicyclists FY 15 FY16 Benchmark Oct Nov Dec Jan Feb Mar Apr May Jun Jul Aug Sep FY FY Benchmark Preventable Non-Preventable Page 3 of 14
36 OCT NOV DEC JAN FEB MAR APR MAY JUN JUL AUG SEP POLICE Public Safety, Customer Service, Operations Board Committee Meeting Monthly Report MEASURE DEFINITION Benchmark These crimes include Homicide, (Agg) Sexual Assault, Robbery, Agg Assault, Burglary, Larc/Theft, Part I Crime 70 Auto Theft and Arson. 80 FY15 FY16 Benchmark is 70 Crime Type September Oct Nov Dec Jan Feb Mar Apr May Jun Jul Aug Sep Homicide Robbery Burglary Auto Theft (Agg) Sex Assault Agg Assault Larc/Theft Arson MEASURE Part I Crime By Location DEFINITION Incidents that occur on METRO property, meaning Park & Ride lots, Transit Centers, On-board Buses and Light Rail Vehicles (LRVs) and on Light Rail Vehicle (LRV) Platforms. Benchmark 30 P&R/TC/Bus/Rail & Platform Park & Ride Transit Center On-Board Bus On-Board LRV LRV Platform Benchmark is OCT NOV DEC JAN FEB MAR APR MAY JUN JUL AUG SEP Page 4 of 14
37 Public Safety, Customer Service, Operations Board Committee Meeting Monthly Report MEASURE Part II Crime DEFINITION All other criminal offenses that occur on METRO property, meaning Park & Ride lots, Transit Centers, on-board Buses and Light Rail Vehicles (LRVs) and on Light Rail Vehicle (LRV) Platforms not qualified as a Part I Crime. FY Oct Nov Dec Jan Feb Mar Apr May Jun Jul Aug Sep 60 LRV Platform On Board Bus SEPTEMBER Park and Ride Transit Center On Board Bus Bus Op. Facility Bus Shelter Bus Stop Non Transit Building (store, com.) Facility HOV Lane On Board LRV LRV Platform Rail Tracks Extra Job Traffic Stop Pedestrian Stop Along Rail, But Not System Along the Bus Route Parking Lot / Garage (Lot B) METROLift Page 5 of 14
38 Public Safety, Customer Service, Operations Board Committee Meeting Monthly Report MEASURE Code of Conduct Suspension Notices DEFINITION The total number of METRO Code of Conduct Suspension Notices issued per month for violation of prohibited conduct on METRO property. A suspension notice may only be issued by a METRO Police Officer. FY Oct Nov Dec Jan Feb Mar Apr May Jun Jul Aug Sep Page 6 of 14
39 HOV / HOT LANES MEASURE DEFINITION Public Safety, Customer Service, Operations Board Committee Meeting Monthly Report Citations Issued The total number of METRO HOV/HOT citations issued per month and per freeway corridor. Citations are issued by a Police Officer and could be either a warning citation or finable citation FY16 Totals N 45S N 59S 0 Oct Nov Dec Jan Feb Mar Apr May Jun Jul Aug Sep 0 SEPTEMBER MEASURE Average Lane Speed DEFINITION The average lane speed from both the AM (7-8) and PM (5-6) peak hours of operation on all five HOV lanes are held to an FTA set goal of 45 mph at minimum. The speed it measured using data collected when a vehicle, with a toll tag, enters the lane and travels the full length. The system measures that vehicles entry and exit of the lane and an algorithm calculates the speed based on that data. Goal 45 mph 45N 45S SEPTEMBER N 59S Goal is 45 mph AUGUST SEPTEMBER 45N AM 7a-8a 45N PM 5p-6p 45S AM 7a-8a 45S PM 5p-6p 290 AM 7a-8a 290 PM 5p-6p 59N AM 7a-8a 59N PM 5p-6p 59S AM 7a-8a 59S PM 5p-6p Page 7 of 14
40 305 3,013 3,019 2,681 3,002 2,746 2,449 2,408 2,755 2,465 2, , , , , , ,701 97,445 96, ,820 99,521 96,893 94,030 94,444 89,171 :01:33 :01:27 :01:22 :01:21 :01:23 :01:23 :01:23 :02:04 :01:57 :01:45 :01:30 :02:09 CUSTOMER CONTACT CENTER Public Safety, Customer Service, Operations Board Committee Meeting Monthly Report MEASURE DEFINITION MEASURE DEFINITION Benchmark Call Volume Number of calls in queue during a certain period of time. Average Wait Time Amount of time a call waits in queue to be processed or answered. 2 min FY15 FY16 FY15 FY16 Benchmark 250,000 :04:19 200,000 :03:36 150,000 :02:53 :02:10 100,000 :01:26 50,000 :00:43 0 Oct Nov Dec Jan Feb Mar Apr May Jun Jul Aug Sep :00:00 Oct Nov Dec Jan Feb Mar Apr May Jun Jul Aug Sep MEASURE Complaints DEFINITION Public comment which expresses dissatisfaction with any aspect of METRO s service, programs or activities. MEASURE Commendations DEFINITION Public comment which expresses satisfaction or praise for METRO s service, program or activities. FY15 FY16 FY15 FY16 5,000 4,500 4,000 3,500 3,000 2,500 2,000 1,500 1, Oct Nov Dec Jan Feb Mar Apr May Jun Jul Aug Sep Oct Nov Dec Jan Feb Mar Apr May Jun Jul Aug Sep Page 8 of 14
41 321 8,803 8,406 7,724 8, , ,563 9,012 9, ,630 9,442 9,804 9, CUSTOMER & RIDERSHIP SERVICES Public Safety, Customer Service, Operations Board Committee Meeting Monthly Report MEASURE DEFINITION Goal MEASURE DEFINITION Goal Retailers Accounts Resellers of METRO fare media. 20 New Annually Ridesponsor Accounts A corporate subsidy program where companies can pay all or a portion of the cost of transit as a tax-free benefit for their employees. 20 New Annually FY15 FY16 FY15 FY Oct Nov Dec Jan Feb Mar Apr May Jun Jul Aug Sep 0 Oct Nov Dec Jan Feb Mar Apr May Jun Jul Aug Sep MEASURE DEFINITION MEASURE DEFINITION Fannin South Daily Parkers Customers who pay (a machine) to park at Fannin South on a daily bases. This does NOT include employee parkers. Fannin South Monthly Parkers Customers who pay once a month for parking at Fannin South. This does NOT include employee parkers. FY15 FY16 FY15 FY16 12, , , , , , Oct Nov Dec Jan Feb Mar Apr May Jun Jul Aug Sep - Oct Nov Dec Jan Feb Mar Apr May Jun Jul Aug Sep Page 9 of 14
42 , ,811 1,843 2,649 14,114 3,451 4,187 1,622 2,277 3, ,261 1,335 1,810 1,987 3, ,692 Public Safety, Customer Service, Operations Board Committee Meeting Monthly Report MEASURE Special & Premium Events DEFINITION Special Events include activities held at NRG Stadium, Colleges, Universities, etc. where Q Cards are distributed to riders. Premium Events are high demand events, such as HLS&R Rodeo, Houston Texans Games, Offshore Technology Conference, or any major event where attendance is very high. Rates may vary by event. FY15 Special Events FY16 Special Events FY15 Premium Events FY16 Premium Events 3, ,000 3, ,000 2, ,000 2,000 80,000 1,500 60,000 1,000 40, , Oct Nov Dec Jan Feb Mar Apr May Jun Jul Aug Sep Oct Nov Dec Jan Feb Mar Apr May Jun Jul Aug Sep OPERATIONS MEASURE DEFINITION Benchmark Complaints Per Boarding Public comment which expresses dissatisfaction with any aspect of METRO s service, programs or activities, reported as the number of complaints per 100,000 boarding s. < Complaints per 100,000 Boardings Benchmark Oct Nov Dec Jan Feb Mar Apr May Jun Jul Aug Sep Complaints per 100,000 Boardings Benchmark *The number of Complaints per 100,000 Boarding's reported each month is subject to slight adjustment based on audit and/or further research that may cause a reclassification of a complaint to a comment (or vice versa). Based on further research/audit/reclassification of complaint to comment, the most accurate numbers will be reported to-date. Page 10 of 14
43 OPERATIONS - BUS Public Safety, Customer Service, Operations Board Committee Meeting Monthly Report MEASURE DEFINITION Goal Considered on-time if it does not leave early and is within a five (5) minute window, after the Local OTP 80% scheduled departure time. Local - Bus Goal 100.0% 90.0% 80.0% 72.9% 76.0% 74.8% 70.0% 71.7% 72.3% 73.0% 72.9% 74.4% 75.7% 75.2% 74.6% 70.0% 60.0% 50.0% 40.0% 30.0% 20.0% 10.0% 0.0% Oct Nov Dec Jan Feb Mar Apr May Jun Jul Aug Sep Local - Bus 72.9% 76.0% 74.8% 70.0% 71.7% 72.3% 73.0% 72.9% 74.4% 75.7% 75.2% 74.6% Goal 70% 69% 65% 70% 70% 75% 77% 80% 78% 80% 79% 80% MEASURE Park & Ride OTP DEFINITION Considered on-time if it does not depart early (except when leaving a Park & Ride lot in the morning because it s full) and is within a five (5) minute widow, after the scheduled departure time. Goal 75% Park & Ride - Bus Goal is 75% 100.0% 90.0% 80.0% 70.0% 60.0% 50.0% 40.0% 30.0% 20.0% 10.0% 0.0% 76.9% 75.4% 74.8% 74.8% 74.9% 76.0% 78.4% 77.9% 73.6% 75.7% 75.1% 77.0% Oct Nov Dec Jan Feb Mar Apr May Jun Jul Aug Sep Page 11 of 14
44 181, , , , , , , , , , , ,237 Public Safety, Customer Service, Operations Board Committee Meeting Monthly Report MEASURE DEFINITION Goal Reflects any mechanical issue encountered during operation of the vehicle in revenue service that Bus MDBF requires a maintenance action resulting from a mechanical failure; includes warranty and fleet 7,750 defects but excludes accidents. Mean Distance Between Mechanical Failures - All Buses Goal 14,000 12,000 10,000 8,000 6,000 4,000 2,000 - Oct Nov Dec Jan Feb Mar Apr May Jun Jul Aug Sep OPERATIONS - STAR VANPOOL MEASURE Passenger Trips DEFINITION The number of passenger trips taken on any STAR Vanpool routes. FY15 FY16 250, , , ,000 50,000 - Oct Nov Dec Jan Feb Mar Apr May Jun Jul Aug Sep *Reflects the estimated number of passenger trips for the month, all logs are not received and data processed in time for this report. True number for STAR Vanpool passenger trips will be reflected in next month's report. Page 12 of 14
45 Oct Nov Dec Jan Feb Mar Apr May Jun Jul Aug Sep Oct Nov Dec Jan Feb Mar Apr May Jun Jul Aug Sep Oct Nov Dec Jan Feb Mar Apr May Jun Jul Aug Sep OPERATIONS - RAIL Public Safety, Customer Service, Operations Board Committee Meeting Monthly Report MEASURE DEFINITION Goal Goal Goal Considered on-time when the train departs from the beginning of the line and Rail OTP arrives at the end of the line less than five (5) minutes after the scheduled 95% 85% 85% time. 100% 90% 80% 70% 60% 50% 40% 30% 20% 10% 0% Rail - Red Line Goal is 95% 100% 90% 80% 70% 60% 50% 40% 30% 20% 10% 0% Rail - Green Line Goal is 85% 100% 90% 80% 70% 60% 50% 40% 30% 20% 10% 0% Rail - Purple Line Goal is 85% MEASURE Rail MDBSI DEFINITION Mean Distance Between Service Interruptions (MDBSI) is classified as any interruption where passengers are delayed by one (1) minute or greater of lost time. Goal 12,000 40,000 35,000 30,000 25,000 20,000 15,000 10,000 5,000 Mean Distance Between Service Interruptions - Rail Goal is 12,000 - Oct Nov Dec Jan Feb Mar Apr May Jun Jul Aug Sep Page 13 of 14
46 153, , , , , , , , , , , ,077 OPERATIONS - METROLIFT Public Safety, Customer Service, Operations Board Committee Meeting Monthly Report MEASURE DEFINITION MEASURE DEFINITION Goal Passenger Trips The number of non-unique passengers who board METROLift vehicles (van, minivan, taxi cab backup, METROLift Subsidized Program (MSP)). On Time Performance The percentage of pickups and/or drop-offs made within a designated service window (30 minutes) including appointment times. 90% FY15 FY16 FY15 FY16 Goal is 90% 180, % 170, % 160, , % 88.0% 86.0% 140, % 130,000 Oct Nov Dec Jan Feb Mar Apr May Jun Jul Aug Sep 82.0% Oct Nov Dec Jan Feb Mar Apr May Jun Jul Aug Sep MEASURE DEFINITION Goal MEASURE DEFINITION Benchmark The average number of vehicle-miles Mean Distance traveled before a mechanical failure (breakdown). *Prior months are subject to 19,000 No-Shows The percent of all scheduled trips when a customer fails to < 3% Before Failure documentation. shift based on finalization of contractor show up for a scheduled trip. Mean Distance Between Mechanical Failures - METROLift FY15 FY16 Benchmark is < 3% 35,000 30,000 Goal is 19,000 4% 3% 3% 25,000 2% 20,000 2% 15,000 1% 10,000 1% 5,000 Oct Nov Dec Jan Feb Mar Apr May Jun Jul Aug Sep 0% Oct Nov Dec Jan Feb Mar Apr May Jun Jul Aug Sep Page 14 of 14
47 BOARD BRIEFING SUMMARY SUBJECT: AGENDA ITEM #: HOT Lanes Project, Phase, 1B FY2017 Budget AGENDA DATE: DEPARTMENT: Operations PRESENTER: Tim Kelly SUMMARY: The FY2017 HOT Lanes initiative will facilitate design coordination of HOT lanes extension along I-45 South, US-290 and design review of I-45 North Highway Improvement Project by TxDOT. These and other projects need detailed design review and coordination for connection to METRO facilities and toll operation. In addition, all these projects need METRO's coordination to ensure proper traffic operation during construction. Funding for HOT lanes project will ensure adequate funds are in place for detailed design review and coordination on current and future TxDOT projects. METRO is responsible for procurement and installation of Automated Reversible Gate Operation (ARGO), Restraining Barrier System, Dynamic Message Signs and toll related equipment on I-45 South and US-290. METRO's involvement with I-45 North Highway Improvement Project ensures METRO's future bus operation on the future Managed Lanes by TxDOT. METRO is also coordinating with TxDOT to preserve an envelope within I-45 North Right-of-Way (ROW) for future High Capacity Transit.
48 Public Safety, Customer Service & Operations Committee October 24, 2016
49 Funding for HOT Lanes capital was not included in the approved Fiscal Year 2017 capital budget. Funding for HOT Lanes capital will ensure adequate funds are in place for existing HOT Lanes projects and funds for design coordination on current and future TXDOT designs. Current projects include US290, I-45N, and I-45S. These projects are currently moving forward in TxDOT s CIP. 2
50 Capital Programs and Operations divisions are re-allocating the capital budget dollars for fiscal year The proposed changes are: Budget Project Code Reduction of West Loop Bus Lane Capital $(850,000) Increase of HOT Lanes Conversion $ 850,000 53E141 The HOT Lanes project is grant funded. Local dollars to be expended on this project for fiscal year 2017 will be $170,000. The reduction of the West Loop Bus Lane budget will leave adequate funds in place for design and project management in fiscal year
51 BOARD BRIEFING SUMMARY SUBJECT: AGENDA ITEM #: BOARD SPEAKER FOLLOWUP AGENDA DATE: DEPARTMENT: CUSTOMER SERVICE PRESENTER: DANICEL WHITAKER SUMMARY:
Notice and Agenda of a Meeting of the Board of Directors Public Safety, Customer Service & Operations Committee
 Thomas C. Lambert President & CEO PUBLIC SAFETY, CUSTOMER SERVICE & OPERATIONS Notice and Agenda of a Meeting of the Board of Directors Public Safety, Customer Service & Operations Committee Metropolitan
Presentation to the Customer Service, Operations and Safety Committee OPERATIONS PERFORMANCE INDICATORS
 Presentation to the Customer Service, Operations and Safety Committee OPERATIONS PERFORMANCE INDICATORS May 19, 2005 Department of Operations 100 95 90 85 80 75 70 65 A B C D RAIL PERFORMANCE INDEX FY
PUBLIC SAFETY, CUSTOMER SERVICE & OPERATIONS ACTIONS COMMITTEE APPROVALS
 PUBLIC SAFETY, CUSTOMER SERVICE & OPERATIONS Thomas C. Lambert President & CEO COMMITTEE MEMBERS Jim Robinson, Chair Lisa Castañeda Lex Frieden Don Elder Notice and Agenda of a Meeting of the Public Safety,
Notice and Agenda of a Meeting of the Board of Directors Public Safety, Customer Service & Operations Committee
 PUBLIC SAFETY, CUSTOMER SERVICE & OPERATIONS Thomas C. Lambert President & CEO COMMITTEE MEMBERS Jim Robinson, Chair Lisa Castañeda Lex Frieden Don Elder Notice and Agenda of a Meeting of the Board of
High Quality Service through Continuous Improvement st Quarter Performance Report
 High Quality Service through Continuous Improvement 6 st Quarter Performance Report TriMet Board Meeting May 5, 6 Quality is a never ending quest and continuous improvement is a never ending way to discover
Paid Parking at Park & Ride Lots: Framing the Issues. Capital Programs Committee May 2014
 Paid Parking at Park & Ride Lots: Framing the Issues Capital Programs Committee May 2014 Outline Current Status Industry Review DART Case Study Issues Alternatives Mechanics 2 Current Status: All Lots
Van Ness Transit Corridor Improvement Project. Engineering, Maintenance and Safety Committee March 25, 2015
 Van Ness Transit Corridor Improvement Project Engineering, Maintenance and Safety Committee March 25, 2015 Project Need 16,000 daily passenger boardings within the project corridor Average bus speed 8
Greater Cleveland Regional Transit Authority
 Greater Cleveland Regional Transit Authority Summary of Proposed Award Vanpool Program Presented to: Operations Committee August 2, 2016 What is a Vanpool? A vanpool is a group of people (larger than 5)
Safety Communications Campaign
 Washington Metropolitan Area Transit Authority Safety Communications Campaign June 2012 Safety Communications Strategy Target: Five percent injury reduction Focus on basics most injuries are slips, trips,
Sound Transit Operations July 2016 Service Performance Report. Ridership
 Ridership Total Boardings by Mode Mode Jul-15 Jul-16 % YTD-15 YTD-16 % ST Express 1,618,779 1,545,852-4.5% 10,803,486 10,774,063-0.3% Sounder 333,000 323,233-2.9% 2,176,914 2,423,058 11.3% Tacoma Link
ANNUAL SUMMARY REPORT FY 2005 PERFORMANCE REPORT SUMMARY COMPARATIVE ANALYSIS
 ANNUAL SUMMARY REPORT FY 2005 PERFORMANCE REPORT SUMMARY COMPARATIVE ANALYSIS RAIL OPERATIONS: Rail Passenger injuries increased from 34 in FY04 to 41 in FY05. The Woodley Park collision accounted for
Commercial-in-Confidence Ashton Old Baths Financial Model - Detailed Cashflow
 Year 0 1 2 3 4 5 6 7 8 9 10 11 12 13 Oct-16 Nov-16 Dec-16 Jan-17 Feb-17 Mar-17 Apr-17 May-17 Jun-17 Jul-17 Aug-17 Sep-17 Oct-17 2,038 2,922 4,089 4,349 6,256 7,124 8,885 8,885 8,885 8,885 8,885 8,885 9,107
Automated Occupancy Detection October 2015 (Phase I) Demonstration Results Presented by Kathy McCune
 Demonstration Results Presented by Kathy McCune") Automated Occupancy Detection October 2015 (Phase I) Demonstration Results Presented by Kathy McCune 2016 TRB Managed Lanes Conference May 5th, Session 6 Presentation Background Outline Metro ExpressLanes
Automated Occupancy Detection October 2015 (Phase I) Demonstration Results Presented by Kathy McCune 2016 TRB Managed Lanes Conference May 5th, Session 6 Presentation Background Outline Metro ExpressLanes
ScoreCard November 2013 [Oct 13 Data] Ridership
![ScoreCard November 2013 [Oct 13 Data] Ridership](/thumbs/95/126521028.jpg "ScoreCard November 2013 [Oct 13 Data] Ridership") ScoreCard November 213 [Oct 13 Data] Ridership Average Weekday Ridership Sep 213: 1.37M Down.2 % from Sep 212 System Maintenance A key measure of system maintenance is the travel time impact of slowdowns
ScoreCard November 213 [Oct 13 Data] Ridership Average Weekday Ridership Sep 213: 1.37M Down.2 % from Sep 212 System Maintenance A key measure of system maintenance is the travel time impact of slowdowns
RIDERSHIP TRENDS. March 2017
 RIDERSHIP TRENDS March 2017 Prepared by the Division of Strategic Capital Planning May 2017 Table of Contents Executive Summary...1 Ridership...3 Estimated Passenger Trips by Line...3 Estimated Passenger
Capital Needs Assessment Riders Advisory Council July2, 2008
 Capital Needs Assessment 2011-2020 Riders Advisory Council July2, 2008 1 Outline I. Capital Improvement Plan History II. Capital Improvement Plan Update III. Capital Needs Assessment State of Good Repair
Northeast Corridor Alternatives Analysis. Public Involvement Round 2 Input on Alternatives for Further Study
 Northeast Corridor Alternatives Analysis Public Involvement Round 2 Input on Alternatives for Further Study Feb. 7-9, 2012 Agenda Review project background Progress summary Recommended alternatives for
Strategic Plan Performance Metrics & Targets
 San Francisco Municipal Transportation Agency Strategic Plan Performance Metrics & Targets Fiscal Year 2019 Fiscal Year 2020 April 3, 2018 SAFETY Goal 1: Create a safer transportation experience for everyone.
MONTHLY PERFORMANCE DASHBOARD
 AUSTIN ENERGY MARCH 21 MONTHLY PERFORMANCE DASHBOARD A report highlighting key Austin Energy metrics for uary FY 21 FINANCIAL HEALTH Standard and Poor s Bond Rating Current AA AA Budget Based Revenues
Performance Measures Second Quarter 2012
 Performance Measures Second Quarter 2012 2Q2011 Earn & Retain Community Trust 6 Performance Measures: Ridership Cost Effectiveness (Cost per Passenger) Cost Efficiency (Cost per Revenue Hour) Service Effectiveness
Customer Service, Operations and Security Committee. Information Item III-A. January 12, 2017
 Customer Service, Operations and Security Committee Information Item III-A January 12, 2017 Train Reliability Program Page 4 of 19 Washington Metropolitan Area Transit Authority Board Action/Information
May 23, 2011 APTA Bus & Paratransit Conference. Metro ExpressLanes
 May 23, 2011 APTA Bus & Paratransit Conference Metro ExpressLanes Program Overview > Conversion of HOV lanes to HOT lanes on I-10 and I-110 > Multi-modal Integrated Corridor Emphasis > 1 of 6 Nationwide
MONTHLY PERFORMANCE DASHBOARD
 AUSTIN ENERGY JULY MONTHLY PERFORMANCE DASHBOARD A report highlighting key Austin Energy metrics for e FY FINANCIAL HEALTH Standard and Poor s Bond Rating Austin Energy Rating AA AA Budget Based Revenues
MONTHLY PERFORMANCE DASHBOARD
 AUSTIN ENERGY MONTHLY PERFORMANCE DASHBOARD A report highlighting key Austin Energy metrics for uary FY 219 FINANCIAL HEALTH Standard and Poor s Bond Rating Austin Energy Rating AA AA Budget Based Revenues
Paratransit Overview O & O Presentation January 11, 2018
 Paratransit Overview O & O Presentation January 11, 2018 Our vision is to be a valued regional partner that drives prosperity and makes life better for our community. Our mission is to connect Hampton
COMPARISON OF FIXED & VARIABLE RATES (25 YEARS) CHARTERED BANK ADMINISTERED INTEREST RATES - PRIME BUSINESS*
 CHARTERED BANK ADMINISTERED INTEREST RATES - PRIME BUSINESS*") COMPARISON OF FIXED & VARIABLE RATES (25 YEARS) 2 Fixed Rates Variable Rates For Internal Use Only. FIXED RATES OF THE PAST 25 YEARS AVERAGE RESIDENTIAL MORTGAGE LENDING RATE - 5 YEAR* (Per cent) Year
COMPARISON OF FIXED & VARIABLE RATES (25 YEARS) 2 Fixed Rates Variable Rates For Internal Use Only. FIXED RATES OF THE PAST 25 YEARS AVERAGE RESIDENTIAL MORTGAGE LENDING RATE - 5 YEAR* (Per cent) Year
COMPARISON OF FIXED & VARIABLE RATES (25 YEARS) CHARTERED BANK ADMINISTERED INTEREST RATES - PRIME BUSINESS*
 CHARTERED BANK ADMINISTERED INTEREST RATES - PRIME BUSINESS*") COMPARISON OF FIXED & VARIABLE RATES (25 YEARS) 2 Fixed Rates Variable Rates FIXED RATES OF THE PAST 25 YEARS AVERAGE RESIDENTIAL MORTGAGE LENDING RATE - 5 YEAR* (Per cent) Year Jan Feb Mar Apr May Jun
COMPARISON OF FIXED & VARIABLE RATES (25 YEARS) 2 Fixed Rates Variable Rates FIXED RATES OF THE PAST 25 YEARS AVERAGE RESIDENTIAL MORTGAGE LENDING RATE - 5 YEAR* (Per cent) Year Jan Feb Mar Apr May Jun
Monterey County Freeway Service Patrol Annual Report
 Monterey County Freeway Service Patrol Annual Report Fiscal Year 2012 2013 Tow Trucks to the Rescue What is the Freeway Service Patrol Program? The purpose of the Freeway Service Patrol is to provide for
ScoreCard Jun 2014 [May 14 Data] Ridership
![ScoreCard Jun 2014 [May 14 Data] Ridership](/thumbs/93/113666940.jpg "ScoreCard Jun 2014 [May 14 Data] Ridership") + ScoreCard Jun 214 [May 14 Data] Ridership Average Weekday Ridership May 14: 1.36M Up 2.% from May 213 Year-to-Year Change: May 13 to Present -.6% -1.% -2.3% -1.7%.4% 4.9% -.2% -.3% -3.8%.8%.7% 3.1% 2.%
+ ScoreCard Jun 214 [May 14 Data] Ridership Average Weekday Ridership May 14: 1.36M Up 2.% from May 213 Year-to-Year Change: May 13 to Present -.6% -1.% -2.3% -1.7%.4% 4.9% -.2% -.3% -3.8%.8%.7% 3.1% 2.%
ScoreCard February 2014 [Jan 14 Data] Ridership
![ScoreCard February 2014 [Jan 14 Data] Ridership](/thumbs/93/113666999.jpg "ScoreCard February 2014 [Jan 14 Data] Ridership") + ScoreCard February 214 [Jan 14 Data] Ridership Average Weekday Ridership Jan 214: 1.22M Down 3.8% from Jan 213 System Maintenance A key measure of system maintenance is the travel time impact of slowdowns
+ ScoreCard February 214 [Jan 14 Data] Ridership Average Weekday Ridership Jan 214: 1.22M Down 3.8% from Jan 213 System Maintenance A key measure of system maintenance is the travel time impact of slowdowns
Streetcar Update. Review of December 2018
 Streetcar Update Review of December 2018 Number of Incidents Safety Metrics: Near Miss Near Miss Incident Breakdown 19% decrease near-miss events year over year (2017 versus 2018) 66% decrease at 5 th
Performance Measures 4 th Quarter/Year End 2010
 Performance Measures 4 th Quarter/Year End 2010 Earn & Retain Community Trust 6 Performance Measures: Ridership Cost Effectiveness (Cost per Passenger) Cost Efficiency (Cost per Revenue Hour) Service Effectiveness
ROCHESTER, MINNESOTA
 ROCHESTER, MINNESOTA Rochester Public Works TRANSIT AND PARKING DIVISION Transit and Parking Manager Tony Knauer tknauer@rochestermn.gov SERVICE ATTITUDE CONSISTENCY - TEAMWORK ROCHESTER TRANSIT & PARKING
MONTHLY PERFORMANCE DASHBOARD
 AUSTIN ENERGY MONTHLY PERFORMANCE DASHBOARD A report highlighting key Austin Energy metrics for ember FY 219 FINANCIAL HEALTH Standard and Poor s Bond Rating Austin Energy Rating AA AA Budget Based Revenues
PROGRESS ON BUDGET THEMES AND PERFORMANCE METRICS RECEIVE AND FILE PROGRESS REPORT ON BUDGET THEMES AND PERFORMANCE METRICS
 20 One Gateway Plaza Los Angeles, CA 90012-2952 213-922.2000 Tel metro. net FINANCE, BUDGET AND AUDIT COMMITTEE MARCH 20,2013 SUBJECT: ACTION: PROGRESS ON BUDGET THEMES AND PERFORMANCE METRICS RECEIVE
Commuter Vanpool Program Scope of Work
 Commuter Vanpool Program Scope of Work Objective To secure a single vanpool Service Provider to operate and market a county wide commuter vanpool program known as Sun Rideshare Vanpool Program. The goal
Draft Results and Recommendations
 Waco Rapid Transit Corridor (RTC) Feasibility Study Draft Results and Recommendations Chris Evilia, Director of Waco Metropolitan Planning Organization Allen Hunter, General Manager Waco Transit System
BOARD OF COUNTY COMMISSIONERS AGENDA ITEM SUMMARY. Consent Workshop [ ]
![BOARD OF COUNTY COMMISSIONERS AGENDA ITEM SUMMARY. Consent Workshop [ ]](/thumbs/82/86800449.jpg "BOARD OF COUNTY COMMISSIONERS AGENDA ITEM SUMMARY. Consent Workshop [ ]") - _j POSTPONED FROM THE JANUARY 14 BCC MEETING Agenda Item #5,::.. I BOARD OF COUNTY COMMISSIONERS AGENDA ITEM SUMMARY Meeting Date: February 4, 2014 [ ] [ ] Department: Submitted By: Engineering & Public
- _j POSTPONED FROM THE JANUARY 14 BCC MEETING Agenda Item #5,::.. I BOARD OF COUNTY COMMISSIONERS AGENDA ITEM SUMMARY Meeting Date: February 4, 2014 [ ] [ ] Department: Submitted By: Engineering & Public
Washington Metropolitan Area Transit Authority Board Action/Information Summary
 Washington Metropolitan Area Transit Authority Board Action/Information Summary Action Information MEAD Number: Resolution: Yes No TITLE: Safety Report PURPOSE: To present to the Board of Directors a report
Mobility Management: Caltrain
 Mobility Management: Caltrain Community Relations Committee October 4, 2017 Agenda Item 7 Presentation Outline Operating Statistics Ridership On-time Performance Fleet Reliability Capital Program Review
APPROVE VANPOOL VEHICLE SUPPLIER BENCH CONTRACTS
 One Gateway Plaza Lo s Angeles, CA 90012-2952 2 13.9 2 2.200 0 Tel metro. net 55 REGULAR BOARD MEETING May 23,2013 SUBJECT: ACTION: METRO VANPOOL PROGRAM APPROVE VANPOOL VEHICLE SUPPLIER BENCH CONTRACTS
MEETING: DATE: TYPE OF ACTION: STAFF CONTACT: Recommend to Board. Final Action
 MOTION NO. M2018-160 Purchase of Thirteen 42-foot Double Deck Expansion Buses MEETING: DATE: TYPE OF ACTION: STAFF CONTACT: Operations Committee PROPOSED ACTION 12/06/2018 12/20/2018 Recommend to Final
VEHICLE PREVENTIVE MAINTENANCE PROGRAM PURPOSE AND COMPONENTS OF A VEHICLE MAINTENANCE PROGRAM
 VEHICLE PREVENTIVE MAINTENANCE PROGRAM Regardless of how your vehicle fleet is funded, it is important for all agencies providing public transportation to have a strong vehicle maintenance program since
MONTHLY PERFORMANCE DASHBOARD
 AUSTIN ENERGY MAY MONTHLY PERFORMANCE DASHBOARD A report highlighting key Austin Energy metrics for ch FY FINANCIAL HEALTH Standard and Poor s Bond Rating Current AA Target AA Budget Based Revenues and
Florida s Turnpike Enterprise. Incident Management Program for All Levels & Specialty Towing & Roadside Repair (STARR)
") Florida s Turnpike Enterprise Incident Management Program for All Levels & Specialty Towing & Roadside Repair (STARR) Florida s Turnpike System Largest Toll System in Florida 460 Centerline Miles 2 Million
Florida s Turnpike Enterprise Incident Management Program for All Levels & Specialty Towing & Roadside Repair (STARR) Florida s Turnpike System Largest Toll System in Florida 460 Centerline Miles 2 Million
STRATEGIC BUSINESS PLAN QUARTERLY KPI REPORT FOR: FISCAL YEAR 2015 THROUGH QUARTER 4 (JULY 2014 THROUGH JUNE 2015)
") STRATEGIC BUSINESS PLAN QUARTERLY KPI REPORT FOR: FISCAL YEAR THROUGH QUARTER 4 (JULY THROUGH JUNE ) CONTENTS BALANCED SCORECARD OF KEY PERFORMANCE INDICATORS SAFETY & SECURITY SLIDE VEHICLE, PASSENGER
STRATEGIC BUSINESS PLAN QUARTERLY KPI REPORT FOR: FISCAL YEAR THROUGH QUARTER 4 (JULY THROUGH JUNE ) CONTENTS BALANCED SCORECARD OF KEY PERFORMANCE INDICATORS SAFETY & SECURITY SLIDE VEHICLE, PASSENGER
MEETING DATE: October 9, 2015 ITEM 7. Authorize Expenditure of Funds and Contract Actions to Support Locomotive Lease from BNSF Railway Company
 SOUTHERN CALIFORNIA REGIONAL RAIL AUTHORITY TRANSMITTAL DATE: October 2, 2015 MEETING DATE: October 9, 2015 ITEM 7 TO: FROM: SUBJECT: Board of Directors Arthur T. Leahy Authorize Expenditure of Funds and
MONTHLY PERFORMANCE DASHBOARD
 AUSTIN ENERGY MONTHLY PERFORMANCE DASHBOARD A report highlighting key Austin Energy metrics FINANCIAL HEALTH Standard and Poor s Bond Rating Austin Energy Rating AA AA Budget Based Revenues and Expenses
BUSINESS POLICIES AND PROCEDURES MANUAL Revised 9-17 Accounts Payable https://www.gocomchek.com/
 BUSINESS POLICIES AND PROCEDURES MANUAL TRAVEL 95.37.1 OVERVIEW Washington State University has implemented a fuel card system provided by a contract with the Comdata Corporation. Authorized University
WIM #37 was operational for the entire month of September Volume was computed using all monthly data.
 SEPTEMBER 2016 WIM Site Location WIM #37 is located on I-94 near Otsego in Wright county. The WIM is located only on the westbound (WB) side of I-94, meaning that all data mentioned in this report pertains
BUSINESS POLICIES AND PROCEDURES MANUAL Revised 9-17 Accounts Payable
 BUSINESS POLICIES AND PROCEDURES MANUAL TRAVEL 95.37.1 OVERVIEW Washington State University has implemented a fuel card system provided by a contract with the Comdata Corporation. Authorized University
Draft Results and Open House
 Waco Rapid Transit Corridor (RTC) Feasibility Study Draft Results and Open House Chris Evilia, Director of Waco Metropolitan Planning Organization Allen Hunter, General Manager Waco Transit System Jimi
Utah Transit Authority Rideshare. CTAA Conference June 12, 2014
 Utah Transit Authority Rideshare CTAA Conference June 12, 2014 UTA Statistics and Info A Public Transit Agency Six counties, about 1600 square miles Within this area is 80% of the state s population, an
Economics of Integrating Renewables DAN HARMS MANAGER OF RATE, TECHNOLOGY & ENERGY POLICY SEPTEMBER 2017
 Economics of Integrating Renewables DAN HARMS MANAGER OF RATE, TECHNOLOGY & ENERGY POLICY SEPTEMBER 2017 Presentation Outline Understanding LPEA s expenses and what drives them Economics of net metering
April 2010 April 2010 Presented by Alan Eirls
 April 2010 April 2010 Presented by Alan Eirls A Partnership Between the Coeur d Alene Tribe, the State of Idaho, the KMPO, and Kootenai County. Current System The Citylink system began on the Coeur d Alene
REGULAR MEETING OF THE GOLDEN RAIN FOUNDATION MOBILITY AND VEHICLES COMMITTEE
 REGULAR MEETING OF THE GOLDEN RAIN FOUNDATION MOBILITY AND VEHICLES COMMITTEE Wednesday, October 3, 2018 1:30 p.m. Laguna Woods Village Community Center Board Room 24351 El Toro Road AGENDA 1. Call to
WIM #29 was operational for the entire month of October Volume was computed using all monthly data.
 OCTOBER 2015 WIM Site Location WIM #29 is located on US 53 near Cotton in St Louis county. System Operation WIM #29 was operational for the entire month of October 2015. Volume was computed using all monthly
Commuter Rail Update. October 25, 2018
 Commuter Rail Update October 25, 2018 2 page page 3 State of Commuter Rail Network, July 2014 The 2014 Commuter Rail network had multiple issues and a history of neglect & under-investment FIRST UP? UPGRADES
Proposed FY Capital Improvement Program (CIP) March 5, 2018 Capital Planning Committee 1
 March 5, 2018 Capital Planning Committee 1") Proposed FY 2019-2023 Capital Improvement Program (CIP) March 5, 2018 Capital Planning Committee 1 The Capital Improvement Program is: A fiscally constrained, 5-year program of capital projects An implementation
Proposed FY 2019-2023 Capital Improvement Program (CIP) March 5, 2018 Capital Planning Committee 1 The Capital Improvement Program is: A fiscally constrained, 5-year program of capital projects An implementation
TORONTO TRANSIT COMMISSION REPORT NO.
 Form Revised: February 2005 TORONTO TRANSIT COMMISSION REPORT NO. MEETING DATE: September 27, 2012 SUBJECT: NOTICE OF AWARD PROCUREMENT AUTHORIZATION - ARTICULATED BUSES INFORMATION ITEM RECOMMENDATION
First of four service increases delivered in April 2015
 CAC Update AGENDA» Recent service improvements» Upcoming service improvements» Transit and pedestrian safety corridor improvement projects slated for legislation» Outreach look ahead First of four service
Committee Report. Transportation Committee. Business Item No
 Committee Report Business Item No. 2015-280 Transportation Committee For the Metropolitan Council meeting of December 9, 2015 Subject: METRO Blue Line Extension (Bottineau Light Rail Transit) Revised Scope
MARKET RATES UPDATE Paula Gold-Williams Cory Kuchinsky
 MARKET RATES UPDATE I N T R O D U C T I O N BY: Paula Gold-Williams President & Chief Executive Officer (CEO) P R E S E N T E D BY: Cory Kuchinsky Interim Vice President, Financial Services September 24,
MOTION NO. M Purchase of Thirty-one Articulated Hybrid Diesel Expansion and Replacement Buses
 MOTION NO. M2018-161 Purchase of Thirty-one Articulated Hybrid Diesel Expansion and Replacement Buses MEETING: DATE: TYPE OF ACTION: STAFF CONTACT: Operations and Administration Committee PROPOSED ACTION
Greater Cleveland Regional Transit Authority. Joe Calabrese - General Manager
 Greater Cleveland Regional Transit Authority Joe Calabrese - General Manager RTA Ridership by Mode! 500 Buses - 75 %! 60 Heavy Rail Vehicles - 10%! 24 RTV s (BRT) - 8%! 48 Light Rail Vehicles - 6%! Paratransit
COMMUNITY REPORT FISCAL YEAR We are making progress, are you on board? GOLD COAST TRANSIT DISTRICT
 FISCAL YEAR 178 GOLD COAST TRANSIT DISTRICT COMMUNITY REPORT We are making progress, are you on board? OJAI OXNARD PORT HUENEME VENTURA COUNTY OF VENTURA GENERAL MANAGER S MESSAGE STEVEN P. BROWN DEAR
Policy Note. Vanpools in the Puget Sound Region The case for expanding vanpool programs to move the most people for the least cost.
 Policy Note Vanpools in the Puget Sound Region The case for expanding vanpool programs to move the most people for the least cost Recommendations 1. Saturate vanpool market before expanding other intercity
Dallas Vehicle Immobilization (Booting) Ordinance Chapter 48C of the Dallas City Code
 Ordinance Chapter 48C of the Dallas City Code") Dallas Vehicle Immobilization (Booting) Ordinance Chapter 48C of the Dallas City Code Briefing to the Transportation and Environment Committee Prepared by Transportation Regulation Program Public Works
Dallas Vehicle Immobilization (Booting) Ordinance Chapter 48C of the Dallas City Code Briefing to the Transportation and Environment Committee Prepared by Transportation Regulation Program Public Works
STRATEGIC BUSINESS PLAN QUARTERLY KPI REPORT FOR: FISCAL YEAR 2015, QUARTER 1 (JULY THROUGH SEPTEMBER 2014)
") STRATEGIC BUSINESS PLAN QUARTERLY KPI REPORT FOR: FISCAL YEAR 215, QUARTER 1 (JULY THROUGH SEPTEMBER ) CONTENTS BALANCED SCORECARD OF KEY PERFORMANCE INDICATORS SAFETY & SECURITY SLIDE VEHICLE, PASSENGER
STRATEGIC BUSINESS PLAN QUARTERLY KPI REPORT FOR: FISCAL YEAR 215, QUARTER 1 (JULY THROUGH SEPTEMBER ) CONTENTS BALANCED SCORECARD OF KEY PERFORMANCE INDICATORS SAFETY & SECURITY SLIDE VEHICLE, PASSENGER
RIDERSHIP TRENDS. July 2018
 RIDERSHIP TRENDS July Prepared by the Division of Strategic Capital Planning September Table of Contents Executive Summary...1 Ridership...3 Estimated Passenger Trips by Line...3 Estimated Passenger Trips
METRONext. Vision & Moving Forward Plans. Board Workshop. December 11, DRAFT For Preliminary Discussion Only
 METRONext Vision & Moving Forward Plans Board Workshop December 11, 2018 Disclaimer This presentation is being provided solely for discussion purposes by the Board of Directors of the Metropolitan Transit
PUBLIC TRANSPORTATION
 PUBLIC TRANSPORTATION PROJECT TITLE U-MED DISTRICT MULTI-MODAL IMPROVEMENTS- PHASE II Transit Vehicles and Upgrades MUNICIPALITY OF ANCHORAGE Capital Improvement Program PROJECT LIST BY DEPARTMENT Public
MOTION No. M Purchase of Five 40-foot Buses PROPOSED ACTION
 MOTION No. M2015-71 Purchase of Five 40-foot Buses MEETING: DATE: TYPE OF ACTION: STAFF CONTACT: Operations and Administration Committee 08/06/2015 Final Action Bonnie Todd, Executive Director of Operations
August ATR Monthly Report
 August ATR Monthly Report Minnesota Department of Transportation Office of Transportation Data and Analysis August 2011 Introduction The purpose of this report is to examine monthly traffic trends on
Safety Performance Indicators
 Customer Services, Operations, and Safety Committee Board Information Item V-B October 2, 28 Safety Performance Indicators Washington Metropolitan Area Transit Authority Board Action/Information Summary
SAN FRANCISCO MUNICIPAL TRANSPORTATION AGENCY
 THIS PRINT COVERS CALENDAR ITEM NO. : 10.5 DIVISION: Transit Services BRIEF DESCRIPTION: SAN FRANCISCO MUNICIPAL TRANSPORTATION AGENCY Requesting authorization for the SFMTA, through the Director of Transportation,
Technical Advisory Committee
 Technical Advisory Committee 1 Agenda Call to Order Pledge of Allegiance Confirmation of Quorum Agenda Review Tawny Olore, P.E. Agenda Review Adoption of meeting minutes Chairman s Report Phase 1 Project
SEPULVEDA PASS CORRIDOR
 SEPULVEDA PASS CORRIDOR PUBLIC PRIVATE PARTNERSHIP DELIVERY PRE-DEVELOPMENT AGREEMENT PDA Sepulveda Pass Mobility Issues Most congested highway segment in the U.S. 295,000 vehicles per day (2010) 430,000
IH 45 (GULF FWY) IH 10 (Katy Fwy) to IH 610 S (South Loop) 2010 Rank: Rank: 12
 IH 10 (Katy Fwy) to IH 610 S (South Loop) 2010 Rank: Rank: 12") Mobility Investment Priorities Project Houston IH 45 IH 45 (GULF FWY) IH 10 (Katy Fwy) to IH 610 S (South Loop) Current Conditions From IH 10 to IH 610 south, IH 45 is a 6- to 9-lane facility with three
Mobility Investment Priorities Project Houston IH 45 IH 45 (GULF FWY) IH 10 (Katy Fwy) to IH 610 S (South Loop) Current Conditions From IH 10 to IH 610 south, IH 45 is a 6- to 9-lane facility with three
Waco Rapid Transit Corridor (RTC) Feasibility Study
 Feasibility Study") Waco Rapid Transit Corridor (RTC) Feasibility Study Chris Evilia, Director of Waco Metropolitan Planning Organization Allen Hunter, General Manager Waco Transit System Jimi Mitchell, Project Manager AECOM
Waco Rapid Transit Corridor (RTC) Feasibility Study Chris Evilia, Director of Waco Metropolitan Planning Organization Allen Hunter, General Manager Waco Transit System Jimi Mitchell, Project Manager AECOM
Frequently Asked Questions Rideshare Program
 Frequently Asked Questions Rideshare Program Contents Vanpools General Questions Program Benefits Resources Vanpools 1. Q: Why vanpool instead of commuting in my own car? A: If you live more than 20 miles
The $600 Million Rebirth of San Diego Trolley
 The $600 Million Rebirth of San Diego Trolley E. Wayne Terry Chief Operating Officer MTS Rail APTA Rail Conference - 2010 1919 San Diego and Arizona Eastern Railroad The Bones of the Original South and
CITY OF MOSCOW VANPOOL - RIDER AGREEMENT
 CITY OF MOSCOW VANPOOL - RIDER AGREEMENT WELCOME The goal of the VanPool is to provide safe, comfortable and dependable transportation to the passengers. The success of the program is dependent upon the
Transportation Procedures
 The Department of Facilities Planning and Management, through Motor Pool: Maintains University-owned vehlc1es that are permanently assigned to departments, for daily use by employees for the business of
SERVICE STANDARDS REPORT Q2 FY08 (Oct-Dec 2007) March 18, 2008
 March 18, 2008") SERVICE STANDARDS REPORT Q2 FY08 (Oct-Dec 2007) March 18, 2008 A OPERATIONAL EFFICIENCY Q1 FY08 ACTUAL Q2 FY08 ACTUAL FY08 GOAL A1 pp. 10-14 A2 pp. 15-20 On-time performance 70.8% 69.2% > Scheduled headway
SERVICE STANDARDS REPORT Q2 FY08 (Oct-Dec 2007) March 18, 2008 A OPERATIONAL EFFICIENCY Q1 FY08 ACTUAL Q2 FY08 ACTUAL FY08 GOAL A1 pp. 10-14 A2 pp. 15-20 On-time performance 70.8% 69.2% > Scheduled headway
CITY OF LOS ANGELES INTER-DEPARTMENTAL MEMORANDUM
 CITY OF LOS ANGELES INTER-DEPARTMENTAL MEMORANDUM Date: April 11, 2018 To: The Honorable City Council c/o City Clerk, Room 395, City Hall Attention: Honorable Mike Bonin, Chair, Transportation Committee
Community Open Houses November 29 December 7, 2017
 Community Open Houses November 29 December 7, 2017 1 Community Open House Agenda 6:00 PM Open House 6:30-7:30 PM Presentation and Q&A 7:30-8:00 PM Open House Resumes after the presentation and Q&A Thank
December 2018 RenewableGenerations Monthly Report
 2018 RenewableGenerations Monthly Report Ecosystem of Clean Energy Programs Contractor Training Webinar Table of Contents Solar Electric... 3 Solar Thermal Heating (Northern Nevada Gas Customers)... 5
MOTION NO. M Light Rail Vehicle Oil-less Rotary Scroll Air Compressor Upgrade PROPOSED ACTION
 MOTION NO. M2017-152 Light Rail Vehicle Oil-less Rotary Scroll Air Compressor Upgrade MEETING: DATE: TYPE OF ACTION: STAFF CONTACT: Operations and Administration Committee PROPOSED ACTION 12/07/2017 Final
An Overview of Transportation Responsibility
 1 An Overview of Transportation Responsibility Fast Facts Our Business History of Budget Cuts (2007 2013) Benchmark Comparison Proposed Budget Cuts for FY14 Community Input Peer Comparison 2 Mission Statement:
SELF-STORAGE FOR SALE
 PURCHASE PRICE: $525,000 OCCUPANCY: 62.2% NOI: $50,600 LOT SIZE: 2.0 acres BLDG CLASS: C OVERVIEW 90 unit, multi-building storage facility in a stable region of North Central Texas. This well-maintained,
NOTICE OF REGULARLY SCHEDULED BOARD MEETINGS
 NOTICE OF REGULARLY SCHEDULED BOARD MEETINGS NEW JERSEY TRANSIT CORPORATION NJ TRANSIT RAIL OPERATIONS, INC. NJ TRANSIT BUS OPERATIONS, INC. NJ TRANSIT MERCER, INC. NJ TRANSIT MORRIS, INC. TO WHOM IT MAY
Energy Performance Information Request Timeline
 Energy Performance Information Request Timeline Project Title: UT Project # Project Manager: Submitted by: Day Submitted: The timeline below outlines a comprehensive list of required documents and when
FOR IMMEDIATE RELEASE
 Article No. 7845 Available on www.roymorgan.com Roy Morgan Unemployment Profile Friday, 18 January 2019 Unemployment in December is 9.7% and under-employment is 8.8% FOR IMMEDIATE RELEASE Australian unemployment
The Funding of Pupil Transportation In North Carolina March, 2001
 The Funding of Pupil Transportation In North Carolina March, 2001 North Carolina Department of Public Instruction Division of School Support, Transportation Services Three main components of pupil transportation
Vital Signs Report. A Scorecard of Metro s Key Performance Indicators (KPI) Chief Performance Officer
 Chief Performance Officer") Vital Signs Report A Scorecard of Metro s Key Performance Indicators (KPI) Chief Performance Officer Published: December 2010 Page Left Intentionally Blank December 2010 2 Table of Contents Executive Summary...
Vital Signs Report A Scorecard of Metro s Key Performance Indicators (KPI) Chief Performance Officer Published: December 2010 Page Left Intentionally Blank December 2010 2 Table of Contents Executive Summary...
The Peoples Gas Light and Coke Company
 History of Gas Charges Due to the Operation of Rider 2 (Cents per Therm) Factors for Transportation Customers (Riders FST, SST, P, CFY and AGG) Non- Total Standby Standby Aggregation Commodity Commodity
2016 Reporting Guide W Sharp Avenue, Spokane, WA POOL (7665)
") 2016 Reporting Guide 1212 W Sharp Avenue, Spokane, WA 99201 STAvanpool@spokanetransit.com 509-326-POOL (7665) May 2016 Table of Contents Thank You Bookkeepers... 2 On-line Reporting for mileage & Ridership...
2016 Reporting Guide 1212 W Sharp Avenue, Spokane, WA 99201 STAvanpool@spokanetransit.com 509-326-POOL (7665) May 2016 Table of Contents Thank You Bookkeepers... 2 On-line Reporting for mileage & Ridership...
ORANGE COUNTY TRANSPORTATION AUTHORITY. Agreement to Purchase Compressed Natural Gas Articulated Buses. Staff Report
 ORANGE COUNTY TRANSPORTATION AUTHORITY Agreement to Purchase Compressed Natural Gas Articulated Staff Report November 8, 2012 To: From: Subject: Transit Committee Will Kempton, Chief Executive Officer
TVA Distributor Retail Rates and Comprehensive Services Program Power Factor Case Studies. Gerald Johns, P.E. Power Utilization Engineer, TVA
 TVA Distributor Retail Rates and Comprehensive Services Program Power Factor Case Studies Gerald Johns, P.E. Power Utilization Engineer, TVA 1 TVA Comprehensive Services Power Factor Studies/Recommendations