Average monthly prices of virgin olive oil in the most representative EU markets. ITALY - BARI SPAIN - JAÉN GREECE - CHANIA Reference threshold
|
|
|
- Bridget Spencer
- 5 years ago
- Views:
Transcription
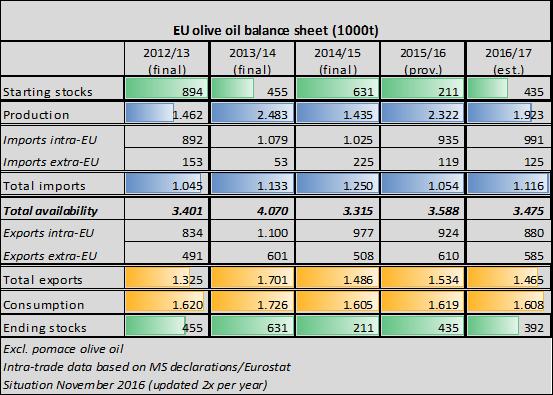
1 EU Prices Production EU Trade EU Stocks DG AGRI DASHBOARD: OLIVE OIL Last update: /1kg /1kg Consumption /1kg EU Balance Sheet Average monthly prices of virgin olive oil in the most representative EU markets Average monthly prices of extra virgin olive oil in the most representative EU markets ITALY - BARI GREECE - CHANIA SPAIN - JAÉN Reference threshold ITALY - BARI SPAIN - JAÉN GREECE - CHANIA Reference threshold Average monthly prices of lampante olive oil in the most representative EU markets SPAIN - JAÉN ITALY - LECCE GREECE - CHANIA Reference threshold - Spain Reference threshold - Italy Reference threshold - Greece excl. pomace oil WORLD EU OLIVE OIL PRODUCTION (1t) non-eu Average world 211/12-215/ /12 212/13 213/14 214/15(fin.) 215/16 (prov.) 216/17 (est.) Pomace oil (CN 151) "Olive oil" (CN 1599) Extra virgin+virgin (CN 15919) Lampante (CN 15911) Average last 3 campaigns Extra EU olive oil IMPORTS per CATEGORY (t) Spain (-6%) Italy (-49%) Greece (-31%) Portugal (-2%) Others EU (-18%) EU total (-19%) Average 211/12-215/16 EU OLIVE OIL PRODUCTION (1t) excl.pomace oil variation 216/17 vs 215/ Link: MS communications - monthly production (R826/28) /12 212/13 213/14 214/15(fin.) 215/16 (prov.) 216/17 (est.) Pomace oil (CN 151) "Olive oil" (CN 1599) Lampante (CN 15911) Extra virgin+virgin (CN 15919) Average last 3 campaigns Extra EU olive oil EXPORTS per CATEGORY (t) non-eu OLIVE OIL PRODUCTION (1t) variation 216/17 vs 215/16 Total non-eu (-3%) Tunisia (-29%) Turkey (+24%) Morocco (%) Syrian Arab Republic (%) Others non-eu (-5%) Average 211/12-215/ /12 212/13 213/14 214/15(fin.) 215/16 (prov.) 216/17 (est.) EU Structure of olive oil trade with EXTRA-EU28 (Mio Eur) periods October-September 82 Export virgin lampante Export pomace Export "olive oil" Export extra virgin+virgin Import virgin lampante Import "olive oil" Import extra virgin+virgin Import pomace TRADE BALANCE EU olive oil balance sheet (1t) 1 EU Olive oil ending stocks (1t) Olive oil consumption (1t) World EU 212/13 213/14 214/15 215/16 216/17 (final) (final) (final) (prov.) (est.) Starting stocks Production Imports intra-eu Imports extra-eu Total imports Total availabilities Exports intra-eu Exports extra-eu Total exports Consumption Ending stocks Ending stocks on 3.9. ; excl. olive pomace oil; incl.intra&extra trade IOC marketing years Oct-Sept; excl. pomace olive oil; Excl. pomace olive oil Intra-trade data based on MS declarations/eurostat

2

3
4
5 /1kg Average monthly prices of extra virgin olive oil in the most representative EU markets ITALY - BARI GREECE - CHANIA SPAIN - JAÉN Reference threshold
6 /1kg Average monthly prices of virgin olive oil in the most representative EU markets ITALY - BARI SPAIN - JAÉN GREECE - CHANIA Reference threshold
7 /1kg Average monthly prices of lampante olive oil in the most representative EU markets SPAIN - JAÉN ITALY - LECCE GREECE - CHANIA Reference threshold - Spain Reference threshold - Italy Reference threshold - Greece
8 WORLD EU OLIVE OIL PRODUCTION (1t) non-eu Average world 211/12-215/ excl. pomace oil 211/12 212/13 213/14 214/15(fin.) 215/16 (prov.) 216/17 (est.)
9 Spain (-6%) Italy (-49%) Greece (-31%) Portugal (-2%) Others EU (-18%) EU total (-19%) Av erage 211/12-215/16 EU OLIVE OIL PRODUCTION (1t) excl.pomace oil variation 216/17 vs 215/ Link: MS communications - monthly production (R826/28) 211/12 212/13 213/14 214/15(fin.) 215/16 (prov.) 216/17 (est.) 1.875
10 non-eu OLIVE OIL PRODUCTION (1t) variation 216/17 vs 215/16 Total non-eu (-3%) Tunisia (-29%) Turkey (+24%) Morocco (%) Syrian Arab Republic (%) Others non-eu (-5%) Average 211/12-215/ /12 212/13 213/14 214/15(fin.) 215/16 (prov.) 216/17 (est.)
11 Pomace oil (CN 151) "Olive oil" (CN 1599) Extra virgin+vi rgin (CN 15919) Lampante (CN 15911) Av erage last 3 campaigns Extra EU olive oil IMPORTS per CATEGORY (t)
12 Pomace oil (CN 151) "Olive oil" (CN 1599) Lampante (CN 15911) Extra virgin+vi rgin (CN 15919) Av erage last 3 campaigns Extra EU olive oil EXPORTS per CATEGORY (t)

13 EU Structure of olive oil trade with EXTRA-EU28 (Mio Eur) periods October-September Export virgin lampante Export pomace Export "olive oil" Export extra virgin+virgin Import virgin lampante Import "olive oil" Import extra virgin+virgin Import pomace TRADE BALANCE
14 1 EU Olive oil ending stocks (1t) Ending stocks on 3.9. ; excl. olive pomace oil; incl.intra&extra trade
15 Olive oil consumption (1t) World EU IOC marketing years Oct-Sept; excl. pomace olive oil;
16
Market situation in the Olive oil and Table olives sectors
 Market situation in the Olive oil and Table olives sectors Committee for the Common Organisation of the Agricultural Markets Arable crops and olive oil 26 January 2017 Lucie Zolichová, AGRI G.4 lucie.zolichova@ec.europa.eu
Market situation in the Olive oil and Table olives sectors
 Market situation in the Olive oil and Table olives sectors Committee for the Common Organisation of the Agricultural Markets Arable crops and olive oil 30 May 2017 Lucie Zolichová, AGRI G.4 lucie.zolichova@ec.europa.eu
CHANGES IN WORLD OLIVE CROP AREA (ha)
") Madrid, 12 June 2015 12.000 CHANGES IN WORLD OLIVE CROP AREA (ha) 11.500 11.000 Irrigated 2006 Dryfarmed Dryfarmed 20% 80% Irrigated 2014 22% 78% 10.756 10.664 11.112 11.009 11.205 11.382 10.500 10.000
Madrid, 12 June 2015 12.000 CHANGES IN WORLD OLIVE CROP AREA (ha) 11.500 11.000 Irrigated 2006 Dryfarmed Dryfarmed 20% 80% Irrigated 2014 22% 78% 10.756 10.664 11.112 11.009 11.205 11.382 10.500 10.000
International Olive Council. International Olive Council
 Advisory Committee on Olive Oil and Table Olives 29 June 29 1 115 CHANGES IN WORLD CROP AREA (thousand hectares) Bearing Non-bearing Irrigated Dry-farmed % change between years = 2% 11,52 9,137,867 1,21,39
Civil Dialogue Group on WINE Thursday April 19th, 2018
 COMMISSION EUROPÉENNE DIRECTION GÉNÉRALE DE L'AGRICULTURE ET DU DÉVELOPPEMENT RURAL Directorate G. Markets and Observatories G.2. Wine, spirits and horticultural products Bruxelles, le G.2/GD(2017) Civil
Rice market situation
 Rice market situation DG AGRI C.5 Management Committee for the Common Organisation of Agricultural Markets / Rice 24/10/2013 World market mio t 700 600 500 400 300 200 100 - World rice balance sheet Trade
D G A G R I D A S H B O A R D : T O M A T O E S Last update: EU AVG PRICES
 tonnes Weightedaverages by volume of production per MS Ongoing adjustments on weights by variety group 000 tonnes D G A G R I D A S H B O A R D : T O M A T O E S Last update: 20.04.2018 EU AVG PRICES MS
EU
 4.4.1.1 Area, yield and production of : rapeseed, sunflower seed and soya beans 23/11/2012 Area Yield Production 1 000 ha % TAV 100 kg/ha % TAV 1000 t % TAV 2008 2009 2010 2011 2011 2008 2009 2010 2011
XXII Jornadas del Arroz Zaragoza (Spain) 9 th March 2016 EU RICE MARKET. Damien PLAN European Commission DG AGRI
 9 th March 2016 EU RICE MARKET. Damien PLAN European Commission DG AGRI") XXII Jornadas del Arroz Zaragoza (Spain) 9 th March 2016 EU RICE MARKET Damien PLAN European Commission DG AGRI Contents 1. EU Rice - Overview 2. EU Rice Trade Imports/Exports 3. EU Rice Market 2015/16
XXII Jornadas del Arroz Zaragoza (Spain) 9 th March 2016 EU RICE MARKET Damien PLAN European Commission DG AGRI Contents 1. EU Rice - Overview 2. EU Rice Trade Imports/Exports 3. EU Rice Market 2015/16
Committee for the Common Organisation of the Agricultural Market Market Situation for Sheep & Goat Meats 22 March 2018
 Committee for the Common Organisation of the Agricultural Market Market Situation for Sheep & Goat Meats 22 March 218 Production In ' tonnes carcase weight P R O D U C T I O N 297.4 114.8 8.9 67.1 51.3
Committee for the Common Organisation of the Agricultural Market Market Situation for Sheep & Goat Meats 21 Septembre 2017
 Committee for the Common Organisation of the Agricultural Market Market Situation for Sheep & Goat Meats 21 Septembre 217 Production P R O D U C T I O N In ' tonnes carcase weight 14.1 58.4 43.8 3.6 29.2
D G A G R I D A S H B O A R D : A P P L E S
 75 79 60 56 49 74 65 59 54 42 76 63 58 53 78 55 42 43 79 44 81 63 47 83 64 59 53 48 Sources: Eurostat, MSs notifications, DG Agri, Comext, Comtrade, GTA, ITC, AMI, Expert groups, Freshfel, Wapa. 89 68
Spain s exports by oil product group and country of destination
 Corporación de Reservas Estratégicas de Productos Petrolíferos Castellana, 79 28046 Madrid T. +34 91 360 09 10 Updated F. +34 91 420 on39 45 www.cores.es February 13 th 2017 Spain s exports by oil product
Spain s exports by oil product group and country of destination. Year Corporación de Reservas Estratégicas de Productos Petrolíferos
 Corporación de Reservas Estratégicas de Productos Petrolíferos Castellana, 79 28046 Madrid T. +34 91 360 09 10 Updated F. +34 91 420 on39 45 www.cores.es July 13 th 2015 Spain s exports by oil product
MARKET NEWSLETTER No 58 February 2012
 THE WORLD MARKET IN OLIVE OIL AND OLIVE POMACE OIL U.S. IMPORT TRENDS Perfrmance in 2010/11 U.S. imprts f live il and live pmace il made a recrd figure f 292 048 t in the 2010/11 crp year (running frm
D G A G R I D A S H B O A R D : A P P L E S
 Sources: Eurostat, MSs notifications, DG Agri, Comext, Comtrade, GTA, ITC, AMI, Expert groups, Freshfel, Wapa. 000 tonnes 39 41 31 22 29 22 32 27 17 18 9 27 15 12 6 6 6 4 5 6 5 4 11 25 15 9 9 93 62 51
1. INTERNATIONAL OVERVIEW. 1.0 Area and population. population (1,000) area
 area") 1.0 Area and population area population (1,000) km 2 2000 2010 2018 1 inhabitants per km 2 Belgium 30,530 10,251 10,920 11,443 375 Germany 357,380 82,212 81,777 82,952 232 Estonia 45,230 1,397 1,331 1,315
1.0 Area and population area population (1,000) km 2 2000 2010 2018 1 inhabitants per km 2 Belgium 30,530 10,251 10,920 11,443 375 Germany 357,380 82,212 81,777 82,952 232 Estonia 45,230 1,397 1,331 1,315
I. World trade in Overview
 I. World trade in - Overview Table I.1 Growth in the volume of world merchandise exports and production, 2-5 (Annual percentage change) 2-5 23 24 World merchandise exports 4.5 5. 9.5 6. Agricultural products
Wheat Marketing Situation
 Wheat Marketing Situation Prepared by: Darrell L. Hanavan Executive Director Colorado Wheat Administrative Committee If you would like to receive an email when this report is updated, email gmostek@coloradowheat.org
Next Release: 14 November Next Release: 14 November July
 43282 Next Release: 14 November 2018 Next Release: 14 November 2018 July Date of publication: 12 October 2018 TABLE OF CONTENTS Charts 1 Gross consumption of natural gas by OECD region 3 2 Indigenous production
Global Threat Reduction Initiative Foreign Research Reactor Spent Nuclear Fuel Shipments
 FY1996 1. Sept. 22, 1996 280 assemblies in 8 casks to SRS [First East Coast Shipment] FY 1997 Sweden 64 Switzerland 42 Germany 125 Chile 28 Columbia 21 2. Dec. 15, 1996 41 spent fuel assemblies in one
Market situation Cereals Oilseeds Protein crops
 Market situation Cereals Oilseeds Protein crops DG AGRI C 4 Civil Dialogue Group on Animal Products Pig Meat 13 April 2016 Exchange rates & crude oil 2 Euro US Dollar exchange rate 1.40 1.15 From the last
Spain s imports by oil product group and country of origin
 Corporación de Reservas Estratégicas de Productos Petrolíferos Castellana, 79 28046 Madrid T. +34 91 360 09 10 Updated F. +34 91 420 on39 45 www.cores.es February 12 th 2018 Spain s imports by oil product
BUSINESS AND CONSUMER SURVEY RESULTS. September 2018: Economic Sentiment decreases in both the euro area and the EU
 September 2018 BUSINESS AND CONSUMER SURVEY RESULTS 120 Graph 1: Economic sentiment indicator (s.a.) 110 100 90 80 70 60 long-term av erage (1990-2017) = 100 1994 1996 1998 2000 2002 2004 2006 2008 2010
2016/17 Global Olive Oil Production Down But Prices Stabilize
 United States Department of Agriculture Foreign Agricultural Service November 2016 Global Olive Oil Down But Prices Stabilize Global Olive Oil and Stocks 4000 3500 5000 Extra Virgin Olive Oil Prices Stabilizing
SUGAR. EU-28 sugar beet area reached 1.5 million ha in 2013/2014, almost in line with the 2012/2013 marketing year [Table ].
![SUGAR. EU-28 sugar beet area reached 1.5 million ha in 2013/2014, almost in line with the 2012/2013 marketing year [Table ].](/thumbs/78/78391695.jpg "SUGAR. EU-28 sugar beet area reached 1.5 million ha in 2013/2014, almost in line with the 2012/2013 marketing year [Table ].") SUGAR EU-28 sugar beet area reached 1.5 million ha in 2013/2014, almost in line with the 2012/2013 marketing year [Table 4.3.1.1]. According to the International Sugar Organization (ISO), global sugar
SUGAR EU-28 sugar beet area reached 1.5 million ha in 2013/2014, almost in line with the 2012/2013 marketing year [Table 4.3.1.1]. According to the International Sugar Organization (ISO), global sugar
Next Release: 16 May Next Release: 16 May January
 43101 Next Release: 16 May 2018 Next Release: 16 May 2018 January Date of publication: 13 April 2018 TABLE OF CONTENTS Charts 1 Gross consumption of natural gas by OECD region 3 2 Indigenous production
Raw Tobacco Production statistics harvests
 EUROPEAN COMMISSION DIRECTORATE-GENERAL FOR AGRICULTURE AND RURAL DEVELOPMENT Directorate C. Single CMO, Economics and analysis of agricultural market C.2. Wine, spirits, horticultural products, specialised
Spain s imports by oil product group and country of origin
 Corporación de Reservas Estratégicas de Productos Petrolíferos Castellana, 79 28046 Madrid T. +34 91 360 09 10 Updated F. +34 91 420 on39 45 www.cores.es July 12 th 2018 Spain s imports by oil product
September 2003 Industrial producer prices stable in euro-zone and EU15
 STAT/03/123 31 October 2003 September 2003 Industrial producer prices stable in euro-zone and EU15 The euro-zone 1 industrial producer price index 2 remained unchanged in September 2003 compared with the
Publication of data ,
 Trade monitoring through customs surveillance data The TAXUD surveillance system ("customs surveillance") records and centralizes all EU trade data (import and exports) directly from the national customs
Spain s imports by oil product group and country of origin
 Corporación de Reservas Estratégicas de Productos Petrolíferos Castellana, 79 28046 Madrid T. +34 91 360 09 10 Updated F. +34 91 420 on39 45 www.cores.es September 12 th 2018 Spain s imports by oil product
2014/ /2015 Ghana / /2015 Syrian Arab Republic / /2015
 Exhibit C: international cotton trade data Source: International Cotton Advisory Committee, ICAC World Cotton Database, available at www.icac.org, last checked 1 April 2016. International Cotton Advisory
September 2011 compared with August 2011 Industrial producer prices up by 0.3% in euro area Up by 0.4% in EU27
 161/2011-4 November 2011 September 2011 compared with August 2011 Industrial producer prices up by 0.3% in euro area Up by 0.4% in EU27 In September 2011 compared with August 2011, the industrial producer
Outline. 1. Introduction to PV CYCLE. 2. Mission and Objectives. 3. PV CYCLE Members. 4. PV CYCLE Operational Scheme. 5.
 Outline 1. Introduction to PV CYCLE 2. Mission and Objectives 3. PV CYCLE Members 4. PV CYCLE Operational Scheme 5. Activities Report 6. Future actions 1. Introduction to PV CYCLE Who We Are: Founded in
BUSINESS AND CONSUMER SURVEY RESULTS. Euro Area (EA) June 2014: Economic Sentiment decreasing in the euro area, while stable in the EU
 June 2014: Economic Sentiment decreasing in the euro area, while stable in the EU") June 2014 BUSINESS AND CONSUMER SURVEY RESULTS 120 Graph 1: Economic sentiment indicator (s.a.) 110 100 90 80 Euro Area (EA) 70 60 long-term av erage (1990-2013) = 100 European Union (EU) 1990 1991 1992
June 2014 BUSINESS AND CONSUMER SURVEY RESULTS 120 Graph 1: Economic sentiment indicator (s.a.) 110 100 90 80 Euro Area (EA) 70 60 long-term av erage (1990-2013) = 100 European Union (EU) 1990 1991 1992
International Outlook for Beef & Lamb
 International Outlook for Beef & Lamb 29 th March 212 Rupert Claxton GMC : December 27 1 Overview Global Meat Global Beef European Beef Global Sheep European Lamb Conclusions for NI GMC : December 21 2
Global Monthly February 2018
 Global Monthly February 18 3 1-year Treasury yields 1-year breakeven inflation rate 1 1 15 16 17 18 February 18 5 3 Global GDP growth Composite PMI (RHS) Index 56 5 5 1 5 1 13 1 15 16 17 18 3..5. 1.5 1.
BUSINESS AND CONSUMER SURVEY RESULTS
 March 2018 BUSINESS AND CONSUMER SURVEY RESULTS 120 Graph 1: Economic sentiment indicator (s.a.) 110 100 90 80 70 long-term av erage (1990-2017) = 100 EA EU 60 1994 1996 1998 2000 2002 2004 2006 2008 2010
RSWGM meeting European Commission DG MOVE 3-4 April 2017
 Podgorica RSWGM meeting European Commission DG MOVE 3-4 April 2017 Mobility and Transport 1 WHITE PAPER 2011: Towards a zero-vision on road safety POLICY ORIENTATIONS ON ROAD SAFETY 2011-2020 The -50%
European Union, Trade in goods with Tunisia
 European Union, Trade in goods with Tunisia Table of Contents pg - Key Figures 2 - / 2017 2 - - AMA/NAMA product Groups 2 - - SITC product Groups 2 - - Top 5 - HS sections 2 - - Top 5 - SITC sections 2
BUSINESS AND CONSUMER SURVEY RESULTS
 February 2018 BUSINESS AND CONSUMER SURVEY RESULTS 120 Graph 1: Economic sentiment indicator (s.a.) 110 100 90 80 70 long-term av erage (1990-2017) = 100 EA EU 60 1994 1996 1998 2000 2002 2004 2006 2008
Market situation Sugar Market Observatory 12 April 2018
 Market situation Sugar Market Observatory 12 April 2018 Arable crops, Sugar team DG Agriculture and Rural Development European Commission Sugar Prices Sugar Market Observatory 12 April 2018 2007 2008 2009
Beef Markets Outlook. January Mark Zieg. Growing the success of Irish food & horticulture. Growing the success of Irish food & horticulture
 Beef Markets Outlook January 213 Mark Zieg AIDAN COTTER CHIEF EXECUTIVE BORD BIA 28 JANUARY 29 Irish Beef Markets Exports 444, Export Volumes by Destination (212) UK 231, Spain 11, France 46, Holland 36,
Euro area unemployment rate at 10.5%
 3/2016-7 January 2016 November 2015 Euro area unemployment rate at 10.5% EU28 at 9.1% The euro area (EA19) seasonally-adjusted unemployment rate was 10.5% in November 2015, down from 10.6% in October 2015,
Sectoral Profile - Services
 Sectoral Profile - Services Energy consumption Changes in energy consumption and value added in services Since 2008 strong contraction of total energy consumption (-0.3%/year) although electricity consumption
World real merchandise trade grows faster than output
 I. I. world trade developments 8 Merchandise trade and GDP World real merchandise trade grows faster than output In 2006, the volume of world merchandise trade grew by 8 per cent while world gross domestic
BUSINESS AND CONSUMER SURVEY RESULTS. August 2013: Economic Sentiment rises further in both the euro area and the EU
 August 2013 BUSINESS AND CONSUMER SURVEY RESULTS 120 Graph 1: Economic sentiment indicator (s.a.) 110 100 90 80 70 long-term av erage (1990-2012) = 100 Euro Area (EA) European Union (EU) 60 1990 1991 1992
Global Dialysis - Cost per Dialysis Session
 Cost per session for dialysis where a cost has been entered for a dialysis centre. All costs have been converted to US Dollars as at 19 May 2006. Note that the costs do not state what is covered by a dialysis
BUSINESS AND CONSUMER SURVEY RESULTS. Euro Area (EA) February 2014: Economic Sentiment broadly unchanged in the euro area and the EU
 February 2014: Economic Sentiment broadly unchanged in the euro area and the EU") February 2014 BUSINESS AND CONSUMER SURVEY RESULTS 120 Graph 1: Economic sentiment indicator (s.a.) 110 100 90 80 Euro Area (EA) 70 60 long-term av erage (1990-2013) = 100 European Union (EU) 1990 1991
February 2014 BUSINESS AND CONSUMER SURVEY RESULTS 120 Graph 1: Economic sentiment indicator (s.a.) 110 100 90 80 Euro Area (EA) 70 60 long-term av erage (1990-2013) = 100 European Union (EU) 1990 1991
Table 13 Production, trade and supply of conventional crude oil Thousand metric tons; kilograms per capita; reserves production ratio (R/P) in years
 in years") , trade and supply of conventional crude oil Thousand metric tons; kilograms per capita; reserves production ratio (R/P) in years Table Notes The Reserves / ratio refers to crude oil and natural gas liquids.
, trade and supply of conventional crude oil Thousand metric tons; kilograms per capita; reserves production ratio (R/P) in years Table Notes The Reserves / ratio refers to crude oil and natural gas liquids.
35,000 52,000 87,000 1,600 8, ,400 76,600. Mean Crop. Monthly YTD Min ,671 8,211 Max. 2017
 YTD Inventory / Shipment Report In Shell Basis Crop: 2018 Monthly Market Prices FCA Hamburg Iranian Dried In Shell 28/30 Fandoghi Pistachios Total Consumption Ending Inventory 2nd Marketing Month YTD Carry
BUSINESS AND CONSUMER SURVEY RESULTS
 May 2018 BUSINESS AND CONSUMER SURVEY RESULTS 120 Graph 1: Economic sentiment indicator (s.a.) 110 100 90 80 70 60 long-term av erage (1990-2017) = 100 1994 1996 1998 2000 2002 2004 2006 2008 2010 2012
BUSINESS AND CONSUMER SURVEY RESULTS
 December 2018 BUSINESS AND CONSUMER SURVEY RESULTS **** Important notice: Starting with the next flash publication on 23 January 2019, the composition of the consumer confidence indicator will be revised.
EU Market Situation for Poultry. Civil Dialogue Group. 25 October 2016
 EU Market Situation for Poultry Civil Dialogue Group 25 October 216 Thousand Tons F O R E C A S T 16 14 Experts EU production forecast on Poultry and Rabbit (Missing data (BE-EL-AT-RO-LT-SE) - No expert
Euracoal Market Report 3/2006
 Euracoal Market Report 3/2006 November 2006 WORLD MARKET The following comments and figures only apply to the seaborne World Coal Market. They are preliminary. World Market Coal Mio t 1-6 2006 1-6 2005
ACEA Report. Vehicles in use Europe 2017
 ACEA Report Vehicles in use Europe 2017 TABLE OF CONTENTS Summary... 2 Vehicles in use in Europe... 3 Passenger cars... 3 Light commercial vehicles... 4 Medium and heavy commercial vehicles... 5 Buses...
New Passenger Car Registrations European Union
 PRESS EMBARGO : 8.00am (6.00am GMT), July 15, 2010 New Passenger Car Registrations European Union July 15, 2010 1,700,000 Units New Passenger Car Registrations in the EU Last 12 months Percentage +30.0
COMMUNICATION FROM THE COMMISSION TO THE COUNCIL
 EUROPEAN COMMISSION Brussels, 25.10.2017 COM(2017) 622 final COMMUNICATION FROM THE COMMISSION TO THE COUNCIL European Development Fund (EDF): forecasts of commitments, payments and contributions from
New Passenger Car Registrations European Union
 PRESS EMBARGO : 8.00am (6.00am GMT), September 18, 2012 New Passenger Car Registrations European Union September 18, 2012 Units 1,700,000 New Passenger Car Registrations in the EU Last 12 months 7.0% 1,500,000
Production (bbl/day)
") 1 of 5 14/09/2011 22:15 From Wikipedia, the free encyclopedia This is a list of countries by oil production mostly based on CIA World Factbook data. [1] Note that oil production refers to the sum of barrels
1 of 5 14/09/2011 22:15 From Wikipedia, the free encyclopedia This is a list of countries by oil production mostly based on CIA World Factbook data. [1] Note that oil production refers to the sum of barrels
CROP PLUS CARRY FORWARD STOCKS (SULTANA & THOMPSONS) GOLDEN SEEDLESS
 GOLDEN SEEDLESS") WORLD DRIED GRAPE PRODUCTION AND AVAILABILITY, 2017 (TONS) SULTANA & THOMPSONS CROP PLUS CARRY FORWARD STOCKS (SULTANA & THOMPSONS) GOLDEN SEEDLESS CROP PLUS CARRY FORWARD STOCKS (GOLDEN SEEDLESS) CURRANTS
WORLD DRIED GRAPE PRODUCTION AND AVAILABILITY, 2017 (TONS) SULTANA & THOMPSONS CROP PLUS CARRY FORWARD STOCKS (SULTANA & THOMPSONS) GOLDEN SEEDLESS CROP PLUS CARRY FORWARD STOCKS (GOLDEN SEEDLESS) CURRANTS
BREXIT AND THE AUTO INDUSTRY: FACTS AND FIGURES
 BREXIT AND THE AUTO INDUSTRY: FACTS AND FIGURES GLOBAL TRADE European Union EU vehicle imports: Total value: 45,693 million Quantity: 3,395,419 units EU vehicle exports: Total value: 135,398 million Quantity:
BUSINESS AND CONSUMER SURVEY RESULTS. February 2019: Economic Sentiment broadly stable in the euro area, down in the EU
 February 2019 BUSINESS AND CONSUMER SURVEY RESULTS 120 Graph 1: Economic sentiment indicator (s.a.) 110 100 90 80 EA EU 70 long-term av erage (1990-2018) = 100 60 1995 1997 1999 2001 2003 2005 2007 2009
BREXIT AND THE AUTO INDUSTRY: FACTS AND FIGURES
 BREXIT AND THE AUTO INDUSTRY: FACTS AND FIGURES GLOBAL TRADE European Union EU vehicle imports: Total value: 48,019 million Quantity: 3,640,975 units EU vehicle exports: Total value: 138,536 million Quantity:
Labour Market Latest Trends- 1st quarter 2008 data 1
 Population and social conditions Author: Fabrice ROMANS Data in focus 34/2008 Labour Market Latest Trends- 1st quarter 2008 data 1 Chart 1: Employment rate 2 (15-64 years) for from 2000Q1 to 2008Q1 % 66.5
 Urchin 7 cflag.ifas.ufl.edu Page 1 of 2 Standard View Export All Visits Permalink Geo Location Jul 1, 2015 - Jul 31, 2015 First Date 2015 Compare to Past Jan Feb Mar Apr May Jun Jul Aug Sep Oct Nov Dec
NEW PASSENGER CAR REGISTRATIONS EUROPEAN UNION 1
 PRESS EMBARGO: 8.00 AM (6.00 AM GMT), 19 September 2018 NEW PASSENGER CAR REGISTRATIONS EUROPEAN UNION 1 Passenger car registrations: +6.1% eight months into 2018; +10.5% in July and +31.2% in August In
Citrus: World Markets and Trade
 United States Department of Agriculture Foreign Agricultural Service January 2017 Citrus: World Markets and Trade Oranges Global orange production for 2016/17 is forecast up 2.4 million metric tons from
exports of goods annual change (%)
") 12.0 Austria s foreign trade 2015 by world region imports of goods 2015 exports of goods 2015 region 1 1 share (%) share (%) Europe 106,984 80.4 104,032 79.1 EU 93,686 70.4 90,841 69.1 EFTA 8,020 6.0 8,098
12.0 Austria s foreign trade 2015 by world region imports of goods 2015 exports of goods 2015 region 1 1 share (%) share (%) Europe 106,984 80.4 104,032 79.1 EU 93,686 70.4 90,841 69.1 EFTA 8,020 6.0 8,098
exports of goods annual change (%)
") 12.0 Austria s foreign trade 2016 by world region imports of goods 2016 exports of goods 2016 region 1 1 share (%) share (%) Europe 110,067 81.2 104,271 79.5 EU 96,801 71.4 91,112 69.4 EFTA 7,718 5.7 8,132
12.0 Austria s foreign trade 2016 by world region imports of goods 2016 exports of goods 2016 region 1 1 share (%) share (%) Europe 110,067 81.2 104,271 79.5 EU 96,801 71.4 91,112 69.4 EFTA 7,718 5.7 8,132
Teaching English to Foreigners: 2008
 15 June 2009 1100 hrs 106/2009 In 2008, 83,288 foreign students followed courses at local English-language specialised schools. This shows a decrease of 0.8 per cent over 2007. Teaching English to Foreigners:
External Trade of Georgia in January-September (Preliminary)
") NATIONAL STATISTICS OFFICE OF GEORGIA (GEOSTAT) 21.10.2015 External Trade of Georgia in January-September 2015 (Preliminary) In January-September of 2015 external merchandise trade (excluding non-organized
NATIONAL STATISTICS OFFICE OF GEORGIA (GEOSTAT) 21.10.2015 External Trade of Georgia in January-September 2015 (Preliminary) In January-September of 2015 external merchandise trade (excluding non-organized
NEW PASSENGER CAR REGISTRATIONS BY ALTERNATIVE FUEL TYPE IN THE EUROPEAN UNION 1 Quarter
 PRESS EMBARGO: NEW PASSENGER CAR REGISTRATIONS BY ALTERNATIVE FUEL TYPE IN THE EUROPEAN UNION 1 Quarter 2 2016 Alternative fuel vehicle registrations: +0.6% in second quarter of 2016 In the second quarter
Production of minor oil products from refineries - by type Thousand metric tons
 Production of minor oil from refineries - by type Table 23 Table Notes Data refer to production from refineries of refinery, ethane, naphtha, lubricants, bitumen, paraffin, petroleum, white spirit, and
Cotton This Month. Major Changes in Supply and Demand Estimates and Projections
 1629 K Street NW, Suite 702 Washington, DC 20006, USA Cotton This Month February 1, 2018 Major Changes in Supply and Demand Estimates and Projections India Mexico Pakistan United States 2017/18 production
IMPORT/EXPORT MILITARY WEAPONS AND EQUIPMENT IN YEAR 2010 FOR PUBLIC
 IMPORT/EXPORT MILITARY WEAPONS AND EQUIPMENT IN YEAR 2010 FOR PUBLIC Slovenian import of military weapons and equipment in year 2010 Military list ML1 Smooth-bore weapons with a calibre of less than 20
Forecast Million Lbs. % Change 1. Carryin August 1, ,012, ,677, %
 Almond Industry Position Report SEPTEMBER 2018 2018-2019 Crop Year Salable Forecast Million Lbs. 2018-2019 08/01-09/30 Kernel Wt. 2017-2018 08/01-09/30 Kernel Wt. % Change 1. Carryin August 1, 2018 359.0
German Steel Federation
 Fig. 1 The steel economy in Germany: out of recession again 8 Orders received, rolled steel, total (change in % c.f. previous year s quarter) 55 Crude steel production (m. tonnes, sliding 3 MD, annualised)
Steam Coal vs. Pet Coke Updates and Usage Comparison
 Updates and Usage Comparison Phil Fisher Pet Coke Consulting Argus Petroleum Coke Summit September 16-17, 2010 Houston, TX Updates and Usage Comparison Updates: 2009 steam coal production, consumption
AUSTRIA. Table 1. FDI flows in the host economy, by geographical origin. (Millions of US dollars)
") Table 1. FDI flows in the host economy, by geographical origin World 5 690 138 6 195 3 184 10 784 7 933 31 154 6 858 9 303 840 10 618 5 760 Developed economies 5 740 13 5 341 2 689 10 137 6 291 29 721
Table 1. FDI flows in the host economy, by geographical origin World 5 690 138 6 195 3 184 10 784 7 933 31 154 6 858 9 303 840 10 618 5 760 Developed economies 5 740 13 5 341 2 689 10 137 6 291 29 721
265,796, ,447,255 1,021,243, ,522, ,349, ,871, Crop Year
 Almond Industry Position Report 2011-2012 Crop Year Salable Forecast Million Lbs. 2011-2012 8/1-01/31 Kernel Wt. 2010-2011 8/1-01/31 Kernel Wt. JANUARY 2012 % Change 1. Carryin August 1, 2011 2. Crop Receipts
Table 13 Production, trade and supply of conventional crude oil Thousand metric tons; kilograms per capita; reserves production ratio (R/P) in years
 in years") Table 13, trade and supply of conventional crude oil Thousand metric tons; kilograms per capita; reserves production ratio (R/P) in years Table Notes The Reserves / ratio refers to crude oil and natural
Table 13, trade and supply of conventional crude oil Thousand metric tons; kilograms per capita; reserves production ratio (R/P) in years Table Notes The Reserves / ratio refers to crude oil and natural
Appendix E. Average Percent Correct in the Mathematics Content and Cognitive Domains TIMSS 2011 INTERNATIONAL RESULTS IN MATHEMATICS APPENDIX E 459
 Appendix E Average Percent Correct in the Content and Cognitive Domains TIMSS 2011 INTERNATIONAL RESULTS IN MATHEMATICS APPENDIX E 459 Appendix Appendix E.1: Average E.1: Average Percent Percent Correct
TOFAŞ RESULTS WEBCAST PRESENTATION
 TOFAŞ 31.12.2016 RESULTS WEBCAST PRESENTATION 02.02.2017 1 WEBCAST AGENDA Highlights Turkish Automotive Industry Production Domestic Market Developments Tofaş Domestic Market Performance Export Markets
Goods Exports and Imports
 An Phríomh-Oifig Staidrimh Central Statistics Office 14 June and Seasonally adjusted billion 9 Goods and il 2006 2007 2008 2009 2010 2011 Published by the Central Statistics Office, Ireland. Ardee Road
Kernel Wt. 649,153, ,948, ,710, ,452, ,163, Crop Year 8/1-2/29 342,795,454 -2, ,935
 Almond Industry Position Report 2015-2016 Crop Year Salable Forecast Million Lbs. 2015-2016 8/1-2/29 Kernel Wt. FEBRUARY 2016 2014-2015 8/1-2/28 Kernel Wt. % Change 1. Carryin August 1, 2015 2. Crop Receipts
Goods Exports and Imports
 An Phríomh-Oifig Staidrimh Central Statistics Office 12 July and Seasonally adjusted billion 9 Goods and 8 7 6 5 4 3 2 ember January February March April million Surplus 6,734 3,774 2,959 6,849 3,982 2,867
Table 23 Production of minor oil products from refineries - by type Thousand metric tons
 Table 23 Production of minor oil from refineries - by type Table Notes Data refer to production from refineries of refinery, ethane, naphtha, lubricants, bitumen, paraffin, petroleum, white spirit, and
Table 13 Production, trade and supply of conventional crude oil Thousand metric tons; kilograms per capita; reserves production ratio (R/P) in years
 in years") Million metric tons Million metric tons Table 13, trade and supply of conventional crude oil Thousand metric tons; kilograms per capita; reserves production ratio (R/P) in years Table Notes The Reserves
Million metric tons Million metric tons Table 13, trade and supply of conventional crude oil Thousand metric tons; kilograms per capita; reserves production ratio (R/P) in years Table Notes The Reserves
Goods Exports and Imports
 An Phríomh-Oifig Staidrimh Central Statistics Office 16 January 2014 and Seasonally adjusted billion 9 8 Goods and ember 2006 2007 2008 2009 2010 2011 Published by the Central Statistics Office, Ireland.
EUROPEAN COMMISSION DIRECTORATE-GENERAL FOR ECONOMIC AND FINANCIAL AFFAIRS BUSINESS AND CONSUMER SURVEY RESULTS. April 2011
 EUROPEAN COMMISSION DIRECTORATE-GENERAL FOR ECONOMIC AND FINANCIAL AFFAIRS BUSINESS AND CONSUMER SURVEY RESULTS April 2011 From February 2011 onwards, business surveys are presented exclusively in accordance
Growing Soybean Oil Price Raises Oil s Contribution to Total Soybean Value
 United States Department of Agriculture Foreign Agricultural Service Circular Series FOP 10-07 October 2007 Growing Soybean Oil Price Raises Oil s Contribution to Total Soybean Value Relative Share Value:
New Passenger Car Registrations European Union
 PRESS EMBARGO : 8.00am (6.00am GMT), September 17, 2013 New Passenger Car Registrations European Union September 17, 2013 Units 1,700,000 1,500,000 New Passenger Car Registrations in the EU Last 12 months
Kernel Wt. 218,700, ,434, ,134, ,161, ,785, ,947, Crop Year
 Almond Industry Position Report 2010-2011 Crop Year Salable Forecast Million Lbs. 2010-2011 8/1-12/31 Kernel Wt. 2009-2010 8/1-12/31 Kernel Wt. December 2010 % Change 1. Carryin August 1, 2010 2. Crop
Goods Exports and Imports
 An Phríomh-Oifig Staidrimh Central Statistics Office 13 February 2013 and 2007 2008 2009 2010 Published by the Central Statistics Office, Ireland. Ardee Road Dublin 6 Ireland Skehard Road Cork Ireland
Soybean Oil Prices Diverge on Different Supply Situations
 United States Department of Agriculture Foreign Agricultural Service Circular Series FOP 10-09 October 2009 Soybean Oil Prices Diverge on Different Supply Situations Soybean Oil Price ($/ton) $900 $850
External and intra-eu trade - statistical yearbook
 Statistical books External and intra-eu trade - statistical yearbook Data 1958-2009 2010 edition Statistical books External and intra-eu trade - statistical yearbook Data 1958-2009 2010 edition Europe
Product Overview INCH
 INCH Product Overview CERTIFIED Technology Made in Italy Since 1955 the Varvel Group has been making gearboxes and variators for light industry applications. Reliable partner in power transmission equipment
Installation instructions
 www.somfy.com Sonesse 0 DCT Installation instructions Ref :505080A Please read installation instructions and programming instructions completely prior to proceeding with installation and programming. Failure