Sectoral Profile - Services
|
|
|
- Corey Bell
- 6 years ago
- Views:
Transcription
 although electricity consumption continues growing (+0.")

1 Sectoral Profile - Services Energy consumption Changes in energy consumption and value added in services Since 2008 strong contraction of total energy consumption (-0.3%/year) although electricity consumption continues growing (+0.4%/year), despite a very limited growth of value added Before 2008 strong progression of the energy consumption (of which electricity) at the same rate as value added. Energy consumption and VA growth (EU) Note: Energy consumption at normal climate (e.g. climate corrected) Fuel mix (EU) Increase penetration of electricity: 48% in 2015; Saturation of gas market share at around 30%; Gas and electricity 80% of energy consumption of service sector Energy consumption by fuel in the service sector (EU)

.")

2 Share of electricity in total consumption Increase penetration of electricity in most countries. Malta and Cyprus have the highest share of electricity (around 85% of the energy consumption of the services sector). Highest progression in Slovenia, Slovakia, Portugal and Estonia. Share of electricity in total energy consumption Energy consumption by branch Offices and wholesale and trade sector consume around 2/3 of electricity in the service sector at EU level. Electricity consumption by sub-sector (2015)

.")
3 Energy consumption by sub-sector (2015) Electricity consumption per employee Energy and electricity consumption per employee Decreasing trends in final energy consumption per employee by 0.8%/year since 2006 (+1.3%/year from 2000 to 2006) Increase in electricity consumption per employee by 1.5%/year until 2010 and decreasing trends afterwards (- 1%/year). Energy and electricity consumption per employee Energy consumption at normal climate.


4 Electricity consumption per employee in EU countries Increasing electricity consumption per employee in most countries except in 10 countries of which Germany, UK, Austria, Ireland, Slovakia, Denmark, Luxembourg, Sweden and Norway. Large discrepancies among countries: lowest level for Romania and UK. Electricity consumption per employee Electricity consumption by branch Electricity consumption in education Electricity consumption per employee is increasing in almost all the countries, except for Spain, Denmark and Sweden. Per m², the electricity consumption tends to decrease in the sample of countries except in France. Electricity consumption per employee in education


5 Electricity consumption per m2 in education Electricity consumption in the health sector The energy consumption per employee in the health sector is increasing in most of selected countries below, except in Germany, Denmark and Sweden. Electricity consumption per employee in health


6 Electricity consumption per m2 in health Electricity consumption in offices Decreasing energy consumption per employee in offices over years except in France, Italy and The Netherlands. Electricity consumption in offices Energy consumption per m2 in offices

7 Electricity consumption in hotels and restaurants Decreasing trends in electricity consumption per employee in hotels and restaurants in most of the countries in the sample except Spain, Denmark and France. Electricity consumption in hotels and restaurants Electricity consumption in wholesale and trade Decreasing trends in electricity consumption per employee in wholesale and trade in around half of the countries except Portugal, Cyprus, Italy, UK, France and Spain. Electricity consumption in trade

8 Energy intensity trends Energy intensity of service sector in EU Decreasing energy intensity in almost ¾ of countries; limited growth in the other countries except in Greece, Italy and Spain. Energy intensity Energy consumption at normal climate. Electricity intensity trends in EU countries Decreasing electricity intensity values in 14 EU countries after 2008, with a reverse trend for 6 of them compared to On the opposite, increasing trends for 12 countries since 2008, with a highest progression in Czech Republic, Latvia and Slovenia. Electricity intensity
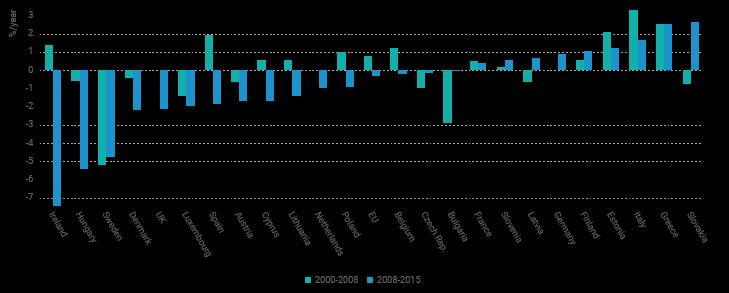

9 Electricity intensity trends
ACEA Report. Vehicles in use Europe 2017
 ACEA Report Vehicles in use Europe 2017 TABLE OF CONTENTS Summary... 2 Vehicles in use in Europe... 3 Passenger cars... 3 Light commercial vehicles... 4 Medium and heavy commercial vehicles... 5 Buses...
NEW PASSENGER CAR REGISTRATIONS BY ALTERNATIVE FUEL TYPE IN THE EUROPEAN UNION 1 Quarter
 PRESS EMBARGO: NEW PASSENGER CAR REGISTRATIONS BY ALTERNATIVE FUEL TYPE IN THE EUROPEAN UNION 1 Quarter 3 2017 Alternative fuel vehicle registrations: +51.4% in third quarter of 2017 In the third quarter
NEW PASSENGER CAR REGISTRATIONS BY FUEL TYPE IN THE EUROPEAN UNION 1
 PRESS EMBARGO: NEW PASSENGER CAR REGISTRATIONS BY FUEL TYPE IN THE EUROPEAN UNION 1 Quarter 3 2018 Fuel types of new cars: diesel 18.2%, petrol +15.2%, electric +30.0% in third quarter of 2018 In the third
NEW ALTERNATIVE FUEL VEHICLE REGISTRATIONS IN THE EUROPEAN UNION 1 Q1 2015
 NEW ALTERNATIVE FUEL VEHICLE REGISTRATIONS IN THE Q1 2015 ALTERNATIVE FUEL VEHICLE registrations: +28.8% in in first quarter In the first quarter of 2015, total alternative fuel vehicle (AFV) registrations
NEW ALTERNATIVE FUEL VEHICLE REGISTRATIONS IN THE EUROPEAN UNION 1 Q2 2015
 NEW ALTERNATIVE FUEL VEHICLE REGISTRATIONS IN THE Q2 2015 New alternative fuel vehicle (AFV) registrations in the EU by engine type Q2 2014 Q2 2015 Thousand units 70 60 50 40 30 20 10 0 EVs HEVs AFVs other
NEW COMMERCIAL VEHICLE REGISTRATIONS EUROPEAN UNION 1. November 2018
 PRESS EMBARGO: NEW COMMERCIAL VEHICLE REGISTRATIONS EUROPEAN UNION 1 November 2018 Commercial vehicle registrations: +3.8% 11 months into 2018; +2.7% in November Total new commercial vehicles In November
NEW COMMERCIAL VEHICLE REGISTRATIONS EUROPEAN UNION 1. December 2018
 PRESS EMBARGO: NEW COMMERCIAL VEHICLE REGISTRATIONS EUROPEAN UNION 1 December 2018 Commercial vehicle registrations: +3.2% in 2018; 4.0% in December Total new commercial vehicles In December 2018, commercial
NEW COMMERCIAL VEHICLE REGISTRATIONS EUROPEAN UNION 1 February 2018
 PRESS EMBARGO: NEW COMMERCIAL VEHICLE REGISTRATIONS EUROPEAN UNION 1 February 2018 Next press release: Tuesday 24 April 2018 1 Malta not available Page 1 of 7 Commercial vehicle registrations: +6.5% first
NEW PASSENGER CAR REGISTRATIONS BY ALTERNATIVE FUEL TYPE IN THE EUROPEAN UNION 1 Quarter
 PRESS EMBARGO: NEW PASSENGER CAR REGISTRATIONS BY ALTERNATIVE FUEL TYPE IN THE EUROPEAN UNION 1 Quarter 2 2016 Alternative fuel vehicle registrations: +0.6% in second quarter of 2016 In the second quarter
BREXIT AND THE AUTO INDUSTRY: FACTS AND FIGURES
 BREXIT AND THE AUTO INDUSTRY: FACTS AND FIGURES GLOBAL TRADE European Union EU vehicle imports: Total value: 48,019 million Quantity: 3,640,975 units EU vehicle exports: Total value: 138,536 million Quantity:
NEW PASSENGER CARS BY FUEL TYPE IN THE EUROPEAN UNION 1 Quarter
 PRESS EMBARGO: NEW PASSENGER CARS BY FUEL TYPE IN THE EUROPEAN UNION 1 Quarter 1 2018 Next press release: Thursday 6 September 2018 1 Data for Croatia, Cyprus, Luxembourg and Malta is not available Page
NEW PASSENGER CARS BY FUEL TYPE IN THE EUROPEAN UNION 1 Quarter
 PRESS EMBARGO: NEW PASSENGER CARS BY FUEL TYPE IN THE EUROPEAN UNION 1 Quarter 1 2018 Next press release: Thursday 6 September 2018 1 Data for Croatia, Cyprus, Luxembourg and Malta is not available Page
ACEA Report. Vehicles in use Europe 2018
 ACEA Report Vehicles in use Europe 2018 TABLE OF CONTENTS Summary... 2 Vehicles in use in Europe... 3 Passenger cars... 3 Light commercial vehicles... 4 Medium and heavy commercial vehicles... 5 Buses...
BREXIT AND THE AUTO INDUSTRY: FACTS AND FIGURES
 BREXIT AND THE AUTO INDUSTRY: FACTS AND FIGURES GLOBAL TRADE European Union EU vehicle imports: Total value: 45,693 million Quantity: 3,395,419 units EU vehicle exports: Total value: 135,398 million Quantity:
September 2011 compared with August 2011 Industrial producer prices up by 0.3% in euro area Up by 0.4% in EU27
 161/2011-4 November 2011 September 2011 compared with August 2011 Industrial producer prices up by 0.3% in euro area Up by 0.4% in EU27 In September 2011 compared with August 2011, the industrial producer
NEW PASSENGER CAR REGISTRATIONS BY ALTERNATIVE FUEL TYPE IN THE EUROPEAN UNION 1 Quarter
 PRESS EMBARGO: NEW PASSENGER CAR REGISTRATIONS BY ALTERNATIVE FUEL TYPE IN THE EUROPEAN UNION 1 Quarter 2 2017 Alternative fuel vehicle registrations: +38.0% in second quarter of 2017 In the second quarter
NEW COMMERCIAL VEHICLE REGISTRATIONS EUROPEAN UNION 1. October 2016
 PRESS EMBARGO: NEW COMMERCIAL VEHICLE REGISTRATIONS EUROPEAN UNION 1 October 2016 Next press release: Thursday 22 December 2016 1 Data for Malta unavailable Page 1 of 7 Commercial vehicle registrations:
1. INTERNATIONAL OVERVIEW. 1.0 Area and population. population (1,000) area
 area") 1.0 Area and population area population (1,000) km 2 2000 2010 2018 1 inhabitants per km 2 Belgium 30,530 10,251 10,920 11,443 375 Germany 357,380 82,212 81,777 82,952 232 Estonia 45,230 1,397 1,331 1,315
1.0 Area and population area population (1,000) km 2 2000 2010 2018 1 inhabitants per km 2 Belgium 30,530 10,251 10,920 11,443 375 Germany 357,380 82,212 81,777 82,952 232 Estonia 45,230 1,397 1,331 1,315
June EU Countries NEW COMMERCIAL VEHICLE REGISTRATIONS. PRESS EMBARGO FOR ALL DATA: July 26, 2013, 8.00 A.M. (6.00 A.M. GMT)
") PRESS EMBARGO FOR ALL DATA: y 26, 213, 8. A.M. (6. A.M. GMT) Press s Release e e NEW COMMERCIAL VEHICLE REGISTRATIONS e 213 EU Countries 15, LCVs up to 3.5t 2, Heavy Trucks of 16t and over ons New Registrati
PRESS EMBARGO FOR ALL DATA: y 26, 213, 8. A.M. (6. A.M. GMT) Press s Release e e NEW COMMERCIAL VEHICLE REGISTRATIONS e 213 EU Countries 15, LCVs up to 3.5t 2, Heavy Trucks of 16t and over ons New Registrati
NEW PASSENGER CAR REGISTRATIONS EUROPEAN UNION 1
 PRESS EMBARGO: 8.00 AM (6.00 AM GMT), 19 September 2018 NEW PASSENGER CAR REGISTRATIONS EUROPEAN UNION 1 Passenger car registrations: +6.1% eight months into 2018; +10.5% in July and +31.2% in August In
December 2011 compared with November 2011 Industrial producer prices down by 0.2% in both euro area and EU27
 18/2012-2 February 2012 December 2011 compared with November 2011 Industrial producer prices down by 0.2% in both euro area and EU27 In December 2011, compared with November 2011, the industrial producer
NEW COMMERCIAL VEHICLE REGISTRATIONS EUROPEAN UNION 1. April 2017
 PRESS EMBARGO: NEW COMMERCIAL VEHICLE REGISTRATIONS EUROPEAN UNION 1 April 2017 Next press release: Friday 23 June 2017 1 Data for Malta unavailable Page 1 of 7 Commercial vehicle registrations: +3.8%
Emissions per capita and GDP
 Emissions per capita and GDP (1990 -) CEIP Centre on Emission Inventories and Projections Emissions per capita and emissions per GDP were calculated for all years from 1990 to where data was available
NEW COMMERCIAL VEHICLE REGISTRATIONS EUROPEAN UNION* September 2014
 PRESS EMBARGO: 8.00 A.M. (7.00 A.M GMT), October 28, 2014 NEW COMMERCIAL VEHICLE REGISTRATIONS EUROPEAN UNION* September 2014 Next Press Release: November 27, 2014 *Data for Malta unavailable Page 1 of
June EU Countries NEW COMMERCIAL VEHICLE REGISTRATIONS. PRESS EMBARGO FOR ALL DATA: July 26, 2012, 8.00 A.M. (6.00 A.M. GMT) LCVs up to 3.
 LCVs up to 3.") PRESS EMBARGO FOR ALL DATA: y 26, 212, 8. A.M. (6. A.M. GMT) Press s Release e e NEW COMMERCIAL VEHICLE REGISTRATIONS e 212 EU Countries 15, LCVs up to 3.5t 2, Heavy Trucks over 16t New Regis strations
PRESS EMBARGO FOR ALL DATA: y 26, 212, 8. A.M. (6. A.M. GMT) Press s Release e e NEW COMMERCIAL VEHICLE REGISTRATIONS e 212 EU Countries 15, LCVs up to 3.5t 2, Heavy Trucks over 16t New Regis strations
P r e s s R e l e a s e. June 2007
 PRESS EMBARGO FOR ALL DATA: 26 July 27, 8. A.M. (6. A.M. GMT) P r e s s NEW COMMERCIAL VEHICLE REGISTRATIONS June 27 European Union + EFTA Countries LCVs up to 3.5t Heavy Trucks over 16t 25, 3, 2, 15,
NEW PASSENGER CAR REGISTRATIONS EUROPEAN UNION 1
 PRESS EMBARGO: 8.00 AM (6.00 AM GMT), 17 July 2018 NEW PASSENGER CAR REGISTRATIONS EUROPEAN UNION 1 Passenger car registrations: +2.9% during first half of 2018; +5.2% in In 2018, passenger car registrations
NEW PASSENGER CAR REGISTRATIONS EUROPEAN UNION 1
 PRESS EMBARGO: 8.00 AM (7.00 AM GMT), 16 January 2019 NEW PASSENGER CAR REGISTRATIONS EUROPEAN UNION 1 Passenger car registrations: +0.1% in 2018; 8.4% in In 2018, the EU passenger car market declined
NEW PASSENGER CAR REGISTRATIONS EUROPEAN UNION 1
 PRESS EMBARGO: 8.00 AM (6.00 AM GMT), 15 June 2018 NEW PASSENGER CAR REGISTRATIONS EUROPEAN UNION 1 Passenger car registrations: +2.4% five months into 2018; +0.8% in In 2018, the EU passenger car market
NEW PASSENGER CAR REGISTRATIONS EUROPEAN UNION 1
 PRESS EMBARGO: 8.00 AM (6.00 AM GMT), 17 May 2018 NEW PASSENGER CAR REGISTRATIONS EUROPEAN UNION 1 Passenger car registrations: +2.7% four months into 2018; +9.6% in In 2018, the EU passenger car market
Euro area unemployment rate at 10.5%
 3/2016-7 January 2016 November 2015 Euro area unemployment rate at 10.5% EU28 at 9.1% The euro area (EA19) seasonally-adjusted unemployment rate was 10.5% in November 2015, down from 10.6% in October 2015,
Labour Market Latest Trends- 1st quarter 2008 data 1
 Population and social conditions Author: Fabrice ROMANS Data in focus 34/2008 Labour Market Latest Trends- 1st quarter 2008 data 1 Chart 1: Employment rate 2 (15-64 years) for from 2000Q1 to 2008Q1 % 66.5
NEW PASSENGER CAR REGISTRATIONS EUROPEAN UNION *
 PRESS EMBARGO: 8.00 AM (7.00 AM GMT), 17 November 2015 NEW PASSENGER CAR REGISTRATIONS EUROPEAN UNION * Passenger car registrations: +8.2% over ten months; +2.9% in In 2015, the EU passenger car market
NEW PASSENGER CAR REGISTRATIONS EUROPEAN UNION 1
 PRESS EMBARGO: 8.00 AM (6.00 AM GMT), 19 September 2018 NEW PASSENGER CAR REGISTRATIONS EUROPEAN UNION 1 Passenger car registrations: +6.1% eight months into 2018; +10.5% in July and +31.2% in August In
Effective Measures on Drink Driving in the EU
 Pathways for Health Paris Effective Measures on Drink Driving in the EU, Senior Policy Advisor European Transport Safety Council, www.etsc.be Presentation Structure Introduction to ETSC Research on drink
NEW PASSENGER CAR REGISTRATIONS EUROPEAN UNION 1
 PRESS EMBARGO: 8.00 AM (6.00 AM GMT), 19 April 2017 NEW PASSENGER CAR REGISTRATIONS EUROPEAN UNION 1 Passenger car registrations: +8.4% first three months of 2017; +11.2% in In 2017, EU passenger car registrations
June 2014 Euro area unemployment rate at 11.5% EU28 at 10.2%
 STAT/14/121 31 July 2014 June 2014 Euro area unemployment rate at 11.5% EU28 at 10.2% The euro area 1 (EA18) seasonally-adjusted 2 unemployment rate 3 was 11.5% in June 2014, down from 11.6% in May 2014
February 2014 Euro area unemployment rate at 11.9% EU28 at 10.6%
 STAT/14/52 1 April 2014 February 2014 Euro area unemployment rate at 11.9% EU28 at 10.6% The euro area 1 (EA18) seasonally-adjusted 2 unemployment rate 3 was 11.9% in February 2014, stable since October
May 2014 Euro area unemployment rate at 11.6% EU28 at 10.3%
 STAT/14/103-1 July 2014 May 2014 Euro area unemployment rate at 11.6% EU28 at 10.3% The euro area 1 (EA18) seasonally-adjusted 2 unemployment rate 3 was 11.6% in May 2014, stable compared with April 2014
AUSTRIA. Table 1. FDI flows in the host economy, by geographical origin. (Millions of US dollars)
") Table 1. FDI flows in the host economy, by geographical origin World 5 690 138 6 195 3 184 10 784 7 933 31 154 6 858 9 303 840 10 618 5 760 Developed economies 5 740 13 5 341 2 689 10 137 6 291 29 721
Table 1. FDI flows in the host economy, by geographical origin World 5 690 138 6 195 3 184 10 784 7 933 31 154 6 858 9 303 840 10 618 5 760 Developed economies 5 740 13 5 341 2 689 10 137 6 291 29 721
NEW PASSENGER CAR REGISTRATIONS EUROPEAN UNION 1
 PRESS EMBARGO: 8.00 AM (7.00 AM GMT), 14 December 2017 NEW PASSENGER CAR REGISTRATIONS EUROPEAN UNION 1 Passenger car registrations: +4.1% over 11 months; +5.9% in In 2017, registrations of new passenger
NEW PASSENGER CAR REGISTRATIONS EUROPEAN UNION 1
 PRESS EMBARGO: 8.00 AM (6.00 AM GMT), 17 October 2017 NEW PASSENGER CAR REGISTRATIONS EUROPEAN UNION 1 Passenger car registrations: +3.7% over nine months; 2.0% in In 2017, passenger car registrations
September 2003 Industrial producer prices stable in euro-zone and EU15
 STAT/03/123 31 October 2003 September 2003 Industrial producer prices stable in euro-zone and EU15 The euro-zone 1 industrial producer price index 2 remained unchanged in September 2003 compared with the
NEW PASSENGER CAR REGISTRATIONS EUROPEAN UNION 1
 PRESS EMBARGO: 8.00 AM (6.00 AM GMT), 16 May 2017 NEW PASSENGER CAR REGISTRATIONS EUROPEAN UNION 1 Passenger car registrations: +4.7% four months into 2017; 6.6% in In 2017, the number of passenger cars
Energy efficiency policies and measures in transport in the EU 27, Norway and Croatia
 ODYSSEE MURE Final Meeting Paris, May 18-19 2009 Energy efficiency policies and measures in transport in the EU 27, Norway and Croatia B Lapillonne Karine Pollier Enerdata Content Overview of measures:
Winners & Losers by Market - January 2019 vs January 2018
 Countries 19/18 % Chg LITHUANIA +49,0 ROMANIA +18,8 HUNGARY +9,2 PORTUGAL +8,3 DENMARK +7,0 GREECE +3,7 LATVIA +0,7 POLAND -0,3 FRANCE -1,1 GERMANY -1,4 UNITED KINGDOM -1,6 NORWAY -2,2 LUXEMBOURG -3,4
NEW PASSENGER CAR REGISTRATIONS EUROPEAN UNION 1
 PRESS EMBARGO: 8.00 AM (6.00 AM GMT), 17 October 2018 NEW PASSENGER CAR REGISTRATIONS EUROPEAN UNION 1 Passenger car registrations: +2.5% nine months into 2018; 23.5% in In 2018, registrations of new passenger
NEW PASSENGER CAR REGISTRATIONS EUROPEAN UNION 1
 PRESS EMBARGO: 8.00 AM (7.00 AM GMT), 15 February 2019 NEW PASSENGER CAR REGISTRATIONS EUROPEAN UNION 1 Passenger car registrations: 4.6% in 2019 In 2019, the European passenger car market saw a slow start
NEW PASSENGER CAR REGISTRATIONS EUROPEAN UNION 1
 PRESS EMBARGO: 8.00 AM (7.00 AM GMT), 14 December 2018 NEW PASSENGER CAR REGISTRATIONS EUROPEAN UNION 1 Passenger car registrations: +0.8% 11 months into 2018; 8.0% in In 2018, passenger car demand fell
Winners & Losers by Market - December 2018 vs December 2017
 Countries December 18/17 % Chg LITHUANIA +24,8 CROATIA +16,1 NETHERLANDS +15,3 ROMANIA +12,3 ITALY +2,0 GREECE -1,1 SPAIN -3,5 PORTUGAL -5,3 CYPRUS -5,3 POLAND -5,5 UNITED KINGDOM -5,5 GERMANY -6,7 LUXEMBOURG
Winners & Losers by Market - July 2018 vs July 2017
 Countries July 18/17 % Chg LITHUANIA +56,5 CROATIA +43,7 ROMANIA +34,2 HUNGARY +29,0 POLAND +25,7 SPAIN +19,3 FRANCE +18,9 SLOVENIA +17,6 BELGIUM +16,8 PORTUGAL +13,6 AUSTRIA +13,5 GERMANY +12,3 NETHERLANDS
NEW PASSENGER CAR REGISTRATIONS EUROPEAN UNION 1
 PRESS EMBARGO: 8.00 AM (6.00 AM GMT), 16 June 2017 NEW PASSENGER CAR REGISTRATIONS EUROPEAN UNION 1 Passenger car registrations: +5.3% five months into 2017; +7.6% in In 2017, passenger car registrations
First Trends H2020 vs FP7: winners and losers
 First Trends H2020 vs FP7: winners and losers Special focus on EU13 countries by Christian Saublens for EURADA INTRODUCTION Based on data available on the Cordis website on 3 December 2015, it is possible
Winners & Losers by Market - September 2018 vs September 2017
 Countries September 18/17 % Chg BULGARIA +8,5 CROATIA +3,3 SLOVENIA -7,3 HUNGARY -7,4 LITHUANIA -8,3 CYPRUS -9,9 LATVIA -11,0 FRANCE -12,8 PORTUGAL -14,0 DENMARK -16,0 NETHERLANDS -16,7 SWITZERLAND -16,8
NEW PASSENGER CAR REGISTRATIONS EUROPEAN UNION 1
 PRESS EMBARGO: 8.00 AM (7.00 AM GMT), 17 January 2018 NEW PASSENGER CAR REGISTRATIONS EUROPEAN UNION 1 Passenger car registrations: +3.4% in 2017; 4.9% in In 2017, new passenger car registrations in the
NEW PASSENGER CAR REGISTRATIONS EUROPEAN UNION 1
 PRESS EMBARGO: 8.00 AM (7.00 AM GMT), 15 February 2018 NEW PASSENGER CAR REGISTRATIONS EUROPEAN UNION 1 Passenger car registrations: +7.1% in 2018 In 2018, demand for passenger cars in the European Union
Winners & Losers by Market - April 2017 vs April 2016
 Countries April 17/16 % Chg CROATIA +29,6 1 PORTUGAL +17,8 2 POLAND +14,4 BULGARIA +14,1 LITHUANIA +10,7 SLOVENIA +9,7 HUNGARY +7,7 ROMANIA +7,5 NETHERLANDS +6,3 ESTONIA +4,3 SPAIN +1,1 SLOVAKIA -0,1 CZECH
Winners & Losers by Market - June 2017 vs June 2016
 Countries June 17/16 % Chg ROMANIA +47,0 1 CYPRUS +46,0 2 LITHUANIA +40,6 ESTONIA +33,7 BULGARIA +31,4 SLOVENIA +16,4 SLOVAKIA +14,5 GREECE +14,4 ITALY +12,9 HUNGARY +11,6 ICELAND +10,2 CROATIA +8,8 POLAND
Infographics on Electromobility (January 2019)
") Infographics on Electromobility (January 2019) Publisher: BMW Group Corporate Communications Electromobility Last Update: 04.01.2019 Contact: presse@bmw.de ELECTROMOBILITY IN GERMANY. SHARE IN NEW REGISTRATIONS
Infographics on Electromobility (January 2019) Publisher: BMW Group Corporate Communications Electromobility Last Update: 04.01.2019 Contact: presse@bmw.de ELECTROMOBILITY IN GERMANY. SHARE IN NEW REGISTRATIONS
PRESS RELEASE 8:00 GMT, 17 th December 2015 London, UK
 PRESS RELEASE 8:00 GMT, 17 th December 2015 London, UK EUROPEAN NEW-CAR REGISTRATIONS POSTED SECOND HIGHEST MONTHLY INCREASE THIS YEAR DURING NOVEMBER November new-car registrations were up by 13.5% to
In national currency
 Euro-super 95 In national currency Gas oil automobile Automotive gas oil Dieselkraftstoff Gasoil de chauffage Heating gas oil Heizöl (II) Soufre
In national currency
 Euro-super 95 In national currency Gas oil automobile Automotive gas oil Dieselkraftstoff Gasoil de chauffage Heating gas oil Heizöl (II) Soufre
In national currency
 Euro-super 95 In national currency Gas oil automobile Automotive gas oil Dieselkraftstoff Gasoil de chauffage Heating gas oil Heizöl (II) Soufre
In national currency. Gas oil automobile Automotive gas oil Dieselkraftstoff (I)
") In national currency Euro-super 95 Gas oil automobile Automotive gas oil Dieselkraftstoff Gasoil de chauffage Heating gas oil Heizöl (II) Soufre
In national currency Euro-super 95 Gas oil automobile Automotive gas oil Dieselkraftstoff Gasoil de chauffage Heating gas oil Heizöl (II) Soufre
The EU s Advanced Biofuels and Post 2020 policy
 The EU s Advanced Biofuels and Post 2020 policy Rob Vierhout, MSc ISCC fi?h Regional Stakeholder MeeEng 29 September 2016 - Las Vegas Agenda The EU Energy & Climate policy post 2020 Low Emission Mobility
Status Review on Smart Metering
 Status Review on Smart Metering Silke Ebnet & Stefan Santer Workshop 14 December 2009 Introduction Need for a status review and detailed analysis of smart meters in Europe was expressed at the first CEF
Monitoring the CO 2 emissions from new passenger cars in the EU: summary of data for 2010
 Monitoring the CO 2 emissions from new passenger cars in the EU: summary of data for 2010 EXECUTIVE SUMMARY EEA has collected data submitted by Member States on vehicle registrations in the year 2010,
NEW PASSENGER CAR REGISTRATIONS EUROPEAN UNION *
 PRESS EMBARGO: 8.00 AM (6.00 AM GMT), 16 April 2015 NEW PASSENGER CAR REGISTRATIONS EUROPEAN UNION * PASSENGER CAR registrations: +8.6% in first quarter; +10.6% in In 2015, demand for new passenger cars
RISK DASHBOARD ANNEX CREDIT RISK PARAMETERS Q2 2017
 RISK DASHBOARD ANNEX CREDIT RISK PARAMETERS Q2 2017 Corporates 4 0.57% 0.81% 0.84% 0.81% 4 8.75% 17.51% 26.12% 22.73% 57 0.23% 0.45% 1.66% 1.64% 58 33.81% 42.41% 45.00% 29.97% Corporates - Of Which: Specialised
RISK DASHBOARD ANNEX CREDIT RISK PARAMETERS Q4 2017
 RISK DASHBOARD ANNEX CREDIT RISK PARAMETERS Q4 2017 Corporates 10 1.22% 4.02% 26.81% 1.95% 9 15.68% 32.84% 36.64% 31.60% 51 0.20% 1.00% 4.08% 2.02% 54 34.12% 43.96% 45.10% 29.73% Corporates - Of Which:
Civil Dialogue Group on WINE Thursday April 19th, 2018
 COMMISSION EUROPÉENNE DIRECTION GÉNÉRALE DE L'AGRICULTURE ET DU DÉVELOPPEMENT RURAL Directorate G. Markets and Observatories G.2. Wine, spirits and horticultural products Bruxelles, le G.2/GD(2017) Civil
Passenger cars in the EU
 Passenger cars in the EU Statistics Explained Data extracted in April 2018 Planned article update: April 2019 This article describes developments in passenger car stocks and new registrations in the European
NEW PASSENGER CAR REGISTRATIONS EUROPEAN UNION 1
 PRESS EMBARGO: 8.00 AM (6.00 AM GMT), 14 September 2017 NEW PASSENGER CAR REGISTRATIONS EUROPEAN UNION 1 Passenger car registrations: +4.5% over eight months; +5.6% in August In August 2017, passenger
C O N S U L T JATO CONSULT CO 2 REPORT EXTRACT [AUGUST 2015] All Rights Reserved JATO Dynamics Ltd 1
![C O N S U L T JATO CONSULT CO 2 REPORT EXTRACT [AUGUST 2015] All Rights Reserved JATO Dynamics Ltd 1](/thumbs/77/75876229.jpg "C O N S U L T JATO CONSULT CO 2 REPORT EXTRACT [AUGUST 2015] All Rights Reserved JATO Dynamics Ltd 1") C O N S U L T JATO CONSULT CO 2 REPORT EXTRACT [AUGUST 2015] All Rights Reserved JATO Dynamics Ltd 1 JATO CONSULT CO 2 REPORT EXTRACT This report continues JATO s focus on the average CO 2 emissions of
C O N S U L T JATO CONSULT CO 2 REPORT EXTRACT [AUGUST 2015] All Rights Reserved JATO Dynamics Ltd 1 JATO CONSULT CO 2 REPORT EXTRACT This report continues JATO s focus on the average CO 2 emissions of
March 2013 Euro area unemployment rate at 12.1% EU27 at 10.9%
 STAT/13/70 30 April 2013 March 2013 Euro area unemployment rate at 12.1% at 10.9% The euro area 1 (EA17) seasonally-adjusted 2 unemployment rate 3 was 12.1% in March 2013, up from 12.0% in February 4.
Recent development of liquid biofuels in the European Union. 14 July 2006 Sofia Jean-Marc Jossart
 Recent development of liquid biofuels in the European Union 14 July 26 Sofia Jean-Marc Jossart Content - Directives 23/3 and 96 - Biomass Action Plan - EU strategy for biofuels -BIOFRAC andebtp -Standards
Biofuels in Europe: Overview and Features of a New Industry
 XXXII International IAEE Conference Biofuels in Europe: Overview and Features of a New Industry June 23rd, 2009 San Francisco Pietro Lanzini, Iefe-Bocconi University European framework: - Directive 2003/30/EC
Winners & Losers by Market - May 2015 vs May 2014
 Countries PORTUGAL +33,1 GREECE +21,6 ICELAND +21,3 CZECH REPUBLIC +17,6 SPAIN +14,0 SLOVENIA +13,7 POLAND +11,0 ITALY +10,8 BULGARIA +10,7 IRELAND +10,3 LITHUANIA +9,6 CYPRUS +7,4 SWEDEN +6,5 SWITZERLAND
How to notify a waste shipment.
 How to notify a waste shipment. Outline of Presentation What do I have to notify? How do I go about this? Problem areas Sources of guidance Contact details Which wastes do I have to notify? Re-cap Notification
THE EUROPEAN MARKETS AND STRATEGIES TO WATCH FOR MAXIMUM OPPORTUNITY
 THE EUROPEAN MARKETS AND STRATEGIES TO WATCH FOR MAXIMUM OPPORTUNITY BRIAN MADSEN ONLINE AUCTIONS IT SOLUTIONS SMART DATA 1 THE SPEED OF CHANGE IS FASTER THAN EVER 2 THE NEW NORMAL 3 CHANGE OF OWMERSHIP
USDA Agricultural Outlook Forum 2007
 USDA Agricultural Outlook Forum 2007 EU BIOFUELS POLICY AND EFFECTS ON PRODUCTION, CONSUMPTION AND LAND USE FOR ENERGY CROPS Hilkka Summa Head of Unit for Bioenergy, Biomass, Forestry and Climate Change
Survey on passengers satisfaction with rail services. Analytical report. Flash Eurobarometer 326 The Gallup Organization
 Flash Eurobarometer 326 The Gallup Organization Flash Eurobarometer European Commission Survey on passengers satisfaction with rail services Analytical report Fieldwork: March 2011 Publication: June 2011
New Passenger Car Registrations European Union
 PRESS EMBARGO : 8.00am (7.00am GMT), February 18, 2014 New Passenger Car Registrations European Union February 18, 2014 Units 1,700,000 1,500,000 New Passenger Car Registrations in the EU Last 12 months
New Passenger Car Registrations European Union
 PRESS EMBARGO : 8.00am (6.00am GMT), September 17, 2013 New Passenger Car Registrations European Union September 17, 2013 Units 1,700,000 1,500,000 New Passenger Car Registrations in the EU Last 12 months
Production of heat by type Terajoules
 Production of heat by type Table Notes geo represents heat used directly for district heating, agriculture etc. without a commercial transaction taking place. Please refer to the Definitions Section on
New Passenger Car Registrations European Union
 PRESS EMBARGO : 8.00am (6.00am GMT), May 16, 2014 New Passenger Car Registrations European Union May 16, 2014 Units 1,500,000 New Passenger Car Registrations in the EU Last 12 months +10.6% 1,400,000 1,300,000
exports of goods annual change (%)
") 12.0 Austria s foreign trade 2015 by world region imports of goods 2015 exports of goods 2015 region 1 1 share (%) share (%) Europe 106,984 80.4 104,032 79.1 EU 93,686 70.4 90,841 69.1 EFTA 8,020 6.0 8,098
12.0 Austria s foreign trade 2015 by world region imports of goods 2015 exports of goods 2015 region 1 1 share (%) share (%) Europe 106,984 80.4 104,032 79.1 EU 93,686 70.4 90,841 69.1 EFTA 8,020 6.0 8,098
exports of goods annual change (%)
") 12.0 Austria s foreign trade 2016 by world region imports of goods 2016 exports of goods 2016 region 1 1 share (%) share (%) Europe 110,067 81.2 104,271 79.5 EU 96,801 71.4 91,112 69.4 EFTA 7,718 5.7 8,132
12.0 Austria s foreign trade 2016 by world region imports of goods 2016 exports of goods 2016 region 1 1 share (%) share (%) Europe 110,067 81.2 104,271 79.5 EU 96,801 71.4 91,112 69.4 EFTA 7,718 5.7 8,132
COMMUNICATION FROM THE COMMISSION TO THE COUNCIL
 EUROPEAN COMMISSION Brussels, 25.10.2017 COM(2017) 622 final COMMUNICATION FROM THE COMMISSION TO THE COUNCIL European Development Fund (EDF): forecasts of commitments, payments and contributions from
New Passenger Car Registrations European Union
 PRESS EMBARGO : 8.00am (6.00am GMT), April 17, 2014 New Passenger Car Registrations European Union April 17, 2014 Units 1,700,000 New Passenger Car Registrations in the EU Last 12 months 1,500,000 10.2%
42/ March GDP growth in the euro area and EU28. GDP growth rates % change over the previous quarter, based on seasonally adjusted data
 2007Q1 2007Q2 2007Q3 2007Q4 2008Q1 2008Q2 2008Q3 2008Q4 2009Q1 2009Q2 2009Q3 2009Q4 2010Q1 2010Q2 2010Q3 2010Q4 2011Q1 2011Q2 2011Q3 2011Q4 2012Q1 2012Q2 2012Q3 2012Q4 2013Q1 2013Q2 2013Q3 2013Q4 2014Q1
Thermal Coal Market Presentation to UNECE Ad Hoc Group of Experts on Coal in Sustainable Development December 7, 2004
 Thermal Coal Market Presentation to UNECE Ad Hoc Group of Experts on Coal in Sustainable Development December 7, 2004 Barlow Jonker Pty Ltd Commercial in Confidence 1 Presentation Outline 1. Barlow Jonker
New Passenger Car Registrations European Union
 PRESS EMBARGO : 8.00am (7.00am GMT), March 18, 2014 New Passenger Car Registrations European Union March 18, 2014 Units 1,700,000 1,500,000 New Passenger Car Registrations in the EU Last 12 months 10.2%