Market situation in the Olive oil and Table olives sectors
|
|
|
- Georgia Byrd
- 5 years ago
- Views:
Transcription


1 Market situation in the Olive oil and Table olives sectors Committee for the Common Organisation of the Agricultural Markets Arable crops and olive oil 30 May 2017 Lucie Zolichová, AGRI G.4
2 CHANGES IN ISAMM NOTIFICATIONS ON PRODUCTION & PRICES 2
3 COMMISSION DELEGATED REGULATION (EU) /... of on supplementing Regulations (EU) No 1307/2013 and (EU) No 1308/2013 of the European Parliament and of the Council with regard to the notifications to the Commission of information and documents COMMISSION IMPLEMENTING REGULATION (EU) /... of laying down rules for the application of Regulations (EU) No 1307/2013 and (EU) No 1308/2013 of the European Parliament and of the Council as regards notifications to the Commission of information and documents and amending and repealing several Commission Regulations Both documents adopted by the Commission on Delegated act sent to the EP for the two months examination period Expected date of publication: the last week of June
4 OLIVE OIL PRODUCTION MS concerned: all MS producing olive oil 1. For the PRECEDING annual period from 1 October to 30 September - FINAL production, total domestic consumption and ending stocks ISAMM form nr. 209 WHEN: by For the CURRENT annual period from 1 October to 30 September - ESTIMATE of TOTAL production, domestic consumption and ending stocks ISAMM form nr. 715 WHEN: by ESTIMATE of MONTHLY production and an update on total domestic consumption and ending stocks ISAMM form nr. 44 WHEN: by the 15th of each month from November to June 4
 ISAMM form nr.")
5 OLIVE OIL PRICES MS concerned: MS producing more than t of olive oil per year Average prices recorded on the main representative markets AND national average prices (in /100kg) ISAMM form nr. 48 WHEN: weekly (Wednesday 12:00h Brussels time) 5
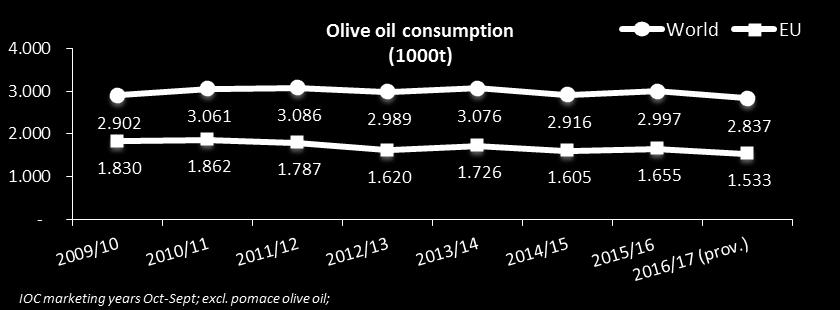
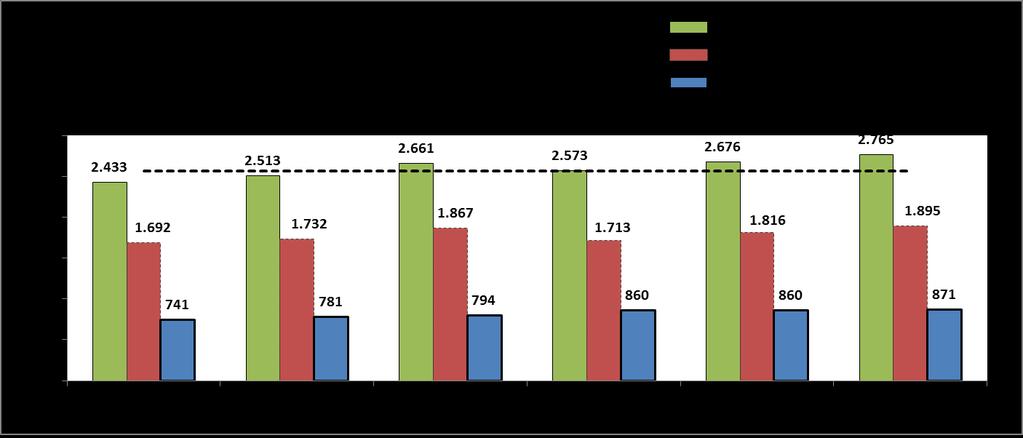
6 OLIVE OIL PRODUCTION, CONSUMPTION & ENDING STOCKS 6

7 2016/17 vs 2015/16 WORLD -20% EU -25% non-eu -6% Source: International Olive Council & MS declarations 7


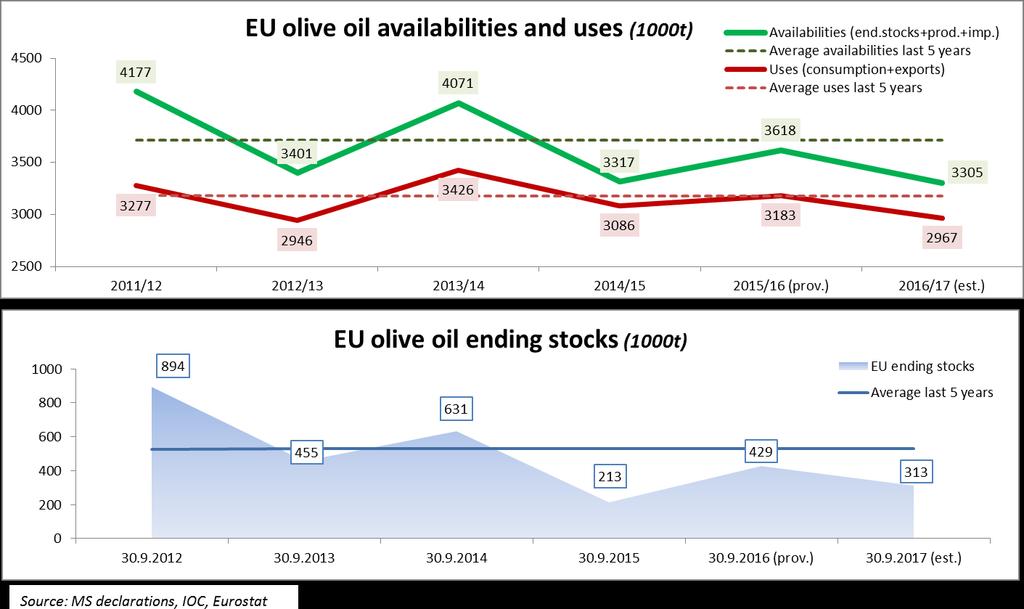
8 EU production in 2016/17 13% below 5-year average excl. pomace oil Source: International Olive Council; MS declarations 8
9 MONTHLY EU OLIVE OIL PRODUCTION ( ) Source: MS declarations - Annexe III point A b) et c) du règlement (CE) n 826/ Annex III point A b) and c) of Regulation (EC) No 826/2008 (*) (tonnes) 2016/2017 EL ES FR IT CY MT PT SI HR TOTAL September October November December January February March April May 0 June 0 Total Production Estimation 2016/ Consumption Estimation 2016/ Final Stock Estimation 2016/17 (on 30.9.) (*)Commission Regulation (EC) 826/2008 and Commission implementing regulation (EU) No 65/2013 amending Annex III to Regulation (EC) No 826/2008 Notifications ISAMM CY, MT- NO ISAMM NOTIFICATIONS. Estimated data or IOC. CHANGE TO PREVIOUS COMMUNICATION 9


10 Non-EU production in 2016/17 12% below 5-year average Source: International Olive Council excl. pomace oil 10
11 11
12 12-40%
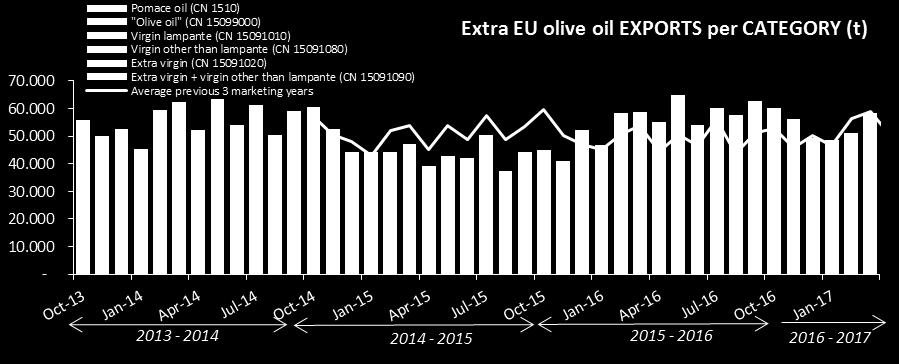
13 EU OLIVE OIL EXTRA-TRADE 13
14 ORIGIN EU imports of olive oil (t) change Oct 16-Mar / /16 Oct 16 -Mar 17 vs Oct 15-Mar 16 tonnes share tonnes share tonnes share % Tunisia % % % -23% Morocco % % % 78% Turkey % 585 1% % 543% Argentina % % % -85% Others % % % 7% EXTRA EU % Source: Eurostat/Comext Periods October - September CN codes 1509 & 1510, all stat. regimes 14

 15091080 (virgin other")
15 Source: Eurostat/Comext Reminder: Change of CN codes as of : becomes (extra virgin) (virgin other than lampante) 15

16 EU olive oil IMPORTS Jan - Apr 2017 conditioned / bulk (t) TARIC_CODE extra virgin in containers of 5 litres or less extra virgin in bulk 85% 2% 3% 2% 2% virgin in containers of 5 litres or less virgin in bulk "olive oil" in containers of 5 litres or less "olive oil" in bulk 7% Source: DG Taxud Surveillance 16
17 Inward processing (IP) a relief from customs duty and import VAT on goods that are imported from outside the EU to be processed, and then exported outside the EU or released for free circulation in the EU. Excise duty is also suspended when goods are entered into IP. 17
18 18
19 19

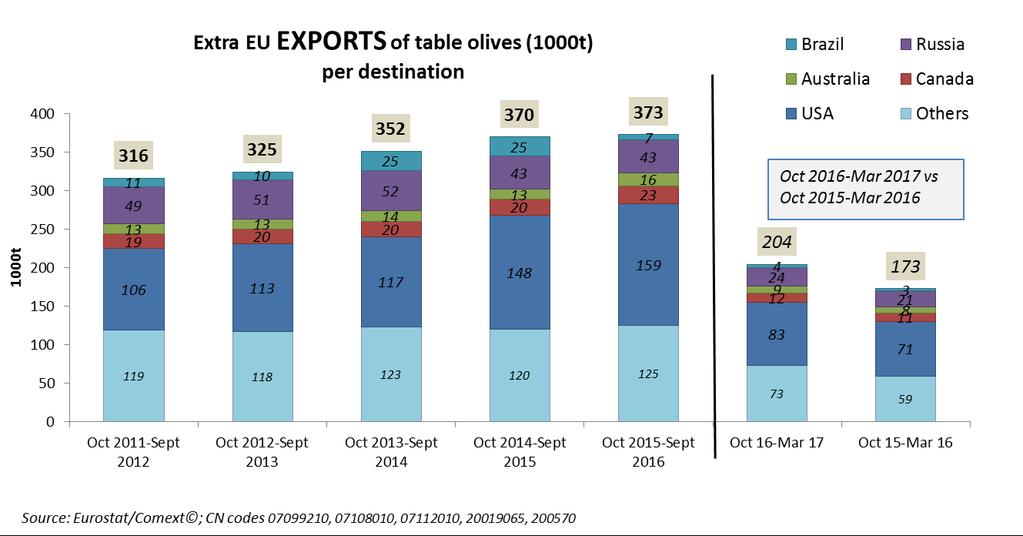
20 DESTINATION 2014/ /16 Oct 16 -Mar 17 change Oct 16-Mar 17 vs Oct 15-Mar 16 tonnes share tonnes share tonnes share % USA % % % 4% Brazil % % % 37% Japan % % % 2% China % % % -1% Canada % % % 12% Australia % % % 26% Russia % % % 4% Others % % % 11% EXTRA EU % Source: Eurostat/Comext Periods October - September CN codes 1509 & 1510, all stat. regimes EU exports of olive oil (t) 20
21 Source: Eurostat/Comext 21


22 SPAIN olive oil EXPORTS Jan - Apr 2017 TARIC_CODE conditioned / bulk (t) extra virgin in containers of 5 litres or less extra virgin in bulk 16% virgin in containers of 5 litres or less 14% 33% virgin in bulk "olive oil" in containers of 5 litres or less 3% 34% "olive oil" in bulk Source: DG Taxud Surveillance 22
23 OLIVE OIL INTRA-TRADE 2016/
24 Olive oil intra trade 2016/17* (CN 1509) (thousands tons) Origin (declared EXPORTS) Spain Italy Greece Portugal France Others TOTAL Destination volume volume volume volume volume volume total CN 1509 % share % share % share % share % share % share on total on total on total on total on total on total Spain 9,3 18,0% 1,7 3,2% 23,1 58,2% 0,7 13,1% 0,1 1,0% 34,8 Italy 175,6 60,4% 42,6 81,4% 13,5 34,1% 0,1 1,7% 0,2 2,6% 232,0 Greece 0,0 0,0% 0,1 0,2% 0,0 0,0% 0,0 0,0% 0,1 2,0% 0,2 Portugal 40,2 13,8% 0,0 0,0% 0,0 0,0% 0,0 0,0% 0,0 0,2% 40,2 France 32,7 11,2% 10,9 21,2% 0,5 0,9% 1,3 3,2% 1,6 26,4% 46,9 UK 18,0 6,2% 4,9 9,5% 0,6 1,2% 0,1 0,2% 0,1 1,4% 0,2 3,1% 23,9 Germany 6,9 2,4% 14,3 27,6% 3,5 6,6% 0,3 0,8% 0,7 12,6% 0,3 5,0% 25,9 Netherlands 6,0 2,1% 1,0 1,8% 0,2 0,3% 0,2 0,4% 0,1 1,0% 0,9 14,8% 8,2 Others 11,6 4,0% 11,2 21,7% 3,3 6,4% 1,2 3,1% 3,9 70,2% 2,7 44,8% 34,0 TOTAL 291,0 100% 51,6 100% 52,4 100% 39,6 100% 5,5 100% 6,1 100% 446,2 Total same period previous campaign 200,3 56,0 73,5 47,7 2,4 5,8 385,7 Difference same period previous campaign 45% -8% -29% -17% 131% 5% 16% * From 01/10/ /02/2017 Excl olive pomace oil Source: Comext/Eurostat (Data transmission to Eurostat: 40 days for aggregated results) All stat. regimes 24
25 EU OLIVE OIL PRICES (up to ) 25
26 EXTRA VIRGIN CATEGORY Evolution of EXTRA VIRGIN olive oil price - SPAIN (Jaén) / 100kg Latest price (Week 19/2017) : 403,5 Evolution compared same week last year: + 33,1% / / / year average ( ) Evolution of EXTRA VIRGIN olive oil price - ITALY (Bari) / 100kg Latest price (Week 19/2017) : 596,0 Evolution compared same week last year : + 67,4% / / / year average ( ) 150 Evolution of EXTRA VIRGIN olive oil price - GREECE (Χανιά) / 100kg 400 Latest price (Week 19/2017) : 376,0 Evolution compared same week last year: + 27,5% / / / year average ( ) 26 Source: MS declarations (R826/2008)
27 VIRGIN CATEGORY Evolution of VIRGIN olive oil price - SPAIN (Jaén) / 100kg Latest price (Week 19/2017) : 395,88 Evolution compared same week last year: + 41,0% / / / year average ( ) Evolution of VIRGIN olive oil price - ITALY (Bari) / 100kg Latest price (Week 19/2017) : 420,00 Evolution compared same week last year: + 47,4% / / / year average ( ) Evolution of VIRGIN olive oil price - GREECE (Χανιά) / 100kg Latest price (Week 19/2017) : 360,00 Evolution compared same week last year: + 28,6% Source: MS declarations (R826/2008) / / / year average ( )
28 LAMPANTE CATEGORY Evolution of LAMPANTE olive oil price - SPAIN (Jaén) / 100kg Latest price (Week 19/2017) : 388,88 Evolution compared same week last year: + 41,6% / / / year average ( ) Evolution of LAMPANTE olive oil price - ITALY (Lecce) / 100kg Latest price (Week 19/2017) : 268,00 Evolution compared same week last year: + 30,4% / / / year average ( ) 150 Evolution of LAMPANTE olive oil price - GREECE (Χανιά) / 100kg Latest price (Week 19/2017) : 310,00 Evolution compared same week last year: + 34,8% / / / year average ( ) 28 Source: MS declarations (R826/2008)
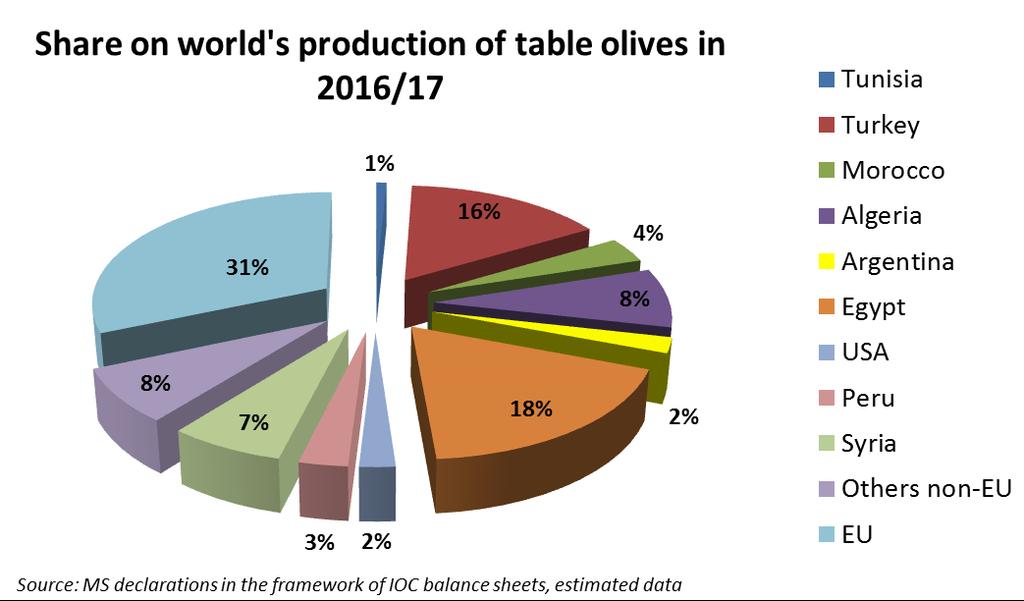
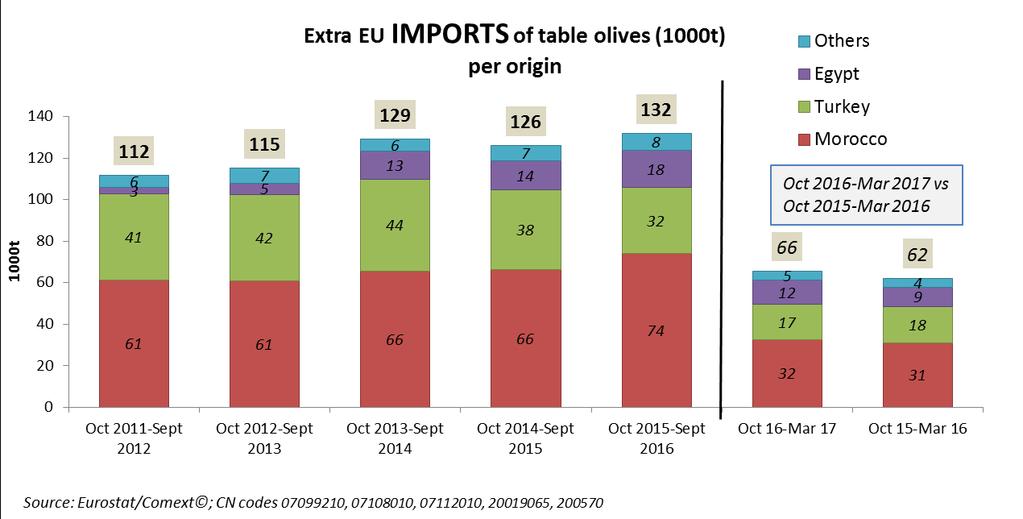
29 TABLE OLIVES 29
30 30
31 31
32 32
33 More market information on olive oil: Thank you 33
Market situation in the Olive oil and Table olives sectors
 Market situation in the Olive oil and Table olives sectors Committee for the Common Organisation of the Agricultural Markets Arable crops and olive oil 26 January 2017 Lucie Zolichová, AGRI G.4 lucie.zolichova@ec.europa.eu
Average monthly prices of virgin olive oil in the most representative EU markets. ITALY - BARI SPAIN - JAÉN GREECE - CHANIA Reference threshold
 EU Prices Production EU Trade EU Stocks DG AGRI DASHBOARD: OLIVE OIL Last update: 12.1.217 /1kg /1kg Consumption /1kg EU Balance Sheet Average monthly prices of virgin olive oil in the most representative
CHANGES IN WORLD OLIVE CROP AREA (ha)
") Madrid, 12 June 2015 12.000 CHANGES IN WORLD OLIVE CROP AREA (ha) 11.500 11.000 Irrigated 2006 Dryfarmed Dryfarmed 20% 80% Irrigated 2014 22% 78% 10.756 10.664 11.112 11.009 11.205 11.382 10.500 10.000
Madrid, 12 June 2015 12.000 CHANGES IN WORLD OLIVE CROP AREA (ha) 11.500 11.000 Irrigated 2006 Dryfarmed Dryfarmed 20% 80% Irrigated 2014 22% 78% 10.756 10.664 11.112 11.009 11.205 11.382 10.500 10.000
Committee for the Common Organisation of the Agricultural Market Market Situation for Sheep & Goat Meats 22 March 2018
 Committee for the Common Organisation of the Agricultural Market Market Situation for Sheep & Goat Meats 22 March 218 Production In ' tonnes carcase weight P R O D U C T I O N 297.4 114.8 8.9 67.1 51.3
D G A G R I D A S H B O A R D : T O M A T O E S Last update: EU AVG PRICES
 tonnes Weightedaverages by volume of production per MS Ongoing adjustments on weights by variety group 000 tonnes D G A G R I D A S H B O A R D : T O M A T O E S Last update: 20.04.2018 EU AVG PRICES MS
Committee for the Common Organisation of the Agricultural Market Market Situation for Sheep & Goat Meats 21 Septembre 2017
 Committee for the Common Organisation of the Agricultural Market Market Situation for Sheep & Goat Meats 21 Septembre 217 Production P R O D U C T I O N In ' tonnes carcase weight 14.1 58.4 43.8 3.6 29.2
International Olive Council. International Olive Council
 Advisory Committee on Olive Oil and Table Olives 29 June 29 1 115 CHANGES IN WORLD CROP AREA (thousand hectares) Bearing Non-bearing Irrigated Dry-farmed % change between years = 2% 11,52 9,137,867 1,21,39
Rice market situation
 Rice market situation DG AGRI C.5 Management Committee for the Common Organisation of Agricultural Markets / Rice 24/10/2013 World market mio t 700 600 500 400 300 200 100 - World rice balance sheet Trade
Publication of data. This report is published on a weekly basis.
 Trade monitoring through customs surveillance data The TAXUD surveillance system ("customs surveillance") records and centralizes all EU trade data (import and exports) directly from the national customs
Civil Dialogue Group on WINE Thursday April 19th, 2018
 COMMISSION EUROPÉENNE DIRECTION GÉNÉRALE DE L'AGRICULTURE ET DU DÉVELOPPEMENT RURAL Directorate G. Markets and Observatories G.2. Wine, spirits and horticultural products Bruxelles, le G.2/GD(2017) Civil
EU Market Situation for Poultry. Civil Dialogue Group. 25 October 2016
 EU Market Situation for Poultry Civil Dialogue Group 25 October 216 Thousand Tons F O R E C A S T 16 14 Experts EU production forecast on Poultry and Rabbit (Missing data (BE-EL-AT-RO-LT-SE) - No expert
Next update will be this week as soon as possible. Thanks for your understanding
 Next update will be this week as soon as possible. Thanks for your understanding Trade monitoring through customs surveillance data The TAXUD surveillance system ("customs surveillance") records and centralizes
D G A G R I D A S H B O A R D : A P P L E S
 75 79 60 56 49 74 65 59 54 42 76 63 58 53 78 55 42 43 79 44 81 63 47 83 64 59 53 48 Sources: Eurostat, MSs notifications, DG Agri, Comext, Comtrade, GTA, ITC, AMI, Expert groups, Freshfel, Wapa. 89 68
EU Market Situation for Eggs. Committee for the Common Organisation of the Agricultural Markets 23 June 2016
 EU Market Situation for Eggs Committee for the Common Organisation of the Agricultural Markets 23 June 216 FARM STRUCTURE SURVEY Number of Laying Hens 215 by way of keeping based on the EU Member States
Publication of data ,
 Trade monitoring through customs surveillance data The TAXUD surveillance system ("customs surveillance") records and centralizes all EU trade data (import and exports) directly from the national customs
March 2013 Euro area unemployment rate at 12.1% EU27 at 10.9%
 STAT/13/70 30 April 2013 March 2013 Euro area unemployment rate at 12.1% at 10.9% The euro area 1 (EA17) seasonally-adjusted 2 unemployment rate 3 was 12.1% in March 2013, up from 12.0% in February 4.
Spain s exports by oil product group and country of destination. Year Corporación de Reservas Estratégicas de Productos Petrolíferos
 Corporación de Reservas Estratégicas de Productos Petrolíferos Castellana, 79 28046 Madrid T. +34 91 360 09 10 Updated F. +34 91 420 on39 45 www.cores.es July 13 th 2015 Spain s exports by oil product
September 2003 Industrial producer prices stable in euro-zone and EU15
 STAT/03/123 31 October 2003 September 2003 Industrial producer prices stable in euro-zone and EU15 The euro-zone 1 industrial producer price index 2 remained unchanged in September 2003 compared with the
June 2014 Euro area unemployment rate at 11.5% EU28 at 10.2%
 STAT/14/121 31 July 2014 June 2014 Euro area unemployment rate at 11.5% EU28 at 10.2% The euro area 1 (EA18) seasonally-adjusted 2 unemployment rate 3 was 11.5% in June 2014, down from 11.6% in May 2014
Spain s exports by oil product group and country of destination
 Corporación de Reservas Estratégicas de Productos Petrolíferos Castellana, 79 28046 Madrid T. +34 91 360 09 10 Updated F. +34 91 420 on39 45 www.cores.es February 13 th 2017 Spain s exports by oil product
December 2011 compared with November 2011 Industrial producer prices down by 0.2% in both euro area and EU27
 18/2012-2 February 2012 December 2011 compared with November 2011 Industrial producer prices down by 0.2% in both euro area and EU27 In December 2011, compared with November 2011, the industrial producer
May 2014 Euro area unemployment rate at 11.6% EU28 at 10.3%
 STAT/14/103-1 July 2014 May 2014 Euro area unemployment rate at 11.6% EU28 at 10.3% The euro area 1 (EA18) seasonally-adjusted 2 unemployment rate 3 was 11.6% in May 2014, stable compared with April 2014
XXII Jornadas del Arroz Zaragoza (Spain) 9 th March 2016 EU RICE MARKET. Damien PLAN European Commission DG AGRI
 9 th March 2016 EU RICE MARKET. Damien PLAN European Commission DG AGRI") XXII Jornadas del Arroz Zaragoza (Spain) 9 th March 2016 EU RICE MARKET Damien PLAN European Commission DG AGRI Contents 1. EU Rice - Overview 2. EU Rice Trade Imports/Exports 3. EU Rice Market 2015/16
XXII Jornadas del Arroz Zaragoza (Spain) 9 th March 2016 EU RICE MARKET Damien PLAN European Commission DG AGRI Contents 1. EU Rice - Overview 2. EU Rice Trade Imports/Exports 3. EU Rice Market 2015/16
D G A G R I D A S H B O A R D : A P P L E S
 Sources: Eurostat, MSs notifications, DG Agri, Comext, Comtrade, GTA, ITC, AMI, Expert groups, Freshfel, Wapa. 000 tonnes 39 41 31 22 29 22 32 27 17 18 9 27 15 12 6 6 6 4 5 6 5 4 11 25 15 9 9 93 62 51
February 2014 Euro area unemployment rate at 11.9% EU28 at 10.6%
 STAT/14/52 1 April 2014 February 2014 Euro area unemployment rate at 11.9% EU28 at 10.6% The euro area 1 (EA18) seasonally-adjusted 2 unemployment rate 3 was 11.9% in February 2014, stable since October
EXECUTIVE SUMMARY ATLANTIC SALMON NO 03/06
 MARKET This table shows development in supply/consumption of Atlantic salmon in the main markets per month, in tonnes r.w The table contains preliminary figures and may diverge from same figures in the
September 2011 compared with August 2011 Industrial producer prices up by 0.3% in euro area Up by 0.4% in EU27
 161/2011-4 November 2011 September 2011 compared with August 2011 Industrial producer prices up by 0.3% in euro area Up by 0.4% in EU27 In September 2011 compared with August 2011, the industrial producer
Spain s imports by oil product group and country of origin
 Corporación de Reservas Estratégicas de Productos Petrolíferos Castellana, 79 28046 Madrid T. +34 91 360 09 10 Updated F. +34 91 420 on39 45 www.cores.es February 12 th 2018 Spain s imports by oil product
EU Market Situation for Poultry. Committee for the Common Organisation of the Agricultural Markets 22 October 2015
 EU Market Situation for Poultry Committee for the Common Organisation of the Agricultural Markets 22 October 215 Euro Dollar exchange rate 1.6 22/9/215: 1 EUR = 1.12 USD 1.4 1.2 1. Exchange rate: Spot,
Global Threat Reduction Initiative Foreign Research Reactor Spent Nuclear Fuel Shipments
 FY1996 1. Sept. 22, 1996 280 assemblies in 8 casks to SRS [First East Coast Shipment] FY 1997 Sweden 64 Switzerland 42 Germany 125 Chile 28 Columbia 21 2. Dec. 15, 1996 41 spent fuel assemblies in one
EU Oilseed Complex Trade 2017/18 Marketing Year July - June. AGRI G 4 Committee for the Common Organisation of Agricultural Markets 30 August 2018
 EU Oilseed Complex Trade 2017/18 Marketing Year July - June AGRI G 4 Committee for the Common Organisation of Agricultural Markets 30 August 2018 EU MS importing all oilseeds July - June +7% NL 4 240 4
HEEP & GOAT - MARKET SITUATION - DASHBOARD Last update: 9/11/2016
 EU Trade 158 166 211 21 212 234 256 South Africa EU World Trade India (up to Jul) EU India (up to Jul) New Zealand New Zealand South Africa Self-sufficiency In 1 tonnes carcass weight 941 92 884 881 919
COMMISSION IMPLEMENTING DECISION
 L 188/50 Official Journal of the European Union 19.7.2011 COMMISSION IMPLEMENTING DECISION of 11 July 2011 on a Union financial contribution towards Member States fisheries control, inspection and surveillance
Spain s imports by oil product group and country of origin
 Corporación de Reservas Estratégicas de Productos Petrolíferos Castellana, 79 28046 Madrid T. +34 91 360 09 10 Updated F. +34 91 420 on39 45 www.cores.es July 12 th 2018 Spain s imports by oil product
ECONOMIC BULLETIN - No. 42, MARCH Statistical tables
 ECONOMIC BULLETIN - No. 42, MARCH 2006 APPENDIX Appendix Statistical tables The world economy Table a1 Gross domestic product a2 Industrial production a3 Consumer prices a4 External current account a5
EUROPEAN COMMISSION ENTERPRISE AND INDUSTRY DIRECTORATE-GENERAL
 EUROPEAN COMMISSION ENTERPRISE AND INDUSTRY DIRECTORATE-GENERAL Sustainable Growth and EU 2020 Sustainable Mobility and Automotive Industry Brussels, 7 March 2014 ENTR/B4/GG (2014)651836 by email to: 1998Agreement-Missions@lists.unece.org,
Market situation Sugar Market Observatory 12 April 2018
 Market situation Sugar Market Observatory 12 April 2018 Arable crops, Sugar team DG Agriculture and Rural Development European Commission Sugar Prices Sugar Market Observatory 12 April 2018 2007 2008 2009
Beef Markets Outlook. January Mark Zieg. Growing the success of Irish food & horticulture. Growing the success of Irish food & horticulture
 Beef Markets Outlook January 213 Mark Zieg AIDAN COTTER CHIEF EXECUTIVE BORD BIA 28 JANUARY 29 Irish Beef Markets Exports 444, Export Volumes by Destination (212) UK 231, Spain 11, France 46, Holland 36,
Proportion of the vehicle fleet meeting certain emission standards
 The rate of penetration of new technologies is highly correlated with the average life-time of vehicles and the average age of the fleet. Estimates based on the numbers of cars fitted with catalytic converter
2016/17 Global Olive Oil Production Down But Prices Stabilize
 United States Department of Agriculture Foreign Agricultural Service November 2016 Global Olive Oil Down But Prices Stabilize Global Olive Oil and Stocks 4000 3500 5000 Extra Virgin Olive Oil Prices Stabilizing
Spain s imports by oil product group and country of origin
 Corporación de Reservas Estratégicas de Productos Petrolíferos Castellana, 79 28046 Madrid T. +34 91 360 09 10 Updated F. +34 91 420 on39 45 www.cores.es September 12 th 2018 Spain s imports by oil product
Wheat Marketing Situation
 Wheat Marketing Situation Prepared by: Darrell L. Hanavan Executive Director Colorado Wheat Administrative Committee If you would like to receive an email when this report is updated, email gmostek@coloradowheat.org
BUSINESS AND CONSUMER SURVEY RESULTS. August 2013: Economic Sentiment rises further in both the euro area and the EU
 August 2013 BUSINESS AND CONSUMER SURVEY RESULTS 120 Graph 1: Economic sentiment indicator (s.a.) 110 100 90 80 70 long-term av erage (1990-2012) = 100 Euro Area (EA) European Union (EU) 60 1990 1991 1992
BUSINESS AND CONSUMER SURVEY RESULTS
 March 2018 BUSINESS AND CONSUMER SURVEY RESULTS 120 Graph 1: Economic sentiment indicator (s.a.) 110 100 90 80 70 long-term av erage (1990-2017) = 100 EA EU 60 1994 1996 1998 2000 2002 2004 2006 2008 2010
BUSINESS AND CONSUMER SURVEY RESULTS
 December 2018 BUSINESS AND CONSUMER SURVEY RESULTS **** Important notice: Starting with the next flash publication on 23 January 2019, the composition of the consumer confidence indicator will be revised.
SHEEP & GOAT - MARKET SITUATION - DASHBOARD Last update: 30/11/2016
 Trade 172 177 211 21 212 234 256 World Trade India (up to Aug) United States Uruguay (up to Aug) India (up to Aug) United States Uruguay (up to Aug) Australia New Zealand Australia New Zealand China +
BUSINESS AND CONSUMER SURVEY RESULTS. Euro Area (EA) February 2014: Economic Sentiment broadly unchanged in the euro area and the EU
 February 2014: Economic Sentiment broadly unchanged in the euro area and the EU") February 2014 BUSINESS AND CONSUMER SURVEY RESULTS 120 Graph 1: Economic sentiment indicator (s.a.) 110 100 90 80 Euro Area (EA) 70 60 long-term av erage (1990-2013) = 100 European Union (EU) 1990 1991
February 2014 BUSINESS AND CONSUMER SURVEY RESULTS 120 Graph 1: Economic sentiment indicator (s.a.) 110 100 90 80 Euro Area (EA) 70 60 long-term av erage (1990-2013) = 100 European Union (EU) 1990 1991
Consumer confidence indicator
 February 2016 BUSINESS AND CONSUMER SURVEY RESULTS 120 Graph 1: Economic sentiment indicator (s.a.) 110 100 90 80 70 long-term average (1990-2015) = 100 Euro Area (EA) European Union (EU) 60 1990 1992
EUROPEAN COMMISSION DIRECTORATE-GENERAL FOR ECONOMIC AND FINANCIAL AFFAIRS BUSINESS AND CONSUMER SURVEY RESULTS. August 2011
 EUROPEAN COMMISSION DIRECTORATE-GENERAL FOR ECONOMIC AND FINANCIAL AFFAIRS BUSINESS AND CONSUMER SURVEY RESULTS August 2011 Upcoming releases of Business and Consumer Survey results Flash CCI: 22 September,
BUSINESS AND CONSUMER SURVEY RESULTS. Euro Area (EA) European Union (EU)
 European Union (EU)") June 2015 BUSINESS AND CONSUMER SURVEY RESULTS 120 Graph 1: Economic sentiment indicator (s.a.) 110 100 90 80 70 60 long-term average (1990-2014) = 100 Euro Area (EA) European Union (EU) 1990 1991 1992
June 2015 BUSINESS AND CONSUMER SURVEY RESULTS 120 Graph 1: Economic sentiment indicator (s.a.) 110 100 90 80 70 60 long-term average (1990-2014) = 100 Euro Area (EA) European Union (EU) 1990 1991 1992
The European pigmeat sector. "Single CMO" Management Committee 17 September 2009
 The European pigmeat sector "Single CMO" Management Committee 17 September 2009 Price in Euro/100 kg 175 165 155 145 135 125 Development of the Community average market price for pig carcases 115 1 4 7
COMMISSION STAFF WORKING PAPER. Technical Annex. Accompanying the document REPORT FROM THE COMMISSION TO THE EUROPEAN PARLIAMENT AND THE COUNCIL
 EUROPEAN COMMISSION Brussels, 22.6.2011 SEC(2011) 759 final COMMISSION STAFF WORKING PAPER Technical Annex Accompanying the document REPORT FROM THE COMMISSION TO THE EUROPEAN PARLIAMENT AND THE COUNCIL
M O T O R V E H I C L E S T A T I S T l C S
 M O T O R V E H I C L E S T A T I S T l C S of Japan 2017 JAPAN AUTOMOBILE MANUFACTURERS ASSOCIATlON, INC. C O N T E N T S Motor Vehicles in Use Cars, Trucks, Buses and Special Purpose Vehicles, 1945-2016
MARKET NEWS for pig meat
 MARKET NEWS for pig meat Market analysis 4 July 2016 Week 27 MARKET SITUATION Europe: Trade in pork legs took place at slightly rising prices this week. Loins and collars as well as other cuts were traded
BUSINESS AND CONSUMER SURVEY RESULTS. September 2018: Economic Sentiment decreases in both the euro area and the EU
 September 2018 BUSINESS AND CONSUMER SURVEY RESULTS 120 Graph 1: Economic sentiment indicator (s.a.) 110 100 90 80 70 60 long-term av erage (1990-2017) = 100 1994 1996 1998 2000 2002 2004 2006 2008 2010
BUSINESS AND CONSUMER SURVEY RESULTS
 May 2018 BUSINESS AND CONSUMER SURVEY RESULTS 120 Graph 1: Economic sentiment indicator (s.a.) 110 100 90 80 70 60 long-term av erage (1990-2017) = 100 1994 1996 1998 2000 2002 2004 2006 2008 2010 2012
China s Rapeseed Meal Imports Rise as Seed Imports Decline
 United States Department of Agriculture Foreign Agricultural Service February 2017 China s Rapeseed Meal Rise as Seed Decline Trend in China Rapeseed 12-Month Moving Totals Trend In China Rapeseed Meal
Delivery Statistics. Second quarter 2015 EUROPEAN PULP AND PAPER INDUSTRY
 Second quarter EUROPEAN PULP AND PAPER INDUSTRY INTRODUCTION 2 nd Quarter, Paper and board deliveries by CEPI countries were 45.9 million tonnes in the first half of, a small tonnage decrease on the same
Citrus: World Markets and Trade
 United States Department of Agriculture Foreign Agricultural Service January 2017 Citrus: World Markets and Trade Oranges Global orange production for 2016/17 is forecast up 2.4 million metric tons from
COMMISSION DELEGATED REGULATION (EU) No /.. of
 No /.. of") EUROPEAN COMMISSION Brussels, 20.2.2015 C(2015) 861 final COMMISSION DELEGATED REGULATION (EU) No /.. of 20.2.2015 amending Regulation (EC) No 376/2008 as regards the obligation to present a licence for
EUROPEAN COMMISSION Brussels, 20.2.2015 C(2015) 861 final COMMISSION DELEGATED REGULATION (EU) No /.. of 20.2.2015 amending Regulation (EC) No 376/2008 as regards the obligation to present a licence for
BUSINESS AND CONSUMER SURVEY RESULTS
 February 2018 BUSINESS AND CONSUMER SURVEY RESULTS 120 Graph 1: Economic sentiment indicator (s.a.) 110 100 90 80 70 long-term av erage (1990-2017) = 100 EA EU 60 1994 1996 1998 2000 2002 2004 2006 2008
BUSINESS AND CONSUMER SURVEY RESULTS. Euro Area (EA) June 2014: Economic Sentiment decreasing in the euro area, while stable in the EU
 June 2014: Economic Sentiment decreasing in the euro area, while stable in the EU") June 2014 BUSINESS AND CONSUMER SURVEY RESULTS 120 Graph 1: Economic sentiment indicator (s.a.) 110 100 90 80 Euro Area (EA) 70 60 long-term av erage (1990-2013) = 100 European Union (EU) 1990 1991 1992
June 2014 BUSINESS AND CONSUMER SURVEY RESULTS 120 Graph 1: Economic sentiment indicator (s.a.) 110 100 90 80 Euro Area (EA) 70 60 long-term av erage (1990-2013) = 100 European Union (EU) 1990 1991 1992
Sharp Decline in Vegetable Oil Stocks Leads to Steeply Higher Prices
 United States Department of Agriculture Foreign Agricultural Service Circular Series FOP 1-11 Sharp Decline in Vegetable Oil Leads to Steeply Higher Prices Commodity prices have been on an upward trend
EU
 4.4.1.1 Area, yield and production of : rapeseed, sunflower seed and soya beans 23/11/2012 Area Yield Production 1 000 ha % TAV 100 kg/ha % TAV 1000 t % TAV 2008 2009 2010 2011 2011 2008 2009 2010 2011
China s Global Peanut Export Share Declines
 United States Department of Agriculture Foreign Agricultural Service Circular Series FOP 07-13 China s Global Peanut Export Share Declines U.S. 10% Others 19% Argentina 17% U.S. 11% Others 16% Argentina
Raw Tobacco Production statistics harvests
 EUROPEAN COMMISSION DIRECTORATE-GENERAL FOR AGRICULTURE AND RURAL DEVELOPMENT Directorate C. Single CMO, Economics and analysis of agricultural market C.2. Wine, spirits, horticultural products, specialised
RSWGM meeting European Commission DG MOVE 3-4 April 2017
 Podgorica RSWGM meeting European Commission DG MOVE 3-4 April 2017 Mobility and Transport 1 WHITE PAPER 2011: Towards a zero-vision on road safety POLICY ORIENTATIONS ON ROAD SAFETY 2011-2020 The -50%
RSB List of Documents and references
 Type of document: Reference Document Date: 20 March 2017 RSB List of Documents and references RSB reference code: [RSB-DOC-10-001] Published by the Roundtable on Sustainable Biomaterials. This publication
INDONESIA EXPORT AND IMPORT, APRIL 2017
 No. 48/05/Th.XX, May, 15 th INDONESIA EXPORT AND IMPORT, APRIL Table 1. FOB Value of Indonesian Exports (Million US $) and Percentage of Change ( %) % Share Jan Apr March Jan Apr y-on-y m-on-m Jan Apr
EU Oilseeds Trade 2016/17 Marketing Year July - June. AGRI G 4 Committee for the Common Organisation of Agricultural Markets 24 th August 2017
 EU Oilseeds Trade Marketing Year July - June AGRI G 4 Committee for the Common Organisation of Agricultural Markets 24 th August 217 EU MS ing soybeans UK IT 1% PT 216-17 14.m t. +7% 2 UK IT PT (211-21)
1. INTERNATIONAL OVERVIEW. 1.0 Area and population. population (1,000) area
 area") 1.0 Area and population area population (1,000) km 2 2000 2010 2018 1 inhabitants per km 2 Belgium 30,530 10,251 10,920 11,443 375 Germany 357,380 82,212 81,777 82,952 232 Estonia 45,230 1,397 1,331 1,315
1.0 Area and population area population (1,000) km 2 2000 2010 2018 1 inhabitants per km 2 Belgium 30,530 10,251 10,920 11,443 375 Germany 357,380 82,212 81,777 82,952 232 Estonia 45,230 1,397 1,331 1,315
Global Monthly March 2019
 Global Monthly March 19 Percent of world bonds outstanding 3 5 15 5 Jan-1 Jun-1 Nov-1 Apr-15 Sep-15 Feb-1 Jul-1 Dec-1 May-17 Oct-17 Mar-1 Aug-1 Dec-1 Mar-19 March 19 Percent, year-on-year 7 5 3 1 1Q1 1Q
COMMISSION DELEGATED REGULATION (EU) /... of XXX
 /... of XXX") EUROPEAN COMMISSION Brussels, XXX [ ](2018) XXX draft COMMISSION DELEGATED REGULATION (EU) /... of XXX amending and correcting Delegated Regulation (EU) 2017/655 supplementing Regulation (EU) 2016/1628
EUROPEAN COMMISSION Brussels, XXX [ ](2018) XXX draft COMMISSION DELEGATED REGULATION (EU) /... of XXX amending and correcting Delegated Regulation (EU) 2017/655 supplementing Regulation (EU) 2016/1628
BUSINESS AND CONSUMER SURVEY RESULTS. Euro Area (EA) European Union (EU) September 2015: Economic Sentiment improves in the euro area and the EU
 European Union (EU) September 2015: Economic Sentiment improves in the euro area and the EU") September 2015 BUSINESS AND CONSUMER SURVEY RESULTS 120 Graph 1: Economic sentiment indicator (s.a.) 110 100 90 80 70 60 long-term average (1990-2014) = 100 Euro Area (EA) European Union (EU) 1990 1991
September 2015 BUSINESS AND CONSUMER SURVEY RESULTS 120 Graph 1: Economic sentiment indicator (s.a.) 110 100 90 80 70 60 long-term average (1990-2014) = 100 Euro Area (EA) European Union (EU) 1990 1991
Global Monthly February 2018
 Global Monthly February 18 3 1-year Treasury yields 1-year breakeven inflation rate 1 1 15 16 17 18 February 18 5 3 Global GDP growth Composite PMI (RHS) Index 56 5 5 1 5 1 13 1 15 16 17 18 3..5. 1.5 1.
PIVE 1 PIVE 2 PIVE 3 PIVE 4 PIVE 5 PIVE 6 PIVE 7 PIVE
 Title of the measure: SPA51-PIVE Efficient-Vehicle Incentive Programme General description PIVE Programme was approved in Cabinet Meeting of 27 September 2012 with an initial budget allocation of 75 million,
EUROPEAN COMMISSION DIRECTORATE-GENERAL FOR ECONOMIC AND FINANCIAL AFFAIRS BUSINESS AND CONSUMER SURVEY RESULTS. April 2011
 EUROPEAN COMMISSION DIRECTORATE-GENERAL FOR ECONOMIC AND FINANCIAL AFFAIRS BUSINESS AND CONSUMER SURVEY RESULTS April 2011 From February 2011 onwards, business surveys are presented exclusively in accordance
BUSINESS AND CONSUMER SURVEY RESULTS. November 2013: Economic Sentiment improves in the euro area and the EU
 November 2013 BUSINESS AND CONSUMER SURVEY RESULTS 120 Graph 1: Economic sentiment indicator (s.a.) 110 100 90 80 Euro Area (EA) 70 60 long-term av erage (1990-2012) = 100 European Union (EU) 1990 1991
Committee for the Common Organisation of Agricultural Markets. 26 April 2018 POINT 3.1 A. Information on the EU white sugar prices
 Committee for the Common Organisation of Agricultural Markets 26 April 2018 POINT 3.1 A Information on the EU white sugar prices Until January 2018 Regulation 1234/2007, Artide 9 OJ L 299 16,11,2007 р1
OECD unemployment rate stable at 5.4% in March 2018
 OECD unemployment rate stable at.4% in March 2018 The OECD unemployment rate remained stable at.4% in March 2018. Across the OECD area, 34 million people were unemployed, 1.4 million more than in April
RUBBER PRODUCTS STATISTICS September 2018 (Data up to July 2018)
") RUBBER PRODUCTS STATISTICS September 2018 (Data up to July 2018) Date: 20/09/2018 0 TABLE OF CONTENTS: Table 1: Profile of the Malaysian Rubber Products Manufacturing Industry... 2 Chart 1.1: Malaysian
RUBBER PRODUCTS STATISTICS September 2018 (Data up to July 2018) Date: 20/09/2018 0 TABLE OF CONTENTS: Table 1: Profile of the Malaysian Rubber Products Manufacturing Industry... 2 Chart 1.1: Malaysian
Traffic Safety Basic Facts 2010
 Motorways More than 23.000 people were killed in traffic accidents on motorways in 16 1 European Union countries between 1999 and 2008 2. This number corresponds to 7% of all traffic accident fatalities
Review Plastics and Rubber Machinery
 Review Plastics and Rubber Machinery Linz, 14./15th June 2018 VDMA Annual Review, Plastics and Rubber Machinery 2017 Review 2015 2016 2017» New Orders: 10 6 18 (Change in %) Domestic Market: -5 7 14 Export
Inventory Levels - All Prices. Inventory Levels - By Price Range
 Inventory Levels - All Prices Idaho Falls Bonneville Total 7-Apr-17 154 111 265 6-Apr-18 113 91 204-23% Inventory Levels - By Price Range 7-Apr-17 6-Apr-18 0-100,000 36 10 100,001-125,000 13 9 125,001-150,000
December. Next release: 13 February Oct/Sep Nov/Oct Dec/Nov Janu19 January Febru13 February 2018 Oct/Sep Nov/Oct Dec/Nov 2017
 Oct/Sep Nov/Oct Dec/Nov 2017 19 Janu19 January 2018 13 Febru13 February 2018 Oct/Sep Nov/Oct Dec/Nov 2017 Next release: 13 February 2018 DecembDecember December TABLE OF CONTENTS Page Charts 1 Latest IEA
Lingering Effects of Truckers Strike Impact Planting Plans
 THIS REPORT CONTAINS ASSESSMENTS OF COMMODITY AND TRADE ISSUES MADE BY USDA STAFF AND NOT NECESSARILY STATEMENTS OF OFFICIAL U.S. GOVERNMENT POLICY Required Report - public distribution Brazil Post: Brasilia
EUR/100 kg MAR FEB JAN * : provisional figures. Jan 14 MAR JAN FEB EUR/100 kg
 EU Trade EU Productions Sources : EUROSTAT, Reg. (EU) 479/2010, Clal.it, USDA, Lto.nl, Nasdaq, European Central Bank, Dairyaustralia, Dcanz, Global Trade Atlas, 01 02 1000 Tonnes 03 World Trade 04 05 06
EUR/100 kg MAR FEB JAN * : provisional figures. Jan 15. Jan 16 JAN MAR FEB EUR/100 kg
 GDT Auction EU Trade World Trade EU Productions World Productions 1000 Tonnes USD/Feed/Energy EUR/100 kg JAN FEB MAR APR MAY JUN JUL AUG SEP OCT NOV DEC 03 04 05 06 07 08 09 10 11 12 13 14 15 16 01 02
EUR/100 kg FEB JAN MAR 29,7 26,1 25. * : provisional figures. Jan 13 JAN MAR FEB 36,0 21,7. EUR/100 kg
 GDT Auction EU Trade World Trade EU Productions World Productions 1000 Tonnes USD/Feed/Energy EUR/100 kg JAN FEB MAR APR MAY JUN JUL AUG SEP OCT NOV DEC 03 04 05 06 07 08 09 10 11 12 13 14 15 16 01 02
RSB ROUNDTABLE ON SUSTAINABLE BIOMATERIALS RSB List of Documents and references. 18 January RSB reference code: RSB-DOC
 RSB ROUNDTABLE ON SUSTAINABLE BIOMATERIALS RSB List of Documents and references 18 January 2019 RSB reference code: RSB-DOC-10-001 Published by the Roundtable on Sustainable Biomaterials. This publication
Argentine Exporters Switch to Soybean Oil as Biodiesel Exports Fall
 United States Department of Agriculture Foreign Agricultural Service Circular Series FOP 08-13 Argentine Exporters Switch to Soybean Oil as Biodiesel Exports Fall Argentina s soybean oil exports have surged
Citrus: World Markets and Trade
 United States Department of Agriculture Foreign Agricultural Service y 2018 Citrus: World Markets and Trade Oranges Global orange production for is forecast to tumble 6.0 million metric tons (tons) from
BUSINESS AND CONSUMER SURVEY RESULTS. Euro Area (EA) European Union (EU)
 European Union (EU)") September 2016 BUSINESS AND CONSUMER SURVEY RESULTS 120 Graph 1: Economic sentiment indicator (s.a.) 110 100 90 80 70 long-term average (1990-2015) = 100 Euro Area (EA) European Union (EU) 60 1990 1992
September 2016 BUSINESS AND CONSUMER SURVEY RESULTS 120 Graph 1: Economic sentiment indicator (s.a.) 110 100 90 80 70 long-term average (1990-2015) = 100 Euro Area (EA) European Union (EU) 60 1990 1992
Whereas pursuant to Article 4b of Regulation (EEC) No 3164/76, as inserted by Regulation (EEC) No 1841/88, the Council must adopt the measures
 No 3164/76, as inserted by Regulation (EEC) No 1841/88, the Council must adopt the measures") Council Regulation (EEC) No 881/92 of 26 March 1992 on access to the market in the carriage of goods by road within the Community to or from the territory of a Member State or passing across the territory
Council Regulation (EEC) No 881/92 of 26 March 1992 on access to the market in the carriage of goods by road within the Community to or from the territory of a Member State or passing across the territory
BUSINESS AND CONSUMER SURVEY RESULTS. February 2019: Economic Sentiment broadly stable in the euro area, down in the EU
 February 2019 BUSINESS AND CONSUMER SURVEY RESULTS 120 Graph 1: Economic sentiment indicator (s.a.) 110 100 90 80 EA EU 70 long-term av erage (1990-2018) = 100 60 1995 1997 1999 2001 2003 2005 2007 2009
I. World trade in Overview
 I. World trade in - Overview Table I.1 Growth in the volume of world merchandise exports and production, 2-5 (Annual percentage change) 2-5 23 24 World merchandise exports 4.5 5. 9.5 6. Agricultural products
Renewable Energies (Bio-Energies)
") 1 Renewable Energies (Bio-Energies) EAF / ELO Autumn 2004 meeting Brussels, 10 November 2004 2-1992 - First CAP action of the European Union in favour of biomass production for energy - Mac Sharry Reform.
1 Renewable Energies (Bio-Energies) EAF / ELO Autumn 2004 meeting Brussels, 10 November 2004 2-1992 - First CAP action of the European Union in favour of biomass production for energy - Mac Sharry Reform.
Introduction of the Digital Tachograph
 European Commission Directorate-General for Energy and Transport Introduction of the Digital Tachograph Background and latest developments By Leo Huberts (EC-DG TREN) Historical overview 1992: Commission
NZPork Monthly Import Report
 NZPork Monthly Import Report IW Barugh and EJ Neumann December 10, 2017 1 Data summary for October 2017 Data from January 2000 through October 2017 was downloaded from the Statistics NZ website (http://www.stats.govt.
Soybean Trade Growth: A Story of Brazil, the United States, and China
 United States Department of Agriculture Foreign Agricultural Service October 2017 Soybean Trade Growth: A Story of Brazil, the United States, and China 12-Month Soybean Export Growth Year Ending September