D G A G R I D A S H B O A R D : T O M A T O E S Last update: EU AVG PRICES
|
|
|
- Oswald Dixon
- 5 years ago
- Views:
Transcription
 160 144 139 140 128 126 118 120 116 114 5 year avg 106 110 107 102 100 100 97 92 94 89 93 88 88 93 86 83")
 /100 kg FRANCE - Tomato prices, weighted avg ( /100kg ) 130 253 122 2018 EU prices 2017 EU prices 250 120 Monthly 5 year Max Monthly 5 year Min 2018 EU prices")

 186 194 185 Monthly 5 year Max Monthly 5 year Min 178 174 200 191 5 year average 161 2018 EU prices 2017 EU prices 1 180 155 154 161 Monthly 5")

1 tonnes Weightedaverages by volume of production per MS Ongoing adjustments on weights by variety group 000 tonnes D G A G R I D A S H B O A R D : T O M A T O E S Last update: EU AVG PRICES MS PRICES /100 kg EUROPEAN UNION - Tomato prices, weighted avg ( /100 kg ) year avg EU prices EU prices Monthly 5 year Max 58 Monthly 5 year Min year average 40 Jan Feb Mar Apr May Jun Jul Aug Sep Oct Nov Dec /100 kg SPAIN - Tomato prices, weighted avg ( /100kg ) /100 kg FRANCE - Tomato prices, weighted avg ( /100kg ) EU prices 2017 EU prices Monthly 5 year Max Monthly 5 year Min 2018 EU prices 2017 EU prices year average Monthly 5 year Max Monthly 5 year Min year average year avg year avg Jan Feb Mar Apr May Jun Jul Aug Sep Oct Nov Dec /100 kg ITALY - Tomato prices, weighted avg ( /100kg ) Jan Feb Mar Apr May Jun Jul Aug Sep Oct Nov Dec /100 kg 2018 EU prices 2017 EU prices Netherlands - Tomato prices, weighted avg ( /100kg ) Monthly 5 year Max Monthly 5 year Min year average EU prices 2017 EU prices Monthly 5 year Max Monthly 5 year Min 5 year avg year average year avg Jan Feb Mar Apr May Jun Jul Aug Sep Oct Nov Dec Jan Feb Mar Apr May Jun Jul Aug Sep Oct Nov Dec Total tomato production (fresh+processing) by Member State (000 tonnes) Tomato production in the EU: fresh and for processing Production of tomatoes for the fresh market (000 tonnes) Tomatoes for processing Fresh tomatoes SPAIN ITALY GREECE NETHERLANDS FRANCE ITALY SPAIN GREECE FRANCE PORTUGAL ROMANIA (estimation) Extra-EU trade of fresh tomatoes Extra-EU imports Extra-EU exports Export ban Tomatoes Key market balance indicators for the follow up of the fresh tomato market (tonnes) TOP WORLD IMPORTERS FROM ALL ORIGINS Mois Extra-EU Imports Extra-EU exports EU commercialisation** EUR consumption estimates * Total (*) Provisional figures being updated with input from the MSs and the tomato sector. (**) Base: production Market access (imports/consumption %) 3,1 2,7 2,8 Exports/production % 1,9 1,1 0,9 Apparent consumption, kg per capita 31,4 35,2 37,2 Sources: Eurostat, MSs notifications, DG Agri, DG Taxud, Eurostat, Comext, Comtrade, ITC, Expert groups...

2 SUMMARY OVERVIEW, MARKET UPDATE RECENT DEVELOPMENTS 1. EU average tomato prices in March were 19% below the reference period average (5 preceding years). That indicator is very different among Member States: 27% above average in IT, 23% below average in ES, 6% under average in the NL and 5% below average in FR. 2. There is, therefore, a dual situation at MS level: price levels are very low in ES and IT and moderately under average in FR and NL. Southern MS face increasing competition from early productions in Central Europe thanks to technological advance. Imports from Morocco in the 1st quater of 2018 were at relatively high levels when compared to the reference period. 3. When looking backwards, EU average tomato prices were at about the maximum level of the reference period in November 2017; between December 2017 and January/February 2018 prices registered gradual reductions until stabilizing in February and March at around the minimum level price of the reference period. Provisional April prices show additional price reductions in ES and IT. 4. In January 2018 the volume of exports from Morocco to the EU was significantly higher than the average of the reference period. Background 2
3 BACKGROUND 1. EU average prices have been at historically high levels during most of the year 2017 (with a relative low figure in May). 2. As an exception to the generally good market situation in 2017, the month of May was a difficult month (the period between May to Aug in the case of NL) due to the importance of exports during that month before the loss of the Russian market. 3. A specific feature of the tomato market is that the level of prices can change very quickly in a matter of 2 or 3 months from very high to very low or vice-versa. 3
4 Market summary /100 kg 160 EUROPEAN UNION - Tomato prices, weighted avg ( /100 kg ) 144 Weighted averages by volume of production per MS Ongoing adjustments on weights by variety group EU prices 2017 EU prices Monthly 5 year Max Monthly 5 year Min 5 year average year avg Jan Feb Mar Apr May Jun Jul Aug Sep Oct Nov Dec Further detail 4

5 Market summary Tomatoes prices /100kg and % changes Mar EU CURRENT PRICES COMPARED TO 5 YEAR AVERAGE Mar. 2018, Price, /100 kg 86 Mar. 2018, comparison to 5 year avg, base = CURRENT PRICES COMPARED TO ONE MONTH AGO 5 year avg price '13-'17, changes from Feb. to Mar. % +10 % 2018, changes from Feb. to Mar. % -2 % ES-Spain % +3 % FR-France * * No data in Feb % - % IT-Italy % -35 % NL-Netherlands % -15 % 5

6 3 year avg 6

7 /100 kg SPAIN - Tomato prices, weighted avg ( /100kg ) 2018 EU prices 2017 EU prices Monthly 5 year Max Monthly 5 year Min year average year avg Jan Feb Mar Apr May Jun Jul Aug Sep Oct Nov Dec 7
8 /100 kg ITALY - Tomato prices, weighted avg ( /100kg ) 2018 EU prices 2017 EU prices Monthly 5 year Max Monthly 5 year Min 5 year average year avg Jan Feb Mar Apr May Jun Jul Aug Sep Oct Nov Dec
9 /100 kg FRANCE - Tomato prices, weighted avg ( /100kg ) EU prices 2017 EU prices Monthly 5 year Max 5 year average year avg Jan Feb Mar Apr May Jun Jul Aug Sep Oct Nov Dec 9 73 Monthly 5 year Min
10 /100 kg Netherlands - Tomato prices, weighted avg ( /100kg ) 2018 EU prices 2017 EU prices Monthly 5 year Max Monthly 5 year Min 5 year average year avg Jan Feb Mar Apr May Jun Jul Aug Sep Oct Nov Dec 10
11 8 000 Total tomato production (fresh+processing) by Member State (000 tonnes) ITALY GREECE FRANCE SPAIN PORTUGAL ROMANIA
12 000 tonnes Tomato production in the EU: fresh and for processing Tomatoes for processing Fresh tomatoes (estimation) 12
13 3 000 Production of tomatoes for the fresh market (000 tonnes) SPAIN ITALY GREECE NETHERLANDS FRANCE

14 Further detail 14

15 15


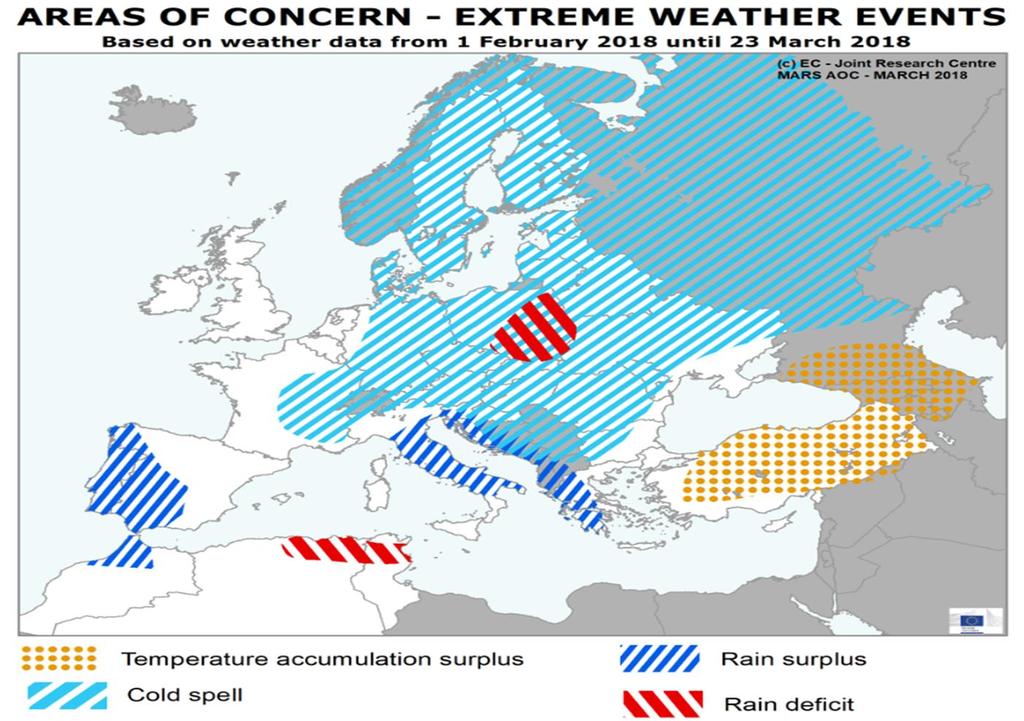
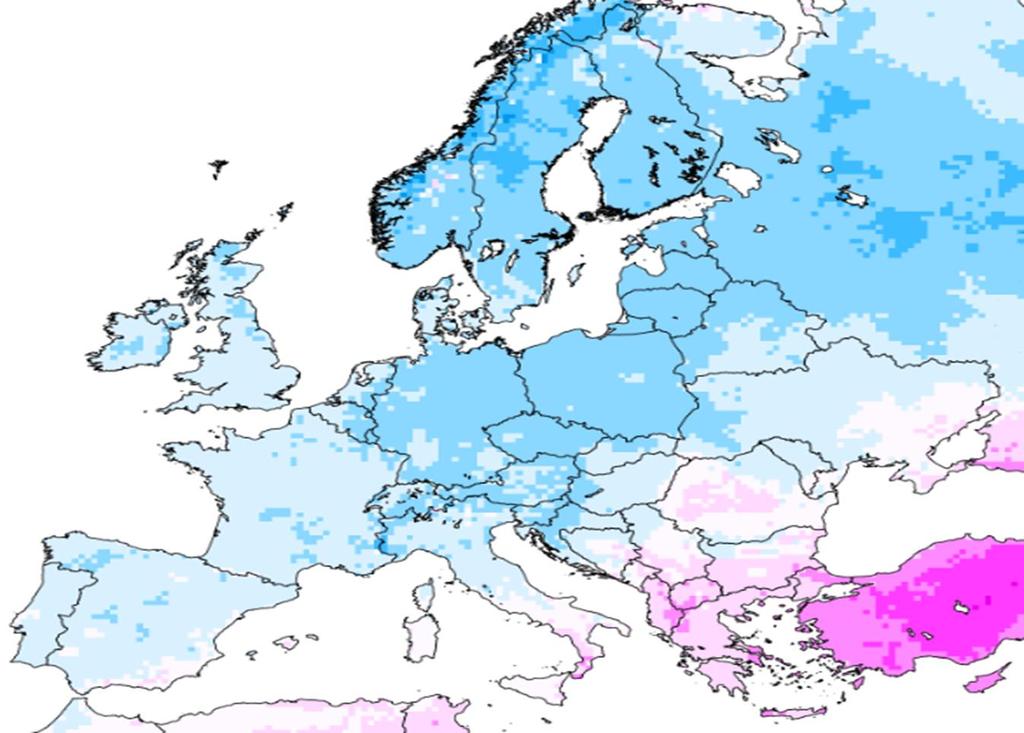
16 EXTREME WEATHER EVENTS IN EUROPE 30 DAY PRECIPITATION ANALYSIS OF ANOMALIES 18 Mar to 17 April 2018 (30 days) - % of normal 16
17 tonnes Extra-EU trade of fresh tomatoes Extra-EU imports Extra-EU exports Export ban
18 18

19 SUMMARY OF TOMATO ExtraEU EXPORTS Campaign 2017/18 (TAXUD data) 19
20 Tomatoes Key market balance indicators for the follow up of the fresh tomato market (tonnes) Mois Extra-EU Imports Extra-EU exports EU commercialisation** EUR consumption estimates * Total (*) Provisional figures being updated with input from the MSs and the tomato sector. (**) Base: production Market access (imports/consumption %) 3,1 2,7 2,8 Exports/production % 1,9 1,1 0,9 Apparent consumption, kg per capita 31,4 35,2 37,2 20

21 TOP WORLD TOMATO IMPORTERS FROM ALL ORIGINS Further detail 21
22 TOP WORLD TOMATO IMPORTERS FROM ALL ORIGINS and % growth in value Further detail 22

23 TOP WORLD TOMATO IMPORTERS FROM ALL ORIGINS and % growth in value Further detail 23

24 TOP WORLD TOMATO IMPORTERS FROM ALL ORIGINS 24

25 End 25
D G A G R I D A S H B O A R D : A P P L E S
 75 79 60 56 49 74 65 59 54 42 76 63 58 53 78 55 42 43 79 44 81 63 47 83 64 59 53 48 Sources: Eurostat, MSs notifications, DG Agri, Comext, Comtrade, GTA, ITC, AMI, Expert groups, Freshfel, Wapa. 89 68
D G A G R I D A S H B O A R D : A P P L E S
 Sources: Eurostat, MSs notifications, DG Agri, Comext, Comtrade, GTA, ITC, AMI, Expert groups, Freshfel, Wapa. 000 tonnes 39 41 31 22 29 22 32 27 17 18 9 27 15 12 6 6 6 4 5 6 5 4 11 25 15 9 9 93 62 51
COMPARISON OF FIXED & VARIABLE RATES (25 YEARS) CHARTERED BANK ADMINISTERED INTEREST RATES - PRIME BUSINESS*
 CHARTERED BANK ADMINISTERED INTEREST RATES - PRIME BUSINESS*") COMPARISON OF FIXED & VARIABLE RATES (25 YEARS) 2 Fixed Rates Variable Rates For Internal Use Only. FIXED RATES OF THE PAST 25 YEARS AVERAGE RESIDENTIAL MORTGAGE LENDING RATE - 5 YEAR* (Per cent) Year
COMPARISON OF FIXED & VARIABLE RATES (25 YEARS) 2 Fixed Rates Variable Rates For Internal Use Only. FIXED RATES OF THE PAST 25 YEARS AVERAGE RESIDENTIAL MORTGAGE LENDING RATE - 5 YEAR* (Per cent) Year
COMPARISON OF FIXED & VARIABLE RATES (25 YEARS) CHARTERED BANK ADMINISTERED INTEREST RATES - PRIME BUSINESS*
 CHARTERED BANK ADMINISTERED INTEREST RATES - PRIME BUSINESS*") COMPARISON OF FIXED & VARIABLE RATES (25 YEARS) 2 Fixed Rates Variable Rates FIXED RATES OF THE PAST 25 YEARS AVERAGE RESIDENTIAL MORTGAGE LENDING RATE - 5 YEAR* (Per cent) Year Jan Feb Mar Apr May Jun
COMPARISON OF FIXED & VARIABLE RATES (25 YEARS) 2 Fixed Rates Variable Rates FIXED RATES OF THE PAST 25 YEARS AVERAGE RESIDENTIAL MORTGAGE LENDING RATE - 5 YEAR* (Per cent) Year Jan Feb Mar Apr May Jun
Commercial-in-Confidence Ashton Old Baths Financial Model - Detailed Cashflow
 Year 0 1 2 3 4 5 6 7 8 9 10 11 12 13 Oct-16 Nov-16 Dec-16 Jan-17 Feb-17 Mar-17 Apr-17 May-17 Jun-17 Jul-17 Aug-17 Sep-17 Oct-17 2,038 2,922 4,089 4,349 6,256 7,124 8,885 8,885 8,885 8,885 8,885 8,885 9,107
Market situation in the Olive oil and Table olives sectors
 Market situation in the Olive oil and Table olives sectors Committee for the Common Organisation of the Agricultural Markets Arable crops and olive oil 30 May 2017 Lucie Zolichová, AGRI G.4 lucie.zolichova@ec.europa.eu
Committee for the Common Organisation of the Agricultural Market Market Situation for Sheep & Goat Meats 22 March 2018
 Committee for the Common Organisation of the Agricultural Market Market Situation for Sheep & Goat Meats 22 March 218 Production In ' tonnes carcase weight P R O D U C T I O N 297.4 114.8 8.9 67.1 51.3
Committee for the Common Organisation of the Agricultural Market Market Situation for Sheep & Goat Meats 21 Septembre 2017
 Committee for the Common Organisation of the Agricultural Market Market Situation for Sheep & Goat Meats 21 Septembre 217 Production P R O D U C T I O N In ' tonnes carcase weight 14.1 58.4 43.8 3.6 29.2
EU Market Situation for Poultry. Civil Dialogue Group. 25 October 2016
 EU Market Situation for Poultry Civil Dialogue Group 25 October 216 Thousand Tons F O R E C A S T 16 14 Experts EU production forecast on Poultry and Rabbit (Missing data (BE-EL-AT-RO-LT-SE) - No expert
March 2013 Euro area unemployment rate at 12.1% EU27 at 10.9%
 STAT/13/70 30 April 2013 March 2013 Euro area unemployment rate at 12.1% at 10.9% The euro area 1 (EA17) seasonally-adjusted 2 unemployment rate 3 was 12.1% in March 2013, up from 12.0% in February 4.
Market situation in the Olive oil and Table olives sectors
 Market situation in the Olive oil and Table olives sectors Committee for the Common Organisation of the Agricultural Markets Arable crops and olive oil 26 January 2017 Lucie Zolichová, AGRI G.4 lucie.zolichova@ec.europa.eu
EXECUTIVE SUMMARY ATLANTIC SALMON NO 03/06
 MARKET This table shows development in supply/consumption of Atlantic salmon in the main markets per month, in tonnes r.w The table contains preliminary figures and may diverge from same figures in the
NJ Solar Market Update
 NJ Solar Market Update April 16, 20 Renewable Energy Committee Meeting Trenton, NJ Prepared by Charlie Garrison Solar Installed Capacity Data The preliminary installed solar capacity as of 3/31/ is approximately
September 2003 Industrial producer prices stable in euro-zone and EU15
 STAT/03/123 31 October 2003 September 2003 Industrial producer prices stable in euro-zone and EU15 The euro-zone 1 industrial producer price index 2 remained unchanged in September 2003 compared with the
XXII Jornadas del Arroz Zaragoza (Spain) 9 th March 2016 EU RICE MARKET. Damien PLAN European Commission DG AGRI
 9 th March 2016 EU RICE MARKET. Damien PLAN European Commission DG AGRI") XXII Jornadas del Arroz Zaragoza (Spain) 9 th March 2016 EU RICE MARKET Damien PLAN European Commission DG AGRI Contents 1. EU Rice - Overview 2. EU Rice Trade Imports/Exports 3. EU Rice Market 2015/16
XXII Jornadas del Arroz Zaragoza (Spain) 9 th March 2016 EU RICE MARKET Damien PLAN European Commission DG AGRI Contents 1. EU Rice - Overview 2. EU Rice Trade Imports/Exports 3. EU Rice Market 2015/16
Global Overview of Middle Distillates Supply and Demand ICE Market Forum Rotterdam, November 2012
 Global Overview of Middle Distillates Supply and Demand ICE Market Forum Rotterdam, November 2012 About Petromatrix Based in Switzerland (city of Zug) Publishes a daily newsletter on oil markets Mix of
EUR/100 kg MAR FEB JAN * : provisional figures. Jan 14 MAR JAN FEB EUR/100 kg
 EU Trade EU Productions Sources : EUROSTAT, Reg. (EU) 479/2010, Clal.it, USDA, Lto.nl, Nasdaq, European Central Bank, Dairyaustralia, Dcanz, Global Trade Atlas, 01 02 1000 Tonnes 03 World Trade 04 05 06
EUR/100 kg MAR FEB JAN * : provisional figures. Jan 15. Jan 16 JAN MAR FEB EUR/100 kg
 GDT Auction EU Trade World Trade EU Productions World Productions 1000 Tonnes USD/Feed/Energy EUR/100 kg JAN FEB MAR APR MAY JUN JUL AUG SEP OCT NOV DEC 03 04 05 06 07 08 09 10 11 12 13 14 15 16 01 02
EUR/100 kg FEB JAN MAR 29,7 26,1 25. * : provisional figures. Jan 13 JAN MAR FEB 36,0 21,7. EUR/100 kg
 GDT Auction EU Trade World Trade EU Productions World Productions 1000 Tonnes USD/Feed/Energy EUR/100 kg JAN FEB MAR APR MAY JUN JUL AUG SEP OCT NOV DEC 03 04 05 06 07 08 09 10 11 12 13 14 15 16 01 02
Total Production by Month (Acre Feet)
") Production by Month (acre-feet) 2008 2009 2010 2011 2012 2013 2014 2015 2016 January 25 339.10 228.90 249.50 297.99 243.06 327.14 247.66 212.37 February 234.00 218.80 212.10 241.52 245.82 279.08 234.16
Production by Month (acre-feet) 2008 2009 2010 2011 2012 2013 2014 2015 2016 January 25 339.10 228.90 249.50 297.99 243.06 327.14 247.66 212.37 February 234.00 218.80 212.10 241.52 245.82 279.08 234.16
November 2018 Customer Switching Report for the Electricity and Gas Retail Markets
 An Coimisiún um Rialáil Fóntas Commission for Regulation of Utilities November 2018 Customer Switching Report for the Electricity and Gas Retail Markets Information Paper Reference: CRU18266 Date Published:
Up and Down Months of the Stock Market
 Up and Down Months of the Stock Market 1926-2017 Positive years (66) in the stock market were not good all year long and losing years (24) were not losers throughout the year. Winning years produce losing
December. Next release: 13 February Oct/Sep Nov/Oct Dec/Nov Janu19 January Febru13 February 2018 Oct/Sep Nov/Oct Dec/Nov 2017
 Oct/Sep Nov/Oct Dec/Nov 2017 19 Janu19 January 2018 13 Febru13 February 2018 Oct/Sep Nov/Oct Dec/Nov 2017 Next release: 13 February 2018 DecembDecember December TABLE OF CONTENTS Page Charts 1 Latest IEA
increase of over four per cent compared to the average of $409,058 reported in January 2010.
 SINGLE FAMILY RESIDENTIAL BREAKDOWN uary 211 26.8 % 1.7 % 7.%.4%.1 % Good Start to 211 TORONTO - February 4, 211 Greater Toronto REALTORS reported 4,337 transactions through the TorontoMLS system in uary
Market situation Sugar Market Observatory 12 April 2018
 Market situation Sugar Market Observatory 12 April 2018 Arable crops, Sugar team DG Agriculture and Rural Development European Commission Sugar Prices Sugar Market Observatory 12 April 2018 2007 2008 2009
ANCR CRU Statistics February 2007 to December 2007
 ANCR CRU Statistics February 2007 to December 2007 o Jan/07 Feb/07* Mar/07 Apr/07 May/07 Jun/07 Jul/07 Aug/07 Sep/07 Oct/07 Nov/07 Dec/07 Total notes data from Perimeter phone system unavailable prior
February 2014 Euro area unemployment rate at 11.9% EU28 at 10.6%
 STAT/14/52 1 April 2014 February 2014 Euro area unemployment rate at 11.9% EU28 at 10.6% The euro area 1 (EA18) seasonally-adjusted 2 unemployment rate 3 was 11.9% in February 2014, stable since October
3. Atmospheric Supply of Nitrogen to the Baltic Sea in 2009
 3. Atmospheric Supply of Nitrogen to the Baltic Sea in 2009 Nitrogen emission data, as well as the model results presented here have been approved by the 35 th Session of the Steering Body of EMEP in Geneva
December 2011 compared with November 2011 Industrial producer prices down by 0.2% in both euro area and EU27
 18/2012-2 February 2012 December 2011 compared with November 2011 Industrial producer prices down by 0.2% in both euro area and EU27 In December 2011, compared with November 2011, the industrial producer
EU Market Situation for Eggs. Committee for the Common Organisation of the Agricultural Markets 23 June 2016
 EU Market Situation for Eggs Committee for the Common Organisation of the Agricultural Markets 23 June 216 FARM STRUCTURE SURVEY Number of Laying Hens 215 by way of keeping based on the EU Member States
EUR/100 kg JAN FEB APR * : provisional figures. Jan 18 JAN APR FEB MAR
 GDT Auction EU Trade World Trade EU Productions World Productions 1 Tonnes 21 22 23 24 25 26 27 28 29 21 211 212 213 214 215 216 217 218 USD/Feed/Energy EUR/1 kg JAN FEB MAR APR MAY JUN JUL AUG SEP OCT
GAZIFÈRE INC. Prime Rate Forecasting Process 2017 Rate Case
 Overview A consensus forecast is used to estimate the prime rate charged by commercial banks. As the prime rate is subject to competitive pressures faced by individual lenders and is set on an individual
November 2017 Customer Switching Report for the Electricity and Gas Retail Markets
 An Coimisiún um Rialáil Fóntas Commission for Regulation of Utilities November 2017 Customer Switching Report for the Electricity and Gas Retail Markets Information Paper Reference: CRU18011 Date Published:
Global Threat Reduction Initiative Foreign Research Reactor Spent Nuclear Fuel Shipments
 FY1996 1. Sept. 22, 1996 280 assemblies in 8 casks to SRS [First East Coast Shipment] FY 1997 Sweden 64 Switzerland 42 Germany 125 Chile 28 Columbia 21 2. Dec. 15, 1996 41 spent fuel assemblies in one
November. Next release: 19 January Sep/AugOct/Sep Nov/Oct Dec 14 December Janu 19 January 2018 Sep/AugOct/Sep Nov/Oct 2017
 Sep/AugOct/Sep Nov/Oct 2017 14 Dec 14 December 2017 19 Janu 19 January 2018 Sep/AugOct/Sep Nov/Oct 2017 Next release: 19 January 2018 NovembNovember November Monthly Oil Price Statistics TABLE OF CONTENTS
Beef Markets Outlook. January Mark Zieg. Growing the success of Irish food & horticulture. Growing the success of Irish food & horticulture
 Beef Markets Outlook January 213 Mark Zieg AIDAN COTTER CHIEF EXECUTIVE BORD BIA 28 JANUARY 29 Irish Beef Markets Exports 444, Export Volumes by Destination (212) UK 231, Spain 11, France 46, Holland 36,
Global Monthly March 2019
 Global Monthly March 19 Percent of world bonds outstanding 3 5 15 5 Jan-1 Jun-1 Nov-1 Apr-15 Sep-15 Feb-1 Jul-1 Dec-1 May-17 Oct-17 Mar-1 Aug-1 Dec-1 Mar-19 March 19 Percent, year-on-year 7 5 3 1 1Q1 1Q
Steers Heifers Young Bulls Cows
 Deadweight Prices /100Kg (Including VAT) Steers Heifers Young Bulls Cows U3 U4 R3 R4 O3 O4 P+ 435.7 432.4 423.2 422.8 402.9 404.2 384.7 451.8 447.8 435.2 433.5 413.7 417.0 382.2 423.5 422.0 413.4 415.3
January-March 2017 Customer Switching Report for the Electricity and Gas Retail Markets
 January- Customer Switching Report for the Electricity and Gas Retail Markets DOCUMENT TYPE: REFERENCE: Information Note CER/17102 DATE PUBLISHED: QUERIES TO: 28th April 2017 gkelly@cer.ie The Commission
MARKET NEWS for pig meat
 MARKET NEWS for pig meat Market analysis 4 July 2016 Week 27 MARKET SITUATION Europe: Trade in pork legs took place at slightly rising prices this week. Loins and collars as well as other cuts were traded
Price Category Breakdown - February 2010
 SINGLE FAMILY RESIDENTIAL BREAKDOWN ruary 21 ruary Sales and Average Price Increase Annually TORONTO - Wednesday, March 3, 21 7.3 % 24.6 % 1.8 % 7.3%.2%.1 % Greater Toronto REALTORS reported 7,291 sales
MARKET RATES UPDATE Paula Gold-Williams Cory Kuchinsky
 MARKET RATES UPDATE I N T R O D U C T I O N BY: Paula Gold-Williams President & Chief Executive Officer (CEO) P R E S E N T E D BY: Cory Kuchinsky Interim Vice President, Financial Services September 24,
New Passenger Car Registrations European Union
 PRESS EMBARGO : 8.00am (6.00am GMT), July 15, 2010 New Passenger Car Registrations European Union July 15, 2010 1,700,000 Units New Passenger Car Registrations in the EU Last 12 months Percentage +30.0
FOR IMMEDIATE RELEASE
 Article No. 7845 Available on www.roymorgan.com Roy Morgan Unemployment Profile Friday, 18 January 2019 Unemployment in December is 9.7% and under-employment is 8.8% FOR IMMEDIATE RELEASE Australian unemployment
September 2016 Water Production & Consumption Data
 September 2016 Water Production & Consumption Data September 2016 monthly water production (288.48 AF) was lowest in at least 17 years. Monthly water production has increased slightly each month since
Wheat Marketing Situation
 Wheat Marketing Situation Prepared by: Darrell L. Hanavan Executive Director Colorado Wheat Administrative Committee If you would like to receive an email when this report is updated, email gmostek@coloradowheat.org
STATISTICS BOTSWANA ELECTRICITY GENERATION & DISTRIBUTION 2016/2 STATS BRIEF, FIRST QUARTER Copyrights Statistics Botswana 2016
 2016/2 ELECTRICITY GENERATION & DISTRIBUTION STATS BRIEF, FIRST QUARTER 2016 Copyrights Statistics Botswana 2016 Statistics Botswana. Private Bag 0024 Botswana Tel: (267) 367 1300. Fax: (267) 395 2201.
NJ Solar Market Update As of 6/30/15
 NJ Solar Market Update As of 6/30/ Prepared by Charlie Garrison July 17, 20 SOLAR INSTALLED CAPACITY DATA The preliminary installed solar capacity as of 6/30/ is approximately 1,500.7 MW. Approximately
M onthly arket. Jan Table of Contents. Monthly Highlights
 Table of Contents Market Inventory...2 www.gaar.com Monthly Highlights January 2014 had a 12.29% increase in the number of homes sales when compared to same time last year. The average sale price of single-family
May 2014 Euro area unemployment rate at 11.6% EU28 at 10.3%
 STAT/14/103-1 July 2014 May 2014 Euro area unemployment rate at 11.6% EU28 at 10.3% The euro area 1 (EA18) seasonally-adjusted 2 unemployment rate 3 was 11.6% in May 2014, stable compared with April 2014
NEW HAMPSHIRE GAS CORPORATION WINTER PERIOD ORIGINAL FILING CONTENTS 3. CONVERSION OF GAS COSTS - GALLONS TO THERMS SCHEDULE A
 NEW HAMPSHIRE GAS CORPORATION COST OF GAS RATE FILING - DG 13- WINTER PERIOD 2013-2014 ORIGINAL FILING CONTENTS 1. TARIFF PAGE - COST OF GAS RATE 2. MARKED TARIFF PAGE - COST OF GAS RATE 3. CONVERSION
New Passenger Car Registrations European Union
 PRESS EMBARGO : 8.00am (7.00am GMT), March 18, 2014 New Passenger Car Registrations European Union March 18, 2014 Units 1,700,000 1,500,000 New Passenger Car Registrations in the EU Last 12 months 10.2%
End-use petroleum product prices and average crude oil import costs January 2010
 January 21 International Energy Agency L'Agence internationale de l'énergie 9, rue de la Fédération, 75739 PARIS CEDEX 15 FRANCE prices@iea.org 18 e-mail: prices@iea.org 14 Petroleum products (USD/unit)
Who are the. Metalforming? The leading trade association for the metalforming industry.
 Confederation of British Metalforming John Houseman Director General Who are the Confederation of British Metalforming? The leading trade association for the metalforming industry. National Metalforming
FOR IMMEDIATE RELEASE
 Article No. 7761 Available on www.roymorgan.com Roy Morgan Unemployment Profile Monday, 8 October 2018 Unemployment down to 9.4% in September off two-year high Australian employment has grown solidly over
FINISHED STEEL IMPORT MARKET SHARE AT 25% IN JANUARY
 News Release FOR IMMEDIATE RELEASE March 27, 2019 CONTACT Lisa Harrison 202.452.7115/lharrison@steel.org FINISHED STEEL IMPORT MARKET SHARE AT 25% IN JANUARY Washington, D.C. Based on preliminary Census
Rice market situation
 Rice market situation DG AGRI C.5 Management Committee for the Common Organisation of Agricultural Markets / Rice 24/10/2013 World market mio t 700 600 500 400 300 200 100 - World rice balance sheet Trade
Units of Instruction MISD Pacing Guide Days Date Range Test Date
 MISD Pacing Guide Date Range Test Date Introduction: Processes of Investigations (1 day) Aug. 21 Unit 01: Matter (12 days) Aug. 22-Sept. 7 Sep. 10 Unit 02: Atomic Structure and the Periodic Table (15 days)
End-use petroleum product prices and average crude oil import costs March 2011
 March 211 International Energy Agency L'Agence internationale de l'énergie 9, rue de la Fédération, 75739 PARIS CEDEX 15 FRANCE prices@iea.org 18 e-mail: prices@iea.org 14 Petroleum products (USD/unit)
University of Michigan Eco-Driving Index (EDI) Latest data: October 2017
 Latest data: October 2017") University of Michigan Eco-Driving Index () http://www.ecodrivingindex.org Latest data: October 2017 Developed and issued monthly by Michael Sivak and Brandon Schoettle Sustainable Worldwide Transportation
University of Michigan Eco-Driving Index () http://www.ecodrivingindex.org Latest data: October 2017 Developed and issued monthly by Michael Sivak and Brandon Schoettle Sustainable Worldwide Transportation
June 2014 Euro area unemployment rate at 11.5% EU28 at 10.2%
 STAT/14/121 31 July 2014 June 2014 Euro area unemployment rate at 11.5% EU28 at 10.2% The euro area 1 (EA18) seasonally-adjusted 2 unemployment rate 3 was 11.5% in June 2014, down from 11.6% in May 2014
Sheep Market Outlook. Mark Kozlowski, AHDB Beef & Lamb AHDB Outlook Conference 9 February 2016
 Sheep Market Outlook Mark Kozlowski, AHDB Beef & Lamb AHDB Outlook Conference 9 February 2016 Overview Current situation UK Current situation rest of the world UK outlook Wildcards Current situation in
Year to Date Summary. Average and Median Sale Prices
 A Publication of RMLS, The Source for Real Estate Statistics in Your Community Residential Review: Southwest Washington September 2018 Reporting Period September Residential Highlights Southwest Washington
Global Monthly February 2018
 Global Monthly February 18 3 1-year Treasury yields 1-year breakeven inflation rate 1 1 15 16 17 18 February 18 5 3 Global GDP growth Composite PMI (RHS) Index 56 5 5 1 5 1 13 1 15 16 17 18 3..5. 1.5 1.
Euro area unemployment rate at 10.5%
 3/2016-7 January 2016 November 2015 Euro area unemployment rate at 10.5% EU28 at 9.1% The euro area (EA19) seasonally-adjusted unemployment rate was 10.5% in November 2015, down from 10.6% in October 2015,
New Passenger Car Registrations European Union
 PRESS EMBARGO : 8.00am (6.00am GMT), April 17, 2014 New Passenger Car Registrations European Union April 17, 2014 Units 1,700,000 New Passenger Car Registrations in the EU Last 12 months 1,500,000 10.2%
Gas Insecurity: A Figment of the Imagination? Peter Davies. Chief Economist, BP EPRG. Cambridge. 19 May, 2006
 Gas Insecurity: A Figment of the Imagination? Peter Davies. Chief Economist, BP EPRG. Cambridge. 19 May, 2006 BP 2006 2 Gas Security What is it? Does the UK have it? What is going to change? What can we
NJ Solar Market Update As of 10/31/15
 NJ Solar Market Update As of 10/31/15 Prepared by Charlie Garrison Renewable Energy Committee Meeting November 10, 2015 SOLAR INSTALLED CAPACITY DATA The preliminary installed solar capacity as of 10/31/15
Average monthly prices of virgin olive oil in the most representative EU markets. ITALY - BARI SPAIN - JAÉN GREECE - CHANIA Reference threshold
 EU Prices Production EU Trade EU Stocks DG AGRI DASHBOARD: OLIVE OIL Last update: 12.1.217 /1kg /1kg Consumption /1kg EU Balance Sheet Average monthly prices of virgin olive oil in the most representative
New Passenger Car Registrations European Union
 PRESS EMBARGO : 8.00am (7.00am GMT), January 16, 2013 New Passenger Car Registrations European Union January 16, 2013 Units 1,700,000 1,500,000 New Passenger Car Registrations in the EU Last 12 months
EU Market Situation for Poultry. Committee for the Common Organisation of the Agricultural Markets 22 October 2015
 EU Market Situation for Poultry Committee for the Common Organisation of the Agricultural Markets 22 October 215 Euro Dollar exchange rate 1.6 22/9/215: 1 EUR = 1.12 USD 1.4 1.2 1. Exchange rate: Spot,
US Crude Oil Reshaping International Crude Oil Flows. Olivier Jakob,
 US Crude Oil Reshaping International Crude Oil Flows Olivier Jakob, ojakob@petromatrix.com www.petromatrix.com Claimer Petromatrix publishes since 2006 a daily market note on the oil markets Our reports
Operational Overview. Operational Forum, 24 th March 2010
 Operational Overview Operational Forum, 24 th March 21 Weather Weather February 21 The cold weather continued throughout February with all but one day being colder than the 17-year seasonal normal CWV.
Graph #1. Micro-Generation Generating Units in Alberta 20
 2, Graph #1. Micro-Generation Generating Units in Alberta 2 Cumulative # of Generating Units 1,9 1,8 1,7 1,6 1,5 1,4 1,3 1,2 1,1 1, 9 8 7 6 5 4 3 2 Number of MGG Units as of 216 Mar 31 Number of Solar
September 2011 compared with August 2011 Industrial producer prices up by 0.3% in euro area Up by 0.4% in EU27
 161/2011-4 November 2011 September 2011 compared with August 2011 Industrial producer prices up by 0.3% in euro area Up by 0.4% in EU27 In September 2011 compared with August 2011, the industrial producer
New Passenger Car Registrations European Union
 PRESS EMBARGO : 8.00am (7.00am GMT), November 19, 2013 New Passenger Car Registrations European Union November 19, 2013 Units 1,700,000 1,500,000 New Passenger Car Registrations in the EU Last 12 months
NZPork Monthly Import Report
 NZPork Monthly Import Report IW Barugh and EJ Neumann December 10, 2017 1 Data summary for October 2017 Data from January 2000 through October 2017 was downloaded from the Statistics NZ website (http://www.stats.govt.
OECD unemployment rate stable at 5.5% in January 2018
 OECD unemployment rate stable at.% in January 2018 The OECD unemployment rate was stable at.% in January 2018. Across the OECD area, 34. million people were unemployed, 1.9 million more than in April 2008.
2017 SC Producers Whole Farm Revenue Protection Expected Price Justification
 2017 SC Producers Whole Farm Revenue Protection Expected Price Justification RMA Projected Expected As of Average Futures Price Close As of RMA Projected Prices 4 Feb 2011 2015 % Differ 4 Feb Crop Contract
Security of Supply. on the European Electricity Market
 Security of Supply on the European Electricity Market What is Security of Supply? A reliable supply of energy Reliable transportation of supply Reliable distribution and delivery of supply to the final
Midwest Association of Rail Shippers
 January 13, 2016 Midwest Association of Rail Shippers Lance Fritz Chairman and CEO Union Pacific 1 2015 Economic Results Consumer-driven growth 1 Consumer Spending 2 Light Vehicle Sales 3.6% 3.0% 3.0%
EU Dairy Exports to Third countries
 Milk Market Observatory TRA.EU.Extr Latest update : 12.6.218 Source : Eurostat (COMEXT) EU Dairy Exports to Third countries (January-April) 16 14 12 1 8 6 4 2 BUTTER exports 1 Tonnes 162 135 137 12 94
Civil Dialogue Group on WINE Thursday April 19th, 2018
 COMMISSION EUROPÉENNE DIRECTION GÉNÉRALE DE L'AGRICULTURE ET DU DÉVELOPPEMENT RURAL Directorate G. Markets and Observatories G.2. Wine, spirits and horticultural products Bruxelles, le G.2/GD(2017) Civil
New Passenger Car Registrations European Union
 PRESS EMBARGO : 8.00am (7.00am GMT), February 18, 2014 New Passenger Car Registrations European Union February 18, 2014 Units 1,700,000 1,500,000 New Passenger Car Registrations in the EU Last 12 months
M O T O R V E H I C L E S T A T I S T l C S
 M O T O R V E H I C L E S T A T I S T l C S of Japan 2017 JAPAN AUTOMOBILE MANUFACTURERS ASSOCIATlON, INC. C O N T E N T S Motor Vehicles in Use Cars, Trucks, Buses and Special Purpose Vehicles, 1945-2016
FOR IMMEDIATE RELEASE
 Article No. 6928 Available on www.roymorgan.com Roy Morgan Unemployment Profile Wednesday, 17 August 2016 Australian real unemployment jumps to 10.5% (up 0.9%) in July during post-election uncertainty
STEEL IMPORTS UP 15% IN 2017 Finished Import Market Share Increased to 27%
 News Release FOR IMMEDIATE RELEASE January 26, 2018 CONTACT Lisa Harrison 202.452.7115/lharrison@steel.org STEEL IMPORTS UP 15% IN 2017 Finished Import Market Share Increased to 27% Washington, D.C. Based
New Passenger Car Registrations European Union
 PRESS EMBARGO : 8.00am (7.00am GMT), December 14, 2012 New Passenger Car Registrations European Union December 14, 2012 Units 1,700,000 New Passenger Car Registrations in the EU Last 12 months 7.0% 1,500,000
New Passenger Car Registrations European Union
 PRESS EMBARGO : 8.00am (6.00am GMT), May 16, 2014 New Passenger Car Registrations European Union May 16, 2014 Units 1,500,000 New Passenger Car Registrations in the EU Last 12 months +10.6% 1,400,000 1,300,000
SOUTHERN CALIFORNIA EGG PRODUCTION COSTS AND INCOME 1979 TO 2003
 SOUTHERN CALIFORNIA EGG PRODUCTION COSTS AND INCOME 1979 TO 2003 Prepared by Don Bell, Poultry Specialist (emeritus) University of California April 2, 2004 SOUTHERN CALIFORNIA EGG PRODUCTION COSTS/INCOME
TECHNICAL SERVICE BULLETIN
 TECHNICAL SERVICE BULLETIN To: Minuteman Dealers and Customers From: Minuteman Technical Support Date: 1/12/2011 Subject: TSB for the KIT # K-FRSPEEDSWT. For the FR17115, FR17220, FR20115 and FR20220 models.
ANCR CRU Statistics Februa.. to December 2007
 ANCR CRU Statistics Februa.. to December 2007 Jan/07 Feb/07* Mar/07 Apr/07 May/07 Jun/07 Jul/07 Aug/07 Sep/07 Oct/07 Nov/07 Dec/07 Total notes Answered dato from Perimeter phone system unavailable prior
1. Trends in the current fiscal year and previous fiscal year 3. Business overview 2. Secular trends in first quarter financial results
 FY2/19 (March 2018~May 2018) Fact Book 1. Trends in the current fiscal year and previous fiscal year 3. Business overview (1) Performance overview P. 1 (1) No. of students at the end of month P. 6 (2)
NJ Solar Market Update As of 2/29/16
 NJ Solar Market Update As of 2/29/16 Prepared by Charlie Garrison March 24, 2016 SOLAR INSTALLED CAPACITY DATA The installed solar capacity as of 2/29/16 is approximately 1,644.3 MW. Approximately 20.3
STEEL IMPORTS UP 17% IN JANUARY Finished Import Market Share at 26%
 News Release FOR IMMEDIATE RELEASE February 26, 2018 CONTACT Lisa Harrison 202.452.7115/lharrison@steel.org STEEL IMPORTS UP 17% IN JANUARY Finished Import Market Share at 26% Washington, D.C. Based on
New Passenger Car Registrations European Union
 PRESS EMBARGO : 8.00am (7.00am GMT), March 16, 2010 New Passenger Car Registrations European Union March 16, 2010 1,700,000 Units New Passenger Car Registrations in the EU Last 12 months +26.9 Percentage
/ PRELIMINARY STEEL IMPORTS INCREASE 15% IN APRIL Import Market Share 27% in April
 News Release FOR IMMEDIATE RELEASE May 23, 2014 CONTACT Lisa Harrison 202.452.7115/ lharrison@steel.org PRELIMINARY STEEL IMPORTS INCREASE 15% IN APRIL Import Market Share 27% in April Washington, D.C.
/ PRELIMINARY STEEL IMPORTS INCREASE 2% IN MAY Import Market Share 23% in May
 News Release FOR IMMEDIATE RELEASE June 25, 2013 CONTACT Lisa Harrison 202.452.7115/ lharrison@steel.org PRELIMINARY STEEL IMPORTS INCREASE 2% IN MAY Import Market Share 23% in May Washington, D.C. Based
FOR IMMEDIATE RELEASE
 Article No. 7353 Available on www.roymorgan.com Roy Morgan Unemployment Profile Wednesday, 11 October 2017 2.498 million Australians (18.9%) now unemployed or under-employed In September 1.202 million
FOR IMMEDIATE RELEASE
 Article No. 7433 Available on www.roymorgan.com Roy Morgan Unemployment Profile Friday, 12 January 2018 2.6m Australians unemployed or under-employed in December The latest data for the Roy Morgan employment