|
|
|
- Anissa Washington
- 5 years ago
- Views:
Transcription
1

2
3
4
5
6 ORISSA AGRICULTURE STATISTICS Introduction Agriculture in Orissa is multifaceted and of paramount importance with regard to its prevalence. It is also the mainstay of the State s economy and substance of life of the people. Orissa is predominantly an agrarian state with Agriculture and Animal Husbandry sector contributing 21.11% to the Net State Domestic Product (NSDP) in (Q) at prices and providing employment directly or indirectly to 70% of the total work force as per 2001 census. The share of Gross State Domestic Product (GSDP) from Agriculture & Animal Husbandry during (Q) at constant prices is 19.51%. Evidently, Agriculture plays a critical role in the economy and livelihood of majority of its populace. Orissa is located between N to N latitude and E to E longitude. It has a geographical area of lakh hectares and a population of 3.68 crores as per 2001 census. Area wise, Orissa occupies 9 th position in India. The total cultivated area of the state is lakh hectares, of which lakh ha is High land, lakh ha Medium land and lakh ha Low land. About 34% of cultivated area is irrigated & rest 66% is rainfed, exposed to the vagaries of the monsoon. So, the production of agricultural crops in the state much depends on occurrence of a favourable monsoon. Climate & Rainfall State s climate is tropical, characterised by high temperature, high humidity, medium to high rainfall and short & mild winter. The normal rainfall of the state is mm. The peak period of rainy season is from 15 th June to September. During the year 2008, the pre-monsoon rainfall (April 08 & May 08) was deficient by 28%. The monsoon rainfall (June 08 to September 08) was excess by 20% where as the post monsoon rainfall (October 08 to December 08) was deficient by 83%. The detailed rainfall scenario for the year 2008 is indicated below. Period Rainfall in mm % of Normal Actual Deviation Summer (Jan 08 to March 08) (-) 11 Pre-monsoon (April & May 08) (-) 28 Monsoon June (+) 56 July (-) 12 August (+) 6 September (+) 56 Sub (Monsoon) June to September (+) 20 Post Monsoon (Oct. to Dec. 08) (-) (+) 5 -[ I ]-
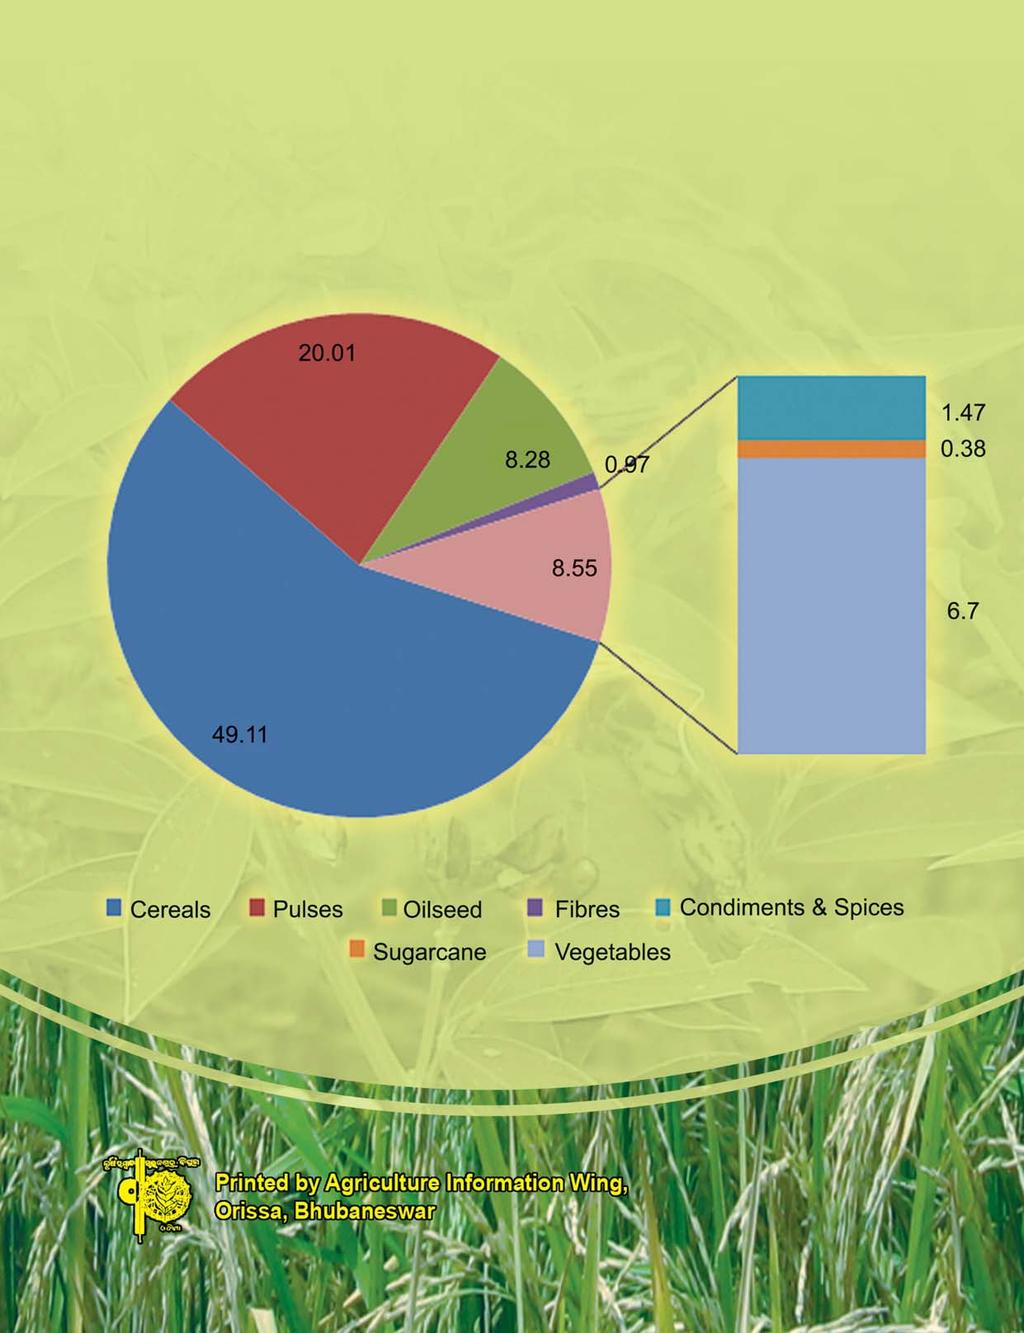
7 Crop Condition The condition of kharif and rabi corps during was by and large normal. Crop Coverage The net area sown and gross cropped area during the year were lakh ha and lakh ha respectively. The cropping intensity was 162%. Rice is the major crop in kharif season and so are pulses & oilseeds in Rabi season. The coverage under different crops during the year is as follows. (Area in lakh ha) Kharf Rabi Crop Area % of total area Area % of total area Annual area Area Rice % to total area Other Cereals Pulses Oilseeds Fibres Sugarcane Vegetables Spices Others High Yielding Coverage The coverage under high yielding varieties of different crops is lakh ha. The crop-wise break up is given below. (Area in lakh ha.) Crop Area covered Coverage of High yielding % of total coverage Paddy Wheat Maize Jowar Bajra Irrigated Area The total irrigation potential created from all sources is lakh ha (28.67 lakh ha during Kharif and lakh ha during Rabi). The gross irrigated area during the -[ II ]-
8 year is lakh ha ( lakh ha during kharif and lakh ha during Rabi) which is 74% of the potential created. The details are presented below. (Area in lakh ha) Crops Kharif Rabi Area covered Area irrigated % of Area covered Area covered Area irrigated % of Area covered area covered Area irrigated % of Area covered Paddy Other Cereals Pulses Oilseeds Fibres Vegetables Sugarcane Spices Tobacco Crop Production The area, production & yield rates of major crops grown in the state, during the year are as follows. A=Area in 000ha, P=Production in 000MT/ bales*, Y=Yield in Kg./ha. Kharif Rabi Crops A P Y A P Y A P Y Rice Cereals Pulses Oilseeds Fibres Sugarcane (Cane) During kharif 2008, the rice production declined to lakh tonnes as compared to lakh tonnes during Kharif 2007 due to occurrence of flood & moisture stress in the state. -[ III ]-
9 Seeds Quality seed plays a vital role in boosting up the production. The strategy has been to maximize quality seed distribution. The details of seed distribution made through departmental sale centres during is as follows. Sl.No. Seeds Quality seeds supplied (Qtls.) Kharif Rabi 1 Paddy Wheat Maize Ragi Cereals Mung Biri Other Pulses Pulses Groundnut Til Mustard Other Oilseeds Oilseeds Jute Mesta Dhanicha Cotton Fertiliser The use of chemical fertilizers substantially improves the productivity of crops. Due importance is being given on use of balanced fertilizer in line with the Integrated Nutrient Management Principles, which not only enhances production but also maintains the productivity of the soil. The details of fertilizer consumption made during is given below. -[ IV ]-
10 Consumption in 000MT. Type of fertilizer Kharif Rabi N P K Kgs./hect Pesticides Crops, especially High yielding varieties, are susceptible to large numbers of pests and diseases. Most often, chemical control is being resorted to save the crops. So, due thrust is being given on Integrated Pest Management (IPM) in order to have effective pest control inflicting minimum damage to the environment. The details of pesticides consumption during is as follows. (Pesticides in term of MT) Sl.No Type of pesticides Consumption of pesticides Kharif Rabi 1 Insecticides Fungicides Weedicides Rodenticides Plantgrowth regulators Neembase pesticides & Biocides Per hect consumption in gms.a.i Farm Mechanisation Farm mechanization seems inevitable in modern crop husbandry. This not only ensures timely agricultural operations but also helps reduce drudgery of labour & cost of production. Massive efforts have been put in for popularizing different improved farm equipments and machineries among farmers through conducting demonstrations and extending subsidy. The achievement made in this regard during is presented below. -[ V ]-
11 Item Unit Achievement Tractor Nos 1500 Power tiller Nos 5280 Self propelled reaper Nos 292 Self propelled transplanter Nos 45 Rotavator Nos 38 Power Operated Implement Nos 13 Power Thresher Nos 831 Special Power Operated Implements Nos 396 Manual implements Nos 2946 Hydraulic Trailer Nos 536 Pump sets Nos 8331 Combined Harvester Nos 49 Creation of captive irrigation Assured supply of water is one of the pre-requisites for successful crop production. Accordingly, our State Govt. provides subsidy to the cultivators for creation of captive irrigation under RIDF (Jalanidhi). The achievement made during along with the progressive achievement from to is as follows. (Unit in Nos) Name of the captive irrigation under RIDF During [ VI ]- Progressive achievement since to Shallow Tube well Bore well Surface lift 7 14 Dug well : Agriculture Credit Crop loan is an indispensable input, especially for small and marginal cultivators of our state to meet the rising cost of inputs for enhancing crop productivity. During the year , an amount of Rs crores (Rs crores during kharif and Rs crores during rabi) has been advanced to farmers as crop loan. Crop Insurance About 66% of the crops grown in the State being rainfed are exposed to several uncertainties imposed by the vagaries of nature i.e. flood, drought, cyclone, hail storm, either alone or in combination including pests menace especially during Kharif. Thus, it has been our endeavor to bring the vulnerable cultivator under the umbrella of Crop Insurance, so that they overcome the uncertainties posed by these natural calamities.
12 The Rashtriya Krishi Bima Yojana (RKBY) is being implemented in the state from Rabi Both loanee and non-loanee farmers are covered under this scheme. It is compulsory for loanee farmers and optional for non-loanee farmers. The crops covered are Paddy, Maize, Groundnut, Jute, Niger, Arhar, Cotton during kharif season and Paddy, Groundnut, Mustard, Potato during Rabi season. The defined area is block for Paddy, Niger and district for other crops. The achievement made under crop insurance scheme for the year is given below. Item Kharif Rabi Farmers covered (Nos in lakh) Farmers benefited (Nos in lakh) Sum Insured (Rs in crores) Premium collected (Rs. in crores) Compensation paid (Rs. in crores) Besides, during kharif-2008, Pilot Weather Based Crop Insurance Scheme (WBCIS) was implemented in 8 blocks of 3 districts of the State namely Nuapada, Bolangir and Baragarh for non-loanee farmers on optional basis for paddy crops. Power consumption The power consumption for Irrigation in Agriculture is in declining trend. Minor irrigation programme cannot be successful without large-scale rural electrification. However, as per the incentives announced under Hon ble Chief Ministers package and State Agriculture Policy, energy use in Agriculture Sector is expected to rise. The share of power consumption for Agriculture Purpose since is indicated below. Year Share of power consumption for Agriculture Purpose In million units In % [ VII ]-
13 Seed Replacement Rate The Seed Replacement Rate (SRR) of different crops for is indicated below. Name of the crop Seed Rate SRR in % for Kg./ha. Kharif Rabi Paddy Maize Wheat Moong Urd Gram Arhar Field Pea Groundnut Mustard Sunflower Jute Cotton Minimum Support Price The minimum support price of different Agricultural Products for the year from & fixed by Govt. of India on the recommendation of Commission for Agriculture Costs and Prices (CACP) for all the States is furnished at page-30. -[ VIII ]-
14 DISTRICT WISE MONTHLY NORMAL RAINFALL Unit : in mm Sl.No District Jan Feb Mar Apr May Jun Jul Aug Sep Oct Nov Dec Annual 1 Balasore Bhadrak Bolangir Sonepur Cuttack Jagatsinghpur Jajpur Kendrapada Dhenkanal Angul Ganjam Gajapati Kalahandi Nuapada Keonjhar Koraput Malkangiri Nawarangpur Rayagada Mayurbhanj Kandhamal Boudh Puri Khordha Nayagarh Sambalpur Baragarh Deogarh Jharsuguda Sundargarh Orissa : Source:- India Meteorological Dept. Pune. -// 1 //-
15 DISTRICT WISE MONTHLY NORMAL RAINY DAYS Unit :- in day Sl.No District Jan Feb Mar Apr May Jun July Aug Sep Oct Nov Dec Annual 1 Balasore Bhadrak Bolangir Sonepur Cuttack Jagatsinghpur Jajpur Kendrapada Dhenkanal Angul Ganjam Gajapati Kalahandi Nuapada Keonjhar Koraput Malkangiri Nawarangpur Rayagada Mayurbhanj Kandhamal Boudh Puri Khordha Nayagarh Sambalpur Baragarh Deogarh Jharsuguda Sundargarh Orissa : Source:- India Meteorological Dept. Pune. -// 2 //-
16 DISTRICT WISE MONTHLY RAINFALL FOR 2008 Sl. District Jan Feb Mar Apr May Jun Jul Aug Sep Oct NovDec Rainfall in mm Annual % of No. Dev 1 Balasore Bhadrak Bolangir Sonepur Cuttack Jagatsinghpur Jajpur Kendrapara Dhenkanal Angul Ganjam Gajapati Kalahandi Nuapara Keonjhar Koraput Malkanagiri Nawarangpur Rayagada Mayurbhanj Kandhamal Boudh Puri Khordha Nayagarh Sambalpur Bargarh Deogarh Jharsuguda Sundargarh State Average Source: SRC, BBSR -// 3 //- Actual Normal
17 RAINFALL REPORT FOR JUNE TO SEPTEMBER DURING Rainfall in mm. Sl. Year June July August Sept. Annual % of (June to Rainfall Rainfall No. Sept.) // 4 //-
18 DISTRICT WISE WEEKLY RAINFALL REPORT - JUNE & JULY'2008 Sl. District June July Unit in mm No 1st 2nd 3rd 4th 1st 2nd 3rd 4th 1 Balasore Bhadrak Bolangir Sonepur Cuttack Jagatsinghpur Jajpur Kendrapara Dhenkanal Angul Ganjam Gajapati Kalahandi Nuapara Keonjhar Koraput Malkanagiri Nawarangpur Rayagada Mayurbhanj Kandhamal Boudh Puri Khordha Nayagarh Sambalpur Bargarh Deogarh Jharsuguda Sundargarh Orissa // 5 //-
19 DISTRICT WISE WEEKLY RAINFALL REPORT - AUGUST & SEPT.'2008 Unit in mm Sl. District August September No 1st 2nd 3rd 4th 1st 2nd 3rd 4th 1 Balasore Bhadrak Bolangir Sonepur Cuttack Jagatsinghpur Jajpur Kendrapara Dhenkanal Angul Ganjam Gajapati Kalahandi Nuapara Keonjhar Koraput Malkanagiri Nawarangpur Rayagada Mayurbhanj Kandhamal Boudh Puri Khordha Nayagarh Sambalpur Bargarh Deogarh Jharsuguda Sundargarh Orissa // 6 //-
20 MONTHLY AVERAGE TEMPERATURE AND HUMIDITY FOR 2008 Unit-Temp in 0 C and humidity in % Stations Jan Feb Mar Apr May Jun Max. Min. RH Max. Min. RH Max. Min. RH Max. Min. RH Max. Min. RH Max. Min. RH Balasore Chandabali Cuttack Paradeep Bhubaneswar Gopalpur Puri Angul Baripada * * * * * * Jharsuguda Keonjhar Sambalpur Sundargarh Hirakud Bhawanipatna Bolangir Koraput Phulbani Titlagarh * * 71 Malkangiri * * * * * 32 * * Stations July August September October November December Max. Min. RH Max. Min. RH Max. Min. RH Max. Min. RH Max. Min. RH Max. Min. RH Balasore Chandabali Cuttack Paradeep Bhubaneswar Gopalpur Puri Angul Baripada * * * Jharsuguda Keonjhar Sambalpur Sundargarh Hirakud Bhawanipatna Bolangir Koraput Phulbani Titlagarh 32 * * * * * * 52 Malkangiri 30 * * 30 * * 32 * * 33 * * 33 * * 31 * * N.B. :-(*) - Data not available -// 7 //-
21 LAND UTILISATION STATISTICS Sl. No. District Geographical Area Forest Area Misc. Tree & Grovers Permanent Pasture -// 8 //- Culturable Waste Land put to non agril. Use Barren & Unculturable Land Current Fallow Area in '000 hect 1 Balasore Bhadrak Balangir Sonepur Cuttack Jagatsingpur Jajpur Kendrapara Dhenkanal Angul Ganjam Gajapati Kalahandi Nawapara Keonjhar Koraput Malkangiri Nabarangpur Rayagada Mayurbhanj Phulbani Boudh Puri Khordha Nayagarh Sambalpur Bargarh Deogarh Jharsuguda Sundargarh TOTAL Other Fallow Net Area Sown
22 DISTRICT-WISE CULTIVATED AREA AND KHARIF PADDY COVERAGE OF ORISSA DURING Area in '000 hect SL DISTRICT CULTIVATED AREA KHARIF PADDY COVERAGE NO. HIGH MEDIUM LOW TOTAL HIGH MEDIUM LOW TOTAL 1 Balasore Bhadrak Balangir Sonepur Cuttack Jagatsingpur Jajpur Kendrapara Dhenkanal Angul Ganjam Gajapati Kalahandi Nawapara Keonjhar Koraput Malkangiri Nabarangpur Rayagada Mayurbhanj Phulbani Boudh Puri Khordha Nayagarh Sambalpur Bargarh Deogarh Jharsuguda Sundargarh TOTAL // 9 //-
23 DISTRICT WISE KHARIF CROPPED AREA DURING (Area in '000 hect.) Sl. No. Name of the District Rice Other Cereals Cereals Pulses Foodgra ins Oil seeds Vegeta bles Fibers Spices Cro-pped area 1 Balasore Bhadrak Bolangir Sonepur Cuttack Jagatsingpur Jajpur Kendrapara Dhenkanal Angul Ganjam Gajapati Kalahandi Nowapara Keonjhar Koraput Malkangiri Nabarangpur Rayagada Mayurbhanj Phulbani Boudh Puri Khordha Nayagarh Sambalpur Baragarh Deogarh Jharsuguda Sundargarh // 10 //-
24 DISTRICT WISE RABI CROPPED AREA DURING ( Area in '000 hect.) Sl. No. Name of the District Rice Other Cereals Cereals Pulses Foodgrains Oilseeds Vegitables Spices Sugarcane Toba cco Cropped area 1 Balasore Bhadrak Bolangir Sonepur Cuttack Jagatsingpur Jajpur Kendrapara Dhenkanal Angul Ganjam Gajapati Kalahandi Nowapara Keonjhar Koraput Malkangiri Nabarangpur Rayagada Mayurbhanj Phulbani Boudh Puri Khordha Nayagarh Sambalpur Baragarh Deogarh Jharsuguda Sundargarh // 11 //-
25 DISTRICT WISE GROSS CROPPED AREA DURING // 12 //- (Area in '000 hect.) Sl. Name of the Rice Other No. District Cereals Cereals Pulses Foodgrains Oilseeds Vegetables 1 Balasore Bhadrak Bolangir Sonepur Cuttack Jagatsingpur Jajpur Kendrapara Dhenkanal Angul Ganjam Gajapati Kalahandi Nowapara Keonjhar Koraput Malkangiri Nabarangpur Rayagada Mayurbhanj Phulbani Boudh Puri Khordha Nayagarh Sambalpur Baragarh Deogarh Jharsuguda Sundargarh
26 DISTRICT WISE GROSS CROPPED AREA DURING // 13 //- (Area in '000 hect) Sl. Name of the Sugar- Tobacco Fruits Gross Cro- No. District Spices Fibres cane pped Area 1 Balasore Bhadrak Bolangir Sonepur Cuttack Jagatsingpur Jajpur Kendrapara Dhenkanal Angul Ganjam Gajapati Kalahandi Nowapara Keonjhar Koraput Malkangiri Nabarangpur Rayagada Mayurbhanj Phulbani Boudh Puri Khordha Nayagarh Sambalpur Baragarh Deogarh Jharsuguda Sundargarh
27 DISTRICT WISE ESTIMATES OF AREA UNDER DIFFERENT FRUIT CROPS DURING Sl. No. District Mango Guava Citrus Litchi Fresh Fruit Sapota Banana Papaya Pine apple Pome granate Others Fresh Fruit (Area in '000 hect) Dry Fruit Cashewnut Anoia Dry Fruit Coconut Fruit Area 1 Balasore Bhadrak Balangir Sonepur Cuttack Jagatsingpur Jajpur Kendrapara Dhenkanal Angul Ganjam Gajapati Kalahandi Nuapada Keonjhar Koraput Malkangiri Nabarangpur Rayagada Mayurbhanj Phulbani Boudh Puri Khordha Nayagarh Sambalpur Bargarh Deogarh Jharsuguda Sundargarh TOTAL // 14 //-
28 Sl. No. DISTRICT WISE AREA AND PRODUCTION OF DIFFERENT FLORICULTURAL CROPS FOR THE YEAR District -// 15 //- (Area in ha. Prodn.in Qtls.) (In Gladioli Prodn.in no.of spike) Marigold Rose Gladioli Tube rose Area Prodn. Area Prodn. Area Prodn. Area Prodn. 1 Balasore Bhadrak Balangir Sonepur Cuttack J.S.Pur Kendrapara Jajpur Dhenkanal Angul Ganjam Gajapati Kalahandi Nawapara Keonjhar Koraput Malkangiri Nabarangpur Rayagada Mayurbhanj Phulbani Boudh Puri Khordha Nayagarh Sambalpur Bargarh Deogarh Jharsuguda Sundargarh TOTAL
29 DISTRICT WISE CROPPING INTENSITY DURING Area in '000Ha. Sl. No. DISTRICT Net Area Sown Gross Cropped Area Cropping Intensity (%) 1 Balasore Bhadrak Balangir Sonepur Cuttack Jagatsingpur Jajpur Kendrapara Dhenkanal Angul Ganjam Gajapati Kalahandi Nawapara Keonjhar Koraput Malkangiri Nabarangpur Rayagada Mayurbhanj Phulbani Boudh Puri Khordha Nayagarh Sambalpur Bargarh Deogarh Jharsuguda Sundargarh TOTAL // 16 //-
30 District wise Area under HYV crops for of Orissa. Area in '000 hect. Sl. Name of the Rice Wheat Maize Jowar Bajra No. District Kharif Rabi Rabi Kharif Rabi Kharif Kharif 1 Balasore Bhadrak Balangir Sonepur Cuttack Jagatsingpur Jajpur Kendrapara Dhenkanal Angul Ganjam Gajapati Kalahandi Nawapara Keonjhar Koraput Malkangiri Nabarangpur Rayagada Mayurbhanj Phulbani Boudh Puri Khordha Nayagarh Sambalpur Bargarh Deogarh Jharsuguda Sundargarh TOTAL // 17 //-
31 DISTRICT WISE CONSUMPTION OF FERTILISER DURING Sl. No. District Kharif-08 Rabi (Fig. In MTs.) (Fig. In MTs.) Kharif cropped area ('000 ha.) Per Hect. Consumption (Kg./ha.) N P K N P K Rabi cropped area ('000 ha.) Per Hect. Consumption (Kg./ha.) 1 Balasore Bhadrak Balangir Sonepur Cuttack Jagatsingpur Jajpur Kendrapara Dhenkanal Angul Ganjam Gajapati Kalahandi Nawapara Keonjhar Koraput Malkangiri Nabarangpur Rayagada Mayurbhanj Phulbani Boudh Puri Khordha Nayagarh Sambalpur Bargarh Deogarh Jharsuguda Sundargarh // 18 //-
32 Sl. No. District Kharif + Rabi ( ) Per Hect. (Fig. In MTs.) cropped area consumption N P K ('000 ha.) (Kg./ ha.) 1 Balasore Bhadrak Balangir Sonepur Cuttack Jagatsingpur Jajpur Kendrapara Dhenkanal Angul Ganjam Gajapati Kalahandi Nawapara Keonjhar Koraput Malkangiri Nabarangpur Rayagada Mayurbhanj Phulbani Boudh Puri Khordha Nayagarh Sambalpur Bargarh Deogarh Jharsuguda Sundargarh // 19 //-
33 DISTRICT WISE IRRIGATION AREA (Potential Created) up to Major & MediumMinor (Flow) Minor (Lift) Other Sources Sl. District No. K R K R K R K R K R 1 Balasore Bhadrak Bolangir Sonepur Cuttack Jagatsinghpur Jajpur Kendrapada Dhenkanal Angul Ganjam Gajapati Kalahandi Nowapada Keonjhar Koraput Malkangiri Nabarangpur Rayagada Mayurbhanj Phulbani Boudh Puri Khordha Nayagarh Sambalpur Baragarh Deogarh Jharsuguda Sundargarh : N.B.: K - Kharif & R - Rabi -// 20 //- Area in '000 hact.
34 Disrict wise and crop wise Irrigated area during kharif 2008 Sl. No. District Paddy Maize Ragi cereals Area in 000'Hact Mung Biri Other pulses pulses 1 Balasore Bhadrak Bolangir Sonepur Cuttack Jagatsinghpur Jajpur Kendrapada Dhenkanal Angul Ganjam Gajapati Kalahandi Nuapada Keonjhar Koraput Malkangiri Nawarangpur Rayagada Mayurbhanj Kandhamal Boudh Puri Khordha Nayagarh Sambalpur Baragarh Deogarh Jharsuguda Sundargarh ORISSA // 21 //-
35 Sl. No. District Disrict wise and crop wise Irrigated area during kharif 2008 Til Castor Sunflow er Oilseed Jute Mesta Cotton fiber Veg. Area in '000 hact. spices Gross area 1 Balasore Bhadrak Bolangir Sonepur Cuttack Jagatsinghpur Jajpur Kendrapada Dhenkanal Angul Ganjam Gajapati Kalahandi Nuapada Keonjhar Koraput Malkangiri Nawarangpur Rayagada Mayurbhanj Kandhamal Boudh Puri Khordha Nayagarh Sambalpur Baragarh Deogarh Jharsuguda Sundargarh ORISSA // 22 //-
36 District wise& crop wise irrigated area during Rabi Sl. No. District Paddy Wheat Maize Ragi Crereals Mung Biri Other pulses Pulses 1 Balasore Bhadrak Bolangir Sonepur Cuttack Jagatsinghpur Jajpur Kendrapada Dhenkanal Angul Ganjam Gajapati Kalahandi Nuapada Keonjhar Koraput Malkangiri Nawarangpur Rayagada Mayurbhanj Kandhamal Boudh Puri Khordha Nayagarh Sambalpur Baragarh Deogarh Jharsuguda Sundargarh ORISSA // 23 //-
37 Sl. No. District District wise& crop wise irrigated area during Rabi Area in '000 hact. Grou ndnut Til Castor Sunfl ower Mustard oilseeds Vegt. spices Sugar cane Tob acco Gross Area 1 Balasore Bhadrak Bolangir Sonepur Cuttack Jagatsinghpur Jajpur Kendrapada Dhenkanal Angul Ganjam Gajapati Kalahandi Nuapada Keonjhar Koraput Malkangiri Nawarangpur Rayagada Mayurbhanj Kandhamal Boudh Puri Khordha Nayagarh Sambalpur Baragarh Deogarh Jharsuguda Sundargarh ORISSA // 24 //-
38 DISTRICT WISE SEED DISTRIBUTION DURING KHARIF 2008 (Fig. in Qtl.) Sl. No. Name of the District Paddy Ragi Maize Moong Biri Arhar Ground-nut Til Niger (GA- 10) Cotton (MCU-5) Jute (JRO-524) Dhani-cha Mes-ta Sun-flower 1 BALASORE BHADRAK BOLANGIR SONEPUR CUTTACK JAGATSINGPUR JAJPUR KENDRAPARA DHENKANAL ANGUL GANJAM GAJAPATI KALAHANDI NUAPADA KEONJHAR KORAPUT NABARANGPUR MALKANGIRI RAYAGADA MAYURBHANJ PHULBANI BOUDH PURI KHURDA NAYAGARH SAMBALPUR BARGARH DEOGARH JHARSUGUDA SUNDARGARH TOTAL Own outlet of OSSC GRAND TOTAL // 25 //-
39 DISTRICT WISE SEED DISTRIBUTION DURING RABI (Fig. in Qtl.) Sl. No. District Paddy Wheat Ragi Maize Moong Biri Gram Field-pea Ground nut Til Mustard Sun-flower 1 BALASORE BHADRAK BOLANGIR SONEPUR CUTTACK JAGATSINGPUR JAJPUR KENDRAPARA DHENKANAL ANGUL GANJAM GAJAPATI KALAHANDI NUAPADA KEONJHAR KORAPUT NABARANGPUR MALKANGIRI RAYAGADA MAYURBHANJ PHULBANI BOUDH PURI KHURDA NAYAGARH SAMBALPUR BARGARH DEOGARH JHARSUGUDA SUNDARGARH GRAND TOTAL // 26 //-
40 DISTRICT WISE MAJOR KEY INDICATORS OF ORISSA DURING Area in '000hect. SL. DISTRICTS Rainfall (in mm) Geogra- Culti- Net Gross Kharif Rabi No. Normal 2008 phical vated Area Cropped Cropped Cropped Area Area Sown Area Area Area 1 Balasore Bhadrak Balangir Sonepur Cuttack Jagatsingpur Jajpur Kendrapara Dhenkanal Angul Ganjam Gajapati Kalahandi Nawapara Keonjhar Koraput Malkangiri Nabarangpur Rayagada Mayurbhanj Phulbani Boudh Puri Khordha Nayagarh Sambalpur Bargarh Deogarh Jharsuguda Sundargarh TOTAL // 27 //-
41 DISTRICT WISE MAJOR KEY INDICATORS OF ORISSA DURING Area in '000hect. SL. DISTRICTS Cropping Net Irri- Gross Kharif Sugar- Fruits Cropped Fertiliser No. Intensity gated Irriga- Paddy cane area Consumption (%) Area ted Area Coverage ( Kgs./ha) 1 Balasore Bhadrak Balangir Sonepur Cuttack Jagatsingpur Jajpur Kendrapara Dhenkanal Angul Ganjam Gajapati Kalahandi Nawapara Keonjhar Koraput Malkangiri Nabarangpur Rayagada Mayurbhanj Phulbani Boudh Puri Khordha Nayagarh Sambalpur Bargarh Deogarh Jharsuguda Sundargarh TOTAL // 28 //-
42 District wise Target & Achievement under Agricultural Credit Plan of Orissa during Crop loan Sl. No. Nme of the District Target Achievement 1 Balasore Bhadrak Bolangir Sonepur Cuttack Jagatsinghpur Jajpur Kendrapada Dhenkanal Angul Ganjam Gajapati Kalahandi Nuapada Keonjhar Koraput Malkangiri Nabarangpur Rayagada Mayurbhanj Phulbani Boudh Puri Khordha Nayagarh Sambalpur Bargarh Deogarh Jharsuguda Sundargarh ORISSA MINIMUM SUPPORT PRICE OF VARIOUS AGRICULTURE COMMODITIES FOR & Sl. No. -// 29 // KHARIF CROPS 1 PADDY Common 850$$$ 950 Grade 'A' 880$$$ JOWAR Hybrid Maldandi BAJRA MAIZE RAGI ARHAR(Tur) MOONG URAD COTTON F-414/H-777/J a 2500a H aa 3000aa 10 GROUNDNUT IN SHELL SUNFLOWER SEED SOYABEEN BLACK YELLOW SESAMUM NIGERSEED RABI CROPS 15 WHEAT BARLEY GRAM MASUR (LENTIL) RAPESEED/MUSTARD SAFFLOWER TORIA OTHER CROPS JUTE (Tosha) (White) SUGARCANE (F&RP) Up to Statutory Minimum Price (SMP) linked to a basic recovery of 8.5 % with proportionate premium for every 0.1% increase in recovery above that level. The SMP for includes the one time drought relief of Rs. 5 per quintal recommended by CACP. From onwards SMP is linked to basic recovery of 9.0%. F&RFair and Remunerative Price $$$ An additional incentive bonus of Rs.50 per quintal is payable over the Minimum Support Price(MSP). a aa Commodity Variety Rs.per Qtls. For FAQ Staple length (mm) and Micronaire value of Staple length (mm) and Micronaire value of
43 Sl. No DISTRICT WISE PROGRESS UNDER FARM MECHANIZATION UNDER WORK PLAN DURING District Tractor Power Tiller Self propelled Reaper Transplanter Rotavator Power Optd. Implements Power Thresher Spl.Power Opetd. Impl. Hyd. Trailer Comb. Harvestor Pump sets Manual Implements 1 Balasore Bhadrak Balangir Sonepur Cuttack Jagatsingpur Jajpur Kendrapara Dhenkanal Angul Ganjam Gajapati Kalahandi Nawapara Keonjhar Koraput Malkangiri Nabarangpur Rayagada Mayurbhanj Phulbani Boudh Puri Khordha Nayagarh Sambalpur Bargarh Deogarh Jharsuguda Sundargarh TOTAL // 30 //-
44 District wise PLIPs executed under Jalanidhi Programme (From Dt to ) Sl.No District BW DW RL STW Aya, Area (In ha.) 1 Balasore Bhadrak Balangir Sonepur Cuttack Jagatsingpur Jajpur Kendrapara Dhenkanal Angul Ganjam Gajapati Kalahandi Nawapara Keonjhar Koraput Malkangiri Nabarangpur Rayagada Mayurbhanj Phulbani Boudh Puri Khordha Nayagarh Sambalpur Bargarh Deogarh Jharsuguda Sundargarh TOTAL // 31 //- (Unit in Nos)
45 Dis trict wis e and project wis e execution of P L IP s from to Sl.No District BW DW RL L STW MTW T otal o l 1 Balasore Bhadrak Balangir Sonepur C uttac k Jagatsingpur Jajpur Kendrapara Dhenkanal Angul Ganjam Gajapati Kalahandi Nawapara Keonjhar Koraput Malkangiri Nabarangpur R ayagada Mayurbhanj Phulbani Boudh Puri Khordha Nayagarh S ambalpur Bargarh Deogarh Jhars uguda S undargarh TOTAL // 32 //-
46 YIELD RATE OF DIFFERENT CROPS OF ORISSA STATE ALONG WITH OTHER STATES FOR AND OR IS S A FR OM T O States Yield rate of different crops ( kgs/hect) Rice Wheat Jowar Bajra Maize Gram Arhar G.nut Cotton Jute & Mesta S.cane Potato W es t Bengal Uttar P rades h Andhra P rades h P unjab Tamil Nadu Bihar As s am Karnataka C hhatis garh Haryana Maharas htra Jharkhand Gujarat Madhya P rades h Kerala 2390 R ajas than All India Orissa // 33 //-
47 Productivity of different crops grown in Orissa in comparison with All India (in Kg./h ect.) Year Foodgr ains Rice Maize Pulses Arhar AI Orissa AI Orissa AI Orissa AI Orissa AI Orissa * * * 860 NB : AI=All India (a )-Adva nc e es tim a tes for a ll India *P rovis iona l da ta -// 34 //-
48 Productivity of different crops grown in Orissa in comparison with All India (in K g./hect.) Oilseeds Groundnut S unflower Cotton S ugarcane Year AI Orissa AI Orissa AI Orissa AI Orissa AI Orissa * * * * * NB : AI=All India (a )-Adva nc e es tim a tes for a ll India *P rovis iona l da ta -// 35 //-
49 Final C rop wise Area,Yield R ate & P rod uction of different d C rops of Oris s a during Sl. Name of the Kharif Rabi No crops A Y P A Y P A Y P R ice (DE &S ) (Paddy) W heat Jowar B ajra Maize R agi S mall Millets l Cereals Arhar Mung B iri K ulthi G ram F ieldpea Lentil Cowpea Other P uls es PulsesP l Foodgrains G roundnut S es amum Cas ter Niger S unflower S afflower Lins eed Mus tard Oilseeds Jute Mes ta S unhemp Cotton Fibres S weet P otato P otato Onion Other V egetable Vegetables Chilly Corriender G arlic Turmeric G inger Spices Sugarcane Tobacco Grand l // 36 //- A =Area a in' 000 he cts. Y=Yield in Kgs /hects. P=Production in '000MTs /Bales
50 A=Area in '000ha. DIS TR ICT W IS E AR EA, P R ODUCTION & YIEL D R ATE OF DIFFER ENT Y=Yield in Kg./ha. CR OP S GR OW N DUR ING IN OR IS S A P =P roduction in '000 MTs. Sl. District AUTUMN RICE WINTER RICE A Y P A Y P No P ADDY RICE (RICE) PADDY RICE (RICE) 1 Balas ore Bhadrak Bolangir S onepur C uttack Jagats ingpur Jajpur Kendrapara Dhenkanal Angul Ganjam Gajapati Kalahandi Nowapara Keonjhar Koraput Malkangiri Nabarangpur R ayagada Mayurbhanj P hulbani Boudh P uri Khordha Nayagarh S ambalpur Baragarh Deogarh Jhars uguda S undargarh // 37 //- Paddy: N.B.:(I) Area, Yield & Production of Paddy is obtianed from DE S (O) (ii) Rice Yield & Production is 67% of Paddy
51 Sl. No District HYV KHARIF RICE A Y P NORMAL TOTAL PADDY RICE (RICE) A=Area in '000ha. Y=Yield in Kg./ha. P =P roduction in '000 MT S UMMER RICE A Y P PADD RICE (RICE) -// 38 //- 1 B alas ore B hadrak B olangir S onepur C uttack Jagats ingpur Jajpur K endrapara Dhenkanal Angul Ganjam Gajapati K alahandi Nowapara K eonjhar K oraput Malkangiri Nabarangpur R ayagada Mayurbhanj P hulbani B oudh P uri K hordha Nayagarh S ambalpur B aragarh Deogarh J hars uguda S undargarh Paddy:
52 Sl. No District HYV A=Area in '000ha. Y=Yield in Kg./ha. P =P roduction in '000 MTs. TOTAL RICE Wheat A Y P Rabi NORMAL TOTAL PADDY RICE (RICE) A Y P -// 39 //- 1 Balas ore Bhadrak Bolangir S onepur C uttack Jagats ingpur Jajpur Kendrapara Dhenkanal Angul Ganjam Gajapati Kalahandi Nowapara Keonjhar Koraput Malkangiri Nabarangpur R ayagada Mayurbhanj P hulbani Boudh P uri Khordha Nayagarh S ambalpur Baragarh Deogarh Jhars uguda S undargarh Paddy:
53 Sl. No District A=Area in '000ha. Y=Yield in Kg./ha. P =P roduction in '000 MTs. MAIZE HYV LOCAL KHARIF A Y P A Y P A Y P 1 Balas ore Bhadrak Bolangir S onepur C uttack Jagatsingpur Jajpur Kendrapara Dhenkanal Angul Ganjam Gajapati Kalahandi Nowapara Keonjhar Koraput Malkangiri Nabarangpur R ayagada Mayurbhanj P hulbani Boudh P uri Khordha Nayagarh S ambalpur Baragarh Deogarh Jhars uguda S undargarh // 40 //-
54 District A=Area in '000ha. Y=Yield in Kg./ha. P=Production in '000 MTs. MAIZE RABI TOTAL MAIZE A Y P A Y P Balas ore Bhadrak B olangir S onepur Cuttack Jagats ingpur Jajpur Kendrapara Dhenkanal Angul Ganjam Gajapati Kalahandi Nowapara Keonjhar Koraput Malkangiri Nabarangpur R ayagada Mayurbhanj P hulbani Boudh P uri Khordha Nayagarh Sambalpur Baragarh Deogarh Jhars uguda S undargarh // 41 //-
55 Sl. No District A=Area in '000ha. Y=Yield in Kg./ha. P=Production in '000 MTs. RAGI KHARIF RABI TOTAL A Y P A Y P A Y P 1 Balasore 2 Bhadrak 3 Bolangir S onepur C uttack Jagatsingpur 7 Jajpur Kendrapara 9 Dhenkanal Angul Ganjam Gajapati Kalahandi Nowapara Keonjhar Koraput Malkangiri Nabarangpur R ayagada Mayurbhanj P hulbani Boudh P uri Khordha Nayagarh S ambalpur 27 Baragarh 28 Deogarh Jhars uguda 30 S undargarh // 42 //-
56 Sl. No District A=Area in '000ha. Y=Yield in Kg./ha. P=Production in '000 MTs. JOWAR HYV LOCAL TOTAL J JOWAR A Y P A Y P A Y P 1 Balasore 2 Bhadrak 3 Bolangir S onepur Cuttack 6 Jagatsingpur 7 Jajpur Kendrapara 9 Dhenkanal 10 Angul 11 Ganjam Gajapati Kalahandi Nowapara Keonjhar Koraput Malkangiri Nabarangpur R ayagada Mayurbhanj P hulbani Boudh 23 P uri 24 Khordha 25 Nayagarh S ambalpur Baragarh Deogarh Jhars uguda 30 S undargarh // 43 //-
57 Sl. No District A=Area in '000ha. Y=Yield in Kg./ha. P =P roduction in '000 MTs. BAJARA SMALL MILLETS HYV LOCAL TOTAL KHARIF A Y P A Y P A Y P A Y P 1 Balasore 2 Bhadrak 3 B olangir Sonepur C uttac k 6 Jagatsingpur 7 Jajpur 8 Kendrapara 9 Dhenkanal Angul Ganjam Gajapati K alahandi Nowapara K eonjhar K oraput Malkangiri Nabarangpur R ayagada Mayurbhanj P hulbani B oudh P uri 24 K hordha 25 Nayagarh S ambalpur B aragarh Deogarh 29 J hars uguda 30 S undargarh // 44 //-
58 Sl. No District A=Area in '000ha. Y=Yield in Kg./ha. P=Production in '000 MTs. TOTAL CEREALS KHARIF RABI TOTAL A Y P A Y P A Y P 1 Balas ore Bhadrak B olangir S onepur C uttack Jagats ingpur Jajpur Kendrapara Dhenkanal Angul Ganjam Gajapati Kalahandi Nowapara Keonjhar Koraput Malkangiri Nabarangpur R ayagada Mayurbhanj P hulbani Boudh P uri Khordha Nayagarh S ambalpur Baragarh Deogarh Jhars uguda S undargarh // 45 //-
59 Sl. No District A=Area in '000ha. Y=Yield in Kg./ha. P=Production in '000 MTs. MUNG KHARIF RABI TOTAL A Y P A Y P A Y P 1 B alas ore Bhadrak B olangir S onepur C uttack Jagatsingpur Jajpur K endrapara Dhenkanal Angul Ganjam Gajapati K alahandi Nowapara K eonjhar K oraput Malkangiri Nabarangpur R ayagada Mayurbhanj P hulbani B oudh P uri K hordha Nayagarh S ambalpur B aragarh Deogarh J hars uguda S undargarh // 46 //-
60 Sl. No District A=Area in '000ha. Y=Yield in Kg./ha. P=Production in '000 MTs. BIRI KHARIF RABI TOTAL A Y P A Y P A Y P 1 Balas ore Bhadrak Bolangir S onepur C uttack Jagats ingpur Jajpur Kendrapara Dhenkanal Angul Ganjam Gajapati Kalahandi Nowapara Keonjhar Koraput Malkangiri Nabarangpur R ayagada Mayurbhanj P hulbani Boudh P uri Khordha Nayagarh S ambalpur Baragarh Deogarh Jhars uguda S undargarh T otal // 47 //-
61 Sl. No District A=Area in '000ha. Y=Yield in Kg./ha. P =P roduction in '000 MTs. ARHAR GRAM FIELD PEA LENTIL KHARIF RABI RABI RABI A Y P A Y P A Y P A Y P 1 Balas ore Bhadrak Bolangir S onepur C uttack Jagats ingpur Jajpur Kendrapara Dhenkanal Angul Ganjam Gajapati Kalahandi Nowapara Keonjhar Koraput Malkangiri Nabarangpur R ayagada Mayurbhanj P hulbani Boudh P uri Khordha Nayagarh S ambalpur Baragarh Deogarh Jhars uguda S undargarh // 48 //-
62 Sl. No District A=Area in '000ha. Y=Yield in Kg./ha. P =P roduction in '000 MTs. COWPEA KULTHI KHARIF RABI TOTAL RABI A Y P A Y P A Y P A Y P 1 Balas ore Bhadrak Bolangir S onepur C uttack Jagatsingpur Jajpur Kendrapara Dhenkanal Angul Ganjam Gajapati Kalahandi Nowapara Keonjhar Koraput Malkangiri Nabarangpur R ayagada Mayurbhanj P hulbani Boudh P uri Khordha Nayagarh S ambalpur Baragarh Deogarh Jhars uguda S undargarh T // 49 //-
63 Sl. No District A=Area in '000ha. Y=Yield in Kg./ha. P =P roduction in '000 MTs. OTHER PULS ES KHARIF RABI TOTAL A Y P A Y P A Y P 1 Balas ore Bhadrak 3 Bolangir S onepur C uttack Jagats ingpur Jajpur Kendrapara Dhenkanal Angul Ganjam Gajapati 13 Kalahandi Nowapara Keonjhar 16 Koraput Malkangiri Nabarangpur R ayagada Mayurbhanj P hulbani 22 Boudh P uri 24 Khordha Nayagarh S ambalpur Baragarh Deogarh Jhars uguda S undargarh T otal // 50 //-
64 Sl. No District A=Area in '000ha. Y=Yield in Kg./ha. P=Production in '000 MTs. TOTAL PULSES KHARIF RABI TOTAL A Y P A Y P A Y P 1 Balas ore Bhadrak Bolangir S onepur C uttack Jagats ingpur Jajpur Kendrapara Dhenkanal Angul Ganjam Gajapati Kalahandi Nowapara Keonjhar Koraput Malkangiri Nabarangpur R ayagada Mayurbhanj P hulbani Boudh P uri Khordha Nayagarh S ambalpur Baragarh Deogarh J hars uguda S undargarh // 51 //-
65 Sl. No District A=Area in '000ha. Y=Yield in Kg./ha. P=Production in '000 MTs. TOTAL FOOD GRAINS KHARIF RABI TOTAL A Y P A Y P A Y P 1 Balas ore Bhadrak Bolangir S onepur C uttack Jagats ingpur Jajpur Kendrapara Dhenkanal Angul Ganjam Gajapati Kalahandi Nowapara Keonjhar Koraput Malkangiri Nabarangpur R ayagada Mayurbhanj P hulbani Boudh P uri Khordha Nayagarh S ambalpur Baragarh Deogarh Jhars uguda S undargarh T otal // 52 //-
66 Sl. No District A=Area in '000ha. Y=Yield in Kg./ha. P=Production in '000 MTs. GR OUNDNUT KHARIF RABI A Y P A Y P A Y P 1 Balas ore Bhadrak Bolangir S onepur C uttack Jagats ingpur Jajpur Kendrapara Dhenkanal Angul Ganjam Gajapati Kalahandi Nowapara Keonjhar Koraput Malkangiri Nabarangpur R ayagada Mayurbhanj P hulbani Boudh P uri Khordha Nayagarh S ambalpur Baragarh Deogarh Jhars uguda S undargarh T otal // 53 //-
67 Sl. No District A=Area in '000ha. Y=Yield in Kg./ha. P =P roduction in '000 MTs. SESAMUM KHARIF RABI TOTAL A Y P A Y P A Y P 1 B alas ore B hadrak B olangir S onepur C uttack Jagats ingpur Jajpur K endrapara Dhenkanal Angul Ganjam Gajapati K alahandi Nowapara K eonjhar K oraput Malkangiri Nabarangpur R ayagada Mayurbhanj P hulbani B oudh P uri K hordha Nayagarh S ambalpur B aragarh Deogarh J hars uguda S undargarh // 54 //-
68 Sl. No District A=Area in '000ha. Y=Yield in Kg./ha. P=Production in '000 MTs. CASTOR KHARIF RABI TOTAL A Y P A Y P A Y P 1 Balas ore Bhadrak B olangir S onepur C uttack Jagats ingpur Jajpur Kendrapara Dhenkanal Angul Ganjam Gajapati Kalahandi Nowapara Keonjhar Koraput Malkangiri Nabarangpur R ayagada Mayurbhanj P hulbani Boudh P uri Khordha Nayagarh S ambalpur Baragarh Deogarh Jhars uguda S undargarh T otal // 55 //-
69 Sl. No District A=Area in '000ha. Y=Yield in Kg./ha. P =P roduction in '000 MTs. SUNFLOWER KHARIF RABI TOTAL A Y P A Y P A Y P 1 B alas ore B hadrak B olangir S onepur C uttack Jagatsingpur Jajpur Kendrapara Dhenkanal Angul Ganjam Gajapati Kalahandi Nowapara K eonjhar K oraput Malkangiri 18 Nabarangpur R ayagada Mayurbhanj Phulbani B oudh P uri K hordha Nayagarh S ambalpur Baragarh Deogarh J hars uguda S undargarh // 56 //-
70 Sl. No District A=Area in '000ha. Y=Yield in Kg./ha. P =P roduction in '000 MTs. SAFFLOWER NIGER RABI KHARIF RABI TOTAL A Y P A Y P A Y P A Y P 1 Balasore 2 Bhadrak 3 B olangir Sonepur 5 C uttac k 6 Jagatsingpur Jajpur 8 Kendrapara 9 Dhenkanal 10 Angul Ganjam Gajapati K alahandi Nowapara K eonjhar K oraput Malkangiri Nabarangpur R ayagada Mayurbhanj P hulbani B oudh 23 P uri 24 K hordha 25 Nayagarh 26 S ambalpur B aragarh 28 Deogarh 29 J hars uguda 30 S undargarh // 57 //-
71 Sl. No District A=Area in '000ha. Y=Yield in Kg./ha. P=Production in '000 MTs. MUS TAR D LINSEED RABI RABI A Y P A Y P 1 Balas ore Bhadrak Bolangir S onepur C uttack Jagats ingpur Jajpur Kendrapara Dhenkanal Angul Ganjam Gajapati Kalahandi Nowapara Keonjhar Koraput Malkangiri Nabarangpur R ayagada Mayurbhanj P hulbani Boudh P uri Khordha Nayagarh S ambalpur Baragarh Deogarh Jhars uguda S undargarh // 58 //-
72 Sl. No District A=Area in '000ha. Y=Yield in Kg./ha. P=Production in '000 MTs. TOTAL OILSEED KHARIF RABI TOTAL A Y P A Y P A Y P 1 B alas ore B hadrak B olangir S onepur C uttack Jagats ingpur Jajpur K endrapara Dhenkanal Angul Ganjam Gajapati K alahandi Nowapara K eonjhar K oraput Malkangiri Nabarangpur R ayagada Mayurbhanj P hulbani B oudh P uri K hordha Nayagarh S ambalpur B aragarh Deogarh J hars uguda S undargarh // 59 //-
73 Sl. No District A=Area in '000ha. Y=Yield in Kg./ha. P=Production in '000 bales. JUTE MESTA SUNHEMP S KHARIF KHARIF KHARIF A Y P A Y P A Y P 1 Balas ore Bhadrak Bolangir S onepur C uttack Jagats ingpur Jajpur Kendrapara Dhenkanal Angul Ganjam Gajapati Kalahandi Nowapara Keonjhar Koraput Malkangiri Nabarangpur R ayagada Mayurbhanj P hulbani Boudh P uri Khordha Nayagarh S ambalpur Baragarh Deogarh Jhars uguda S undargarh // 60 //-
74 Sl. No District A=Area in '000ha. Y=Yield in Kg./ha. P =P roduction in '000 bales. COTTON TOTAL FIBRES KHARIF KHARIF A Y P A Y P 1 Balas ore Bhadrak Bolangir S onepur C uttack Jagats ingpur Jajpur Kendrapara Dhenkanal Angul Ganjam Gajapati Kalahandi Nowapara Keonjhar Koraput Malkangiri Nabarangpur R ayagada Mayurbhanj P hulbani Boudh P uri Khordha Nayagarh S ambalpur Baragarh Deogarh Jhars uguda S undargarh // 61 //-
75 Sl. No. NAME OF THE DIS TR ICT KHARIF -// 62 //- SWEETPOTATO RABI A=Area in '000 ha. Y=Yield in Kg./ha. P=Production in '000MTs. TOTAL A Y P A Y P A Y P 1 Balas ore Bhadrak Bolangir S onepur C uttack Jagats ingpur Jajpur Kendrapara Dhenkanal Angul Ganjam Gajapati Kalahandi Nowapara Keonjhar Koraput Malkangiri Nabarangpur R ayagada Mayurbhanj P hulbani Boudh P uri Khordha Nayagarh S ambalpur Bargarh Deogarh Jhars uguda S undargarh TOTAL
76 Sl. No. NAME OF THE DIS TR ICT POTATO RABI -// 63 //- A=Area in '000 ha. Y=Yield in Kg./ha. P=Production in '000MTs. ONION A Y P A Y P 1 Balas ore Bhadrak Bolangir S onepur C uttack Jagats ingpur Jajpur Kendrapara Dhenkanal Angul Ganjam Gajapati Kalahandi Nowapara Keonjhar Koraput Malkangiri Nabarangpur R ayagada Mayurbhanj P hulbani Boudh P uri Khordha Nayagarh S ambalpur Bargarh Deogarh Jhars uguda S undargarh TOTAL N.B.: Potato Area E s timated by DE S (O) & All Vegetable Area E s timated by Director of Horticulture (O) RABI
77 Sl. No. NAME OF THE DIS TR ICT KHARIF OTHER VEGETABLES RABI -// 64 //- A=Area in '000 ha. Y=Yield in Kg./ha. P=Production in '000MTs. TOTAL A Y P A Y P A Y P 1 Balas ore Bhadrak Bolangir S onepur C uttack Jagats ingpur Jajpur Kendrapara Dhenkanal Angul Ganjam Gajapati Kalahandi Nowapara Keonjhar Koraput Malkangiri Nabarangpur R ayagada Mayurbhanj P hulbani Boudh P uri Khordha Nayagarh S ambalpur Bargarh Deogarh Jhars uguda S undargarh TOTAL
78 Sl. No. NAME OF THE DIS TR ICT KHARIF A=Area in '000 ha. Y=Yield in Kg./ha. P=Production in '000MTs. TOTAL VEGETABLES A Y P A Y P A Y P 1 Balasore Bhadrak Bolangir Sonepur C uttack Jagatsingpur Jajpur Kendrapara Dhenkanal Angul Ganjam Gajapati K alahandi Nowapara Keonjhar Koraput Malkangiri Nabarangpur R ayagada Mayurbhanj P hulbani Boudh P uri Khordha Nayagarh S ambalpur Bargarh Deogarh Jhars uguda S undargarh TOTAL // 65 //- RABI TOTAL
79 Sl. No. NAME OF THE DIS TR ICT KHARIF CHILLIES RABI -// 66 //- TOTAL A=Area in '000 ha. Y=Yield in Kg./ha. P=Production in '000MTs. CORRIENDER RABI A Y P A Y P A Y P A Y P 1 Balasore Bhadrak Bolangir S onepur C uttack Jagatsingpur Jajpur Kendrapara Dhenkanal Angul Ganjam Gajapati Kalahandi Nowapara Keonjhar Koraput Malkangiri Nabarangpur R ayagada Mayurbhanj P hulbani Boudh P uri Khordha Nayagarh S ambalpur Bargarh Deogarh J hars uguda S undargarh TOTAL
80 Sl. No. NAME OF THE DIS TR ICT GARLIC RABI -// 67 //- TURMERIC KHARIF A=Area in '000 ha. Y=Yield in Kg./ha. P=Production in '000MTs. GINGER KHARIF A Y P A Y P A Y P 1 Balasore Bhadrak Bolangir S onepur C uttack Jagatsingpur Jajpur Kendrapara Dhenkanal Angul Ganjam Gajapati Kalahandi Nowapara Keonjhar Koraput Malkangiri Nabarangpur R ayagada Mayurbhanj P hulbani Boudh P uri Khordha Nayagarh S ambalpur Bargarh Deogarh J hars uguda S undargarh TOTAL
81 Sl. No. NAME OF THE DIS TR ICT KHARIF A=Area in '000 ha. Y=Yield in Kg./ha. P=Production in '000MTs. TOTAL CONDIMENTS & SPICES RABI TOTAL A Y P A Y P A Y P 1 Balasore Bhadrak Bolangir Sonepur C uttack Jagatsingpur Jajpur Kendrapara Dhenkanal Angul Ganjam Gajapati K alahandi Nowapara K eonjhar K oraput Malkangiri Nabarangpur R ayagada Mayurbhanj P hulbani B oudh P uri K hordha Nayagarh S ambalpur B argarh Deogarh Jhars uguda S undargarh TOTAL // 68 //-
82 Sl. No. NAME OF THE DIS TR ICT SUGARCANE (Ca ne) TOBACCO A Y P A Y P -// 69 //- A=Area in '000 ha. Y=Yield in Kg./ha. P =P roduction in '000MTs. KHARIF CROPPED AREA RABI CROPPED AREA TOTAL CROPPED AREA 1 Balasore Bhadrak Bolangir Sonepur Cuttack Jagatsingpur Jajpur Kendrapara Dhenkanal Angul Ganjam Gajapati K alahandi Nowapara Keonjhar Koraput Malkangiri Nabarangpur R ayagada Mayurbhanj P hulbani Boudh P uri Khordha Nayagarh S ambalpur Bargarh Deogarh Jhars uguda S undargarh TOTAL
83 YEAR WISE AREA, YIELD RATE & PRODUCTION OF RICE FR OM A=Area in '000 hect Y=Yield in Kgs./ha. P=Production in '000 MTs Year Kharif Rabi A Y P A Y P A Y P(rice) P(Paddy) // 70 //-
84 SUGAR FACTORY WISE SUGAR PRODUCTION STATISTICS OF ORISSA FR OM T O CO-OPERATIVE R PRIVATE IT E M Aska co-operative sugar Industries, Aska Baragarh co-operative sugar Mills, Baragarh Bijayananda co-operative S ugar Mills, Bolangir T otal C o-operative Balaji Sugars & Distilleries, Baramba Nayagarh S ugar Complex Ltd, Nayagarh Sakthi Sugars Ltd, Dhenkanal Private GRAND TOTAL Year of starting Crushing Capacity (MT s /day) Year wise cane crushed in '000 MT s Year wise S ugar produced in '000MT s Year wise Sugar recovery in % // 71 //-
85 Dis tric t wis e P opulation, Dec adal growth rate, P opulation dens ity & L iterac y rate as per Population C ens us Population (in '000 Nos.) Population Population Sl. decadal Literacy Dis trict density per No. Male Female S.C. S.T growth Rate Sq.K.M rate 1 Balasore Bhadrak Balangir S onepur C uttack Jagatsingpur Jajpur Kendrapara Dhenkanal Angul Ganjam Gajapati Kalahandi Nawapara Keonjhar Koraput Malkangiri Nabarangpur R ayagada Mayurbhanj Phulbani Boudh Puri Khordha Nayagarh S ambalpur Bargarh Deogarh Jharsuguda S undargarh TOTAL AL L INDIA // 72 //-
86 Population and Agricultural Workers Year Population Average Annual E xponential Growth Rate(%) Rural Population (In Millions) Agricultural Workers Agricultural Cultivators Labourers (1) (2) (3) (4) (5) (6) (7) (82.7) (71.9) (28.1) (100.0) (82.0) (76.0) (24.0) (100.0) (80.1) (62.2) (37.8) (100.0) (76.7) (62.5) (37.5) (100.0) (74.3) (59.7) (40.3) (100.0) (72.2) (54.4) (45.6) (100.0) Notes : 1. For 2001, figures include es timated figures for thos e of the three s ub-divis ions viz. Mao Maram, Paomata and Purul of S enapati district of Manipur as census results of 2001 Census in these three s ub-divis ions were cancelled due to technical and adminis trative reas ons. 2. The 1991 C ens us could not be held owing to dis turbed conditions prevailing in Jammu & K as hmir. Hence the population figures for 1991 of Jammu & Kas hmir have been worked out by 'interpolation'. The data on workers in columns 5-7 exclude J&K. 3. The 1981 cens us could not be held in As s am. The figures for 1981 for As s am have been worked out by interpolation. The data on workers in col. 5-7 exclude Assam. 4. Figures within paranthes es in column 4 are percentages to the total population. 5. Figures within paranthes es in columns 5 and 6 are percentages to column 7. S ource: R egis trar General of India, New Delhi. -// 73 //-
87 Sl. No India/S tates/ Union T erritories S tate wise Population, Growth R ate Persons Population 2001 Males -// 74 //- Percent Decadal Females INDIA 1,028,737, ,223, ,514, Jammu & Kashmir 10,143,700 5,360,926 4,782, Himachal P rades h 6,077,900 3,087,940 2,989, P unjab 24,358,999 12,985,045 11,373, C handigarh 900, , , Uttaranchal 8,489,349 4,325,924 4,163, Haryana 21,144,564 11,363,953 9,780, Delhi 13,850,507 7,607,234 6,243, R ajasthan 56,507,188 29,420,011 27,087, Uttar P rades h 166,197,921 87,565,369 78,632, B ihar 82,998,509 43,243,795 39,754, S ikkim 540, , , Arunachal P rades h 1,097, , , Nagaland 1,990,036 1,047, , Manipur 2,293,896 1,161,952 1,131, Mizoram 888, , , T ripura 3,199,203 1,642,225 1,556, Meghalaya 2,318,822 1,176,087 1,142, As s am 26,655,528 13,777,037 12,878, W es t B engal 80,176,197 41,465,985 38,710, Jharkhand 26,945,829 13,885,037 13,060, Oris s a 36,804,660 18,660,570 18,144, C hhattis garh 20,833,803 10,474,218 10,359, Madhya P rades h 60,348,023 31,443,652 28,904, Gujarat 50,671,017 26,385,577 24,285, Daman & Diu 158,204 92,512 65, Dadra & Nagar Haveli 220, ,666 98, Maharas htra 96,878,627 50,400,596 46,478, Andhra P rades h 76,210,007 38,527,413 37,682, K arnataka 52,850,562 26,898,918 25,951, Goa 1,347, , , Laks hadweep 60,650 31,131 29, Kerala 31,841,374 15,468,614 16,372, T amil Nadu 62,405,679 31,400,909 31,004, P ondicherry 974, , , Andaman & Nicobar Is land 356, , , Notes 1. India and Manipur figures inc lude es timated figures for thos e of the three s ub-divis ions viz. Mao Maram, P aomata and P urul of S enapati dis trict of Manipur as cens us res ults of 2001 in thes e three s ub-divis ions were cancelled due to technical and administrative reasons. 2. The 1991 C ens us could not be held owing to dis turbed c onditions prevailing in Jammu & K as hmir. Hence the decadal growth rates for are bas ed on the interpolated population figures of 1991 for Jammu & Kashmir. 3. The 1981 cens us could not be held in As s am. Hence the decadal growth rates for are bas ed on the interpolated population figures of 1981 for As s am. S ource: Registrar General of India, New Delhi.
88 Annual G rowth R ate of G DP at Factor C ost in Agriculture during to All Inida (In percentage) Year At current Pirce At P rices Agriculture Agriculture, Forestry and Fishing Agriculture Agriculture, Forestry and Fishing (Q) (A) NA 9.90 NA 4.50 Source: N.B. Central S tatistical Organisation, New Delhi Q: Quick E stimate A: Advance E stimate Annual G rowth R ate of G S DP at Factor C ost in Agriculture during to Orissa Year -// 75 //- In Percentage At current Pirce At P rices Agriculture & AH Agriculture, Agriculture & AH Agriculture, A.H,Forestry and A.H,Forestry and Fishery Fishery (P ) (Q) (A) Source: Directorate of Economics & S tatistics, Orissa, Bhubaneswar N.B. P: Provisional Estimate Q: Quick E stimate A: Advance E stimate
89 Dis trict wis e number and operational holdings by All S ocial Groups of Orissa S tate during Area in hect. Sl Name of the Margianal (<1.0 ha) S mall (1-2 ha) S emi-medium(2-4ha) No District No. Area No. Area No. Area 1 Balasore Bhdrak Bolangir S onepur C uttack Jagatsingpur Jajpur Kendrapara Dhenkanal Angul Ganjam Gajapati Kalahandi Nuapara Keonjhar Koraput Malkangiri Nabarangpur R ayagada Mayurbhanj Phulbani Boudh Puri Khordha Nayagarh S ambalpur Baragarh Deogarh Jhars uguda S undargarh State // 76 //-
90 District wise number and operational holdings by during All S ocial G roups of Orissa S tate Area in hect. Sl Name of the Medium (4-10ha) Large (>10ha) All S izes Average No District No. Area No. Area No. Area size of 1 Balasore Bhdrak Bolangir S onepur C uttack Jagatsingpur Jajpur Kendrapara Dhenkanal Angul Ganjam Gajapati Kalahandi Nuapara Keonjhar Koraput Malkangiri Nabarangpur R ayagada Mayurbhanj Phulbani Boudh Puri Khordha Nayagarh S ambalpur Baragarh Deogarh J hars uguda S undargarh State // 77 //-
91 Item Rice Cereals Pulses Oilseed Estimates s of marketable surplus of R ice,c ereals, P uls es and Oils eeds from to Year Projected population (lakh) Adult equivalent (Lakhs)(88%) -// 78 //- Consumption requirement Requirement (including seed, feed & was tage) (in Lakh tonnes) Production S urplus/ Deficit (R equirement 400 gms per adult per day) (R equirement 500 gms per adult per day) (R equirement 50gms(dal)per adult per day (R e quire me nt 45gms of O ils e e ds pe r adult pe r day)
92 Sl. No District District t wise e E s stimates s of Marketable S urplus of f R ice e During P roduction Surplus / Deficit Projected Population for '(Lakhs) ) Adult Equivalent '(lakhs ) '( 88%) 1 B alas ore B hadrak B alangir S onepur C uttack Jagats ingpur Jajpur K endrapara Dhenkanal Angul G anjam G ajapati K alahandi Nawapara K eonjhar K oraput Malkangiri Nabarangpur R ayagada Mayurbhanj P hulbani B oudh P uri K hordha Nayagarh S ambalpur B argarh Deogarh Jhars uguda S undargarh ORISSAR S A The detailed Calculation are as follows C ons umption requirement '(@ 400gms /adult/day 1) P rojected population for (lakh Lakhs 2) Adult E quivalent (88% ) Lakhs 3) P er capita requiremnt per day 400 G rams 4) P er capita annual requirement 146 K gs 5) cons umption requirement Lakh tonnes 6) Add S eed,f eed & was tage (12.5% ) T otal R equirement R ice P roduction during Lakh tonnes Lakh K harif R abi Lakh tonnes 8.24 Lakh tonnes Lakh tonnes Surplus/ Deficit (R ice) = 8.17 Lakh (P addy) = tonnes ) R equirement -// 79 //- '(Inc luding s eeds feeds & wastage) Kharif Rabi Rice Paddy
93 District wise, Year wise number of villages having crop loss of 50% and above during K harif s ince 2004 to 2008 Sl. Name of the No Dis tirict No. affected No. affected No. affected No. affected No. affected Block Village Block Village Block Village Block Village Block Village 1 Balasore Bhadrak Balangir Sonepur C uttack J agats ingpur Jajpur Kendrapara Dhenkanal Angul Ganjam Gajapati K alahandi Nawapara K eonjhar Koraput Malkangiri Nabarangpur Rayagada Mayurbhanj Phulbani Boudh Puri Khordha Nayagarh Sambalpur Bargarh Deogarh Jhars uguda Sundargarh TOTAL // 80 //-
94 Sl. No Dis trict wis e Area affected >50% due to flood & mois ture s tres s duirng (Area in ha) Due to Flood Moisture S tress Distict Paddy Non- Paddy Paddy P Non-Paddy 1 Bhadrak Bolangir S onepur C uttack Jagats inghpur Jajpur Kendrapada Angul Ganjam Gajapati Kalahandi Nawapara Malkangiri Nabarangpur Mayurbhanj Boudh Puri Khordha Nayagarh // 81 //-
95 C R OP INS UR ANC E C OMPE NS ATION PAID DUR ING TO Sl. No District K harif-2006 R abi K harif-2007 R abi K harif-2008 R abi Number's benefited Amount of claim received Number's benefited Amount of claim received Number's benefited Amount of claim received Number's benefited Amount of claim received Number's benefited Amount of claim received Number's benefited Amount of claim received 1 Balasore Bhadrak Bolangir * 4 S onepur C uttack Jagats inghpur Jajpur Kendrapada Dhenkanal Angul Ganjam Gajapati * 13 Kalahandi Nawapara Keonjhar Koraput * 17 Malkangiri Nabarangpur R ayagada * 20 Mayurbhanj Phulbani Boudh Puri Khordha Nayagarh Sambalpur Bargarh Deogarh Jhars uguda S undargarh ORISSA S A // 82 //- * Figures less than lakh rupees.
96 Sl. District No Occupational Classification of Main Workers, Marginal Workers and Workers in Oris s a according to 2001 C ens us 1 Balasore Bhadrak B alangir Sonepur C uttack Jagats ingpur Jajpur Kendrapara Dhenkanal Angul Ganjam Gajapati Kalahandi Nawapara Keonjhar Koraput Malkangiri Nabarangpur Rayagada Mayurbhanj Phulbani Boudh Puri Khordha Nayagarh Sambalpur Bargarh Deogarh Jhars uguda Sundargarh TOTAL // 83 //- Main workers Cultiva- Agricultural Household tors labourers industry Other workers Marginal workers worke rs
97 Dis trict wis e other Puls es Area (K harif & R abi) during (Area in '000 ha.) Kharif Rabi Grand Sl District Country Baragudi C.bean Bargudii Local Lathyrus No. Beans Chana 1 Balasore Bhadrak Balangir S onepur C uttack Jagatsingpur Jajpur Kendrapara Dhenkanal Angul Ganjam Gajapati Kalahandi Nawapara Keonjhar Koraput Malkangiri Nabarangpur R ayagada Mayurbhanj Phulbani Boudh Puri Khordha Nayagarh Sambalpur Bargarh Deogarh Jhars uguda S undargarh TOTAL // 84 //-
98

99
100
101
102
103 NATIONAL FOOD SECURITY MISSION National Food Security Mission is being implemented in twenty one districts of the state from with basic strategy of promotion and extension if improved technologies on seed production, M icronutrient and soil amendments, IPM and resource conservation technology along with capacity building of the farmers, effective monitoring and better management. NFSM-Rice is operating in 15 districts and NFSM-pulses in 10 districts of the State out of which 4 districts are common. NFSM in RICE (15): Bolangir, Kalahandi, Keonjhar, Nayagrah, Jajpur, Dhenkanal, Anugul, Nuapada, M alkanagiri, Nowarangpur, Kandhamal, Boudh, Deogarh, Jharsuguda & Sudargarh. NFSM N in PULSES (10): Bolangir, Kalahandi, Keonjhar, Nayagarh, Baragarh, Cuttack, Ganjam, Khurda, Puri and Rayagada. In the first year i.e an amount of Rs lakh has been allocated to the State of which Rs lakh has been spent for taking up various programmes and Rs lakh has been revalidated for Similarly, during an amount of Rs lakh has been released to the State of which Rs lakh has been spent for taking up various interventions. The details are given below. DETAILS OF FINANCIAL PROGRESS UNDER NFSM Name of the Scheme Approved allocation by GOI Allocation as per revised action plan Unspent amount revalidated on Amount released by GOI and received by State funds for Fig Rs. R In Lakh) Expenditure NFSM-Rice NFSM-Pulses Local Intitiative Media-Publicity // 90 //-
104 HIGHLIGHTS OF NFSM ( ) 09) NFSM -Rice Demonstr ation on a) SRI acres b) Hybrid acres c) Improved Package of Practices acres 456 Nos of Farmer Field Schools have been conducted Nos (5Kg) of minikits have been distributed Qtls of Cert. Seeds distributed ha under liming for soil acidity amelioration. P.P. Chemicals have been provided at subsidy for pest control in about ha Nos of Pumpsets have been provided at subsidy Nos of Cono W eeders & other implements have been provided at subsidised cost. Local Initiatives Community Nursery 200 Acs. Community Threshing Floor 110 Nos NFSM -Pulses hectares have been treated with Gypsum for soil amelioration ha treated with micronutrients Ha under IPM measures 5958 Qtls of cert. seeds distributed 336 Nos of Farmer Field School 1836 Nos of Sprinkler sets 7424 Nos of Pumpsets Nos of Sprayers Local Inita tives 1933 Acs demonstration under Pyra crop M anagement. 100 Nos Community Threshing Floor. Media & Publicity Wide Publicity through T.V., Radio & other IEC materials and other mass communication methods have been resorted to. -// 91 //-
105 D.C.P. DUR ING 2005 to 2008 (Area in hect.) Name of the Crop Achievement Agriculture Crops Maize R agi Cereal Mung Biri Arhar C owpea Other Pulses T otal Pulses Foodgrain Groundnut Til Niger Sunflower Other Oils eeds T otal Oilseeds Fiber S ugarcane T otal Agril.C rops Horticulture crops vegetables S pices Other Hort.C rops Hort. Crops Grand // 92 //-
106 District wise Area covered under Mixed cropping during 2008 Sl. No Name of the District P addy + Arhar + Maize Groun dnut + Arhar Mung + Biri + Arhar G.Nut + Mesta Paddy + Mesta G.Nut + Mung Cowpe a + Maize Arhar + Cotton (Area in ha.) Paddy Cotton + + Mung Biri + Biri Balasore 16 2 Bhadrak 3 Bolangir S onepur Cuttack 6 Jagats inghpur 7 Jajpur 8 Kendrapada 9 Dhenkanal Angul Ganjam Gajapati Kalahandi Nuapada Keonjhar Koraput Malkangiri Nawarangpur R ayagada Mayurbhanj Phulbani Boudh Puri 24 Khordha 25 Nayagarh 26 S ambalpur Bargarh Deogarh Jharsuguda S undargarh // 93 //-
107 Sl. No District wise Area covered under Mixed cropping during 2008 Name of the Arhar + Fruits Fruits Fruits Fruits Maize Paddy District Ragi/ Jowar Pulses Spices Fibers Veget. Arhar Jowar (Area in ha.) Paddy + Discori a Balasore 16 2 Bhadrak 0 3 Bolangir Sonepur C uttack 0 6 Jagats inghpur 0 7 Jajpur 0 8 Kendrapada 0 9 Dhenkanal Angul Ganjam Gajapati Kalahandi Nuapada Keonjhar Koraput Malkangiri Nawarangpur R ayagada Mayurbhanj Phulbani Boudh Puri 0 24 Khordha 0 25 Nayagarh 0 26 S ambalpur Bargarh Deogarh Jhars uguda S undargarh // 94 //-
108 R evenue District & DDA R ange wise Agriculture Distirct with Number of B lock,gp & V illages of OR IS S A S tate. Sl. Name of the Name of the Name of the Agriculture Name of the Number of No Revenue District DDA R ange District Blocks GP Village Balasore Balasore 1.Balasore 1.B alasore R emuna B asta J a leswa r 1.B hograi B aliapal Jaleswar Nilagiri 1.Nilagiri 25 2.Oupada S imulia 1.S imulia K haira S oro 1.S oro B ahanaga Balasore Bhadrak Bhadrak 1.B ha dra k 1.B hadrak Tihidi Chandbali B asudevpur Dha mna ga r 1.Dhamnagar B handaripokhari B onth Bhadrak B olangir Bolangir 1.Bolangir 1. B olangir P uintala Loisinga Deogaon Agalpur Gudvela P a tna ga rh 1.P atnagarh B elpada K haparakhol Titilagarh 1.Titilagarh S aintola B angomunda Muribahal Tureikela Bolangir Subarnapur Subarnapur 1.Biramaharajpur 1.B iramaharajpur Ullunda Dunguripali 1.B inika Dunguripali S uba rna pur 1.S onepur Tarava Subarnapur // 95 //-
109 5 C uttac k C uttac k 1.Athagarh 1.Athagarh Tigiria B aramba Nars ingpur B anki 1.B anki B anki-dampada Cutta ck 1.Cuttacks S adar B aranga Niali K antapada S alipur 1.S alipur Nis hintakoil Tangi-choudwar Mahanga C utta ck J.S ingpur J.Singpur 1.Jagatsingpur 1. J agats ingpur B iridi B alikuda Nuagaon R aghunathpur Tirtol 1.Tirtol E rs ama K ujanga Jagatsingpur Jajpur Jajpur 1.Dharmasala 1.B ari R as ulpur Dharmas ala B archana J ajpur 1. J ajpur Das hrathpur B injharpur J ajpurr oad 1.Danagadi S ukinda K orei Jajpur K endrapara Kendrapara 1.Kendrapada 1.K endrapada Derabis i Marshaghai 1.Mars haghai Mahakalapada Garadpur P a tta munde i 1.P attamundei Aul R ajkanika R ajnagar Kendrapara Dhenkanal Dhenkanal 1.Kamakhyanagar 1.K amakhyanagar P arjanga B huban K ankadahada Dhenkanal 1.Dhenkanal Odapada Gandia Hindol Dhenkanal // 96 //-
110 10 Angul Angul 1.Athamallick 1.Athamallick K is horenagar Angul 1.Angul B anarpal Chhendipada Talcher 1.Talcher K ania P allahara Angul Ganjam Ganjam 1.Aska 1.As ka S ergarh Dharakote S oroda B erhampur 1.B erhampur Chikiti R angeilunda B hanjanagar 1.B hanjanagar B elaguntha B uguda Jagannathpras ad Chhatrapur 1.Chhatrapur Ganjam P urus otampur Hinjilikatu Digapahandi 1.Digapahandi S anakhemundi K ukudakhandi Khalikote 1.K halikote B eguniapada K.S urayanagar P olas ara Ganjam G ajapati Gajapati 1.Paralakhemundi 1.P aralakhemundi K as inagar Guma R ayagada R.Udayagiri 1.R.Udayagiri Mohana Nuagada Gajapati K alahandi K alahandi 1.Bhawanipatn 1.B hawanipatna K es inga T.R ampur Dharmagarh 1.Dharmagarh K oks ara Golamunda J unagarh 1.Junagarh K alampur Jaipatna Narla 1.Narla M.R ampur K arlamunda Lanjigarh Kalahandi // 97 //-
111 14 Nuapara Nuapara 1.K hariar 1.K hariar S inapali Nuapada 1.Nuapada K omna B oden Nuapara K eonjhar Keonjhar 1.Anandapur 1.Anandapur Ghasipura Hatadihi Champua 1.Champua Jhumpura Joda Ghatagaon 1.Ghatagaon P atna Harichandanpur Keonjhar 1.K eonjhar S aharpada Telkoi B anspal Keonjhar Koraput Koraput 1.J eypore 1.Jeypore K otpad B origuma B oipariguda K undra K oraput 1.K oraput Dasmantpur S emiliguda Nandapur 1.P attangi Nandapur Lamtaput Narayanpatna 1.Laxmipur Narayanpatna B andhugaon Koraput Malkangir Malkangir 1.Govindpalli 1.K hairaput K udumuluguma Kalimela 1.K alimela P odia Malkangiri 1.Malkangiri Mathili K orkunda Malkangir Nowrangpur Nowrangpur 1.Nawarangpur 1.Nawarangpur Nandahandi Tentulikhunti P apadahandi 1.K osagumuda P apadahandi Dabugaon Umerkote 1.Umerkote R aighar Chandahandi Jharigaon Nowrangpur // 98 //-
112 19 Rayagada Rayagada 1.Gunupur 1.Gunupur P admapur R amnaguda Gudari Muniguda 1.Muniguda B is s amkataka Chandrapur R ayagada 1.R ayagada K olnara K. S ingpur K as ipur Rayagada Mayurbhanj Mayurbhanj 1.Bahalda 1.B ahalda Tiringi Jamoda Bangiriposi 1.B angiripos i K uliana S aras kana Baripada 1.B aripada S hyamakhunta S uliapada Betnati 1.B etnati B adas ahi R as gobindpur Morda J ashipur 1.Jas hipur R aruan Karanjia 1.K aranjia Thakurmunda S ukruli R airangpur 1.R airangpur B ijatola B is oi K us umi Udala 1.Udala K hunta-i K hunta-ii K aptipada Mayurbhanj Phulbani Phulbani 1.Baliguda 1.B aliguda K otagarh Tumudibandha G.Udayagiri 1.G.Udayagiri R aikia Tikabali Chakapada Nuagaon 1.K.Nuagaon Daringibadi P hulbani 1.P hulbani P hiringia K hajuripada Phulbani // 99 //-
113 22 Boudh Boudh 1.Boudh 1.Boudh Kantamal Harbhanga Boudh Puri Puri 1.Nimapara 1.Nimapara Gop Kakatpur Astaranga P uri 1.P uri Bramhagiri Krushnaprasad S akhigopal 1.P ipli S atyabadi Kanas Delanga Puri Khurda Khurda 1.Bhubaneswar 1.Bhubaneswar Jatni Balianta Balipatna Khurda 1.Khurda Begunia Bolagarh Tangi 1.Tangi C hilika Banpur Khurda Nayagarh Nayagarh 1.Daspalla 1.Daspalla Gania Nuagaon Nayagarh 1.Nayagarh Odagaon R anpur Khandapara Bhapur Nayagarh Sambalpur Sambalpur 1.Kuchinda 1.Kuchinda Bamara Jamankira R airakhola 1.R airakhola Naktideul S ambalpur 1.S ambalpur Maneswar Jujumura R engali Sambalpur // 100 //-
114 27 B aragarh Baragarh 1.Baragarh 1.B aragarh B heden B arpali B hatli 1.Attabira B hatili Ambabhona P admapur 1.P admapur P aikmal Jharbandha S ohela 1.S ohela B ijepur Gais let Baragarh Deogarh Deogarh 1.Deogarh 1.R eamal Tileibani B arkote Deogarh Jharsuguda Jharsuguda 1.Jharsuguda 1.Jhars uguda Lakhanpur K olabira 1.K olabira K irimira Laikera Jharsuguda Sundargarh Sundargarh 1.B onai 1.B onai Lahunipada 17 3.K oida G urundia 13 2.Lephripada 1. Lephripda Hemgiri Tangarpalli P anposh 1.Lathikata Nuagaon K uarmunda B is ra R ajgangapur 1.R ajgangpur K utra B aragaon S undargarh 1.S undargarh B alis ankara S ubdega S undargarh : // 101 //-
115 Sl. No. District Block ADMINISTRATIVE SET-UP (ORISSA) GP Village Sub.- Division -// 102 //- No. of Tahasils Municipality/ Municipal NAC Assembly Constituen 1 Balasore Bhadrak Bolangir Sonepur C uttack Jagats inghpur Jajpur Kendrapada Dhenkanal Angul Ganjam Gajapati Kalahandi Nuapada Keonjhar Koraput Malkangiri Nabarangpur R ayagada Mayurbhanj Phulbani Boudh Puri Khordha Nayagarh S ambalpur Bargarh Deogarh Jhars uguda S undargarh ORISSA A.I.S., Bhubaneswar, April ,500
116
DISTRICT WISE AREA, YIELD & PRODUCTION OF DIFFERENT CROPS FOR
 GOVERNMENT OF ORISSA DISTRICT WISE AREA, YIELD & PRODUCTION OF DIFFERENT CROPS FOR 2006-07 STATISTICS SECTION DIRECTORATE OF AGRICULTURE & FOOD PRODUCTION Orissa, Bhubaneswar C O N T E N T S Sl Subject
DISTRICT PROFILE OF ANGUL
 DISTRICT PROFILE OF ANGUL INTRODUCTION : Angul district came into existence as a separate district consequent upon reorganization of districts in Orissa on 1st April 1993,clothed with lush green forests.
GOVERNMENT OF ODISHA DISTRICT STATISTICAL HANDBOOK KHORDHA 2015 DISTRICT PLANNING AND MONITORING UNIT KHORDHA. ( Price : Rs.25.
 GOVERNMENT OF ODISHA DISTRICT STATISTICAL HANDBOOK KHORDHA 2015 DISTRICT PLANNING AND MONITORING UNIT ( Price : Rs.25.00 ) KHORDHA CONTENTS Table No. SUBJECT PAGE ( 1 ) ( 2 ) ( 3 ) Socio-Economic Profile
GOVERNMENT OF ODISHA DISTRICT STATISTICAL HANDBOOK MAYURBHANJ 2015 DISTRICT PLANNING AND MONITORING UNIT MAYURBHANJ. ( Price : Rs.25.
 GOVERNMENT OF ODISHA DISTRICT STATISTICAL HANDBOOK MAYURBHANJ 2015 DISTRICT PLANNING AND MONITORING UNIT ( Price : Rs.25.00 ) MAYURBHANJ CONTENTS Table No. SUBJECT PAGE ( 1 ) ( 2 ) ( 3 ) Socio-Economic
THIS REPORT CONTAINS ASSESSMENTS OF COMMODITY AND TRADE ISSUES MADE BY USDA STAFF AND NOT NECESSARILY STATEMENTS OF OFFICIAL U.S.
 THIS REPORT CONTAINS ASSESSMENTS OF COMMODITY AND TRADE ISSUES MADE BY USDA STAFF AND NOT NECESSARILY STATEMENTS OF OFFICIAL U.S. GOVERNMENT POLICY Required Report - public distribution Oilseeds and Products
Wheat Marketing Situation
 Wheat Marketing Situation Prepared by: Darrell L. Hanavan Executive Director Colorado Wheat Administrative Committee If you would like to receive an email when this report is updated, email gmostek@coloradowheat.org
India. Oilseeds and Products Update. February 2012
 THIS REPORT CONTAINS ASSESSMENTS OF COMMODITY AND TRADE ISSUES MADE BY STAFF AND NOT NECESSARILY STATEMENTS OF OFFICIAL U.S. GOVERNMENT POLICY Required Report - public distribution India Oilseeds and Products
FOR IMMEDIATE RELEASE
 Article No. 5842 Available on www.roymorgan.com Roy Morgan Unemployment Profile Thursday, 2 October 2014 Unemployment climbs to 9.9% in September as full-time work lowest since October 2011; 2.2 million
FOR IMMEDIATE RELEASE
 Article No. 7353 Available on www.roymorgan.com Roy Morgan Unemployment Profile Wednesday, 11 October 2017 2.498 million Australians (18.9%) now unemployed or under-employed In September 1.202 million
CONTENTS. Landline Capacity and DEL status [Upto ] 2. WLL Status 3. EVDO, NIC_IFWT, RUIM and WI-MAX Connections 4.
![CONTENTS. Landline Capacity and DEL status [Upto ] 2. WLL Status 3. EVDO, NIC_IFWT, RUIM and WI-MAX Connections 4.](/thumbs/84/90677741.jpg "CONTENTS. Landline Capacity and DEL status [Upto ] 2. WLL Status 3. EVDO, NIC_IFWT, RUIM and WI-MAX Connections 4.") CONTENTS 1 Basic Service Land Line Landline Capacity and DEL status 1 Exch Conversion/ Exch opened/ Exch closed List during 2016-17 [Upto 31.07.2016] 2 2 Basic Service WLL WLL Status 3 EVDO, NIC_IFWT,
CONTENTS 1 Basic Service Land Line Landline Capacity and DEL status 1 Exch Conversion/ Exch opened/ Exch closed List during 2016-17 [Upto 31.07.2016] 2 2 Basic Service WLL WLL Status 3 EVDO, NIC_IFWT,
FOR IMMEDIATE RELEASE
 Article No. 7845 Available on www.roymorgan.com Roy Morgan Unemployment Profile Friday, 18 January 2019 Unemployment in December is 9.7% and under-employment is 8.8% FOR IMMEDIATE RELEASE Australian unemployment
Impact of Rising Energy Costs on the Food System in Indonesia
 Impact of Rising Energy Costs on the Food System in Indonesia Ronnie S. Natawidjaja, Ph.D. Center for Agricultural Policy an Agribusiness Studies Padjadjaran University The Pacific Food System Outlook
PRESENTATION ON STRATEGIC APPROACH TOWARDS WIND SOLAR HYBRID SYSTEMS (SWES) FOR REMOTE TELECOM SITES IN INDIA & CASE STUDY OF RAJASTHAN
 FOR REMOTE TELECOM SITES IN INDIA & CASE STUDY OF RAJASTHAN") PRESENTATION ON STRATEGIC APPROACH TOWARDS WIND SOLAR HYBRID SYSTEMS (SWES) FOR REMOTE TELECOM SITES IN INDIA & CASE STUDY OF RAJASTHAN WORKSHOP ON SMALL WIND ENERGY AND HYBRID SYSTEMS & ITS RELEVANCE
PRESENTATION ON STRATEGIC APPROACH TOWARDS WIND SOLAR HYBRID SYSTEMS (SWES) FOR REMOTE TELECOM SITES IN INDIA & CASE STUDY OF RAJASTHAN WORKSHOP ON SMALL WIND ENERGY AND HYBRID SYSTEMS & ITS RELEVANCE
Consumer Price Index
 Series No.: SDT : 23-382 KINGDOM OF Consumer Price Index Statistical Bulletin SEPTEMBER 2018 Website: E-mail : Statistics Department P.O. Box 149 Nuku alofa Kingdom of Tonga www.spc.int/prism/tonga/ dept@stats.gov.to
Solomon Islands Government. Statistical Bulletin: 11/2011. HONIARA CONSUMER PRICE INDEX (June 2011)
") Solomon Islands Government Statistical Bulletin: 11/2011 HONIARA CONSUMER PRICE INDEX (June 2011) Solomon Islands National Statistics Office Ministry of Finance & Treasury PO Box G6 Honiara Enquiries:
Solomon Islands Government Statistical Bulletin: 11/2011 HONIARA CONSUMER PRICE INDEX (June 2011) Solomon Islands National Statistics Office Ministry of Finance & Treasury PO Box G6 Honiara Enquiries:
Mining and quarrying 13,503 19,062 26,170 35,190 38,511 53,515 74,386 85,792 99, ,422
 Table A1.1: Gross Domestic Product (GDP), at Factor Cost by kind of Economic Activity at Current Prices,Tanzania Mainland, 1992-2001 Millions of TZS Activity 1992 1993 1994 1995 1996 1997 1998 1999 2000
D G A G R I D A S H B O A R D : A P P L E S
 75 79 60 56 49 74 65 59 54 42 76 63 58 53 78 55 42 43 79 44 81 63 47 83 64 59 53 48 Sources: Eurostat, MSs notifications, DG Agri, Comext, Comtrade, GTA, ITC, AMI, Expert groups, Freshfel, Wapa. 89 68
Commercial-in-Confidence Ashton Old Baths Financial Model - Detailed Cashflow
 Year 0 1 2 3 4 5 6 7 8 9 10 11 12 13 Oct-16 Nov-16 Dec-16 Jan-17 Feb-17 Mar-17 Apr-17 May-17 Jun-17 Jul-17 Aug-17 Sep-17 Oct-17 2,038 2,922 4,089 4,349 6,256 7,124 8,885 8,885 8,885 8,885 8,885 8,885 9,107
Prospects for EU agricultural markets and income
 European Commission, DG Agriculture and Rural Development December 2014 http://ec.europa.eu/agriculture/markets-and-prices/medium-term-outlook/index_en.htm Baseline assumptions on key macroeconomic variable,
All Departments of Government / All Heads of Departments / All State Owned Corporations & Undertakings including GRIDCO.
 To DIRECTORATE OF EXPORT PROMOTION AND MARKETING, ODISHA, ASHOKA MARKET COMPLEX, 2 ND FLOOR, BHUBANESWAR - 751009. **** VIEMM-17/2013-4544 (200) /EPM, dt. 12.05.2015 All Departments of Government / All
FOR IMMEDIATE RELEASE
 Article No. 6928 Available on www.roymorgan.com Roy Morgan Unemployment Profile Wednesday, 17 August 2016 Australian real unemployment jumps to 10.5% (up 0.9%) in July during post-election uncertainty
FOR IMMEDIATE RELEASE
 Article No. 7761 Available on www.roymorgan.com Roy Morgan Unemployment Profile Monday, 8 October 2018 Unemployment down to 9.4% in September off two-year high Australian employment has grown solidly over
Date of Birth Education al Qualificati on. SC 23/May/1959 HSC 1/Feb/1980 1/Feb/1980 Dist-Koraput
 GRADATION LIST OF JUNIOR CLERK (DIVI Name of Junior Clerk with Home District Categ ory Date of Birth Education al Qualificati on Date of Entry into the Dept. 1 2 3 4 5 6 7 SL No. Date of Entry as Junior
The Malaysian Fertilizer Market
 The Malaysian Fertilizer Market MOHD TOHIT BIN LIRI Chairman, Fertilizer Industry Association of Malaysia (FIAM) CONTENT 1. Introduction 2. Fertilizer Industry Association of Malaysian (FIAM) 3. The Malaysian
Total Production by Month (Acre Feet)
") Production by Month (acre-feet) 2008 2009 2010 2011 2012 2013 2014 2015 2016 January 25 339.10 228.90 249.50 297.99 243.06 327.14 247.66 212.37 February 234.00 218.80 212.10 241.52 245.82 279.08 234.16
Production by Month (acre-feet) 2008 2009 2010 2011 2012 2013 2014 2015 2016 January 25 339.10 228.90 249.50 297.99 243.06 327.14 247.66 212.37 February 234.00 218.80 212.10 241.52 245.82 279.08 234.16
[Amounts in millions of dollars] Nondurable. Total. goods. equipment 34,415 30,717 24,506 8,868 9,566 8,981
![[Amounts in millions of dollars] Nondurable. Total. goods. equipment 34,415 30,717 24,506 8,868 9,566 8,981](/thumbs/92/109418289.jpg "[Amounts in millions of dollars] Nondurable. Total. goods. equipment 34,415 30,717 24,506 8,868 9,566 8,981") 1970 TABLE C-44. Manufacturers 1 new and unfilled orders, 1947-69 Unfilled orders2 Unfilled orders-shipments Machinery and equipment 1947.. 1948.. 1949.. 23,53.3 3 3 4 3 1961 * 31,085 15,698 17,026 18,522
1970 TABLE C-44. Manufacturers 1 new and unfilled orders, 1947-69 Unfilled orders2 Unfilled orders-shipments Machinery and equipment 1947.. 1948.. 1949.. 23,53.3 3 3 4 3 1961 * 31,085 15,698 17,026 18,522
REPUBLIC OF BULGARIA MINISTRY OF ECONOMY, ENERGY AND TOURISM
 Important notice: this report has been submitted in the language of the Member State, which is the sole authentic version. Translation into the English language is being provided for information purposes
Appendix E Water Supply Modeling
 Supply Modeling Modesto Irrigation District Treatment Plant Expansion Project Modeling I. Introduction The Modesto Irrigation District (MID) is situated adjacent to and north of the Tuolumne River. Over
Western Electricity Supply Company of Orissa Ltd., Burla, Sambalpur , Orissa
 Western Electricity Supply Company of Orissa Ltd., Burla, Sambalpur-768017, Orissa Publication of Applications u/s 64(2) of the Electricity Act, 2003, read with Reg. 53(7) of the OERC (Conduct of Business)
Castor Seed &Oil Monthly Research Report
 Castor Seed &Oil Monthly Research Report Contents Outlook and Review Recommendations Seed Supply & Demand Oil Supply & Demand Domestic Market Fundamentals Technical Analysis (Futures Market) Castor Seed
WATER USE AND SUITABILITY OF JATROPHA CURCAS AS A BIOFUEL FEEDSTOCK CS Everson 1, M Mengistu 1 and M Gush 2
 WATER USE AND SUITABILITY OF JATROPHA CURCAS AS A BIOFUEL FEEDSTOCK CS Everson 1, M Mengistu 1 and M Gush 2 1 Centre for Water Resources Research, UKZN 2 Natural Resources and the Environment, CSIR. Background
CREDIT UNION ESTIMATES
 MONTHLY CREDIT UNION ESTIMATES Prepared January 2, 2019 by Credit Union National Association Economics and Statistics Department cuna.org/mcue Loans Credit union loans outstanding grew 0.6% in, compared
D G A G R I D A S H B O A R D : A P P L E S
 Sources: Eurostat, MSs notifications, DG Agri, Comext, Comtrade, GTA, ITC, AMI, Expert groups, Freshfel, Wapa. 000 tonnes 39 41 31 22 29 22 32 27 17 18 9 27 15 12 6 6 6 4 5 6 5 4 11 25 15 9 9 93 62 51
FOR IMMEDIATE RELEASE
 Article No. 7137 Available on www.roymorgan.com Roy Morgan Unemployment Profile Wednesday, 8 February 2017 Over 12 million Australians have jobs for the first time including over 8 million full-time jobs,
September 2016 Water Production & Consumption Data
 September 2016 Water Production & Consumption Data September 2016 monthly water production (288.48 AF) was lowest in at least 17 years. Monthly water production has increased slightly each month since
FOR IMMEDIATE RELEASE
 Article No. 7433 Available on www.roymorgan.com Roy Morgan Unemployment Profile Friday, 12 January 2018 2.6m Australians unemployed or under-employed in December The latest data for the Roy Morgan employment
CREDIT UNION ESTIMATES
 MONTHLY CREDIT UNION ESTIMATES Prepared September 28, 2018 by Credit Union National Association Economics and Statistics Department cuna.org/mcue Loans Credit union loans outstanding grew 1.0% in, compared
Design Criteria Data
 OKLAHOMA CITY OK Latitude = 35.4 N WMO No. 72353 Longitude = 97.6 W Elevation = 133 feet Period of Record = 1973 to 1996 Average Pressure = 28.62 inches Hg Design Criteria Data Mean Coincident (Average)
CREDIT UNION ESTIMATES
 MONTHLY CREDIT UNION ESTIMATES Prepared November 1, 2017 by Credit Union National Association Economics and Statistics Department cuna.org/mcue Loans Credit union loans outstanding grew 0.7% in, compared
CREDIT UNION ESTIMATES
 MONTHLY CREDIT UNION ESTIMATES Prepared September 4, 2018 by Credit Union National Association Economics and Statistics Department cuna.org/mcue Loans Credit union loans outstanding grew 1.1% in, compared
CREDIT UNION ESTIMATES
 MONTHLY CREDIT UNION ESTIMATES Prepared March 4, 2019 by Credit Union National Association Economics and Statistics Department cuna.org/mcue Loans Credit union loans outstanding grew 0.3% in January, compared
THIS REPORT CONTAINS ASSESSMENTS OF COMMODITY AND TRADE ISSUES MADE BY USDA STAFF AND NOT NECESSARILY STATEMENTS OF OFFICIAL U.S.
 THIS REPORT CONTAINS ASSESSMENTS OF COMMODITY AND TRADE ISSUES MADE BY USDA STAFF AND NOT NECESSARILY STATEMENTS OF OFFICIAL U.S. GOVERNMENT POLICY Required Report - public distribution Date: GAIN Report
Design Criteria Data
 MEDFORD/JACKSON CO. OR Latitude = 42.37 N WMO No. 72597 Longitude =122.8 W Elevation = 1329 feet Period of Record = 1973 to 1996 Average Pressure = 28.61 inches Hg Design Criteria Data Mean Coincident
CREDIT UNION ESTIMATES
 MONTHLY CREDIT UNION ESTIMATES Prepared February 1, 2018 by Credit Union National Association Economics and Statistics Department cuna.org/mcue Loans Credit union loans outstanding grew 1.0% in, compared
CREDIT UNION ESTIMATES
 MONTHLY CREDIT UNION ESTIMATES Prepared March 2, 2018 by Credit Union National Association Economics and Statistics Department cuna.org/mcue Loans Credit union loans outstanding grew 0.7% in, compared
IMPERIAL IRRIGATION DISTRICT WATER DEPARTMENT
 IMPERIAL IRRIGATION DISTRICT WATER DEPARTMENT MONTHLY CROP ACREAGE REPORT December 11, Acreage This Month Acreage Same Month Last Year Difference From Last Year ALFALFA (all) 140,622 135,757 4,865 4% WHEAT
Design Criteria Data
 DES MOINES IA Latitude = 41.53 N WMO No. 72546 Longitude = 93.65 W Elevation = 965 feet Period of Record = 1973 to 1996 Average Pressure = 28.96 inches Hg Design Criteria Data Mean Coincident (Average)
Drought Forecast to Reduce Australian Rapeseed Exports in 2007
 United States Department of Agriculture Foreign Agricultural Service Circular Series FOP 11-06 November 2006 Drought Forecast to Reduce Australian Rapeseed Exports in 2007 1800 1600 1400 1200 1000 800
IMPERIAL IRRIGATION DISTRICT WATER DEPARTMENT
 IMPERIAL IRRIGATION DISTRICT WATER DEPARTMENT MONTHLY CROP ACREAGE REPORT March 13, Acreage This Month Acreage Same Month Last Year Difference From Last Year ALFALFA (all) 136,792 138,472 (1,68) -1% WHEAT
May ATR Monthly Report
 May ATR Monthly Report Minnesota Department of Transportation Office of Transportation Data and Analysis May 2011 Introduction The purpose of this report is to examine monthly traffic trends on Minnesota
Design Criteria Data
 LAS VEGAS/MCCARRAN NV Latitude = 36.8 N WMO No. 72386 Longitude =115.1 W Elevation = 2179 feet Period of Record = 1973 to 1996 Average Pressure = 27.67 inches Hg Design Criteria Data Mean Coincident (Average)
Design Criteria Data
 PHOENIX/SKY HARBOR AZ Latitude = 33.43 N WMO No. 72278 Longitude =112. W Elevation = 116 feet Period of Record = 1973 to 1996 Average Pressure = 28.72 inches Hg Design Criteria Data Mean Coincident (Average)
USDA Agricultural Outlook Forum 2007
 USDA Agricultural Outlook Forum 2007 EU BIOFUELS POLICY AND EFFECTS ON PRODUCTION, CONSUMPTION AND LAND USE FOR ENERGY CROPS Hilkka Summa Head of Unit for Bioenergy, Biomass, Forestry and Climate Change
Jatropha curcas. Prof. K.S. Neelakantan, I.F.S. Dean Forest College & Research institute
 Jatropha curcas Prof. K.S. Neelakantan, I.F.S. Dean Forest College & Research institute BIODIESEL Dr.Rudolf Diesel 1895 Peanut oil The use of vegetable oils for engine fuel may seem insignificant today.
CREDIT UNION ESTIMATES
 MONTHLY CREDIT UNION ESTIMATES Prepared June 1, 2018 by Credit Union National Association Economics and Statistics Department cuna.org/mcue Loans Credit union loans outstanding grew 1.1% in, matching the
Monthly vfff Report on Oilseeds
 Page 1 Market Movements ahead Domestic Fundamentals: Soybean futures (May) S2 S1 Pivot R1 R2 3599 3671 3752 3824 3905 In days to come, we may see an upside momentum in soybean futures (May) as it can test
CREDIT UNION ESTIMATES
 MONTHLY CREDIT UNION ESTIMATES Prepared July 2, 2018 by Credit Union National Association Economics and Statistics Department cuna.org/mcue Loans Credit union loans outstanding grew 1.3% in, compared to
TABLE C-43. Manufacturers' new and unfilled orders, {Amounts in millions of dollars] Nondurable. Capital goods. Total. goods.
![TABLE C-43. Manufacturers' new and unfilled orders, {Amounts in millions of dollars] Nondurable. Capital goods. Total. goods.](/thumbs/93/112603708.jpg "TABLE C-43. Manufacturers' new and unfilled orders, {Amounts in millions of dollars] Nondurable. Capital goods. Total. goods.") TABLE C-43. Manufacturers' new and unfilled orders, -74 {Amounts in millions of dollars] New orders t, I960. 27, 559 26, 903 30,672 30,115 31,086 33,005 35,322 37,952 41, 803 45, 944 46,763 50, 243 53,
TABLE C-43. Manufacturers' new and unfilled orders, -74 {Amounts in millions of dollars] New orders t, I960. 27, 559 26, 903 30,672 30,115 31,086 33,005 35,322 37,952 41, 803 45, 944 46,763 50, 243 53,
CREDIT UNION ESTIMATES
 MONTHLY CREDIT UNION ESTIMATES Prepared May 1, 2018 by Credit Union National Association Economics and Statistics Department cuna.org/mcue Loans Credit union loans outstanding grew 1.1% in, compared to
3. Atmospheric Supply of Nitrogen to the Baltic Sea in 2009
 3. Atmospheric Supply of Nitrogen to the Baltic Sea in 2009 Nitrogen emission data, as well as the model results presented here have been approved by the 35 th Session of the Steering Body of EMEP in Geneva
Design Criteria Data
 MINOT AFB ND Latitude = 48.42 N WMO No. 727675 Longitude =11.3 W Elevation = 1667 feet Period of Record = 1967 to 1996 Average Pressure = 28.16 inches Hg Design Criteria Data Mean Coincident (Average)
CREDIT UNION ESTIMATES
 MONTHLY CREDIT UNION ESTIMATES Prepared August 1, 2018 by Credit Union National Association Economics and Statistics Department cuna.org/mcue Loans Credit union loans outstanding grew 1.3% in, matching
Crop Market Outlook 8/22/2017
 MSU is an affirmativeaction, equal-opportunity employer. Michigan State University Extension programs and materials are open to all without regard to race, color, national origin, gender, gender identity,
Preliminary Steel Imports Decline 9% in September Import Market Share at 20%
 News Release FOR IMMEDIATE RELEASE October 25, 2011 CONTACT: NANCY GRAVATT 202.452.7115/ ngravatt@steel.org Preliminary Steel Imports Decline 9% in September Import Market Share at 20% Washington, D.C.
COMPARISON OF FIXED & VARIABLE RATES (25 YEARS) CHARTERED BANK ADMINISTERED INTEREST RATES - PRIME BUSINESS*
 CHARTERED BANK ADMINISTERED INTEREST RATES - PRIME BUSINESS*") COMPARISON OF FIXED & VARIABLE RATES (25 YEARS) 2 Fixed Rates Variable Rates For Internal Use Only. FIXED RATES OF THE PAST 25 YEARS AVERAGE RESIDENTIAL MORTGAGE LENDING RATE - 5 YEAR* (Per cent) Year
COMPARISON OF FIXED & VARIABLE RATES (25 YEARS) 2 Fixed Rates Variable Rates For Internal Use Only. FIXED RATES OF THE PAST 25 YEARS AVERAGE RESIDENTIAL MORTGAGE LENDING RATE - 5 YEAR* (Per cent) Year
COMPARISON OF FIXED & VARIABLE RATES (25 YEARS) CHARTERED BANK ADMINISTERED INTEREST RATES - PRIME BUSINESS*
 CHARTERED BANK ADMINISTERED INTEREST RATES - PRIME BUSINESS*") COMPARISON OF FIXED & VARIABLE RATES (25 YEARS) 2 Fixed Rates Variable Rates FIXED RATES OF THE PAST 25 YEARS AVERAGE RESIDENTIAL MORTGAGE LENDING RATE - 5 YEAR* (Per cent) Year Jan Feb Mar Apr May Jun
COMPARISON OF FIXED & VARIABLE RATES (25 YEARS) 2 Fixed Rates Variable Rates FIXED RATES OF THE PAST 25 YEARS AVERAGE RESIDENTIAL MORTGAGE LENDING RATE - 5 YEAR* (Per cent) Year Jan Feb Mar Apr May Jun
Table 1: Yield and Income per hectare of Jatropha Cultivation in Kg and USD. Price of seed per kg. Seed Yield/ha (kg)
") JATROPHA CURCAS Extent of adoption A study by Janske (2006) on transition towards J. curcas biofuels in Tanzania, shows that farmers had planted J. curcas as a live fence. Farmers around Dar es Salaam
JATROPHA CURCAS Extent of adoption A study by Janske (2006) on transition towards J. curcas biofuels in Tanzania, shows that farmers had planted J. curcas as a live fence. Farmers around Dar es Salaam
Design Criteria Data
 BURLINGTON VT Latitude = 44.47 N WMO No. 72617 Longitude = 73.15 W Elevation = 341 feet Period of Record = 1973 to 1996 Average Pressure = 29.61 inches Hg Design Criteria Data Mean Coincident (Average)
TABLE C-42. Sales and inventories in manufacturing and trade, [Amounts in millions of dollars] Manufacturing. Inventories Ratio 3.
![TABLE C-42. Sales and inventories in manufacturing and trade, [Amounts in millions of dollars] Manufacturing. Inventories Ratio 3.](/thumbs/80/81413912.jpg "TABLE C-42. Sales and inventories in manufacturing and trade, [Amounts in millions of dollars] Manufacturing. Inventories Ratio 3.") 1970 TABLE C-4. and inventories in manufacturing, 1947-69 Inyentories i 1947 1948 1949 1950 1951 195 1953 1954 1955 1956 1957 1958 1959 35,60 54,33 5,507 59,8 70,4 7,377,1 89,05 86,9 1.4 16,16 1,714,59
1970 TABLE C-4. and inventories in manufacturing, 1947-69 Inyentories i 1947 1948 1949 1950 1951 195 1953 1954 1955 1956 1957 1958 1959 35,60 54,33 5,507 59,8 70,4 7,377,1 89,05 86,9 1.4 16,16 1,714,59
Design Criteria Data
 RAPID CITY SD Latitude = 44.5 N WMO No. 72662 Longitude =3. W Elevation = 3169 feet Period of Record = 1973 to 1996 Average Pressure = 26.67 inches Hg Design Criteria Data Mean Coincident (Average) Values
Design Criteria Data
 COLUMBIA SC Latitude = 33.95 N WMO No. 7231 Longitude = 81.12 W Elevation = 226 feet Period of Record = 1973 to 1996 Average Pressure = 29.8 inches Hg Design Criteria Data Mean Coincident (Average) Values
Design Criteria Data
 PHILADELPHIA PA Latitude = 39.88 N WMO No. 7248 Longitude = 75.25 W Elevation = 3 feet Period of Record = 1973 to 1996 Average Pressure = 29.98 inches Hg Design Criteria Data Mean Coincident (Average)
Design Criteria Data
 HONOLULU/OAHU HI Latitude = 21.35 N WMO No. 91182 Longitude =157.9 W Elevation = 16 feet Period of Record = 1967 to 1996 Average Pressure = 29.96 inches Hg Design Criteria Data Mean Coincident (Average)
Design Criteria Data
 MACON/LEWIS WILSON GA Latitude = 32.7 N WMO No. 72217 Longitude = 83.65 W Elevation = 361 feet Period of Record = 1973 to 1996 Average Pressure = 29.66 inches Hg Design Criteria Data Mean Coincident (Average)
Design Criteria Data
 PIERRE SD Latitude = 44.38 N WMO No. 726686 Longitude =1.2 W Elevation = 1742 feet Period of Record = 1973 to 1996 Average Pressure = 28.1 inches Hg Design Criteria Data Mean Coincident (Average) Values
Design Criteria Data
 INDIANAPOLIS IN Latitude = 39.73 N WMO No. 72438 Longitude = 86.27 W Elevation = 87 feet Period of Record = 1973 to 1996 Average Pressure = 29.15 inches Hg Design Criteria Data Mean Coincident (Average)
Design Criteria Data
 ANCHORAGE AK Latitude = 61.17 N WMO No. 7273 Longitude =15. W Elevation = 131 feet Period of Record = 1973 to 1996 Average Pressure = 29.6 inches Hg Design Criteria Data Mean Coincident (Average) Values
Design Criteria Data
 DENVER/STAPLETON CO Latitude = 39.75 N WMO No. 72469 Longitude =14.8 W Elevation = 5332 feet Period of Record = 1973 to 1995 Average Pressure = 24.66 inches Hg Design Criteria Data Mean Coincident (Average)
Providing correct perspective of oil palm cultivation effects on land use
 Providing correct perspective of oil palm cultivation effects on land use Tan Sri Datuk Dr Yusof Basiron CEO, Malaysian Palm Oil Council Presentation Importance of palm oil for food and energy use (biofuel)
Design Criteria Data
 JACKSONVILLE FL Latitude = 3.5 N WMO No. 7226 Longitude = 81.7 W Elevation = 3 feet Period of Record = 1973 to 1996 Average Pressure = 3.1 inches Hg Design Criteria Data Mean Coincident (Average) Values
Design Criteria Data
 SPOKANE WA Latitude = 47.63 N WMO No. 72785 Longitude =117.5 W Elevation = 2366 feet Period of Record = 1973 to 1996 Average Pressure = 27.5 inches Hg Design Criteria Data Mean Coincident (Average) Values
Rice Outlook Slide Show U.S. and World August 10, 2017
 Rice Outlook Slide Show U.S. and World August 10, 2017 Bobby Coats, Ph.D. Professor Economics Department of Agricultural Economics and Agribusiness Division of Agriculture Cooperative Extension Service
Design Criteria Data
 LOUISVILLE/STANDIFORD KY Latitude = 38.18 N WMO No. 72423 Longitude = 85.73 W Elevation = 489 feet Period of Record = 1973 to 1996 Average Pressure = 29.49 inches Hg Design Criteria Data Mean Coincident
Design Criteria Data
 DAYTON/JAMES M COX OH Latitude = 39.9 N WMO No. 72429 Longitude = 84.2 W Elevation = 14 feet Period of Record = 1973 to 1996 Average Pressure = 28.95 inches Hg Design Criteria Data Mean Coincident (Average)
Design Criteria Data
 SPRINGFLD MO Latitude = 37.23 N WMO No. 7244 Longitude = 93.38 W Elevation = 127 feet Period of Record = 1973 to 1996 Average Pressure = 28.66 inches Hg Design Criteria Data Mean Coincident (Average) Values
Design Criteria Data
 BIRMINGHAM AL Latitude = 33.57 N WMO No. 72228 Longitude = 86.75 W Elevation = 63 feet Period of Record = 1973 to 1996 Average Pressure = 29.36 inches Hg Design Criteria Data Mean Coincident (Average)
Design Criteria Data
 BOSTON/LOGAN MA Latitude = 42.37 N WMO No. 7259 Longitude = 71.3 W Elevation = 3 feet Period of Record = 1967 to 1996 Average Pressure = 29.95 inches Hg Design Criteria Data Mean Coincident (Average) Values
Design Criteria Data
 MIDLAND TX Latitude = 31.95 N WMO No. 72265 Longitude =2. W Elevation = 2861 feet Period of Record = 1973 to 1996 Average Pressure = 27.3 inches Hg Design Criteria Data Mean Coincident (Average) Values
Design Criteria Data
 MINNEAPOLIS-ST PAUL MN Latitude = 44.88 N WMO No. 72658 Longitude = 93.22 W Elevation = 837 feet Period of Record = 1973 to 1996 Average Pressure = 29.7 inches Hg Design Criteria Data Mean Coincident (Average)
Biofuel Potential for Transport Sector in Sudan
 UNCTAD 17th Africa OILGASMINE, Khartoum, 23-26 November 2015 Extractive Industries and Sustainable Job Creation Biofuel Potential for Transport Sector in Sudan By Abdel Azim Wida a General Directorate
Design Criteria Data
 NEW YORK/JOHN F KENNEDY NY Latitude = 4.65 N WMO No. 74486 Longitude = 73.78 W Elevation = 23 feet Period of Record = 1973 to 1996 Average Pressure = 29.98 inches Hg Design Criteria Data Mean Coincident
Design Criteria Data
 WASHINGTON/DULLES VA Latitude = 38.95 N WMO No. 7243 Longitude = 77.45 W Elevation = 322 feet Period of Record = 1973 to 1996 Average Pressure = 29.68 inches Hg Design Criteria Data Mean Coincident (Average)
Design Criteria Data
 LANDER/HUNT WY Latitude = 42.82 N WMO No. 72576 Longitude =18.7 W Elevation = 5558 feet Period of Record = 1973 to 1996 Average Pressure = 24.44 inches Hg Design Criteria Data Mean Coincident (Average)
Design Criteria Data
 ALBUQUERQUE NM Latitude = 35.5 N WMO No. 72365 Longitude =16.6 W Elevation = 5315 feet Period of Record = 1967 to 1996 Average Pressure = 24.72 inches Hg Design Criteria Data Mean Coincident (Average)
Global biofuel growth Implications for agricultural markets and policies
 Global biofuel growth Implications for agricultural markets and policies Martin von Lampe Trade and Agriculture Directorate OECD Regional Meeting on Agricultural Policy Reform Bucharest, Romania 24-26
Design Criteria Data
 DULUTH MN Latitude = 46.83 N WMO No. 72745 Longitude = 92.18 W Elevation = 1417 feet Period of Record = 1973 to 1996 Average Pressure = 28.43 inches Hg Design Criteria Data Mean Coincident (Average) Values
November 2018 Customer Switching Report for the Electricity and Gas Retail Markets
 An Coimisiún um Rialáil Fóntas Commission for Regulation of Utilities November 2018 Customer Switching Report for the Electricity and Gas Retail Markets Information Paper Reference: CRU18266 Date Published:
LOCAL CLIMATOLOGICAL DATA
 ILLINOIS STATE WATER SURVEY DIVISION URBANA, ILLINOIS ISWS MP-21 Archive SWS0964 Illinois State Water Survey LOCAL CLIMATOLOGICAL DATA FDR HILLSBORO, IL. 1901-1962 LOCAL CLIMATOLOGICAL DATA 1901-1962 HILLSBORO
Design Criteria Data
 CHARLESTON/KANAWHA WV Latitude = 38.37 N WMO No. 72414 Longitude = 81.6 W Elevation = 981 feet Period of Record = 1973 to 1996 Average Pressure = 29. inches Hg Design Criteria Data Mean Coincident (Average)
August ATR Monthly Report
 August ATR Monthly Report Minnesota Department of Transportation Office of Transportation Data and Analysis August 2011 Introduction The purpose of this report is to examine monthly traffic trends on