Pennsylvania Crash Facts and
|
|
|
- Magdalene Sherman
- 6 years ago
- Views:
Transcription

1 Pennsylvania Crash Facts and Statistics
2 NTRODUCTON The 1993 TRAFFC CRASH FACTS AND STATSTCS is a report published by the Bureau of Highway Safety and Traffic Engineering of the Pennsylvania Department of Transportation. This publication is a statistical review of reportable motor vehicle traffic crashes in the Commonwealth of Pennsylvania for the calendar year The figures are compiled from the traffic crash reports that are submitted to the Pennsylvania Department of Transportation by state, county, municipal and other law enforcement agencies, as specified in the Pennsylvania Vehicle Code (75 Pa. C.S., Chapter 37C). Specific questions regarding data presented in this report should be addressed to: ---'.,. _. Pennsylvania Department of Transportation Bureau of Highway Safety & Traffic Engineering Room 216 Transprtation and Safety Building P.O. Box 247 Harrisburg, Pennsylvania (717) ':"::--'::.==---
3 Cia?. HGHLGHTS TABLE OF CONTENTS Highlights Total Crashes by Crash Severity Operator-Vehicle-Road Data Economic Loss Due To Reportable Traffic Crashes Fatalities By Crash Type Total Crashes By Type 5 D. TRENDS PA Crash Facts : 7 Historical Trends -. Highway Crash Statistics ( ) 8 Pennsylvania Highway Fatalities Fatalities Per 1. Crashes Pedestrian Fatalities By Month Motorcycle Fatalities Heavy Truck Fatalities Light Truck Fatalitils Van-Type Vehicle Fatalities Passenger Car Fatalities ; 12 ""O::sllJpeCl:e::J:dwin1E!gF:.aalLiitawlilUt:tiesu Tailgating Fatalities _ Alcohol Related Fat.alities Hit & Run Fatalities V. GEOGRAPHC NFORMATON 1993 Penns lvania Crashes By County Crashes By County Fatalities and njuries and Rates/lO.OOO Population Fatalities By County Fatalities by Vehicle Type Crashes by Engineering District 2 FATALTY AND NJURY CHARACTERSTCS 1993 Highway >eaths: Distribution By Vehicle Type Highway Deaths By Age and Sex Vehicle Driver Deaths By Age and Sex Vehicle ()ccupant >eaths By Age and Sex Major njuries By Age and Sex Moderate njuries By Age and Sex Minor njuries By Age and Sex 24 v. SEAT BELT STATSTCS 1993 Total People nvolved n Crashes: Distribution By Belt Usage 25 Total People nvolved in Crashes: Distribution by Vehicle Type mpact of 1% Belt Use on 1993 Fatalities and njuries Passenger Car ()ccupants Only Percent Seat Belt Use by County 28 Effect of 1% Belt Use n Passenger Car Crashes Belt Use n Car Crashes Seat Belt Observat.ionsa Surveys
4 1. V. ALCOHOL NVOLVEMENT N CRASHES Alcohol nvolvement lligwights : Alcohol nvolvement n Crashes: Distribution By Crash] Severity Alcohol Related Crashes By llumination Alcohol Related Crash Statistics Alcohol Related Crashes -- llistorical Data Operator nvolvement n Alcohol Related Crashes By \(ehicle Type Persons Killed n Crashes nvolving Drinking Drivers.., Alcohol Related Fatalities By County DU Arrests By County, Alcohol Related Cra'hes Per 1, Drivers (Map) DU Arrest Rates Per 1, Drivers (Map) : Alcohol Related Crashes (Map) Alcohol Related Fatalities (Map), Alcohol Related Crashes By Month,.41 Drivers Killed Using Alcohol Underage Drinking Drivers n Pennsylvania Traffic Crashes i Alcohol Related Crashes -- Time By Day Of Week Alcohol Related Fatal Crashes -- Tune By Day Of Week 45 Vcts Of Alcohol Related Fatal Crashes -- Dstbuton ByAge VlctunS Of Alcohol Related Fatal Crashes -- Distribution BYlvehicle Type Victims Of Fatal Crashes -- Distribution By Time Of Day , 47 Victims Of Fatal Crashes -- Distribution By Day Of Week Percent Of ver nvolvement n 1993 Crashes By Age Gropp 48 ev;;:; 9:x...l.:...:::::::::::::::::::::::;:::::::::::::.:::: Blood Alcohol Content (BAC) Drivers n Fatal Crashes -- p _. - 1 V. ;: ::T:so:ri;_:: Pdestrian atalities Y. County: 51 Pedestnan njury Seventy By Striking Vehicle Type Crashes Pedestrian Fatalities By Age Group i Pedestrian njuries By Age Group Pedestrian Fatalities (Map).55 Pedestrian Fatalities _. Distribution By Age And Sex Crashes..56 Pedesans Wth Major njuris. Distri.buion.By Age And Sex Crashes 56 Pedestrians With Moderate njunes -- Distnbutlon By Age And Sex Crashes 57 Pedestrians With Minor njuries -- Distribution By Age Andl Sex Crashes 57 Vll. CHARACTERSTCS"'- -'--'----. _.. _. -_._. A.. General Crash Characteristics ( Crashes By Road Type By lllumination.58 State llighway 59 nterstate f 6 Locallighway : :: f 61 Turnpike : 62 Driver nvolvement n Crashes By Age and Sex Crashes Crashes By Month r Fatal Crashes By Month Fatal Crashes -- Time By Day Of Week By Ho,*" Holiday Crashes, Alcohol Related Holiday Crashes, Construction Zone Crashes Construction Zone Crashes -- Crash Type Vehicle nvolvement n Construction Zone Crashes 68
5 Construction Zone Crashes By Road Type Construction Zone Crashes By Work Type 69 B. Driver Characteristics Operator Crash nvolvement By Severity By Operator License Traffic Crashes -- nvolvement of 16 To 21 Year Old Drivers n Al Crashes And Alcohol Related Crashes Drivers n Crashes Drivers n Alcohol Related Crashes 73 Persons Age 17 and 18 Killed n Traffic Crashes 74 C. Vehicle Chara':teristics Single Vehicle Non-Colision Crashes Single Vehicle Hit Fixed Object Crashes Single Vehicle Hit Pedestrian Crashes Two Vehicle Collisions Vehicle nvolvement n Crashes Vehicle nvolvement n Fatal Crashes Passenge:r Car Crashes Passenger Car Fatalities Seating Position Of Passenger Car Fatalities Light Truck Crashes Light Truck Fatalities Seating Position Of Light Truck Fatalities Heavy Truck Crashes Heavy Truck Fatalities Seating Position Of Heavy Truck Fatalities Motorcycle Crashes.:..:..:.., : Motorcycle Fatalities seating Position Of Motorcycle Fatalities : Pedacyclist Crashes Pedacyclist Fatalities Seating Position Of Pedacyclist Fatalities 94 Crashes nvolving School Buses n Pupil Transport School Bus Crashes n Pupil Transport School Bus Crashes n Pupil Transport -- Persons nvolved 97 Persons Killed n Crashes nvolving School Buses n Pupil Transportation X. DEFNTONS Terms and l)efmitions Frequently Used n Report 99-1
6 .... _.... _a?
7 HGHLGHTS 1993 During 1993 calendar year there were 134,315 reportable crashes in the Commonwealth of Pennsylvania involving the deaths of 1,53 persons and injury to another 131,53 persons. A total of 225,759 vehicles and 344,442 persons (including 225,99 drivers) were involved. The estimated cost to society of these crashes was about $4.333 BLLON or approximately $ for every one of Pennsylvania's over 12 million residents. During 1993, there were approximately BLLON vehicle miles of travel on Pennsylvania's 116,688 miles of maintained road. The 1993 fatality rate of 1.68 kild per hundred million vehicle miles was the lowest ever recorded in Pennsylvana., ON AVERAGE: There was a reportable traffic crash every 3.9 minutes in the Commonwcalth. There were 4.2 persons killed each day or about one every 5.7 hours. There were 36.3 persons injured each day or ahout one every 4. minutes. One out of every 41.7 licensed drivers was involved in a reportable traffic crash. One out of every 44.9 registered vehicles was involved in a reportable traffic crash. 62.7% of drivers in all crashes and 76.7% of drivers in fatal crashes were MALE. 62.% of all crashes happened in daylight conditions, but 53.3% of fatal crashes happened during dark hours. 5.4% of fatal crashes happened -on weekends-(fnday, 'Saturday"and Sunday) with Friday and Saturday each with the high day of 17.3/ of the fatal crashes. The two worst times for fatal crashes were between 3 P.M. and 8 P.M. and between lop.m. and 3 A.M. each with 26.7% ofthe fatals. 74.4% of all crashes occurred under no adverse weather conditions and 67.6% of all crashes occurred on dry road surfaces. 9.8% of all crashes and 39./ of the FATAL crashes involved alcohol. 1, ",a'1
8 TOTAL CRASHES BY CRASH SEVERTY 134,315 TOTAL CRASHE$ 1% 1,43 FATAL CRASHES 1.4% NJURY CRASHE 85, % P.D.O.CRASHES 47, % KLLED TOTAL PEOPL 344,442 i 1.% NJURED 1,53.44% 131, % i ; NO NJURY 211, % --..., MAJOR MODERATE MNOR 5, % 2, % 85, % UNKNOWN 19, %
9 OPERATOR-VEHCLE-ROAD DATA 8,58,948 LCENSED OPERATORS 9,44,91 REGSTERED MOTOR VEHCLES 12,48, POPULATON OF THE COMMONWEALTH OF PENNSYLVANA (Estmated) 116,688 MANTANED MLES OF ROAD (1991 DATA) STATE...4,658 LOCAL 71,227 TURNPKE 474 OTHER....4, BLLON VEHCLE MLES DRVEN STATE LOCAL & HGHWAYS NTERSTATES TURNPKE OTHER Crashes Persons Killed Persons njured Vehicle Miles Traveled (million vehicle miles) Crashes/loo Million Vehicle Miles Persons Killed 1 Million Vehicle Miles Persons njuredl 1 Million Vehicle Miles "", -.
10 . -._ _.._ _._.po ECONOMC LOSS DUE TO REPORTABLE TRAFRC CRASHES AVERAGE SEVERTY NUMBER COSTS ESTMATED COSTS FATALTES 1,53 $,259,D44. $1,927,12,32 NJURES MAJOR MODERATE MNOR ,669 2,528 15,36 $31,.OO $m,ol.w $3,84. $1,759,884,36-1>VU,JJ,/.JU $345,824,94.._-" -_ '-= PROPERTY DAMAGE ONLY CRASHES 47,18 $lj994. $94,76, lt.l,. S4.},44 i THE ECONOMC LOSS TO EVERY MAN, WOMAN ND CHLD N PA N 1993 WAS $ j.. Figures based upon the 'atest FHWA estimates.
 W J: (,) u. o a: w OJ :::> z 3 2 1 o.,/' ip # n;, @ r)<q, 4 >...'b")
11 5 1'1'f"\ 1993 FATALTES BY CRASH TYPE...:.:,.: ',:::'.,:" :. 6 CJ) w i= 5 :J 4 if.. u. 3 a:: 2 w X) :E 1 :::> z ().., ':> 'roo., to_ '\, 1993 TOTAL CRASHES BY CRASH TYPE en "C fa o 5 4 CJ) W J: (,) u. o a: w OJ :::> z o.,/' ip # r)<q, 4 >...'b
12
13 7 PA CRASH FACTS REPORTED CRASHES 151, ,34 13,44 133, ,315 TOTAL KLLED 1,878 1,646 1,661 1,545 1,53 TOTAL NJURED 152, ,945 13, , ,53 MAJOR 7,551 6,938 6,296 6,191 5,669 MODERATE ,51 2,695 2,276 2,528 MNOR 94,919 84,6 79,871 84,982 85,825 UNKNOWN 21,717 25,437 23,584 21,644 19,481 PEDESTRSKLLED PEDESTRS NruRED MOTORCYCLSTS KLLED 6, , , ,58 9 6, ,-- MOTORCYCLSTS NJURED ,495 3,326 2,675 (.-_._- 2,811 - PEDALCYCLSTS KLLED PEDALCYCLSTS NruRED 2,641 2,598 2,685 2,659 2,628 TRUCK RELATED FATALTES ALCOHOL RELATED FATALTES -, _ _;_ _. ''''''-''''''''' '"-""._. 596 Bll..LONS OF VEHCLE MLES DEATHS PER 1 MLLON VEHCLE MLES NJURES PER 1 MLLON VEDCLE MLES ".. '.. /".... ':... ';", -: ;.; ;... 'r' :":' ;,... :..,'); : y.:;..:... ;.,..:. :. ::..;:
14 HSTORCAL TRENDS HGHWAY CRASH STATSTCS YEAR TOTAL CRASHES , ,917 46,588 41, ,157 5, , , , , !S7,191!S9.51!S6.S , , , , , ,683 1S2.63!S2,96 151, , S TOTAL KLLED TOTAL NJURED REGlSTRED VEHC!.ES MfR. VEHCLE MLEAGE (BilliOD) PAFATALTY RATE (Per 1 MillioD US FATALTY RATE Vehicle Miles) 2, , ,648 99,793 1,713.9'2 1,829,6$ , ,131 4, ,7']6 1,75,64 2,279 2, ) , , ,328 1, , ,624 1,624 1,642 1,68 1, ,737 1, , , , , , , ,S , ,847 48,398 5,854 61, , ,312 29, , ,79 54,29 62,13 65,643 67,134 7, ,836 84,813 84, , , , , , , , ,791,8 1,8SJ ,124,525 2, ,37:7:23 2, ,31 2, J63 2,14S, ,542 2,64,741 2, ,993, ,964 3, , ,75,U7 4, ,355, ,77, , ,4 5, ,G5 5,436, , 5,791, 5.879, 5.947, 6.79, 6.244; 7.7,192 ' ,6S ,1 24\9S ,254,893 l.l , S.9 S J.S , ,21 7,37, , , ,25, Jl 7.562, , , S , , , ,44 S.457 JS4.18!S2, , S , ,452,365 8,65, , S,

15 9 Qc,3 HC:HWAY FATALTES ,5 en w - 2, 1,5 :::i 1, if 5 rgj, 9:> t > C?J... C?J O) YEAR FATALTES PER 1, CRASHES en W 16 en en 6 W-5 4 tf tgj ct' t > 9:>) C?J... C?J YEAR
16 NUMBER OF FATALTES NUMBER OF FATALTES., - -< 1/ J; j 4189-: 5/89., ! 8/ /89 -," /89 1/9 me 3/9 4/ < 7/9! 8/9 -- 9/91 1/9 -' 11/9 1/ /91 --t 4/91 - t 5,91! > 6191 ' 1 7/91 - \ ! :xl 9/91. t191 11/91 -i ' 1/ /92 4/92 5/92 6/92 7/92 8/92 9/92 j 1/92 11/92 12/92 1/ /93 4/93, 5/93 -j 6/ /93 -r 8/93 9/ /93! 11/93 -i _.._._"-- '1 '1 \) \) '1 '" ' F [!,:. C! t '.-.. ' - ::c a -< a \) '",f::l. "1J 1/89 2; ;89 m 5,89 6; ; m 1;89 "!89 en 12;89 1,9-2RO :),9 :: ,9 7 r» 6 9,9 m Z...L...L ;9 c:o l2ro leo 1.1 CD 2191 c:o i 3,1 4,91 leo 5,1 6,9' 7,1 ::...L CD -<...L B.1 r :D bl co co fl(o ,, '.' i eo W 9,1-1;92 m 3;92 en,o. ṟ -- m 2. miw &'92 en 7192! OJ 9192 J -,... em -< 11m t J Z BlOO - 9iOO. Z i93.
17 NUMBER OF FATAUTlES NUMBER OF FATALTES.. "Ja i! i -L CO (X) :: m -i ::D C (") A CO CD r CD -f -L W m CJ) s: o Z -f Ml MlO -L 't,'. A l1/11o c; llnlo rt 12J1lO CO Mil (X) /91 CO 4191 < 1 " 6/91 - r. :D :D /91. 1/91 CO 11/91 - (j -L Rl W m en t _ Co\) Co\) o... N Co\) c.n )... CJ) o c.n o c.n Pl o (] 1,119 r 2Jl!l 4/l9 G> S8l 8l9 6/l 7/fl8 Mll 9l /fl8 12Jl1!l : - lnlo 2tSO ::D - E:_F",,:':±N;'; :fiv'tuft. Ytk:;;,11;. Jn. :we - < 7/9'!illlO 6/9ll 7nlO C CO 1.. l::.'.f.... ' ,w. 1 s:: =J' nlO Rl - 2/"3 --i 3193 :. ow:! ::i. 1, o Ml. i:- Z 7193 ll/!c ll/!c !MJl- 1,'93 1/ _._.J '2, 12/93 -! C ::. T 6/9ll g,go UWO Mil ,91 6/91 7/ / M / J , !W = -r= 2/93 J '
18 Z - <... () ( co r OJ m,f m, co... co (B U) - -m ',--," en r Z - NUMBER OF FATALTES NUMBER OF FATALTES,,... tv -< :D ll9. j 31119! 4(119-5;89 ' 61119! , J '89 'j W89 12.'89!,, i 2ftlO i 3,9! 4/9 5, i &9 i 7/9! 8.-9., 919 "! 1.'9 - i t1!9o i 12."( ';91 "J , 4,91 5,91,.! " 8;91.\ j 919' 1'91. 11,91 i j ';92! 2m' 3, i /92 8, ,92 ' 1'; m ';93 2J93. 3,93\ 4193 ' ,.. ::, U1 -.oj (... W \) m Q) \)! - j 1 i j. ' -C , ' L_,.., "...,. _.-."...-.",,_...,, ' 2; i 4;119 en!! 5/ en 7/W3,;! 8;119 m ;119 11/89 Z G) ,1lO 2,gQ 3i1lO m 419 5;9 : 6i9O 7/9 () 819 9,9 119 r» 11.'9 i,o> : ',1. CD.' 12,gQ i = 1,91 5i, - '""CD : {O - r : ;, 1, " 3, ;.i( 5,91 m ,91 8i91 9,91 11; ,92 3/92 m 4;92 en ,92 7/92 8;92 9/ / s: 2J S;93 6,'93 Z ,'93 -f 9, W -f 2,92 J:! ;93!, J_.. m
19 ---'! -L CO (X) i col CO -L!1 il E' UJ l en ""tj m m o - z G) ṟ - m en s: o Z - NUMBER OF FATAllTES NUMBER OF FATALmES -w w U1 m o \) m ; CD o o o o o o o [... i,.> '-.-,--»- 2!89 3.'89 4.'89 5,' , 6,' ,111 -, fll l1O 2.'9 3.lO 4'9 5i9 8lO 11l1O-j 8,'9 - j 9,/9 -j 1,'9 --; 111l1O --) 121l1O " ; 3> r: T -< 5.'91 -j' 1>91 1>91 --j JJ 8!l1 1 9.' > m- '' J.' " _ :: l ' t== /..'. 6/92 -- ; '112 1" /92 -! Ma - 219l 39l 419l - -j lwl 1,113 -! lwl 9, l 'TT ' 1119l 1219l _L_:_ l _ _-- ( / n9 r G> 1/ / / i "'h» 11/ lO - 3,'9 419 z 5,9 6/llO G) 7/9 8lO. -L 9.' ,, CO 1219 i ( 3/91. ; 4191 Q) ,1 - -< 1>91-1 r L 8/ _ ( -- :xl, 1(),91 --)' CO m 1/92! 2/92 -, J.'92--J 4t92 j' tv en i,,---,/ o Z -- W2 -! EW2 -i B.' lli j 12/92-1,ga - j ' j 6,93 1,gal :: --it 1,93 11,ga J..w,.w_w J._... _ j' -;
J \"$.l jj9lj AS: r,.q :D C z i9 o,'!l& H89 1'J'f V:..l\"J 2:?:l :l.' 4,'9 513() r :D m -< m» ::: 1Wj MlC 9'JC 1!'1 111'.1j 1<Sj l,od! 219 1 :;,'91 \"191 11 f:i!l' 7/31 Mil 91!11 1}1 11,l.")
20 NUMBER OF FATALTES NUMBER OF FATAUTES." 2rl!l :lt19 4!'J fj.'39!lal 1m MS i!"j9 o N.,. en co... o :r: - - QO l'j6?}!'b :!,'!i& o\ll;l 5,J 6,'59 7,'eif &'8!! \). co \)» r () :: 1!)8P !')J "$.l jj9lj AS: r,.q :D C z i9 o,'!l& H89 1'J'f V:..l"J 2:?:l :l.' 4,'9 513() r :D m -< m» ::: 1Wj MlC 9'JC 1!'1 111'.1j 1<Sj l,od! :;,'91 " f:i!l' 7/31 Mil 91!11 1}1 11,l.l' 12/91 1 ::-c"..2 l!9? <O ffi ṟ c.o- COm wen -< m 619 7, 6,"-'" 91?1 1l\'f:Q t:,l"j 12/3(,,'91 Z91 3,'=J1 4<111!'..'ff1 fw"':.11 7,',/ ,91 1,';>',"91 1?Jif1 :-- 2t"il2 :'ff.: com co....l )? we --f - Ml7 6:" :r:t2 5;l? 6,'9'l 1r. m en!w:' l, Ml'<' R /92 s: '1,192 t!\';(' 1:/: 12:1l2 l9j t"..i.1 :i'll 4.l! Ml3 1:<;3 513=1 t>ljj 1::1'!i.1 :-t;ti Z -- 1;.; 2::.rJ 3.' 4<'9:; f..'$!j{c ;/93 l.'f(; 9rc'3 11';1.-, 11'S13 1?J s: Z --f
21
22 1993 PEN]SYLVANA CRASHES BY COUNTY COUNTY FATAL CRASHES NJURY CRASHES P.D.O. CRASHES TOTAL CRASHES ADAMS ALLEGHENY ARMSTRONG BEAVER BEDFORD BERKS BLAR BRADFORD BUCKS BUTLER CAMBRA CAMERON CARBON CENTRE CHESTER CLARON CLEARFELD OlNTON COLUMBA CRAWFORD - CUMBERLAND DAUPHN DELAWARE ELK ERE FAYETE , , ,723 1, ,413 1,165 1, , ,423 1,882 3, , , , , , ,4 1,29 1, , , ,788 1, ,872 1,931 1, ,237 4, ,81 2,451 3,118 5, ,348 1,595 FOREST FRANKLN FULTON GREENE HUNTNGDON , NDANA JEFFERSON JUNATA LACKAWANNA LANCASTER ,345 3, ,911 2,88 5,136 LAWRENCE LEBANON 1.EHGH ,529 1,83 1,398 4,76 LUZERNE LYCOMNG , , ,734 1,356 McKEAN MERCER ,58 MFFLN MONROE MONTGOMERY MONTOUR NOR.THAMPTON NOR.11lUMBERLAND PERRY PKE POTER SCHUYLKLL ,138 5, SOD , glj ,917 9, ,648 SNYDER. SOMERSET SUUJVAN SUSQUEHANNA GA UNON VENANGO WARllEN WASHNGTON WAYNE WESTMORELAND WYOMNG YORK PHLADELPHA TOTAL , , , , &5, , ,1 47, , , ,563 12, ,315 15
23 CRASHES BY COUNTY COUNTY 19&9 CRASHES 199 CRASHES ADAMS 1, AllEGHENY 13,979 13,112 ARMSTRONG BEAVER 1,88 1,774 BEDFORD BERKS 5, BLAR ,72 BRADFORD BUCKS 8,169 7,368 BUTLEll 2,95 1,812 CAMBRA 1,332 1,166 CAMERON 9 8 CARBON CENTRE 1,389 1,22 C8ES'Ell 5,893 5,(/)7 CLAJUON CLEARFELD 1,264 1,34 CLNTON COLUMBA CRAWFORD 1,S4 1,53 CUMBERLAND 2,581 2,375 DAUPHN 3,65 3,387 DELAWARE ,868 ELK ERE 3,544 3,314 FAYEfrn 1,74 1,741 FOREST FRANKLN 1,781 1,793 FULTON GllEENE HUNTNGDON NDANA 1, JEFFERSON JUNATA LACKAWANNA 2,82 2,532 LANCASTER 5,654 5,399 LAWRENCE 1,4 972 LEBANON 1,483 1,488 LEHGH 4,822 4,274 LUZERNE 4,172 3,922 LYCOMNG 1, McKEAN MERCER 1,527 1,446 MFFLN MON1l.E 2,235 2,7 MONTGOMERY 1,461 9,61 MONTOUR NORTHAMPTON 3,128 2,956 NORTBUMBElU..AND PERRY PKE POT'ER SCHUYLKLL ,727 SNYDER SOMEllSET SUUJVAN SUSQUEHANNA ' nooa UNON VENANGO WARREN WASHNGTON 2,531 2,348 WAYNE WESnfORELAND WYOMNG YORK 5,219 4,832 PHLADELPHA 1523 S 69 TOTAL 151, , CRASHES CRASHES CRASHES ,588 13,226 13, ,68 1,816 1, ,439 4,838 4,788 1,519 1,742 1, ,751 6,87 6, ,931 1, U ,192 1, ,863 4,68 4, , , , ,451 2,986 3,123 3,118 5,196 5,225 5, ,218 3,23 3,348 1,65 1,61S U ,551 U ,384 2, ,844,,193 ', , ,49 1,481 1,398 3,989 4,6 4,76 3,726 3,639 3,734 1,39 1, U9 1, , ,419 9,121 9,21S ,769 2, c wi S 219 1,595 1, ,66 2,291 2, ,229 4,221 4, ,443 4,43 4, ,41 133, J15 16 ANNUAL PERCENT GROWTH N CHANGE CRASHES J.) , SJO OJ S
24 1993 FATALTY AND NJURY RATES/,OOO POPULATON FATALTES FATALTES FAT... NJ. FATALTES FATALTES PER 1, PLUS PER 1, ON STATE PER 1 ML COUNTY POPULATON FATALTES POPULATON NJURES POPULATON HGHWAYS VEH. MLES ADAMS ALLEGHENY ARMSTRONG BEAVER BEDFORD BERKS BLAR BRADFORD BUCKS B1JT.ER CAMBRA CAMERON CARBON CENTRE CHESTER O.ARON a.earfeld a.nton COLUMBA CRAWFORD CUMBERLAND DAUPHN DELAWARE ELK ERE FAYETTE FOREST FRANKLN FULTON GREENE HUNTNGDON NDANA JEFFERSON JUNATA LACKAWANNA LANCASTER LAWRENCE LEBANON LEHGH LUZERNE LYCOMNG McKEAN MERCER MFFLN MONROE MONTGOMERY MONTOUR NORTHAMPTON NORTlUMBElLAND PERRY PKE POTER SCHtJYLKll SNYDER SOMERSET SUWVAN SUSQUEHANNA noga UNON VENANGO WARREN WASHNGTON WAYNE WESTMORELAND WYOMNG YORK PHLADELPHA :55,99 ' , , , i55, :! , t ,59 115, , ,42 687,582 17,982 2', ,747 28,355 16,95 154,78 37,192 79,37 6,189 4,944 41, ,29 45,677 27,434 4,51 375,49 28, , U 'Jl,. _ , , , , ,724 1, , , ,...Pl , , , ,363 16, Q _.J!' R? ' "L ,z ? TOTAL 1,41, 1, ,2S 17
25 FATALTES BY COUNTY ANNUAL PERCENT GROWTH N CHANGE COUNTY FATALTES FATALTES FATALTES FATALTES FATALTES FATALTES ADAMS ALLEGHENY ARMSTRONG BEAVER BEDFORD lao. BERKS H BLAR 2S 23 2S BRADFORD BUCKS BlmER S 7.7 CAMBRA 2 S S o.3s CAMERON CARBON CENTRE CHESTER 55 S CLARJON oa5 9.1 CLEARFELD cr..nton S COLUMBA CRAWFORD CUMBERLAND U DAUPHN A DELAWARE LS ELK ERE FAYETE FOREST FRANKLN FULTON GREENE ' i-... n --.;T T..v - HUNTNGDON NDANA JEffERSOR , -_ JUNATA LACKAWANNA " LANCASTER M LAWRENCE LEBANON LEHGH S LUZERNE SO LYCOMNG McKEAN S MERCER MFFLN MONROE MONTGOMERY MONTOUR NORTHAMPTON S.6 NORTHUMBERLAND S rd',r.:l , --'-'-7-.-'- -. ' _'..1.: i.:'::_.. '-: =-<L PKE POTER SCHUYLKLL SNYDER os SOMERSET 2S SUUJVAN SO.O SUSQUEHANNA noga 9 13, UNON VENANGO WARREN WASHNGTON WAYNE WESTMORELAND 7 SO SO.O WYOMNG YORK PHlLADELPBlA TOTAL 1, ,646 1,661 1,545 1,53 18
26 .. AUTO MOTOR COUNTY MOBLE CYCLE ADAMS 13 3 ALLEGHENY ARMSTRONG BEAVER 12 3 BEDFORD 5 - BERKS 35 7 BLAR 13 - BRADFORD 3 BUCKS 46 7 BUTLER 18 3 CAMBRA 9 CAMERON 2 - CARBON 1 CENTRE 6 2 CHESTER 43 2 CLARON 4 2 CLEARFELD 13 CLNTON 1 COLUMBA 1 2 CRAWFORD 5 - CUMBERLAND 23 DAUPHN 19 2 DELAWARE 32 2 ELK FATALTES BY VEHCLE TYPE ERE 23 FAYETTE 26 FOREST - FRANKLN 14 2 RJLTON 5 - GREENE 'HtJNTlNGDON \i NDANA 18 2 JEFFERSON 7 JUNATA 3 LACKAWANNA 12 2 LANCASTER 53 5 LAWRENCE 5 LEBANON 2 LEHGH 29 1 LUZERNE 32 2 LYCOMNG 7 2 McKEAN 7 2 MERCER 17 MFFLN 5 2 MONROE 17 MONTGOMERY 42 7 MONTOUR NORTHAMPTON 17 NORTHUMBERLAND 1 3 PERRY 14 PKE 6 POTTER 2 SCHUYLKLL 19 4 SNYDER 4 - SOMERSET 8 SULLVAN SUSQUEHANNA 4 noga 14 UNON 4 VENANGO 9 WARREN 3 -. WASHNGTON 31 2 WAYNE i 2 WESTMORELAND 33 6 WYOMNG 4 - YORK 22 2 PHLADELPHA 87 9 TOTAL 1, LGHT TRUCK HEAVY TRUCK OTHER TOTAL H , _ _ '" ; i.- r' ,5341,QQ1
27 1993 CRASHES BY ENGNEERNG DSTRCT DSTRCT CRASHES KLLED NJURED 1 7, , , , , , , , , , , , TOTAL 134,315 1,53 131,53 2
28
29 1993 HGHWAY DEATHS: DSTRBUT<DN BY VEHCLE TYPE,. 1,53 TOTAL HGHWAY DEATHS 1% PEDESTRANS % PASSENGER CAR % LGHT TRUCK % HEAVY TRUCK % MOTORCYCLE BODY TYPE % PEDACYCLE % SPEC. TRACK! NON MOTORZED VEHCLE 9.59% BUS 1.1". OPERATOR OCCUPANT OPERATOR OCCUPANT OPERATOR OCCUPANT OPERATOR OCCUPANT % % 'Y / % o.% o.% 1 1oo.'Y OPERATOR OCCUPANT OPERATOR. OCCUPANT OPERATOR OCCUPANT % % % "' % %
30 HGHWAY DEATHS BY AGE AND SEX 25 en J: W o o. i : ":. "r : c;._._: :i-:i-: : $ :. : r :--_. L N_.C\l._, C').+-(')-;.... 'il._il5._. in.. $ ; 19_.J._...,;.. _.. _1 ; FEMALEC: 14 '1 1' ' : 32 i 24 : 14, 21 i 25 i i 4 54 : 3 MALEC _ '- 94'. 173 ; :. : _ 16 _. 67 ; 56 : : 33 : 26 : 37 : i 64 i 1.. L_ "._. _ _..... '-... J '. -J ', AGE GROUPS 1993 VEHCLE DRVER DEATHS BY AGE AND SEX en 1 8 o o! " i- -.-_ J: FEMALEC' MALE.././ J " ;; ) ":-. -' ,_..--..,-, "':"- AGE GROUPS _ c--'.. _..._ -C.- _-'r----- '
31 VEHCLE OCCUPANT DEATHS BY AGE AND SEX "," '."".,;.. --"-:--"--"-",,",--,-...;...;,,,--,"-",--,-,---,----j -,..,-;,"",-,;, _"c:.,.,c_.. v7:- : '"- -:-:-::-:-. "': ;\'sf... ;-7"'""11;.., -":>-<;""..,- ;.,-.,.. -.:.;",-",:,,;,:;:,-,:,..,.,.+.-,;,;... _-,. t:' ",:- ':"_;-;:"::'";+:'. \,'.''"-'',. ", _ <.. 1 i -i... 1 i r!! ; : ; : i m!!! : i, :.!.JL.13.;, $ _L_. ; 1: 8 : ' 2, 2. : ',.. 1 : 5 i 2 6 3! 1 : 2! 5 3: 5,."..,.._: _.,.._.-l...l-. L....L i_...j AGE GROUPS 1, en w 8 a:.., => 6 a: 4 2 o, i -! MAJOR NJURES BY AGE AND SEX...._;. -;.,c_"..:_ :-;...-:-r?,.'"-7" -_...;. c','" ',"...1 J '. :: 7;::[;r""" j,;,- ',. --:-..,..,:_., 'J ; il i i1 + i.. i-.j.f6jjgj,]._l j :. UNKNOWN. 1 ioi O 1 ;1;21 FEMALE-:' ! 156: : 96 i 65 MALES. _;_ 1_2.L ! i 313 : : i 78! 69 ' 61 i 56! 56 j 75." :.. _...._,. :._.. _... J.._.... 1_ "_._. J._... l...1-,._._'_.., AGE GROUPS 76: 71 73: i 43 23
32 MODERATE NJURES BY AGE AND SEX ,., ,5 CJ) w 3, cc :::> -, 2,5 z 1 2, w 1,5 cc w 1, c o 5 :E o L.J L.JJ} < :., i, 1L_.;-- J_t, UNKNOWN. O' ; 1, : O : O. ' O O 1 FEMALE_...'; 149' 247 ' 359 '1,3461,178' ; 579 : : : ,: ". MALE.:_.?9.99..?\!9"_ : 245: 27,.2 ; L MNOR NJURES BY AGE AND SEX 5 / / / -- ""--' _ -..-.'''"'.-_ -.._ - -_.-.._---_.._--.._----.._.. '.._.._.._......c.....:..._._ : 1! AGE GROUPS!! i i + lb ;.. LJg r? -l.l!?i.lil_ t =? : O! o. : O., 4.5 : i 3.8 : 3.3 : i 5.5 : iii i i! , 4.4 : 3.S.,.2.4. _.!?8 _!

33
34 1993 TOTAL PEOPLE* NVQLVED N CRASHES: DSTRBUTON BY BELT USAGE TOTAL PEOPL* 319,94 ' 1,4 BELTS N USE BELTS NOT N USE ; BELTS NOT AVALABLE BELT USE UNKNOWN 197, % : 44, % i ,4 74, % %, Killed 3.2"'- Killed ,4 Kiled 2.5,4 Killed 22.3,4 Mlljor njury 1,479.7% MJor njury 1, % Major njury % Major njury 1,73 1.4,4 Modente njury 7, % Modente njury 5, % Mderate njury "' Moderate njury 3, % Minor njury 47; % No njury 133, % Minor njury 15, % No njury 19, % Mnor njury NO njury % 2,8 6.6% Minor njury 15, % No njury 46, % Unknown njury 7,423.ao,4 Unknown njury 2,29 5.1% Ullknown njury ,4 Unknown njury 7, ,4 KNOWN BELT USE 245,816 * NCLUDES NON-PARKED PASSENGER CAR, LGHT AND HEAVY TRuCiK DRVERS AND OCCUPANTS N REPORTABLE ACCDENTS () w
35 1993 TOTAL PEOPLE* NVOLVE)) N CRASHES: DSTRBUTON BY VEHCaE TYPE., BELTS N USE TOTAL PEOPLE 319,94 1,4 PASSENGER CARS LGHT TRUCKS HEAVY TRUCKS 184,216 1% 55,55 1,4 6,95 1,4 ; 1 BELTS NOT N USE- ii BELTS N USE 148, ,4 35, % 5, , % Killed 262.2% Killed % Killed 4.1,4 Killed ,4 Major njury 1,188.8,4 Major njury 1,48 4.2% Major njury 3.6,4 Major njury 2 2.4,4 Moderate njury 6,45 4.1,4 Moderate njury 4, % Moderate njury % Moderate njury ,4 Minor njury No njury 38, ,4 96, % Minor njury No njury 12, ,4 14, % Minor njury No njury ,4 4, % Minor njury No njury , % Unknown njury 6, ,4 Unknown njury 2,9 5.1,4 Unknown njury 45.9,4 Unknown njury % BELTS NOT N USE * NCLUDES NON-PARKED PASSENGER CAR, SNGLE BELTS N USE BELTS NOT N USE UNT TRUCK, AND TRUCK 43, % 11, % OPERATORS AND OCCU PANTS WHOSE SEAT BELT USE S KNOWN, N- Killed 34.1% Killed ,4 VOLVED N REPORTABLE ACCDENTS. DOES NOT Major njury 261.6,4 Major njury ,4 NCLUDE ACCDENTS N Moderate njury 1, % Moderate njury 1, ,4 WHCH SEAT BELT USE S UNKNOWN. Minor njury 8,4 19.2% Minor njury 3, ,4 No njury 32, % No njury 6,45 51.,4 til NCLUDES BELTS NOT N Unknown njury 1, ,4 Unknown njury ,4 USE AND BELTS NOT AVALABLE.
36 ,. MplACT OF 1% BELT USE ON 1993 FATALTES & NJURES (PASSENGER CAR OCCUPANTS ONLY) MAJOR MODERATE MNOR NO TOTAL KLLED NJURY NJURY NJURY NJURY PERSONS NO BELTS ,549 BELTS USED 256 1,139 5,728 36,357 9, ,645 BELTS NOT USED 445 1,342 =4,91 11,119 12,462 29,459 USE UNKNOWN ,961 6,93 16,552 26,47 TOTAL 812 3,54 11,894 54,793 12,147 19,7 EXPECTED 1% USE 415 1,86 8,713 52,39 127,727 NET GANLOSS ,248-3,181-2,754 +7,58 THE ESTMAT:ED ECONOMC SAVNGS OF 1% BELT USE N 1993 WlOULD HAVE BEEN OR APPROXMA1'ELY FOR EVERY MAN, WOMAN AND CHLD N PENNSYLVANA. 27
37 PERCENT SEAT BELT USE BY COUNTY COUNTY 1919 BELT USE 199 BELT USE 1991 BELT USE 1992 BELT USE 1993 BELT USE ANNUAL GROWTH RATE PERCENT CHANGE en 93 ADAMS AlLEGHENY ARMSTRONG BEAVER BEDFORD BERKS BLAR BRADFORD BUCKS BlJT.ER CAMBRA CAMERON CARBON CENTRE CHESTER a.arlon CLEARflELD CLNTON COLUMBA CRAWFORD CUMBERLAND DAUPHN DELAWARE ELK ERE FAYETE FOREST FRANKLN FULTON GREENE HUNTNGDON NDANA JEFFERSON JUNATA LACKAWANNA LANCASTER LAWRENCE LEBANON LEHGH LUZERNE LYCOMNG McKEAN MERCER MFFLN MONROE MONTGOMERY MONTOUR NOR'HAMP'ON NORTHUMBERLAND PERRY PKE POTER SCHUYLKLL SNYDER SOMERSET SUWVAN SUSQUEHANNA noga UNON VENANGO WARREN WASHNGTON WAYNE WESTMORELAND WYOMNG YORK PHLADELPHA ' r TOTALS
38 EFFECT OF 1% BELT USE N 1993 N PASSENGER CAR ACCDENTS CHANGE N NJURY CATEGORES F BELTS WERE USED N ALL CARS 1 ;.5.112%...NOR _.-._ _;_-1 w NJURy " z 2,754. x PERSONS i -2 (J 1 z w -3 (J a: w Q. -4-5,/ -6 1/ l/,..,..... _.,.._._._.,_".._.,_'..,.._'."....'.,.. ".. ' "., '_"./ //' PENNS)irLVANA SEAT BELT USE fcf93
39 OBSERVATONAL SURVEYS OF SEAT BELT USE i USAGE + TREND]. _..._-'... :...:..:::..:."--_
40
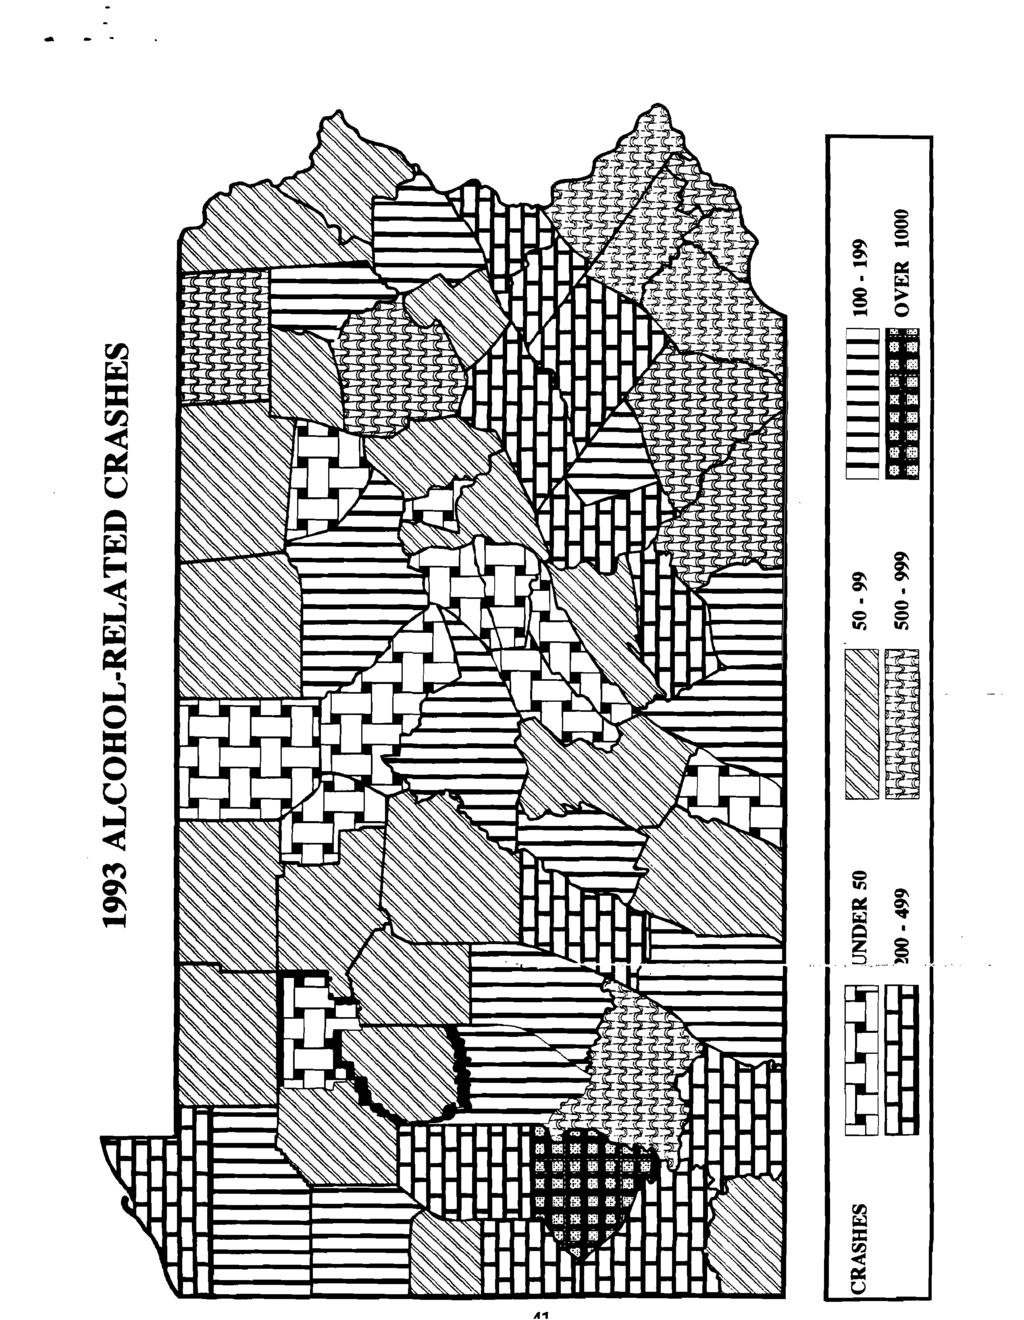
41 1993 Alcohol-related crashes are tho!.e crashes where either an involved driver or pedestrian (or both) had noticably been drinking. During 1993 there were a total of 13,183 alcohol-related crashes, a 5.7% reduction from Fatalities in alcohol-related crashes declined 5.1 % to a 1993 total of 596, continuing a steady downward trend from Alcohol-related fatalities were 3E% of the total 1993 traffic fatalities, the first year under 4% as far as can be determined from historical data. CHARACTERSTCS -rhe drinkers in traffic crashes are still 84% males, although there has been a slow but steady increase in the percentage of females over the past ten yecus. About 8% of the alcohol-related crashes are during hours of darkness, usually on weekends (Friday night, Saturday and early Sunday morning). nvolvement of underage drinking drivers (under age 21) continues to declne since passage of significant legislation which became effective in mid-'1988. n fatal crashes involving drinking drivers, about 83%; of the fatalities were the drinking driver (66%) or a passenger of a drinking driver (17%). October through December were the months with the highest incidence of alcohol-related crashes. October had a mean of 42.3 alcohol-related crashes per day. There was a mean of 36.1 alcohol-related crashes per day for the year of The lowest days for alcohol-rellated crashes during 1993 were generally during the early months of the year with the lowest day, Sunday, March 13, 1993, having only 8 alcohol-related crashes reported. The highest days for alcohol-related crashes during 1993 were generally during the latter months of the year with the highest day, Saturday, OctobEtr 2, 1993, having 88 alc,ohol-related crashes reported. The week prior to Christmas has historically been a period of high incidence of alcohol-related crashes and there were 87 reported on Thursday, December 23, 1993, the second highest day of the year. Alcohol-related fatalities averaged 1.48 killed per day during Highest reported days were generally on weekends. The two highest were Saturday, February 6, 1993 and Saturday, June 19, 1993 each with 8 alcohol-related deaths, The two highest three-day periods included the highest days with 15 alcohol-related deaths during the June 18th to June 2th period and 14 alcohol-rel,ated deaths during the February 4th to February 6th period. 31
42 1993 ALCOHOL NVOLVEMENT N CRASHES: DSTRBUTON BY CRASH SEVERTY TOTAL CRASHES 134,315 1'" ALCOHOL RELATED 13, % NON-ALCOHOL RELATED 121, % FATAL CRASHES '" NJURY CRASHES 8, % P.D.O. CRASHES 3, % TOTAL KLLED 596 TOTAL NJURED 13,344 MAJOR NJURY 1,363 MODERATE NJURY 3,361 MNOR NJURY 7,29 UNKNOWN NJURY 1,";SU ECONONUC LOSS DUE TO ALCOHOL RELATED CRASHES= $1,243,864,574..JlD THE ECONOMC LOSS TO EVERY MAN, WOMAN, AND CHLD N PENNSYLVANA DUE TO ALCOHOL RELATED CRASHES N 1993 WAS $
43 1993 ALCOHOL RELATED CRASHES BY LLUMNATON " ALCOHOL RELATED CRASHES 13,183 1k DAY UNKNOWN NGHT 2, % 61.46% 1, % FATAL CRASHES NJURY CRASHES P.D.O. CRASHES FATAL CRASHES NJURY CRASHES P.D.O. CRASHES % 1, % % % 6, % 3, % TOTAL KLLED 125 Major njuries 312 Moderatelnl 7 TOTAL KLLED 471 Major njuries 1,46 ModeratelnJ. 2,652 Minor nl. 1,629 Unk.lnJurl 3 Minor nl. 5,625 Unk.lnJurles 1,16 FATAL CRASHES \ NJURY CRASHES P... CRASHES.% % Major njury SOk Moderate njury 9 Minor njury 36 Unknown njury 14 '
44 ALCOHOL RELATED CRASH STATSTCS PERCENT CHANGE CRASHES 14,7 13,978 13, FATAL CRASHES NJURY CRASHES 9,511 9,29 8, P.D.O. CRASHES 3,943 4,2 3, NUMBER KLLED NUMBER NJURED 14,85 14,225 13, MAJOR NJURY 1,612 1,592 1, MODERATE NJURY 3,688 3,583 3, MNOR NJURY 7,551 7,517 7, ; UNKNOWN NJURY 1,954 1,533 1, FATAL CRASHES PER 1, LCENSED DRVERS NJURY CRASHES PER 1, LCENSED DRVERS DEATHS PER 1, LCENSED DRVERS NJURES PER 1, LCENSED DRVERS ALCOHOL RELATED CRASHES HSTORCAL DATA FATAL NJURY P.D.O. TOTAL TOTAL TOTAL YEAR CRASHES CRASHES CRASHES CRASHES KLLED NJURED ,86 6,835 19, , ,58 6,963 2, , ,338 6,457 -, _._1?,9 "-' _ , ,187 6,681 2, , ,219 6,245 2, , ,45 6,787 21, , ,353 6,311 21, , ,764 5,84 18, ,_ ,593 4,632 16, , ,17 4,542 16, , ,511 3,943 14, , ,29 4,2 13, , ,669 3,972 13, ,344 34
45 .ll p.'l ALCOHOL-RELATED FATALTES BY COUNTY ANNUAL PERCENT COUNTY FATALTES FATALTES FATAUTES FATALTES FATALTES GROWTH CHANGE RATE ADAMS ALLEGHENY 5", ARMSTRONG i BEAVER BEDFORD, BERKS 3: BLAR ' BRADFORD BUCKS BtrrLER S CAMBRA CAMERON CARBON CENTRE CHESTER CLARON CLEARFELD S CLNTON COLUMBA CRAWFORD S CUMBERLAND DAUPHN DELAWARE , ELK ERE S 13 1L FAYETfE FOREST FRANKUN S FULTON "_....._.., GREENE. ' ".---- ", -. '..--c"_" ",. ','. 'J '.,-. 1.2),. -, -,.4.._ HUNTNGDON 2 3 S NDANA JEFFERSON JUNATA LACKAWANNA LANCASTER LAWRENCE , LEBANON LEHGH LUZERNE LYCOMNG McKEAN MERCER S MFFLN MONROE MONTGOMERY MONTOUR NORTiAMPrON NORlHUMBERLAND PERRY PKE PO'TER SCHUYLKll SNYDER SOMERSET SUUlVAN , -' - SUSQUEHANNA ' TOGA UNON VENANGO WARREN WASHNGTON WAYNE WESTMORELAND WYOMNG S YORK PHLADELPHA TOTALS S96 37
46 1993 DRVER NVdLVEMENT N ALOHOL RELATED CRASHES BY VEHCLE TYPE TOTAL DRVERS N CRASHES 225,38, DRVERS N NON FATAL CRASHES 223,11 DRVERS N FATAL CRASHES 2,198.. DRVERS DU 12,68 1% DU DRVERS N FATAL CRASHES, 529 1,4 PASSENGER CA.R 8,GGG 71.,4 1 MOTORCYCLE PASSENGER CAR MOTORCYCLE!:-!95 2.3% , % UGHTTRUCKS 3, % -J BUS LGHT TRUCKS BUS G., ,4.% f'!. l-:. W HEAVY TRUCKS OTHER HEAVY TRUCKS Lis OTHER 31.2%.4,4 2.4%.9%, t, i N THE 13,28 CRASHES NV4VNG ALCOHOL, 12,68 DRNERS HAD BEEN DRNKNG. N THE 541 FATAL CRASHES divolvng ALCOHOL, 529 DRVERS HAD BEEN DRNKNG. w
47 * Means that both the driver and the pedestrian had been drinking 1993 PERSONS KLLED N CRASHES NVOLVNG DRNKNG DRVERS TOTAL ALCOHOL RELATED KLLFD TOTAL KLLED N DRNKNG DRVER CRASHES AGE DRNKNG DRVERS OCCUPANTS WTH DRNK NG DRVER NON DRNK NG DRVERS OCCUPANTS DRNKNG NON DRNK WTH NON PEDESTRAN NG PEDES DRNKNG i TRANS DRVERS AGE UNDER UNDER OVER 6 OVER 6 UNKNOWN AGE UNKNOWN AGE TOTAL TOTAL
48 nul ARRESTS BY COUNTY COUNTY ANNUAL PERCENT DU DU DU DU DU GROWTH CHANGE ARRESTS ARRESTS ARRESTS ARRESTS ARRESTS RATE ADAMS ALLEGHENY , ARMSTRONG BEAVER BEDFORD BERKS BLAR BRADFORD BUCKS BUTLER CAMBRA CAMERON CARBON CENTRE CHESTER 1,457 1, , CLARON 15] CLEARFELD CLNTON COLUMBA 15! CRAWFORD CUMBERLAND " DAUPHN 835 1,41 1, DELAWARE 1,751 2,12 1, ELK S5 1, FAYETE FOREST FRANKLN FULTON GREENE HUNTNGDON NDANA JEFFERSON 22< JUNATA LACKAWANNA LANCASTER , LAWRENCE LEBANON LEHGH , LUZERNE , LYCOMNG McKEAN MERCER MFFLN MONROE MONTGOMERY MONTOUR NORTHAMPTON 1, NORTHUMBERLAND PERRY PKE POTER SCHUYLKll 4: SNYDER SOMERSET 2: SUWVAN SUSQUEHANNA TOOA lti UNON! VENANGO WARREN WASHNGTON WAYNE WESTMORELAND 1,41 1, , WYOMNG YORK , , PHLADELPHA 2 2: TOTALS ,373 4,984 37,878 35,381 1,
 Cl'\ Cl'\ <= <= Q :z ;;J <=")
49 . 8 t:} > =a Q = = =...; = t:} t:}= < U f"') Cl'\ Cl'\ <= <= Q :z ;;J <= a,) fpl <= fpl Cl'\ Cl'\ <=.li

50 f;j :>...c Q =... = f;j f;j -<...c ;J Q =" =" '1 '1 a:. =...: = '1 '1 tri tri = = '1 '1 N vi,....4 vi - = = 4 /1'13
51

52 1993 ALCOHOL ELATED FATALTES. '. KLLED NONE l;: :::::::: ::::::: : :ll T 5 9 _OVERJO -. w
53 ALCOHOL RELATED CRASHES BY MONTH MONTH TOTAL CRASHES FATAL CRASHES FATALTES TOTAL ME.C.D* TOTAL ME.C.D* TOTAL ME.F.D.** JANUARY 1, FEBRUARY MARCH 1, APRil.. 1, MAY 1, JUNE '-._ _.-. 1, " '-1.47" 46 "- -1:53 JULY 1, AUGUST 1, SEPTEMBER 1, OCTOBER 1, NOVEMBER 1, DECEMBER 1, YEAR OVERALL * Mean CRASHES Per Day - Mean Fatalities Per Day 43
 a: w 2: a:: 3 l.")
54 DRVE:RS KLLED USNG ALCOHOL AS A PERC:ENTAGE OF TOTAL DRVER DEATHS Cl w 7 6..J 5..J S z w 3 () : w 2 a.. 1 a:1 N ;; -s:. ii; "E :l c;,-, Co KillecJEl:l & 581 _t : UNDERAGE DRNKNG DRVERS N PENNSYLVANA ACCDENTS (/) a: w 2: a:: 3 l.l. a: w CO ::E :;) z /9'73
 4-3")
55 1993 ALCOHOL-RELATED CRASHES TME BY DAY OF WEEK en w J: 8 en 6 () - LL. a: w co ::::» z ALCOHOL-RELATED FATAL CRASHES TME BY DAY OF WEEK 6 en w J: en 5 () 4-3 LL. a: w CO 2 ::::» z 1 45

56 VCTMS ()F ALCOHOL-RELATED FATAL CRASHES \ / DSTRBUTON BY AGE i D_ 13 AGE GOUP VCTMS OF ALCOHOL-RELATED FATAL CRASHES DSTRBLTON BY VEHCLE TYPE en 2 C 1 CR UN<NOWN 5 PEDESTRANS 31 OCCUPANTS 19 DRVERS o o 9 52 HEAVVlRUCK o 2 o 2 o o o 4 "../'.".... /..,/.j::.'...?.. '.t"./'''/ o 3 o 3 AGE GROUPS 46

57 VCTMS OF FATAL CRASHES DSTRBUTON BY TME OF DAY w...j...j a: w 15 co :::!: :;) 1 z 5 f2:ocl._ao 7:51 AM ALCOHOL NON-ALCOHOL VCTMS OF FATAL CRASHES DSTRBUTON BY DAY OF WEEK 16 c 14 W..J J S2 a: 8 w CD 6 :E :) 4 z 2 ALCOHOL NON-ALCOHOL o illille1l_iilleeillle Eill[] SUN MON TUE WED THU FR SAT
 a: w. -._.. a: o u. o w W.. 18-e:t.::::: 16 -r::::::::::::::>''::::::::::::t: 1 L:.")
58 PERCENT OF DRVER NVOLVEMENT N 1993 ALCOHOL-RELATED CRASHES BY AGE GROUP 25 en a: w 2 > a: 15 LL Z 1 W a: 5 w a.. Percental PERCENT OF DRVER NVOLVEMENT N 1993 NON-ALCOHOL-RELATED CRASHES BY AGE GROUP (J) a: w. -._.. a: o u. o w W.. 18-e:t.::::: 16 -r::::::::::::::>''::::::::::::t: 1 L:.:t:K:f(:: l"':;::::'::::;::)',,:.}:::::kle: o _ 48 f993
59 1993 DRNKNG DRVERS BY AGE AND SEX 3,5 en 3, a:: 2,5 a:: c 2, 15 a:: 1,5 w 1, :E :::> z 5 Females Males <' , ,783 1, t-'4:;o--l-"'92" AGE GROUPS BLOOD ALCOHOL CONTENT (BAC) DRVERS N FATAL ACCDENTS en 1 a: a: c 5 o BAC 49
60
61 1993 P:DESTRAN RELATED CRASHES: DSTRBUTON BY SEVERTY TOTAL CRASHES 134,315 1% PEDESTRAN CRASHES 6,12 4.5% NON-PEDESTRAN CRASHES 128, % FATAL CRASHES % NJURY CRASHES 5, % P.D.O. CRASHES 6.1% TOTAL PEDESTRANS KLLED] 214 TOTAL PEDESTRANS NJURED 6,154 OTHERS KLLED ] MAJOR NJURY 5n 9.4% 51 MODERATE NJURY 1, % MNOR NJURY -,,.., "_.'", n'... _,_ "._ 3, OGk UNKNOWN NJURY % 5
62 PEDESTRAN FATALTES BY COUNTY COUNTY ADAMS ALLEGHENY ARMSTRONG BEAVER BEDFORD BERKS BLAR BRADFORD BUCKS BUT.ER CAMBRA CAMERON CARBON CENTRE CHESTER CLARON CLEARFELD CLNTON COLUMBA CRAWFORD CUMBERLAND DAUPHN DELAWARE ELK 'l:jh': O FAYETTE FOREST FRANKLN FULTON 1 GREENE 2 HUNTNGDON NDANA JEFFERSON JUNATA 1 LACKAWANNA LANCASTER 7 S LAWRENCE 2 3 LEBANON 3 2 LEHGH LUZERNE LYCOMNG McKEAN 2 2 MERCER MFFLN 3 2 MONROE MONTGOMERY MONTOUR NORTHAMPTON NORTiUMBERLAND PERRY 2 3 PKE POTTER SCHUYLKLL SNYDER SOMERSET 2 SUlliVAN SUSQUEHANNA 2 1 TOGA 2 UNON 3 VENANGO WARREN 3 1 WASHNGTON WAYNE WESTMORELAND WYOMNG 3 YORK PHLADELPHA TOTAL :
63 PEDESTRAN NJURY SEVERTY,., BY STRKNG VEHCLE TYPE 1993 CRASHES i' COLUMN PASSENGER LGHT HEAVY BUS MOTORCYCLE OTHER! % CAR TRUCK TRUCK TYPE BODY TYPE UNKNOWN TOTAL DEATH 214 MAJOR NJURY MODERATE NJURY V, r. 5.88% sn 1,411 MNOR NJURY 3,326 NO... NJURY / / / i /, / / 49 UNKNOWN NJURY l} -() TOTAL W, e e K.<! e 'G ', 6,417
64 1993 PEDESTRAN FATALTES BY AGE GROUP AGE COUNTY 4 ADAMS AllEGHENY 2 ARMSTRONG BEAVER BEDFORD BERKS BLAR BRADFORD BUCKS BurLER CAMBRA CAMERON CARBON CENTRE CHESTER CLARON CLEARFlELD CLNTON COLUMBA CRAWFORD CUMBERLAND DAUPHN DELAWARE ELK ERE FAYETE FOREST FRANKLN FULTON GREENE HUNTNGDON NDANA JEFFERSON JUNATA LACKAWANNA LANCASTER 1 LAWRENCE LEBANON LEHGH LUZERNE LYCOMNG McKEAN MERCER MFFLN MONROE MONTGOMERY MONTOUR NORTHAMYrON NORTHUMBERLAND PERRY PKE POTER SCHUYLKLL SNYDER SOMERSET SULUVAN SUSQUEHANNA noga UNON VENANGO WARREN WASffiNGTON WAYNE WESTMORELAND WYOMNG YORK PHLADELPHA 2 TOTAL 9 AGE AGE 6 FATALTES AGE 1 14 AGE AND OVER ALL AGES UN KNOWN TOTAL PER 1, POPULATON ' '2 5. O.(J S
65 PEDSTRAN NJURES BY AGE GROUP AGE 6 NJURES AGE AGE AGE AGE AND ALL UN PER 1, COUNTY OVER AGES KNOWN TOTAL POPULATON ADAMS AU.EGHENY 3:Z ARMSTRONG BEAVER BEDFORD BERKS BLAR BRADFORD BUCKS BU'1.ER CAMBRA CAMERON CARBON CENTRE CHESTER CLARON CLFARFELD CLNTON COLUMBA CRAWFORD CUMBERLAND ,7 DAUPHN DELAWARE : ELK ERE FAYE'TE FOREST. FRANKUN FULTON. GREENE \ HUNTNGDON NDANA JEFFERSON JUNATA LACKAWANNA LANCAS'ER LAWRENCE LEBANON LEHGH LUZERNE LYCOMNG McKEAN MERCER MFFLN MONROE MONTGOMERY MONTOUR NORlHAMPTON NORTiUMBERLAND PERRY PKE ' POTER SCHUYLKLL SNYDER SOMERSET SULLVAN. SUSQU:HANNA noga UNON VENANGO WARREN \) WAS-DNGTON WAYNE WESTMORELAND WYOMNG YORK PHlLADELPHlA J TOTAL 43 1, ,963 6S8 5, ,1S

66 '.

67 1993 PEDESTRANS FATALTES DSTRBUTON BY AGE AND SEX* *For known age and sex 199:i PEDESTRANS WTH MAJOR NJURES DSTRBUTON BY AGE AND SEX* *For known age and sex 56
68 1993 PEDESTRANS WTH MODERATE NJURES DSTRBUTON BY AGE AND SEX* 3 25 (/) 2 w it..., ::;) 15 ẕ 1 5 *For known age and sex 1993 PEDESTRANS WTH MNOR NJURES DSTRBUTON BY AGE AND SEX* 8 (/) w a: ::;)..., z o *For known age and sex 57
69 qq3
70 /qqj
71 1993 CRASHES BY ROAD TYPE :JlY LLUMNATON J 134,TALCRASHEOOOk STATE HGHWAY LOCAL HGHWAY 85,9, 63.35% 4, %, i;;)l 1 DAY NGHT UNKNOWN DAY ; 56, % 'E1, % 58.68% 1, % 1,4''' TURNPKE NTERSTATE 1.1% 7, % 1 NGHT UNKNOWN % 6.41% seechan A seechan B SeeChan C SeeChan J SeeChan K SeeChan L ; DAY NGHT UNKNOWN: :::...:::113, % % DAY 4, % NGHT UNKNOWN 2, % 41.58% seechan G SeeChan H See Chan : SeeChan See Chan E SeeChan F -. \.N
.")
72 1993 PEDESTRANS WTH MODERATE NJURES DSTRBUTON BY AGE AND SEX* 3 25 en 2 w a: 15 :;)., Ẕ 1 5 *For known age and sex 1993 PEDESTRANS WTH MNOR NJURES DSTRBUTON BY AGE AND SEX* 8 en w a: :;)., Ẕ o *For known age and sex 57
73 STATE HGHWAY..1 CHART A DAY 56, MUDDY DRY WET SNOWCE UNKNOWN 38, % 11, % 58.1% 6, % % CHART B NGHT 27, , i MUDDY DRY WET SNOWCE UNKNOWN 18, %. 6, % 25.9% 3, % 89.32% :1 CHART C UNKNOWN Q W DRY %, WET MUDDY SNOWCE UNKNOWN 2.34% % % %
74 NTERSTATE CHAR1T D DAY 4,461, 63.16% : \,, DRY WET MUDDY SNOWnCE UNKNOWN 2, % 748 ; 16.77% 4.9/ % 9.2% CHART E NGtfT.'. -. 2, DRY 1, % 489 ;!. i -yet MUDDY SNOWnCE UNKNOWN 19.9/ 2.8/ % 7.27%, ;, CHART F UNKNOWN 41.5&-4 DRY % i : WET. i!!,, MUDDY % '.% / SNOWnCE UNKNOWN %
75 LOCAL HGHWAY ', CHART G DAY 26, % DRY WET MUDDY SNOW/CE UNKNOWN 19, %1 15, 'f.J %1 bl 7.95% % - i CHART H NGHT (7) 13, %.i 9,17 DRY 67.64% WET : 23.64% MUDDY SNOW/CE UNKNOWN 58.43% 1, 7.84% 61.45% CHART UNKNOWN k 187 (j DRY 41.74% C.. : % 3 MUDDY.67% 2 SNOWCE 4.46% 183 UNKNOWN 4.85%
76 TURNPKE CHART J DAY 1, % DRY WET MUDDY SNOW/CE UNKNOWN % 2ff1 2.23' 3.29% " 3.29% CHART K e NGHT % DRY, WET MUDDY SNOW/CE UNKNOWN % %.% % 1.22% CHART L UNKNOWN 6.41% DRY WET MUDDY SNOW/CE UNKNOWN %.%.% " %

77 - 63 DRVERS. NVOLVEMENT N CRASHES BY AGE AND SEX 1993 CRASHES U) D: w 35 3 > 25 c i. 2 D: 15 w m ::;) 1 z 5 o d.it:@ililli _...., ;.;'---=.=:t.a ""'+.a-.#:.." " 7 --t'.-#. /' TOTAL CRASHES BY MONTH m % 1 u L o 15 : ::a z o ). l +t./ +.t- ) 4J cp.;....,... -
![1993 FATAL CRASHES BY MONTH en w 16 14 :t: 12 1 LL 8 a: w 6 m :E ::» z 4 2 o Crashes [] 17 112 88 97](/docs-images/76/73162820/images/78-0.jpg "118 15 144 12 114 142 127 129 1993 FATAL ACCDENTS BY DAY BY HOUR 7-6 en w :c 5 4 ll.")
78 1993 FATAL CRASHES BY MONTH en w :t: 12 1 LL 8 a: w 6 m :E ::» z 4 2 o Crashes [] FATAL ACCDENTS BY DAY BY HOUR 7-6 en w :c 5 4 ll. a: w 3 m ::l 2 Z 1,
79 HOLDAY CRASHES CRASH SEVERTY FATAL NJURY P.D.O. PERSONS PERSONS TOTAL PEROD CRASHES CRASHES CRASHES KLLED NJURED CRASHES NEW YEARS POST NEW YEAR* PRE-MEMORAL* MEMORAL DAY POST-MEMORAL PRE-FOURTH* fourth OF JULY ,45 86 POST-FOURTH* PRE-LABOR* ABOR DAY POST-LABOR* PRE-THANKSGVNG* ,217 1,337 [rhanksgvng ,35 1,76 POST-THANKSGVNG* ,546 1,619 PRE-eHRSTMAS* ,99 1,177 k=hrstmas ,3 1,133 rrotals 187 9,89 5, ,641 15,37 SEE DEFNTONS UNDER HOLDAYS FOR EXPLANATON OF PRE AND POST PERODS. (q93
80 1993 ALCOHOL RELATED HOLDAY CRASHES PEROD CRASH SEVERTY FATAL NJURY CRASHES CRASHES P.D.O. CRASHES PERSONS KLLED PERSONS NJURED TOTAL CRASHES NEW YEARS POST NEW YEAR'" PRE-MEMORAL'" MEMORAL DAY POST-MEMORAL PRE-FOURTH'" Fel:fRTH ef:july POST-FOURTH'" - - _ J PRE-LABOR'"!LABOR DAY POST-LABOR '" PRE THANKSGVNG'" [THANKSGVNG POST-THANKSGVNG'" PRE-CHRSTMAS'" HRlSTlViAS.._ ",)'.._...-. " _ '6.. _... ' Pi'> 146 1AA - ifotals 95 1, , SEE DEFNTONS UNDER HOLDAYS FOR EXPL;ANATON OF PRE AND POST PERODS.
81 ..' COl'JSTRUCTON ZONE CRASHES TOTAL CRASHES 1,897 1%. 27 FATAL 1.4 ] 1,23 NJURY 63.42% 667 P.D.O % STATE ROAD: % STATE ROAD: % STATE ROAD: % LOCAL ROAD: % LOCAL ROAD: = % LOCAL ROAD: % TURNPKE: 3 11.H% TURNPKE: % TURNPKE: % NTERSTATE: /1% NTERSTATE: % NTERSTATE: % TOTAL KLLED 37 TOTAL NJURED 1,883 PEDESTRAN WORKMEN (LLED: PEDESTRAN WORKMEN!NJURED: o 26
82 CONSTRUCTON ZONE CRASHES ACCDENT TYPE TOTAL CRASHES 1,897 1% NON-COLLSON % -- SDESWPE % REAR END % HT FXED OBJECT % HEAD ON % HT PEDESTRAN % BACKNG UP 16.8% -- - '-- OTHERS 18.9% ANGLE % ' 1993 VEHCLE NVOLVEMENT N CONSTRUCTON ZONE CRASHES TOTAL VEHCLES 3,552 1% PASSENGER CAR 2, % LGHT TRUCK % MOTORCYCLE % HEAVY TRUCK % BUS BODY TYPE 17.5% 68 '- OTHER/UNKNOWN % 19r:r3
83 CO:NSTRUCTON ZONE CRASHES BY ROAD TYPE TOTAL CRASHES 1,897 1% STATE HGHWAY 1, % TURNPKE % LOCAL % NTERSTATE % 1993 CONSTRUCTON ZONE CRASHES BY WORK TYPE TOTAL CRASHES 1,897 1% CONSTRUCTON ZONE 1, % MANTENANCE ZONE % ) UTLTY CO. WORK ZONE % OTHER 19 1.% 69
84 /q<l3
85 1993 DRVER CRASH NVOLVEMENT BY SEVERTY BY DRVER LCENSE TOTAL NUMBER OF DRVERS NVOLVED N A CRASH 225,99 1 NVOLVED N FATAL CRASHES 2,198.98% NVOLVED N NJURY CRASHES 149, NVOLVED N P.D.O. CRASHES 73, PENNSYLVANA LCENSE 1, %. '('...- UNDER 16R NO LCENSE, 31 1.&acto PENNSYLVANA LCENSE 126, % UNDER 16 OR NO LCENSE :,1, % PENNSYlVANA LCENSE &3, % UNDER 16R NO LCENSE % OTHER U.S. LCENSE % NOT APPLCABLE % OTHER U.S. LCENSE 11,632 7.M NOT APPLCABLE, 2, % OTHER U.S. LCENSE 6,84 7.M!- NOT APPLCABLE 44.6% UNKNOWN LCENSE % (j FOREGN.36% UNKNOWN LCENSE 6, % ; ) L.- FOREGN / L UNKNOWN LCENSE 2, % - '- FOREGN 22 O.3()CYo 1
86 TRAFFC CRASHES NVOLVEMENT OF 16 TO 21 YEAR OLD DRVERS N: ALL CRASHES AGE FATAL NJURY PDO TOTAL ,322 2,115 5, ,324 2,755 7, , , ,378 2,459 ' _ , ,56 6,536 ' '.' _ , ALCOHOL RELATED CRASHES AGE FATAL NJURY PDO TOTAL
87 DRVERS N CRASHES CRASH SEVERTY AGE MAJOR MODERATE MNOR UNKNOWN ALL GROUP FATAL NJURY NJURY NJURY NJURY PDO DRVERS Under , , ,1 3,599 13,94 2,185 12,27 33, ,15 11,34 2,11 9,597 27, ,313 3,983 14,135 56,115 1,958 41,6 128,14 6 and Older ,954 11,785 2,387 7,717 25,95 Unknown Age ,73 1,652 2,373 8,861 TOTAL 2,198 6,916 25,26 '" 1,1,144 1'1,.1.J_ 1-',-' : - ;,o.,j"'''' 1993 DRVERS N ALCOHOL-RELATED CRASHES CRASH SEVERTY AGE GROUP.. "-."... FATAL " MAJOR. _. JllRY.. MODERATE NJURY MNOR NJURY.... _. UNKNOWN NJURY... -_.. PDO.., -"'- ALL DRVERS Under , , 1, , ,174 4, ,269 11,88 6 and Older Unknown Age TOTAL 75 1,375 3,265 6,413 1,75 4,944 17,822
88 74 PERSONS AGE 17 AND 18 KLLED N TRAFFC CRASHES 17-YEAR OLDS 18-YEAR OLDS TOTAL YEAR MALE FEMALE ALL MALE FEMALE ALL MALE FEMALE ALL TOTALS Between 1988 and there were 422 persons age 17 and 18 killed in traffic accidents (2.8% of total fatalities.) 262 (62.1 %) - of those killed were drivers 141 (33.4%) - were passengers 13 (3.1 %) - were pedestrians 6 (1.4%) - were unknown.161 or 38.2% were killed in alcohol-related accidents. 92 of which were 17- and 18-year old drivers using alcohol. Only 29 (6.87%) of the 422 fatalities in cars and trucks were wearing safety belts. Only 4 (.95%) of the 34 fatalities on motorcycles were wearing helmets. 146 (34.6%) of the 17- and 18-year-old fatalities were involved with vehicles traveling over the posted speed limit. /qtf3
89
90 1993 SNGLE VHCLE NON-COLLSON CRASHES SNGLE-VEHCLE NON-COLLSON.. CRASHES 4,168 1% PASSENGER CAR 1, MOTORCYCLE/MOPED % =- LGHT TRUCK 1, % PEDACYCLE.% HEAVY TRUCK % OTHER VEHCLE TYPE 22.53% BUSTROLLY 16.38'% - UNKNOWN VEHCLE TYPE % 75 /913
91 1993 SNGLE VEHCLE HT FXED OBJECT CRASHES SNGLE-VEHCLE HT FXED OBJECT CRASHES 43,65 1% PASSENGER CAR 31, '" MOTORCYCLE/MOPED % -.. LGHT TRUCK 9, % PEDACYCLE 1.% HEAVY TRUCK % OTHER VEHCLE TYPE 87.2% BUSTROLLY 71.16% --.. J(... UNKNOWN VEHCLE TYPE % 76
92 SNGLE VEHCLE HT PEDESTRAN CRASHES SNGLE-VEHCLE HT PEDESTRAN CRASHES 5,712, 1A! PASSENGER CAR 4, % MOTORCYCLE/MOPED 33.58% LGHT TRUCK '% - PEDACYCLE..% HEAVY TRUCK % OTHER VEHCLE TYPE 8.14% BUSTROLLY % '--'._.. - _.. - ;... KNOWN VELE=! 77
93 1993 TWO VEHCLE COLLSONS VEHCLE STRUCK CAR LGHT HEAVY BUS/ MOTORCYCLE! OTHER/ TOTAL STRKNG TRUCK TRUCK TROLLEY MOPED UNKNOWN ACCDENTS VEHCLE CAR 36,341 1,219 1, ,462 5,256 LGHT TRUCK 9,75 2, ,693 HEAVY TRUCK 1, BUS/ -TRO:L-ev MOTORCYCLE' MOPED OTHER/ UNKNOWN 1, ,121 TOTAL ACCDENTS 49,999 14,138 2, ,11 69,496 78

94 VE;HCLE NVOLVEMENT N CRASHES 1993 VEHllCLE NVOLVEMENT N FATAL CRASHES 14 Q J: u. o ffi m => z glallll!!' f?13
The 1994 TRAFFIC, CIlMII;~)
") The 1994 TRAFFC, ClM;~) Bur~au of Highway Safetr;~.".. "L' Transportation.. Enclosed for your information and use is a copy of a publication entitled "Pennsylvania Crash Facts and Statistics --- 1994."
The 1994 TRAFFC, ClM;~) Bur~au of Highway Safetr;~.".. "L' Transportation.. Enclosed for your information and use is a copy of a publication entitled "Pennsylvania Crash Facts and Statistics --- 1994."
TRAFFIC ACCIDENT FACTS and STATISTICS. Pennsylvania Department of Transportation 1988
 TRAFFC ACCDENT FACTS and STATSTCS Pennsylvania Department of Transportation 1988 NTRODUCTON The 1988 TRAFFC ACCDENT FACTS AND STATSTCS is a report published by the Center For Hi,hway Safety of the Pennsylvania
,. 215 Transportation and Safety Building 1 INTRODUCTION
 .-. NTRODUCTON The 987 TRAFFC ACCDENT FACTS AND STATSTCS is a report published by the Center For Highway Safety of the Pennsylvania Department of Transportation. This publication is a statistical review
CANCER of the ESOPHAGUS
 CANCER of the ESOPHAGUS Data Highlights As with other tobacco and alcohol-related cancers, blacks, especially males, had the highest average annual (1991-95) ageadjusted incidence rates 15.1, compared
CANCER of the PANCREAS
 CANCER of the PANCREAS Data Highlights The highest 1991-95 average annual age-adjusted incidence rate for pancreatic cancer occurred in black males (14.1). Black females had the second highest rate (10.4).
FIGURE 5 Average Annual Age-Adjusted Incidence and Mortality Rates* by Sex and Race, Pennsylvania Residents,
 CANCER of the COLON Data Highlights There were 7,011 resident cases of colon cancer diagnosed in 1996. It was the third most common cancer site among both males and females, accounting for over 10 percent
P E N N S Y L V A N I A H O U S I N G F I N A N C E A G E N C Y PAGE 2 BRADFORD 20% 57,700 8,080 9,240 10,400 11,540 12,480 13,400 14,320 15,240 16,16
 P E N N S Y L V A N I A H O U S I N G F I N A N C E A G E N C Y PAGE 1 ADAMS 20% 68,500 9,600 10,960 12,340 13,700 14,800 15,900 17,000 18,100 19,180 20% 513 240 257 308 356 397 438 479 30% 6/06/2016 14,400
BEAVER 20% 65,600 9,200 10,500 11,820 13,120 14,180 15,220 16,280 17,320 18,360 20%
 P E N N S Y L V A N I A H O U S I N G F I N A N C E A G E N C Y PAGE 1 ADAMS 20% 64,100 9,100 10,400 11,700 13,000 14,040 15,080 16,120 17,160 18,200 20% 477 227 243 292 338 377 416 455 30% 5/01/2014 13,650
P E N N S Y L V A N I A H O U S I N G F I N A N C E A G E N C Y PAGE 2 BRADFORD 20% 57,500 8,280 9,460 10,640 11,820 12,780 13,720 14,660 15,620 16,54
 P E N N S Y L V A N I A H O U S I N G F I N A N C E A G E N C Y PAGE 1 ADAMS 20% 75,100 9,640 11,020 12,400 13,760 14,880 15,980 17,080 18,180 19,260 20% 457 241 258 310 358 399 440 481 30% 6/01/2015 14,500
*** Applicable to SRO units that do not contain both sanitary (bathroom) and food preparation (kitchen) facilities.
 and food preparation (kitchen) facilities.") P E N N S Y L V A N I A H O U S I N G F I N A N C E A G E N C Y PAGE 1 ADAMS 20% 73,900 10,260 11,720 13,180 14,640 15,820 17,000 18,160 19,340 20,500 20%/FMR 470 256 274 329 380 425 468 512 30% 6/15/2017
P E N N S Y L V A N I A H O U S I N G F I N A N C E A G E N C Y PAGE 1 ADAMS 20% 73,900 10,260 11,720 13,180 14,640 15,820 17,000 18,160 19,340 20,500 20%/FMR 470 256 274 329 380 425 468 512 30% 6/15/2017
CANCER of the PANCREAS
 CANCER of the PANCREAS Data Highlights The highest 1992-96 average annual age-adjusted incidence rate for pancreatic cancer occurred in black males (13.9). Black females had the second highest rate (10.5).
TABLE B-17 RESIDENT LIVE BIRTHS BY RACE AND HISPANIC ORIGIN OF MOTHER BY COUNTY TOTAL BIRTHS, BIRTH AND GENERAL FERTILITY RATES*: PENNSYLVANIA, 1996
 TABLE B-17 RESIDENT LIVE BIRTHS BY RACE AND HISPANIC ORIGIN OF MOTHER BY COUNTY TOTAL BIRTHS, BIRTH AND GENERAL FERTILITY RATES*: PENNSYLVANIA, 1996 ---------------------------------------------------------------------------------------------------
FIGURE 23 Average Annual Age-Adjusted Incidence and Mortality Rates* by Sex and Race, Pennsylvania Residents,
 MULTIPLE MYELOMA Data Highlights Incidence rates for multiple myeloma reported from the National Cancer Institute's SEER Program show the highest risks in blacks. The 1992-96 average annual age-adjusted
CANCER of the KIDNEY and RENAL PELVIS
 CANCER of the KIDNEY and RENAL PELVIS Data Highlights There were 1,695 cases of cancer of the kidney and renal pelvis diagnosed in 1997 among residents of Pennsylvania, the highest annual number since
FIGURE 10 Average Annual Age-Adjusted Incidence and Mortality Rates* by Sex and Race, Pennsylvania Residents,
 MELANOMA of the SKIN Data Highlights Average annual (1991-95) age-adjusted incidence rates for melanoma of the skin among white males and females were 11. and 7., respectively; while among black males
P E N N S Y L V A N I A H O U S I N G F I N A N C E A G E N C Y PAGE 1 MTXR044 9:53:16 COUNTY-WIDE
 P E N N S Y L V A N I A H O U S I N G F I N A N C E A G E N C Y PAGE 1 ADAMS 20% 68,300 9,580 10,940 12,300 13,660 14,760 15,860 16,940 18,040 19,120 20%/FMR 413 239 256 307 355 396 437 478 40% 2/09/2012
HOUSING VOUCHERS FUNDED IN PENNSYLVANIA UNDER PENDING PROPOSALS
 820 First Street NE, Suite 510 Washington, DC 20002 Tel: 202-408-1080 Fax: 202-408-1056 center@cbpp.org www.cbpp.org November 1, HOUSING VOUCHERS FUNDED IN PENNSYLVANIA UNDER PENDING PROPOSALS Due largely
Pennsylvania Juvenile Court Dispositions
 2 0 0 9 Pennsylvania Juvenile Court Dispositions Commonwealth Of Pennsylvania Hon. Edward G. Rendell, Governor Juvenile Court Judges Commission Chairman Hon. Arthur E. Grim Berks County Vice-Chairman Hon.
ACc\d ent. facts & stot\st\c S
 ACc\d ent. facts & stot\st\c S ! < 99 t NTRODUCTON The 99 TRAFFC ACCDNT FACTS AND STATSTCS is a report published by the Center for Highway Safety of the Pennsylvania Department of Transportation. This
INTRODUCTION. Specific questions regarding data presented in this report should be addressed to:
 99 NTRODUCTON The 99 TRAFFC ACCDENT FACTS AND STATSTCS is a report published by the Center for Highway Safety of the Pennsylvania Department of Transportation. This publication is a statistical review
Michigan. Traffic. Profile
 June 2014 Revised 5/11/15 Michigan 2013 Traffic Crash Profile Reporting Criteria Please pay particular attention to the wording when interpreting the three levels of data gathered for this report. Crash
Delaware Information and Analysis Center
 Delaware Information and Analysis Center 2015 DELAWARE THERE WERE 684,731 LICENSED DRIVERS, 892,508 REGISTERED MOTOR VEHICLES, AND 9,761,000,000 VEHICLE MILES DRIVEN*. THERE WERE 24,066 TRAFFIC CRASHES
BID ITEM WORKBOOK COSTARS-12 Emergency Responder Loose Supplies BIDDER/CONTRACTOR DATA 2/8/2016
 BIDDER/CONTRACTOR DATA 2/8/2016 BIDDER/CONTRACTOR'S LEGAL NAME: D/B/A NAME, IF APPLICABLE: BIDDER ADDRESS: COUNTY LOCATED IN: 912 Pittsburgh Road Butler, PA 16002 Butler County PA Legislative House District
TRAFFIC SAFETY FACTS. Overview Data
 TRAFFIC SAFETY FACTS 2009 Data Overview Motor vehicle travel is the primary means of transportation in the United States, providing an unprecedented degree of mobility. Yet for all its advantages, injuries
2016 Community Report Los Alamos County
 6 Los Alamos County Produced for the New Mexico Department of Transportation, Traffic Safety Division, Traffic Records Bureau, Under Contract 58 by the University of New Mexico, Geospatial and Population
2015 Community Report White Rock
 5 White Rock Produced for the New Mexico Department of Transportation, Traffic Safety Division, Traffic Records Bureau, Under Contract 58 by the University of New Mexico, Geospatial and Population Studies,
Traffic Safety Facts 2002
 DOT HS 89 616 U.S. Department of Transportation National Highway Traffic Safety Administration Traffic Safety Facts 22 A Public Information Fact Sheet on Motor Vehicle and Traffic Safety Published by the
DOT HS April 2013
 TRAFFIC SAFETY FACTS 2011 Data DOT HS 811 753 April 2013 Overview Motor vehicle travel is the primary means of transportation in the United States, providing an unprecedented degree of mobility. Yet for
2015 Community Report Las Vegas
 5 Las Vegas Produced for the New Mexico Department of Transportation, Traffic Safety Division, Traffic Records Bureau, Under Contract 58 by the University of New Mexico, Geospatial and Population Studies,
Michigan. Traffic. Profile
 June 2014 Revised 5/11/15 Michigan 2013 Traffic Crash Profile Reporting Criteria Please pay particular attention to the wording when interpreting the three levels of data gathered for this report. Crash
2015 Community Report Los Lunas
 25 Los Lunas Produced for the New Mexico Department of Transportation, Traffic Safety Division, Traffic Records Bureau, Under Contract 58 by the University of New Mexico, Geospatial and Population Studies,
Where are the Increases in Motorcycle Rider Fatalities?
 Where are the Increases in Motorcycle Rider Fatalities? Umesh Shankar Mathematical Analysis Division (NPO-121) Office of Traffic Records and Analysis National Center for Statistics and Analysis National
Traffic Safety Facts. Alcohol Data. Alcohol-Related Crashes and Fatalities
 Traffic Safety Facts 2005 Data Alcohol There were 16,885 alcohol-related fatalities in 2005 39 percent of the total traffic fatalities for the year. Alcohol-Related Crashes and Fatalities DOT HS 810 616
Traffic Safety Network Huron Valley
 June 2018 Revised 8/3/2018 2017 Reporting Criteria Please pay particular attention to the wording when interpreting the three levels of data gathered for this report. Crash The Crash Level analyzes data
Alberta. Collision Facts. 330 people killed. 17,907 people injured. 140,705 collisions.
 Collision Facts 330 people killed 17,907 people injured 140,705 collisions May 2017 www.transportation.alberta.ca/statistics Collision Facts 330 people killed 17,907 people injured 140,705 collisions Monday
Overview for Contract Prior to utilizing a contract, the user should read the contract in it's entirety. Validity Period to
 Overview for Contract Prior to utilizing a contract, the user should read the contract in it's entirety. DESCRIPTION Contract 9985-23 covers Scrap Rubber Removal Services for all agencies within the Commonwealth.
2016 Community Report Portales
 6 Portales Produced for the New Mexico Department of Transportation, Traffic Safety Division, Traffic Records Bureau, Under Contract 58 by the University of New Mexico, Geospatial and Population Studies,
2015 Community Report Grants
 5 Grants Produced for the New Mexico Department of Transportation, Traffic Safety Division, Traffic Records Bureau, Under Contract 58 by the University of New Mexico, Geospatial and Population Studies,
2016 Community Report Torrance County
 6 Torrance County Produced for the New Mexico Department of Transportation, Traffic Safety Division, Traffic Records Bureau, Under Contract 58 by the University of New Mexico, Geospatial and Population
2015 Community Report Torrance County
 5 Torrance County Produced for the New Mexico Department of Transportation, Traffic Safety Division, Traffic Records Bureau, Under Contract 58 by the University of New Mexico, Geospatial and Population
2016 Community Report De Baca County
 6 De Baca County Produced for the New Mexico Department of Transportation, Traffic Safety Division, Traffic Records Bureau, Under Contract 58 by the University of New Mexico, Geospatial and Population
2015 Community Report Tularosa
 5 Tularosa Produced for the New Mexico Department of Transportation, Traffic Safety Division, Traffic Records Bureau, Under Contract 58 by the University of New Mexico, Geospatial and Population Studies,
2014 Community Report Las Vegas
 4 Las Vegas Produced for the New Mexico Department of Transportation, Traffic Safety Division, Traffic Records Bureau, Under Contract 58 by the University of New Mexico, Geospatial and Population Studies,
State Infrastructure Bank Annual Report to the United States Department of Transportation
 State Infrastructure Bank Annual Report to the United States Department of Transportation by the Pennsylvania Department of Transportation For the period of October 1, 2006 through September 30, 2007 The
2016 Community Report Santa Fe County
 26 Santa Fe County Produced for the New Mexico Department of Transportation, Traffic Safety Division, Traffic Records Bureau, Under Contract 58 by the University of New Mexico, Geospatial and Population
2015 Community Report Chaparral
 5 Chaparral Produced for the New Mexico Department of Transportation, Traffic Safety Division, Traffic Records Bureau, Under Contract 58 by the University of New Mexico, Geospatial and Population Studies,
2016 Community Report Aztec
 Aztec Produced for the New Mexico Department of Transportation, Traffic Safety Division, Traffic Records Bureau, Under Contract 58 by the University of New Mexico, Geospatial and Population Studies, Traffic
2015 Community Report Aztec
 25 Aztec Produced for the New Mexico Department of Transportation, Traffic Safety Division, Traffic Records Bureau, Under Contract 58 by the University of New Mexico, Geospatial and Population Studies,
2016 Community Report San Juan County
 26 San Juan County Produced for the New Mexico Department of Transportation, Traffic Safety Division, Traffic Records Bureau, Under Contract 58 by the University of New Mexico, Geospatial and Population
2015 Community Report San Juan County
 25 San Juan County Produced for the New Mexico Department of Transportation, Traffic Safety Division, Traffic Records Bureau, Under Contract 58 by the University of New Mexico, Geospatial and Population
2015 Community Report Doña Ana County
 25 Doña Ana County Produced for the New Mexico Department of Transportation, Traffic Safety Division, Traffic Records Bureau, Under Contract 58 by the University of New Mexico, Geospatial and Population
2014 Community Report Los Lunas
 4 Los Lunas Produced for the New Mexico Department of Transportation, Traffic Safety Division, Traffic Records Bureau, Under Contract 58 by the University of New Mexico, Geospatial and Population Studies,
Michigan State Police (MSP) Post 21 - Metro North
 Post 21 - Metro North") June 2018 Revised 8/3/2018 2017 Reporting Criteria Please pay particular attention to the wording when interpreting the three levels of data gathered for this report. Crash The Crash Level analyzes data
June 2018 Revised 8/3/2018 2017 Reporting Criteria Please pay particular attention to the wording when interpreting the three levels of data gathered for this report. Crash The Crash Level analyzes data
2014 Community Report Portales
 4 Portales Produced for the New Mexico Department of Transportation, Traffic Safety Division, Traffic Records Bureau, Under Contract 58 by the University of New Mexico, Geospatial and Population Studies,
Michigan State Police (MSP) Post 21 - Metro North
 Post 21 - Metro North") October 2017 2016 Reporting Criteria Please pay particular attention to the wording when interpreting the three levels of data gathered for this report. Crash The Crash Level analyzes data related to crash
October 2017 2016 Reporting Criteria Please pay particular attention to the wording when interpreting the three levels of data gathered for this report. Crash The Crash Level analyzes data related to crash
2014 Community Report Luna County
 4 Luna County Produced for the New Mexico Department of Transportation, Traffic Safety Division, Traffic Records Bureau, Under Contract 58 by the University of New Mexico, Geospatial and Population Studies,
2014 Community Report Truth or Consequences
 4 Truth or Consequences Produced for the New Mexico Department of Transportation, Traffic Safety Division, Traffic Records Bureau, Under Contract 58 by the University of New Mexico, Geospatial and Population
2014 Community Report Tularosa
 4 Tularosa Produced for the New Mexico Department of Transportation, Traffic Safety Division, Traffic Records Bureau, Under Contract 8 by the University of New Mexico, Geospatial and Population Studies,
2014 Community Report Aztec
 Aztec Produced for the New Mexico Department of Transportation, Traffic Safety Division, Traffic Records Bureau, Under Contract 58 by the University of New Mexico, Geospatial and Population Studies, Traffic
Traffic Safety Facts 1995
 U.S. Department of Transportation National Highway Traffic Safety Administration Traffic Safety Facts 1995 exceeding the posted speed limit or driving too fast for conditions is one of the most prevalent
Alberta Speeding Convictions and Collisions Involving Unsafe Speed
 Alberta Speeding Convictions and Collisions Involving Unsafe Speed 2004-2008 Overview This document was prepared under the Alberta Traffic Safety Plan, Strategic Research Plan for 2008-2010, with the objective
Large Trucks. Trends. About 1 in 10 highway deaths occurs in a crash involving a large truck.
 Large Trucks About 1 in 10 highway deaths occurs in a crash involving a large truck. Most deaths in large truck crashes are passenger vehicle occupants. The main problem is the vulnerability of people
Washtenaw County Traffic Crash Data & Year Trends. Reporting Criteria
 June 2018 Revised 8/3/2018 2017 Reporting Criteria Please pay particular attention to the wording when interpreting the three levels of data gathered for this report. Crash The Crash Level analyzes data
Washtenaw County Traffic Crash Data & Year Trends. Reporting Criteria
 June 2017 Revised 10/3/17 2016 Reporting Criteria Please pay particular attention to the wording when interpreting the three levels of data gathered for this report. Crash The Crash Level analyzes data
Van Buren County Traffic Crash Data & Year Trends. Reporting Criteria
 May 2015 Revised 3/16/2016 2014 Reporting Criteria Please pay particular attention to the wording when interpreting the three levels of data gathered for this report. Crash The Crash Level analyzes data
2016 Community Report New Mexico
 216 Produced for the Department of Transportation, Traffic Safety Division, Traffic Records Bureau, Under Contract 581 by the University of, Geospatial and Population Studies, Traffic Research Unit Distributed
Los Lunas Community Report, 2002
 Los Lunas Community Report, Demographics In, there were, licensed drivers in Los Lunas. Of these, there were, females and, males. The population of Los Lunas was,. The total number of crashes in was, yielding
Michigan State Police (MSP) Traffic Safety Network Traverse Bay Area
 Traffic Safety Network Traverse Bay Area") June 2016 Revised 2/15/2017 2015 Reporting Criteria Please pay particular attention to the wording when interpreting the three levels of data gathered for this report. Crash The Crash Level analyzes data
June 2016 Revised 2/15/2017 2015 Reporting Criteria Please pay particular attention to the wording when interpreting the three levels of data gathered for this report. Crash The Crash Level analyzes data
WASTE OIL, OIL/WATER MIXTURES, AND ASPHALT CONDENSATE TRANSFER FACILITIES AND RAIL TRANSLOADING FACILITIES Rev. 12/2007
 A. Description: This approval authorizes the operation of transfer facilities and rail transloading facilities for the processing of waste oil (including waste oil mixed with waste in accordance with 25
DIRECTORY OF PENNDOT OFFICES
 DIRECTORY OF PENNDOT OFFICES (INCLUDES LOCATION MAPS) PUB 22 (9-18) FACILITIES MANAGEMENT A division of Bureau of Office Services PENNDOT STATEWIDE KEY MAP...2 CENTRAL OFFICE LOCATIONS Capital Complex...3
DIRECTORY OF PENNDOT OFFICES
 DIRECTORY OF PENNDOT OFFICES (INCLUDES LOCATION MAPS) PUB 22 (8-16) FACILITIES MANAGEMENT A division of Bureau of Office Services PENNDOT STATEWIDE KEY MAP...2 CENTRAL OFFICE LOCATIONS Capital Complex...3
PENNSYLVANIA CRASH FACTS & STATISTICS
 2013 PENNSYLVANIA CRASH FACTS & STATISTICS GOVERNOR Tom Corbett SECRETARY OF TRANSPORTATION Barry J. Schoch, P.E. Introduction The 2013 Pennsylvania Crash Facts and Statistics booklet is a report published
Doña Ana County Report, 2001
 Doña Ana County Report, 1 Demographics In 1, there were 7,7 licensed drivers in Doña Ana County. Of these, there were 17,15 females and,115 males. The population in Doña Ana County was 87,1. The total
CHAPTER TWO AUTO CRASH STATISTICS
 CHAPTER TWO AUTO CRASH STATISTICS Age and Its Impact: Teen Drivers Teen Driving Statistics Age and Its Impact: Elderly Drivers Elderly Driving Statistics Auto Crash Statistics AGE AND ITS IMPAC T: TEEN
Driving Safely in Maryland
 Maryland Department of Transportation State Highway Administration Office of Traffic and Safety Driving Safely in Maryland In 2008, there were 141 fatal speeding crashes, accounting for 28% of all fatal
ALCOHOL AND WYOMING TRAFFIC CRASHES
 AND WYOMING TRAFFIC -2007- 2002-2007 SUMMARY COMPARISON FOR WYOMING TRAFFIC YEAR OF 2002 2003 2004 2005 2006 2007 ALL FATAL 151 141 142 147 169 136 FATAL 53 43 50 51 58* 46* PERCENT [%] 35.0% 30.5% 35.2%
 1 of 7 9/23/2015 5:23 PM Demographics In 2008, there were 12,286 licensed drivers in Socorro County. Of these, there were 5,872 females and 6,414 males. The population of Socorro County was 18,180. The
Rio Arriba County Report, 2007
 Rio Arriba County Report, 7 Demographics In 7, there were 3,748 licensed drivers in Rio Arriba County. Of these, there were,68 females and,63 males. The population in Rio Arriba County was 4,87. The total
TABLE OF CONTENTS CRASHES.. VI TRENDS. VII
 TABLE OF CONTENTS Introduction. I Letter from the Governor II Executive Summary of this Report. III-IV 1998 Nevada Quick Collision Facts V CRASHES.. VI a. Statewide Total Crashes by Severity... 1 b. Statewide
Pedestrians Road Safety
 Pedestrians Road Safety Overview According to the World Health Organization, the World Bank, the FIA Foundation for the Automobile and Society and the Global Road Safety Partnership collaborative report
Department of Highway Safety and Motor Vehicles
 Department of Highway Safety and Motor Vehicles Traffic Report 2005 A Compilation of Motor Vehicle Crash Data from the Florida Crash Records Database Fred O. Dickinson Executive Director Our Mission: Making
ITSMR Research Note. Young Drivers on New York Roadways:
 January 2019 KEY FINDINGS In 2017: 113 persons were killed in motor vehicle crashes involving young drivers, compared to 139 in 2013. 22,485 persons were injured in young driver crashes, down 5% from 2013.
DOT HS October 2011
 TRAFFIC SAFETY FACTS 2009 Data DOT HS 811 389 October 2011 Motorcycles Definitions often vary across publications with respect to individuals on motorcycles. For this document, the following terms will
1 of 7 9/22/2015 1:20 PM
 1 of 7 9/22/2015 1:20 PM Demographics In 2009, there were 27,245 licensed drivers in Alamogordo. Of these, there were 13,674 females and 13,571 males. The population of Alamogordo was 35,984. The total
 1 of 7 9/23/2015 5:20 PM Demographics In 2008, there were 91,559 licensed drivers in Sandoval County. Of these, there were 46,678 females and 44,881 males. The population of Sandoval County was 122,298.
Kent County Traffic Crash Data & Year Trends. Reporting Criteria
 May 2015 Revised 3/16/2016 2014 Reporting Criteria Please pay particular attention to the wording when interpreting the three levels of data gathered for this report. Crash The Crash Level analyzes data
Pedestrians Road Safety
 Pedestrians Road Safety Overview Over the period 1996-2009, 5,323 people have been killed on Irish road. Out of this 22% (1162) were pedestrians. Additional 3863 pedestrians were seriously injured in the
Rio Arriba County Report, 2002
 Rio Arriba County Report, Demographics In, there were,8 licensed drivers in Rio Arriba County. Of these, there were 8,8 females and 8,8 males. The population in Rio Arriba County was,9. The total number
Fatal Motor Vehicle Crashes on Indian Reservations
 April 2004 DOT HS 809 727 Fatal Motor Vehicle Crashes on Indian Reservations 1975-2002 Technical Report Colleges & Universities 2% Other Federal Properties 9% Other 4% Indian Reservations 65% National
National Center for Statistics and Analysis Research and Development
 U.S. Department of Transportation National Highway Traffic Safety Administration DOT HS 809 271 June 2001 Technical Report Published By: National Center for Statistics and Analysis Research and Development
LOADING AND UNLOADING SURVEY NATIONAL SCHOOL BUS. Kansas leads the world in the success of each student.
 NATIONAL SCHOOL BUS LOADING AND UNLOADING SURVEY Kansas leads the world in the success of each student. January 2018 The Kansas State Department of Education School Bus Safety Unit wishes to thank the
DOT HS July 2012
 TRAFFIC SAFETY FACTS 2010 Data DOT HS 811 639 July 2012 Motorcycles In 2010, 4,502 motorcyclists were killed a slight increase from the 4,469 motorcyclists killed in 2009. There were 82,000 motorcyclists
TRAFFIC SAFETY FACTS Fatal Motor Vehicle Crashes: Overview. Research Note. DOT HS October 2017
 TRAFFIC SAFETY FACTS Research Note DOT HS 812 456 October 2017 2016 Fatal Motor Vehicle Crashes: Overview There were 37,461 people killed in crashes on U.S. roadways during 2016, an increase from 35,485
Demographics An updated licensed driver count is not available for Navajo Nation for The total number of crashes in 2008 was 95.
 1 of 6 9/23/2015 4:57 PM Demographics An updated licensed driver count is not available for Navajo Nation for 2008. The total number of crashes in 2008 was 95. General Crash Information From 1999 to 2008
Preliminary 2014 Ontario Road Safety Annual Report Selected Statistics
 Selected Statistics The following tables were created using the preliminary fatality and injury data from the 2014 Ontario Collision Database. Final numbers will vary. Produced by: Road Safety Research
Quick Facts General Statistics. Fatality Rate per 100,000 Population Source: FARS/Census
 Fatal Crashes 2016 34,439 2015 32,539 2014 30,056 Fatality Rate per 100 Million VMT 2016 1.18 2015 1.15 2014 1.08 /FHWA 2016 37,461 2015 35,485 2014 32,744 General Statistics Fatality Rate per 100,000
Gallup Community Report, 2007
 Gallup Community Report, 7 Demographics In 7, there were,8 licensed drivers in Gallup. Of these, there were 7,9 females and 7,9 males. The population of Gallup was 8,8. The total number of crashes in 7
SECTION 1: HISTORICAL
 SECTION 1: HISTORICAL 14 MOTOR VEHICLE CRASHES IN NEW ZEALAND 29 TABLE 1: CASUALTY RATES HISTORICAL YEAR ENDING 31 DECEMBER () Vehicles* () Number of Injuries INJURIES Per 1, Per 1, Vehicles Number of
ROADWAY INJURY EXPERIENCE FOR PERSONS WHO HAD BEEN DRINKING AND/OR USING DRUGS
 ROADWAY INJURY EXPERIENCE FOR PERSONS WHO HAD BEEN DRINKING AND/OR USING DRUGS Vehicle Severity Total Crashes involving drinking, not drugs Crashes involving drugs, not drinking Crashes involving drinking
the Ministry of Transport is attributed as the source of the material images contained in the material are not copied
 Speed 2017 Disclaimer All reasonable endeavours are made to ensure the accuracy of the information in this report. However, the information is provided without warranties of any kind including accuracy,