(This page intentionally left blank)
|
|
|
- Grant Jones
- 5 years ago
- Views:
Transcription

1
2 (This page intentionally left blank)
3 2002 BASELINE EMISSIONS INVENTORY March 2004 Prepared for: PORT OF LONG BEACH Prepared by: Starcrest Consulting Group, LLC 6200 Taggart Street Houston, Texas 77007
4 (This page intentionally left blank)
5 TABLE OF CONTENTS EXECUTIVE SUMMARY...7 SECTION 1 INTRODUCTION Purpose and Scope General Methodology Geographical Extent Terminal Reconfigurations Results Report Organization SECTION 2 CARGO HANDLING EQUIPMENT Terminal and Equipment Types Container Terminals Break Bulk and Dry Bulk Terminals Liquid Bulk Terminals Auto Terminals Methodology Data Collection Emissions Estimation Emission Estimates SECTION 3 RAILROAD LOCOMOTIVES Rail System and Locomotives Rail System Description Description of Locomotives Methodology Data Collection Emissions Estimation Emission Estimates Switching Emissions Line Haul Emissions Starcrest Consulting Group, LLC March 2004
6 SECTION 4 HEAVY-DUTY VEHICLES HDV Types and Activity Methodology Data Collection Emissions Estimation Emission Estimates On-Terminal Results On-Road Results SECTION 5 CONCLUSIONS Strengths Limitations Recommendations COMMENTS RECEIVED FROM SCAQMD ATTACHMENT 1 - AGENCY REVIEW COMMENTS AND RESPONSES APPENDIX A CARGO HANDLING EQUIPMENT INVENTORY AND SUPPORTING DATA APPENDIX B LOCOMOTIVE EI SUPPORTING DATA APPENDIX C HEAVY-DUTY VEHICLE EI SUPPORTING DATA Starcrest Consulting Group, LLC March 2004
7 LIST OF FIGURES Figure ES.1: Percentage Breakdown of Emissions by Category...8 Figure 1.1: Port of Long Beach EI Boundary Figure 1.2: POLB Emissions by Source Category, tpy Figure 1.3: Percentage Breakdown of Emissions by Category Figure 2.1: Distribution of CHE by Equipment Type Figure 2.2: Distribution of Container Terminal CHE by Equipment Type Figure 2.3: Yard Tractor Figure 2.4: Rubber Tired Gantry Crane Figure 2.5: Top Handler Figure 2.6: Forklift Figure 2.7: Side Loader Figure 2.8: Distribution of Dry Bulk and Break Bulk CHE by Type Figure 2.9: Forklift Figure 2.10: Rubber Tired Loader Figure 2.11: Skid Steer Loader Figure 2.12: Crane Figure 2.13: Sweeper Figure 2.14: Comparison of CHE Emissions with Port-Wide Emissions, tpy Figure 2.15: CHE NO x Emissions, tpy Figure 2.16: CHE TOG Emissions, tpy Figure 2.17: CHE CO Emissions, tpy Figure 2.18: CHE PM 10 Emissions, tpy Figure 2.19: CHE PM 2.5 Emissions, tpy Figure 2.20: CHE DPM Emissions, tpy Figure 2.21: CHE SO 2 Emissions, tpy Figure 3.1: Comparison of Locomotive Emissions with Port-Wide Emissions, tpy. 61 Figure 4.1: Truck with Container...78 Figure 4.2: Bobtail Truck...79 Figure 4.3: Model Year Distribution Figure 4.4: Comparison of HDV Emissions with Port-Wide Emissions, tpy Starcrest Consulting Group, LLC March 2004
8 LIST OF TABLES Table ES.1: 2002 Emissions by Source Category, tpy...8 Table ES.2: 2002 Emissions by Source Category, tpd...8 Table 1.1: POLB Operational Changes in Table 1.2: 2002 Emissions by Source Category, tpy Table 1.3: 2002 Emissions by Source Category, tpd Table 2.1: Most Common Engine Manufacturer for CHE Table 2.2: Container Terminals, Table 2.3: Break Bulk and Dry Bulk Terminals, Table 2.4: Liquid Bulk Terminals, Table 2.5: Terminal and OFFROAD Equipment Type Cross-Reference Table 2.6: CHE Emissions by Terminal Type Table 2.7: CHE NO x Emissions Table 2.8: CHE TOG Emissions Table 2.9: CHE CO Emissions Table 2.10: CHE PM 10, PM 2.5, and DPM Emissions Table 2.11: CHE SO 2 Emissions Table 2.12 New Automobile Emissions, tons/year Table 2.13 Running Emission Factors, grams/mile Table 2.14 Starting Emission Factors, grams/start Table 2.15 Evaporative Emission Factors Table 3.1: Typical On and Off-Port Switching Locomotives Table 3.2: Locomotive Operations Estimated Emissions Table 3.3: In-use Horsepower Characteristics of Switch Locomotives Table 3.4: Calculation of Notch-Specific In-Use Horsepower (Switch Engines) Table 3.5: Horsepower-Based Emission Factors from RSD (Switch Engines) Table 3.6: Hourly Notch-Specific Emission Rates (Switch Engines) Table 3.7: Time-in-Notch and Weighted Average Emission Rates Table 3.8: Estimate of Annual Switching Locomotive Hours of Operation Table 3.9: Estimate of Distribution of Emissions Between Ports Table 3.10: Estimated Switching Emissions for POLB Starcrest Consulting Group, LLC March 2004
9 Table 3.11: Calculation of Average In-Use Horsepower Table 3.12: Fuel Use Estimate for In-Port Switching Table 3.13: Off-Port Rail Yard Locomotive Fuel Use Record Table 3.14: Switching Activity Fuel Use at the Off-Port Rail Yard Table 3.15: Estimated Off-Port Rail Yard Emissions Table 3.16: EPA Line Haul Locomotive Data Table 3.17: POLB Notch-Specific Emission Rates (Line Haul) Table 3.18: POLB Line Haul Time-in-Notch and Weighted Average Emission Rates Table 3.19: POLB Line Haul Locomotive Activity Estimate Table 3.20: POLB Line Haul Locomotive Emission Estimates Table 4.1: Terminal Operating Characteristics Table 4.2: EMFAC Output for HDV Table 4.3: Summary of POLB Highway HDV Emission Estimates Table 4.4: POLB On-Terminal HDV Emission Estimates Table 4.5: Container Terminal Gate Queue Emission Estimates Table 4.6: POLB On-Road Emission Estimates Starcrest Consulting Group, LLC March 2004
10 ACKNOWLEDGEMENTS The following individuals and their respective companies and organizations assisted with providing the technical and operational information described in this report. This report would not have been possible without their assistance and support. We truly appreciate their time, effort, and cooperation in providing access to technical and operational data. The Port of Long Beach and Starcrest Consulting Group, LLC (Starcrest) would like to thank the following people for providing information on the operations of container terminals, locomotives and on-road trucks at the Port of Long Beach: Art Gonzales, Baker Commodities Chuck West, BNSF Railroad John Chavez, BNSF Railroad Jim McLaughlin, BP/Arco Kevin Elizondo, Cal United Stephen Dillon, Cemex Tyrone McLaine, Equillon Tom Brophy, Forest Terminal Lynn Forsberg, Fremont Forest Group Kevin Nicolello, Hanjin Robert Loya, Horizon Lines Scott Lebbin, Koch Carbon Kevin Hayes, Long Beach Container Terminal Jim Flanagan, Maersk Robert Waterman, Metropolitan Stevedore Malcom Pitt, Metropolitan Stevedore Eric Jen, Mitsubishi Cement Ken Dobson, Morton Salt Ken Pope, MTC Dale Leuer, Pacific Coast Recycling Andrew Fox, Pacific Harbor Line Greg Peters, Pacific Harbor Line Bill Roufs, Pacific Harbor Line Jim Menees, Petro Diamond Klaudio Biazevich, Stevedoring Services of America Bob Kelly, Stevedoring Services of America Mike Dyson, Stevedoring Services of America Paul Gagnon, Stevedoring Services of America Pat Sieburg, Stevedoring Services of America Vince Daby, Stevedoring Services of America Randy Watson, Sulex Michael Garza, Toyota Dan Wenger, Toyota Starcrest Consulting Group, LLC March 2004
11 Pat Dubinsky, Toyota Brock Nelson, Union Pacific Railroad Jon Germer, Union Pacific Railroad Loren Smith, Weyerhaueser ACKNOWLEDGEMENTS (CONTINUED) The Port of Long Beach and Starcrest would like to thank the following reviewers who provided comments to the report, and those who have also spent countless hours on teleconferences throughout the duration of the project: Kirk Rosenkranz, ARB Paul Milkey, ARB Peggy Taricco, ARB Archana Agrawal, ARB Connie Leong, ARB Todd Sax, ARB Todd Sterling, ARB Mike Nazemi, SCAQMD Ali Ghasemi, SCAQMD Roxanne Johnson, EPA David Albright, EPA Starcrest would like to thank the following Port of Long Beach staff members for assistance during the EI: Thomas Jelenic Kerry Cartwright Jolene Hayes Authors: Contributors: Editors: Document Preparation: Bruce Anderson, Principal, Starcrest Consulting Group, LLC Joseph Ray, Principal, Starcrest Consulting Group, LLC Sam Wells, associated with Starcrest Consulting Group, LLC Guiselle Aldrete, associated with Starcrest Consulting Group, LLC Clyde Durham, associated with Starcrest Consulting Group, LLC Joyce Kristiansson, associated with Starcrest Consulting Group, LLC Stefan Seum, associated with Starcrest Consulting Group, LLC Thomas Jelenic, Port of Long Beach Joyce Kristiansson, associated with Starcrest Consulting Group, LLC PT Anderson, Principal, Starcrest Consulting Group, LLC Denise Anderson, associated with Starcrest Consulting Group, LLC Starcrest Consulting Group, LLC March 2004
12 ACRONYMS AND ABBREVIATIONS ARB (California) Air Resources Board bhp brake-horsepower BNSF Burlington Northern Santa Fe Railroad BSFC brake-specific fuel consumption CHE cargo handling equipment CO carbon monoxide CO 2 carbon dioxide DB dynamic braking DF deterioration factor DMV Department of Motor Vehicles DPM diesel particulate matter EF emission factor EI emissions inventory EMD (GE) Electromotive Division EPA U.S. Environmental Protection Agency F Fahrenheit g/bhp-hr grams per brake-horsepower-hour g/day grams per day g/hp-hr grams per horsepower-hour g/hr grams per hour g/mi grams per mile GVWR gross vehicle weight rating HC hydrocarbons HDV heavy-duty vehicles hp horsepower hrs hours ICTF Intermodal Container Transfer Facility ITS International Transportation Services LBCT Long Beach Container Terminal lbs/day pounds per day LDA gasoline light duty auto LDT1 light duty truck 1 LF load factor LPG liquefied petroleum gas M&N Moffatt & Nichol MMA Meyer, Mohaddes Associates, Inc. mph miles per hour NO x oxides of nitrogen OGV ocean-going vessel PCT Pacific Container Terminal PHL Pacific Harbor Line PM particulate matter PM 2.5 particulate matter less than 2.5 microns in diameter particulate matter less than 10 microns in diameter PM 10 Starcrest Consulting Group, LLC March 2004
13 ACRONYMS AND ABBREVIATIONS (CONTINUED) POLA POLB ppm Ro-Ro RSD RTG RTL S SCAG SCAQMD SO 2 SSA TEU TOG tpd tpy UP U.S. VMT Port of Los Angeles Port of Long Beach parts per million roll-on/roll-off Regulatory Support Document rubber tired gantry crane rich text language sulfur Southern California Association of Governments South Coast Air Quality Management District sulfur dioxide Stevedoring Services of America twenty-foot equivalent unit total organic gases tons per day tons per year Union Pacific Railroad United States vehicle miles of travel Starcrest Consulting Group, LLC March 2004
14 (This page intentionally left blank)
15 EXECUTIVE SUMMARY The purpose of this study has been to develop a comprehensive activity-based emission inventory for use by the Port of Long Beach (POLB) as a planning tool. The study was initiated to improve the POLB s understanding of the nature and magnitude of port-wide mobile emission sources and to provide baseline information to facilitate the updating of the emission inventory on a regular basis. The emission inventory developed for the POLB encompasses three source categories: offroad cargo handling equipment (CHE), railroad locomotives, and on-road heavy-duty diesel trucks. The emission inventory is based on interviews with tenants at the port, railroad experts and engineers, and truck traffic modeling conducted by third party consultants. Baseline emission estimates were developed for oxides of nitrogen (NO x ), total organic gases (TOG), carbon monoxide (CO), particulate matter less than 10 microns (PM 10 ) and 2.5 microns (PM 2.5 ) in diameter, diesel particulate matter (DPM), and sulfur dioxide (SO 2 ). The baseline year for the survey data was Development of this report was coordinated among the POLB, the California Air Resources Board (ARB), the South Coast Air Quality Management District (SCAQMD), and the U.S. Environmental Protection Agency (EPA). Most of the CHE data was collected by Starcrest Consulting Group, LLC (Starcrest), with some data collected by ARB. The emissions from CHE used at the terminals were estimated by ARB using their OFFROAD model, based on the information collected by Starcrest and ARB. For the rail activity at the port, the information was obtained by interviewing railroad operators and others with knowledge of rail activities and also by riding some of the switch engines to gain firsthand knowledge of on-port rail activities. Locomotive emissions were estimated using a combination of methods, depending on the information provided by the railroad companies. Primarily, a throttle notch approach was taken, in which actual locomotive operating records were evaluated to develop a site-specific activity profile. Alternatively, fuel use data from the railroads and/or operational information published by EPA were used to develop emission estimates for locomotives for which throttle notch data were unavailable. On-road activity information for on-road heavy-duty vehicles (HDV) was developed by Meyer, Mohaddes Associates, Inc. (MMA). Model year distribution was developed by ARB and SCAQMD running several thousand license plate numbers obtained from local terminals through the California Department of Motor Vehicles (DMV) vehicle registration database. Information was gathered for truck on-terminal activity from terminal operators; the ARB s emission estimating model EMFAC2002 was used to develop emission factors. Emission estimates for key pollutants in terms of tons per year (tpy) and tons per day (tpd) are summarized in Tables ES.1 and ES.2, respectively. Figure ES.1 illustrates the comparative contributions of CHE, locomotives, and HDVs to the overall POLB emissions addressed in this EI. Starcrest Consulting Group, LLC 7 March 2004
16 Table ES.1: 2002 Emissions by Source Category, tpy POLB Baseline EI Source Category NO x TOG CO PM 10 PM 2.5 DPM SO 2 (tpy) (tpy) (tpy) (tpy) (tpy) (tpy) (tpy) CHE 2, , Locomotives HDVs Totals 3, , Table ES.2: 2002 Emissions by Source Category, tpd Source Category NO x TOG CO PM 10 PM 2.5 DPM SO 2 (tpd) (tpd) (tpd) (tpd) (tpd) (tpd) (tpd) CHE Locomotives HDVs Totals Figure ES.1: Percentage Breakdown of Emissions by Category 100% 90% 80% 70% Percent of Emissions 60% 50% 40% 30% CHE HDVs Locomotives 20% 10% 0% NOx TOG CO PM10 PM2.5 DPM SO2 Pollutant Starcrest Consulting Group, LLC 8 March 2004
17 SECTION 1 INTRODUCTION The Port of Long Beach (POLB) commissioned Starcrest Consulting Group, LLC (Starcrest) to conduct a comprehensive emissions inventory (EI) of off-road cargo handling equipment (CHE), railroad locomotives, and on-road trucks that operate within the port s boundary. This EI is part of the comprehensive Air Quality Improvement Program that was adopted by the Long Beach Board of Harbor Commissioners. 1.1 Purpose and Scope The purpose of this study is to develop a comprehensive activity-based EI to estimate quantities of emissions associated with tenant marine terminal operations at POLB. The baseline year for the study is calendar year The scope includes three source categories: off-road CHE, railroad locomotives, and on-road heavy-duty vehicles (HDV). The inventory does not include marine sources, such as ocean going vessels and harbor vessels, or stationary sources. There are certain industrial operations and other emission-producing activities that are located on POLB property or on private property within the POLB boundaries. Many of these operations and activities are within the POLB for historical reasons, such as by being present when an area became Port property. Other operations take place on property leased from the POLB but are not in any way related to the activities or operations of the Port, and in many cases, the POLB has no authority or influence over these operations. These facilities, including those listed below, have not been included in the EI. G-P Gypsum Corporation Dow Chemical Company GATX Harbor Cogeneration SERRF Sea Launch AIMCOR Applied Industrial Materials Pacific Banana Tidelands Oil Company Dow Chemical USA THUMS Oil Operations Starcrest Consulting Group, LLC 9 March 2004
18 Baseline emission estimates for 2002 were developed for: Oxides of nitrogen (NO x ) Total organic gases (TOG) Carbon monoxide (CO) Particulate matter less than 10 microns in diameter (PM 10 ) Particulate matter less than 2.5 microns in diameter (PM 2.5 ) Diesel particulate matter (DPM) and Sulfur dioxide (SO 2 ) Marine ports are an increasing focus of concern because of continued growth associated with international trade, especially within the Pacific Rim area. To accommodate such growth, ports must expand their infrastructures by constructing new docks and terminal facilities, making existing facilities more efficient, along with enhancing inland distribution access for railways and highways. In light of this growth, environmental planners are concerned about the net effect on local air quality. This study provides the port with a planning tool and the necessary baseline information to facilitate the updating of the EI on a regular basis. This study also aids in improving the understanding of the nature and magnitude of port-wide mobile emission sources, which make up the vast majority of portrelated emission sources (as compared with stationary sources). 1.2 General Methodology The POLB baseline EI methodology was coordinated from its inception with a similar baseline EI that has been concurrently developed for the Port of Los Angeles (POLA), and with the California Air Resources Board (ARB), the South Coast Air Quality Management District (SCAQMD), and the Environmental Protection Agency (EPA). The ARB, part of the California Environmental Protection Agency, is responsible for improving and/or maintaining air quality within the State of California 1. The SCAQMD is the air pollution control agency for Orange County and major portions of Los Angeles, San Bernardino and Riverside counties in Southern California, and has been delegated responsibility for improving and/or maintaining air quality within the region. Both ports and the air agencies held regular meetings throughout the EI process to agree on methodology, to receive updates on project progress, and to review the findings and the final report. An activity-based approach was employed to develop this comprehensive EI. This approach utilized interviews and conversations with terminal owners, equipment operators, Harbor Department staff, and others with firsthand knowledge of either equipment details or operational parameters. A detailed proposed approach was developed by both ports and submitted to the participating agencies for review. Modifications to the draft approach were made in response to agency questions, comments, and suggestions, after which the final approach was implemented. 1 Starcrest Consulting Group, LLC 10 March 2004
19 For each of the three source categories, data was collected through an interview process and emissions were estimated using agreed upon methods that were consistent, as feasible, with the POLA EI. Where inconsistencies exist, they will be noted in this report. The primary differences between the POLB and POLA EIs are (1) the scope: POLA includes marine sources (commercial marine vessels); POLB does not, and (2) the baseline year: POLB used a 2002 baseline year; POLA used a 2001 baseline year. In the technical field of estimating air emissions, there are significant distinctions between off-road and on-road vehicles or equipment. Off-road equipment includes vehicles or equipment that are not designed or licensed to operate on public roads; for this EI, off-road equipment includes CHE and locomotives. The on-road category consists of vehicles that are typically licensed to operate on public roads, such as HDVs. The importance of the distinction between these two source categories is that the methods by which emissions are estimated are different, and that on-road vehicle emissions have been more strictly regulated in the past as compared with off-road equipment. Each of the source categories has different emission estimation methodologies as presented below. Cargo Handling Equipment CHE consists of various types of equipment and vehicles that fall within the off-road designation. Emission estimates for this group were developed by the ARB using their OFFROAD 2 modeling tool, which has been developed to estimate emissions from off-road equipment fleets. Equipment operators and owners were interviewed and equipment lists were developed that formed the inputs for the OFFROAD model. The comprehensive equipment lists developed include all reported CHE that operated at the POLB in 2002, as well as the following specifications for each piece of equipment: Equipment type Model year Horsepower Annual operating hours The equipment file was used by ARB in their OFFROAD model and the resulting emission estimates were provided to Starcrest. The OFFROAD model is the official model used by the ARB and the SCAQMD to estimate emissions from off-road equipment that operates throughout California. 2 California Air Resources Board, OFFROAD, See Starcrest Consulting Group, LLC 11 March 2004
20 The model typically uses the ARB s latest information regarding the four input parameters listed above, as well as equipment population, when developing emission estimates for the whole state or for a subdivision such as a county or air quality control region. These default values represent the off-road fleets for those relatively large areas (i.e., state, county, region, etc.) A major goal of the POLB EI was to provide specific information for the fleet that actually operates within POLB boundaries. Therefore, the OFFROAD model defaults for equipment population, model year, horsepower, and hours of operation were not used. Instead, the terminal-specific information collected during the interview process was used to estimate the emissions, thus providing a higher level of accuracy for the EI than would have been achieved through the use of ARB s more general default data. Section 2 provides further detail on the emission estimating methods for the CHE source category. Rail/Locomotive Activity Railroad operations are typically described in terms of two different types of operation, line haul and switching. Line haul refers to the movement of cargo over long distances (e.g., cross-country) and occurs within the POLB at the initiation or termination of a line haul trip, as cargo is either picked up for transport to destinations across the country or is dropped off for shipment overseas. Switching refers to the assembling and disassembling of trains at various locations in and around the POLB, sorting of the cars of inbound cargo trains into contiguous fragments for subsequent delivery to terminals, and the short distance hauling of rail cargo within the port. To estimate emissions from railroad activities within the POLB, information was obtained from railroad operators and others with knowledge of rail activities, and also by accompanying switch engines during their normal operations to gain firsthand knowledge of port rail activities. Because of the types of information able to be provided by the railroad companies, emissions were estimated using two basic methods. For most of the switching activities, emissions were estimated on the basis of percentage of time spent in the different throttle notch settings. (Diesel locomotive power levels are adjusted by the engineer in a series of eight steps called notches, plus an idle setting.) For line haul activities (and a limited amount of switching), fuel usage was used as a surrogate measure of the level of activity of the locomotives. The EPA has published emissions information for switch and line haul locomotive operations in both throttle notch and fuel consumption modes, so the emission estimates have not been greatly compromised by the use of different methods for switching versus line haul operations. As feasible, cross-checks between methods have been developed to demonstrate the degree of agreement between methods. Section 3 provides a more complete description of the locomotive emission estimating methods and steps. Starcrest Consulting Group, LLC 12 March 2004
21 HDVs There are two components to the estimation of HDV emissions presented in this report: onroad travel and on-terminal operations. Most HDV activity within the POLB, in terms of operating hours and miles traveled, takes place on the public roads within the POLB as the trucks travel to and from the terminals to drop off or pick up their cargo, and as they sometimes wait for entry outside terminal gates. The trucks also operate within each terminal, typically entering through a controlled access gate, traveling through the terminal to drop off and/or pick up cargo, and then exiting the terminal. ARB s on-road emission estimating model EMFAC was used to develop emission factors for HDV operations, at various speeds and at idle. An important model input parameter is the model year distribution of the HDVs because on-road vehicle emissions vary greatly depending on their model year, and the emission factors developed by the model are based on the age distribution of the fleet being modeled. A major goal of the HDV portion of the EI was to identify the model year distribution of the truck fleet servicing the port facilities rather than use the EMFAC2002 model s default age distribution. The portspecific HDV model year distribution was developed by the ARB and the SCAQMD running several thousand license plate numbers, obtained from local terminals, through the California DMV registration database. For estimating on-road (off-terminal) HDV emissions, on-road activity information was developed by a traffic consultant, Meyer, Mohaddes Associates (MMA), using trip generation and travel demand models that were used in a previous POLB/POLA traffic study 4. This study has been used by the POLB for transportation planning projects; therefore, it was used to estimate traffic volumes on POLB roadways to be consistent with past and current traffic studies and planning projects. The models use container throughputs for each terminal to develop the number of heavyduty trucks that would be associated with moving that respective volume of cargo (minus rail movements) into and out of the Port. Based on these volumes and the corresponding traffic volumes associated with POLA, the models then route the traffic from the various terminals to the major entry and exit points to and from the Port. The models also incorporate the distance and average speed for each roadway, thus providing volume, distance, and speed for each roadway segment. On-road emissions were then estimated by multiplying the number of trucks and the distance by the appropriate EMFAC2002 emission factor based on the speed traveled in each roadway segment. 3 California Air Resources Board, EMFAC2002, See EMFAC2002 is the emission factor model approved by EPA for use in estimating emissions for on-road vehicles in California; it is not approved for off-highway CHE or for emissions outside California. 4 Meyer, Mohaddes Associates, Inc. June, Port of Long Beach/Los Angeles Transportation Study. Starcrest Consulting Group, LLC 13 March 2004
22 For estimating on-terminal HDV emissions, Starcrest discussed on-terminal traffic patterns with terminal operators during the interview process, including time spent waiting at the entry gate, time and distance on terminal while dropping off and/or picking up cargo, and time spent waiting at exit gates. As with off-terminal emissions, on-terminal emissions were estimated by multiplying the appropriate EMFAC-derived emission factor by the time and distance parameters established for the terminals. An additional step was taken for estimating emissions from trucks idling at the gates of container terminals. This step was to use idling estimates prepared by Moffatt & Nichol (M&N), at the request of the POLB, based on a terminal operation/throughput model M&N had developed for previous POLB transportation studies. Section 4 provides further detail on the emission estimating methods for the HDV source category. 1.3 Geographical Extent The POLB is a major marine port located in Southern California. The EI includes onterminal CHE emissions as well as emissions from locomotives and HDVs operating within the port boundary. The POLB boundaries are delineated by the POLA to the west, Anaheim Street to the north, Los Angeles River to the east, and the breakwater to the south. Since both POLB and POLA are interconnected with intermodal transportation linkages, an effort was made to only account for freight movements originating from or having a destination in POLB. The locomotive emissions were estimated to the Dolores/Watson Yard. HDV emissions occurring within the port boundaries were also estimated. The regional transportation system used by HDV includes Ocean Boulevard, the Long Beach Freeway (I- 710), the Terminal Island Freeway (SR47/103), and the Harbor Freeway (I-110). Figure 1.1 displays a map of the POLB with its various piers. Starcrest Consulting Group, LLC 14 March 2004


23 Figure 1.1: Port of Long Beach EI Boundary Starcrest Consulting Group, LLC 15 March 2004
24 1.4 Terminal Reconfigurations Several terminal reconfigurations and relocations took place in These changes are summarized in Table 1.1. The changes were taken into consideration for modeling the year 2002 baseline emissions and present issues that need to be considered when projecting future year emissions from this baseline EI. Table 1.1: POLB Operational Changes in Locations Terminal Operator Terminal Changes Month (2002) Pier A to Pier T Hanjin Shipping Co. Relocated to new Pier T terminal October Pier C to Pier A Stevedoring Services of America (SSA) Moved from Pier C to Pier A after renovations December Pier G Maersk Sealand (APM) Vacated terminal, moved to POLA September Pier G International Transportation Extended terminal operations Services (ITS) October Pier J Maersk Sealand (APM) Vacated terminal, moved to POLA August Pier J SSA, Pacific Container Terminal (PCT) Extended terminal operations September At the same time POLB was reconfiguring its facilities, other facilities at POLA, in particular the new Pier 400 on Terminal Island, were finished and opened space for reconfiguring and relocating terminals. Maersk-Sealand opened its facility at the POLA Pier 400 site in the third quarter, As a result, Maersk-Sealand vacated its two terminals at the POLB: the Pier J facility in August 2002 and the Pier G facility in September The Hanjin terminal is another large terminal that relocated in However, this move did not affect the overall container move statistics because Hanjin processed nearly the same amount of containers at its new Pier T facility as at the Pier A site, without a significant interruption. Hanjin moved in October 2002 from its terminal at Pier A to its new location at Pier T, Terminal Island. The Pier A facility was being renovated and did not operate in the last quarter of Therefore, since the opening of the new Hanjin terminal did not 5 SSA moved their POLA terminal (Matson) to POLB Pier C in February This change was outside the temporal scope of this EI, and emissions from the relocated Matson equipment have not been included. However, SSA s Pier C emissions have been included. Starcrest Consulting Group, LLC 16 March 2004
25 add cargo to the POLB throughput in 2002, the overall cargo throughput remained unaffected by Hanjin's relocation. However, 2003 will most likely show an increased throughput based on the higher capacity of the Pier T facility and the re-opening of Pier A. Other significant changes occurred at the terminals that are operated by Stevedoring Service of America (SSA). SSA's Pacific Container Terminal (PCT) at Pier J expanded into the space that was vacated by Maersk Sealand. PCT nearly doubled in size. SSA's Matson terminal, which was located at the POLA, moved to Pier C in February The SSA moves did not significantly affect the cargo throughput. The new opening of the Pier A terminal is likely to show growth effects in 2003, but did not impact the 2002 statistics. The relocation of marine terminals in 2002 opened space for terminal expansions and reconfigurations of existing terminals that increased capacity at the POLB. Most important are the PCT expansion to the larger Pier J area and ITS expansion to the Maersk Sealand Pier G area. However, those changes did not change the cargo throughput in 2002, except for Maersk Sealand's relocation to the POLA. Container throughput dropped in October 2002 due to a labor dispute that resulted in port operations shutting down for 11 days. However, the overall container throughput caught up again due to higher than usual volumes in November and December. 1.5 Results Baseline (2002) emission estimates of NO x, TOG, CO, PM 10, PM 2.5, DPM and SO 2 are presented in tons per year (tpy) and tons per day (tpd) in Tables 1.2 and 1.3, respectively. Tons per day estimates were developed by dividing the tons per year estimates by 365 days per year. Emission factors and model output for particulate emissions are expressed as PM or as PM 10. In the cases where the emission factor or model output is expressed as PM, it has been assumed to be 100% PM 10. Based on the EPA NONROAD model, PM 2.5 is assumed to be 92% of PM 10. Another measure of particulate emissions, diesel particulate matter (DPM), only includes particulate emissions from diesel engines. For categories in which diesel fuel is the only fuel burned, such as locomotives and HDV, then PM 10 and DPM are equivalent. For categories such as CHE in which other fuels, such as propane, are used, DPM has been estimated by subtracting the non-diesel PM 10 emissions from the total PM 10 emission estimate. Emissions of organic compounds can be reported in various ways depending on the end use of the emission estimates. The ARB has defined total organic gases, TOG 6, as a means of reporting estimates of total hydrocarbon (HC) plus oxygenated components such as alcohols and aldehydes that take part in ozone formation reactions. When applicable, EPA s conversion factors for hydrocarbon emission components were used to convert HC values to TOG 7, where HC multiplied by 1.07 yields TOG. 6 ARB, 1996, California Non-Methane Organic Gas Test Procedure. 7 EPA, May 2003, Conversion Factors for Hydrocarbon Emission Components, EPA 420-P Starcrest Consulting Group, LLC 17 March 2004
26 Table 1.2: 2002 Emissions by Source Category, tpy POLB Baseline EI Source Category NO x TOG CO PM 10 PM 2.5 DPM SO 2 (tpy) (tpy) (tpy) (tpy) (tpy) (tpy) (tpy) CHE 2, , Locomotives HDVs Totals 3, , Table 1.3: 2002 Emissions by Source Category, tpd Source Category NO x TOG CO PM 10 PM 2.5 DPM SO 2 (tpd) (tpd) (tpd) (tpd) (tpd) (tpd) (tpd) CHE Locomotives HDVs Totals Emission totals by category are illustrated graphically in Figure 1.2, and Figure 1.3 illustrates the relative contribution of each source category to the overall emissions of each pollutant. Starcrest Consulting Group, LLC 18 March 2004
27 Figure 1.2: POLB Emissions by Source Category, tpy 3,500 3,000 2,500 2,000 1,500 1, Total 0 CHE NOx TOG CO PM10 PM2.5 DPM SO2 HDVs Locomotives Figure 1.3: Percentage Breakdown of Emissions by Category 100% 90% 80% Percent of Emissions 70% 60% 50% 40% 30% CHE HDVs Locomotives 20% 10% 0% NOx TOG CO PM10 PM2.5 DPM SO2 Pollutant Starcrest Consulting Group, LLC 19 March 2004
28 1.6 Report Organization This report is organized as follows: Section 1: Introduction. Section 2: Cargo Handling Equipment. Section 3: Locomotives. Section 4: Heavy-Duty Vehicles. Section 5: Conclusions (Strengths and Limitations). Starcrest Consulting Group, LLC 20 March 2004
29 SECTION 2 CARGO HANDLING EQUIPMENT This section discusses the various POLB tenants and the CHE identified through the inventory process. Section 2.1 describes the equipment inventoried, Section 2.2 provides detail on the emission estimating methodology, and Section 2.3 presents the results for this source category. 2.1 Terminal and Equipment Types Four types of terminals were included in the baseline EI: container, break bulk and dry bulk, liquid bulk, and auto terminals. Container terminals have the most extensive use of CHE, followed by break bulk and dry bulk, which were found to have roughly a tenth of the emissions of the container terminals. Liquid bulk and auto terminals had minimal emissions associated with CHE. The following tenants were included in the study: AIMCOR Long Beach Container Terminal (LBCT) Baker Commodities Maersk Sealand (APM) BP/ARCO Metropolitan Stevedore Cal United Morton Salt Cemex Mitsubishi Cement Chemoil Marine National Gypsum Cooper & Smith Pacific Coast Recycling Equillon Petro Diamond Forest Terminal SSA - Pacific Container Terminal Fremont Forest SSA Pier C Hanjin (Total Terminals, Inc.) SSA Bulk Pier F Horizon Lines Sulex ITS Toyota Koch Carbon Starcrest Consulting Group, LLC 21 March 2004
30 Because of the diversity of cargo, there are wide ranging types of equipment. The majority of the equipment found at the POLB terminals can be classified into one of the following equipment types: Cranes Dozers Excavators Forklifts Reach stackers Rubber tired gantry (RTG) cranes Skid steer loaders Side handlers Sweepers Top handlers Yard tractors Rubber tired loaders A detailed equipment inventory is presented in Appendix A. An identification number was assigned to each piece of CHE to maintain confidentiality regarding terminal-specific information on numbers and types of equipment. The equipment types listed above are described below based on the type of terminal operation in which they are used. Some equipment, such as yard tractors, side handlers, top handlers, and rubber tired gantry cranes are mostly found in container terminals, while some construction type equipment, such as skid steer loaders, dozers, excavators, and rubber tired loaders, are found at the liquid, dry bulk, and break bulk facilities. Figure 2.1 shows the distribution of the CHE by equipment type. The twelve survey equipment type designations were grouped into nine source categories for modeling purposes. The equipment ranged from model year 1961 to Starcrest Consulting Group, LLC 22 March 2004
31 Figure 2.1: Distribution of CHE by Equipment Type POLB Baseline EI Cranes- 6-1% Fork Lifts % Other- 14-1% Rubber Tired Loader- 19-2% Yard Tractors % RTGs- 80-8% Side Loaders- 41-4% Sweepers- 9-1% Top Loaders- 89-8% The most common type of engine identified in the equipment inventory is the Cummins C5.9, with 35% of the CHE being equipped with this model engine. Next in prevalence is the Cummins C8.3 engine, installed on 22% of the CHE. The remaining 43% of the CHE is equipped with various other engine models, the next most common being the Cummins B5.9 in 4% of the equipment. Table 2.1 lists the types of CHE equipped with the Cummins C5.9 and C8.3 engines, along with the range of horsepower ratings of these engines, and the number installed in different types of equipment. Horsepower is indicated in the column titled HP Range. Starcrest Consulting Group, LLC 23 March 2004
32 Table 2.1: Most Common Engine Manufacturer for CHE POLB Baseline EI Engine Equipment Type Manufacturer Model HP Range Count Percentage of all CHE Forklifts Cummins C Side Loaders Cummins C Yard Trucks Cummins C Total Cummins C % Top Handlers Cummins C Reach Stackers Cummins C Yard Trucks Cummins C Total Cummins C % Container Terminals The POLB and other West Coast ports are major ports of entry for containerized cargo shipped by ocean-going vessels (OGVs) into the United States. In 2002, POLB ranked second in container throughput for all U.S. ports, behind Los Angeles and ahead of New York/New Jersey and Oakland. Together with the Port of Los Angeles, the Port of Long Beach serves the Los Angeles Basin, southern California, and other destinations in the continental U.S. The operation of a container terminal is dependent on the amount of land available for the terminal to use. There are three basic types of configurations that can be found in the POLB container terminals: wheeled, grounded, and combination. These types represent how the containers are physically stored and kept on a terminal. Wheeled operations are generally the most efficient operations as all the containers are kept on a chassis and can be moved anywhere on or off the terminal by the use of a yard tractor or heavy-duty truck. Grounded operations are where containers are stored on-site in stacks that can be several containers wide by two to four containers high, thus requiring the use of RTG cranes, side and top loaders to move the containers to/from and within the stacks. Combination terminals employ a mix of wheeled and grounded operations as land permits. Most of the POLB container terminals use a combination of grounded and wheeled operations. Wheeled operations have low container-per-acre densities and thus require significantly more land than grounded operations, which have high container densities. However, wheeled operations are more efficient and require less CHE than grounded operations. Grounded operations use a mixture of RTG cranes, top loaders, side loaders and yard tractors while wheeled operations mostly use yard tractors; therefore, grounded operations generally have higher emissions per container moved. The type of operation at any specific terminal is generally dictated by the amount of land available and the number of containers that the terminal processes per year. In 2002, container terminals on seven pier areas served the sea-to-land link for container transport, as listed in Table 2.2. Starcrest Consulting Group, LLC 24 March 2004
33 Table 2.2: Container Terminals, 2002 Terminal Name Location Dates of Operation California United Pier E Jan Dec Hanjin Piers A & T Jan Sept / Oct-Dec ITS Pier J Jan Dec Maersk-Sealand Piers G & J Jan Sept / Jan-Oct SSA (PCT) Pier J Jan Dec SSA C / A Jan Nov / Dec LBCT Pier F Jan Dec The basic unit of container shipping is the twenty-foot equivalent unit (TEU), which refers to a standard shipping container twenty feet long. On average, the container terminals had an annual throughput of 633,757 TEU each, although there was considerable variation among the terminals. The ratio between TEU and actual containers varies between 1.67 and 1.85 at the POLB terminals (MMA 2001). The number of TEU is not equivalent to the number of actual containers because container lengths include 20 feet, 40 feet, and other sizes. A 40-foot container, for example, is equivalent to two TEU. The container terminals made an average of 360,000 container moves each per year. Operating hours ranged from 10 to 18 hours per day, for five to seven days per week. Some containers are used to transport perishable goods such as fruits and meats, and therefore are equipped with a refrigeration unit that has a small diesel generator that can provide power to the cooling system when external power is not available. These refrigerated containers or reefers were investigated to determine their potential air quality impact from ship to yard to distribution. While on board ships, reefers are powered by the ship s auxiliary generators, and once ashore, reefers that are stored for any length of time in the terminal are plugged into the utility grid at special slots designated for reefers. A reefer that is removed from an external power source, such as when it is loaded onto a trailer for truck transport, will hold its temperature for approximately eight hours before the diesel generator would need to be operated to power the refrigeration unit. Therefore, it is reasonable to conclude that the containers diesel generators are not turned on within the Port boundary or when traveling within the study area because truck travel time within the study area is far less than eight hours. The off-road equipment used directly in handling cargo at container terminals consists mainly of yard tractors, forklifts, top handlers, side handlers, and RTG cranes. Most of the equipment inventoried at the container terminals use diesel fuel, except for 31 of the 77 forklifts, which use liquefied petroleum gas (LPG). Figure 2.2 presents the distribution by type of the approximately 850 pieces of equipment used by container terminals. Starcrest Consulting Group, LLC 25 March 2004
34 Figure 2.2: Distribution of Container Terminal CHE by Equipment Type Others- 3-0% Yard Tractors % Sweepers- 5-1% Fork Lifts- 77-9% RTGs- 80-9% Side Loaders- 41-5% Top Loaders % Yard Tractors The equipment inventory shows that diesel-powered yard tractors, also known as terminal tractors, yard trucks and yard hustlers, accounted for 65% of the CHE used at the container terminals. The typical off-road yard tractor is a close relative of the on-road truck tractor. However, it is typically equipped with an off-road engine and cannot legally be driven on public roads. It is designed for the movement of containers throughout the terminal in both stacked and wheeled operations. A common use of yard tractors is to move containers to and from the ship, move containers within the terminal, and move containers to and from RTGs for placement on or removal from stacks. Yard tractors are used throughout the terminal and the majority of their hours are worked when a ship is at dock being loaded and unloaded. They work primarily between the ship and the container stacks (for grounded operations) or chassis locations (for wheeled operations). Most of the yard tractors identified in the inventory were manufactured by Ottawa. Model years ranged from 1985 to 2002, with an average model year of Engine power ranged from 148 horsepower (hp) to 225 hp, with an average of 188 hp. Annual operating time ranged from 1,561 hours (hrs) to 3,024 hrs, with an average of 2,531 hrs. Starcrest Consulting Group, LLC 26 March 2004


35 Figure 2.3 shows a typical Ottawa yard tractor 8. Figure 2.3: Yard Tractor RTG Cranes RTG cranes made up nine percent of the equipment inventoried for container terminals. The diesel-powered RTG crane moves containers to and from the container stacks in a grounded operation. The RTG straddles the stacks of containers and has room for a heavy-duty truck/yard tractor to pull under and move containers between the stacks and vehicles. It is also used to consolidate the stacks weekly as containers are added and removed from the terminal. Model years ranged from 1973 to 2002, with an average model year of Engine power ranged from 219 hp to 946 hp, with an average of 540 hp. The annual operating hours ranged from zero to 2,496 hrs, with an average of 1,668 hrs. Some operators may have made decisions to use operational modes not requiring the use of their RTGs, thus resulting in zero operating hours for some. Figure 2.4 shows a Paceco RTG 9. Figure 2.4: Rubber Tired Gantry Crane Starcrest Consulting Group, LLC 27 March 2004


36 Top Handlers Approximately ten percent of the equipment inventoried were diesel-powered top handlers, also known as top loaders and reach stackers by the terminal operators. Top loaders move, stack and load containers using an overhead telescopic boom. They can be used in place of or in conjunction with RTG cranes to lift heavy containers within a terminal. Model years ranged from 1990 to 2002, with an average model year of Engine power ranged from 250 hp to 330 hp, with an average of 283 hp. Annual operating time ranged from 761 hrs to 3,870 hrs, with an average of 2856 hrs. Ninety percent of the engines in use were identified as Cummins M 11, M 11-C, and QSM 11C, followed by the Volvo TD 2030 ME and TW 1031 VE. Figure 2.5 shows a Taylor top loader 10. Figure 2.5: Top Handler Forklifts The container terminals had 77 forklifts, accounting for 9% of the equipment inventoried. Thirty-one, or 43%, of the forklifts use LPG fuel; the remaining forklifts are diesel-powered. The forklifts at the container facilities may be used for cargo and non-cargo handling activities. Forklifts use an under lift principle to move loads of varying sizes, depending on their capacity. The forklifts used at the container terminals had model years ranging from 1971 to 2001, with an average model year of Engine power ranged from 45 hp to 280 hp, with an average of 143 hp. Annual operating hours ranged from 3.5 hrs to 2,000 hrs, with an average of 1,200 hrs. Figure 2.6 presents a Mitsubishi forklift 11. Figure 2.6: Forklift Starcrest Consulting Group, LLC 28 March 2004

37 Side Loaders Side picks, side handlers and side loaders are the various names used for the CHE that, in general, move and stack the empty containers within a terminal. Therefore, they have less power as compared to top handlers. Just five percent, or 41 units, of the equipment inventoried were diesel-powered side handlers. Model years ranged from 1982 to 2002, with an average model year of Engine power ranged from 115 hp to 210 hp, with an average of 168 hp. Annual operating time ranged from 520 hrs to 2,650 hrs, with an average of 1,751 hrs. Figure 2.7 presents a Taylor side loader 12. Figure 2.7: Side Loader Break Bulk and Dry Bulk Terminals Break bulk cargoes include steel, lumber, large machinery and other large product cargo. Break bulk terminals receive cargo that is not shipped in containers, so the cargo has to be unloaded from a ship s hold and then loaded onto trucks on the dock for distribution. Steel products, such as plates or rolls, are placed in a ship s hold and must be removed individually. Large machinery may also be carried with special RoRo (roll-on/roll-of) vessels equipped with large ramps for driving vehicles on and off the ship. Lumber and lumber products are often carried by dedicated vessels and barges that are designed to carry their specific cargo. Some vessels that call on break bulk terminals may mix containerized cargo and break bulk cargo and are called combination ships, where the break bulk cargo is stored in the below deck holds and containers are stacked on the hatch covers that cover the cargo holds during sailings. In general, the ships that call at break bulk terminals are smaller than the specialized container ships that call at the container terminals Starcrest Consulting Group, LLC 29 March 2004
38 Due to their weight and characteristics, heavy lift machines are used for handling bulk cargo on the terminal and for loading rail or truck. Cargo is discharged either by the vessel's own ship-to-shore cranes, or by large boom cranes that operate on the dock and are highly mobile so that they can move into position based on the ship s configuration. Hydraulic and boom crawler cranes were inventoried at POLB facilities. Most break bulk cargo leaves the terminals by truck. Dry bulk cargoes include materials that can be processed by bucket loaders, screw loaders, conveyors or suction and that are stored in piles or silos on the terminals. The most common dry bulk cargoes at POLB include cement and salt for import, and scrap metal, sulfur and petroleum coke for export. Seven break bulk and seven dry bulk terminals at the port had diesel-powered CHE in 2002 and were included in this inventory. Table 2.3 lists these terminals with their primary cargo. Table 2.3: Break Bulk and Dry Bulk Terminals, 2002 Terminal Primary Cargo Type California United Steel rolls, general cargo Cooper & Smith Steel, plywood, lumber Forest Terminals Newsprint, paper Fremont Forest Group Lumber, lumber products Pacific Coast Recycling Recyclable steel SSA (bulk) Steel, lumber, large machinery Weyerhaueser Lumber, lumber products Aimcor Petroleum coke Cemex Cement Koch Carbon Petroleum coke, sulfur, Metropolitan Stevedore Petroleum coke, coal, borax, Mitsubishi Cement Cement Morton Salt Salt Sulex Sulfur processing The equipment operating at the dry bulk and break bulk terminals consists of forklifts, rubber tired loaders, yard tractors, cranes, sweepers, dozers and excavators. Figure 2.8 presents the distribution by type of the approximately 200 pieces of equipment used at the dry bulk and break bulk terminals. Starcrest Consulting Group, LLC 30 March 2004

39 Figure 2.8: Distribution of Dry Bulk and Break Bulk CHE by Type Yard Tractors- 9-4% Sweepers- 4-2% Skid Steer Loaders- 3-1% Rubber Tired Loaders- 19-9% Other- 9-4% Cranes- 6-3% Fork Lifts % Forklifts The most numerous type of equipment found at the dry and break bulk terminals was the forklift representing 75% of the CHE. Approximately 24%, or 37 forklifts, used LPG fuel instead of diesel. Their model years ranged from 1969 to 2002, with an average model year of The engine power ranged from 45 hp to 220 hp, with an average of 145 hp. Annual operating time ranged from zero to 5,200 hrs, with an average of 1,000 hrs. A Hyster forklift 13 is presented in Figure 2.9. Figure 2.9: Forklift 13 Starcrest Consulting Group, LLC 31 March 2004


40 Rubber Tired Loaders Approximately nine percent, or nineteen units, of the equipment inventoried were diesel-powered rubber tired loaders. Rubber tired loaders are loaders with large rubber tires that make it useful for work in construction sites and rough terrain. Model years ranged from 1979 to 2000, with an average model year of Engine power ranged from 166 hp to 750 hp, with an average of 322 hp. Annual operating time ranged from 64 hrs to 2,500 hrs, with an average of 777 hrs. A Caterpillar rubber tired loader is presented in Figure Figure 2.10: Rubber Tired Loader Skid Steer Loaders Three diesel-powered skid steer loaders were also inventoried for the dry and break bulk terminals. Skid steer loaders are small loaders used to move materials. Their small size and maneuverability allows them to operate in tight spaces. The skid steer loaders had model years between 1993 and 1996, with an average model year of The engine power ranged from 36 hp to 60 hp, with an average of 45 hp. Annual operating time ranged from 24 hrs to 1040 hrs, with an average of 701 hrs. Figure 2.11 shows a typical Komatsu skid steer loader 15. Figure 2.11: Skid Steer Loader Starcrest Consulting Group, LLC 32 March 2004


41 Yard Tractors Nine diesel-powered yard tractors were inventoried for the dry and break bulk terminals. Model years ranged from 1973 to 1996, with an average model year of The engine power ranged from 85 hp to 225 hp, with an average of 193 hp. Annual operating time ranged from 64 hrs to 420 hrs, with an average of 400 hrs. Figure 2.3 in Section shows a typical yard tractor. Cranes Approximately three percent, or six units, of the equipment inventoried were dieselpowered cranes. Model years ranged from 1978 to 2002, with an average model year of The engine power ranged from 150 hp to 439 hp, with an average of 307 hp. Annual operating time ranged from 100 hrs to 4,000 hrs, with an average of 2,000 hrs. Three of the cranes were listed as hydraulic cranes. Figure 2.12 shows an American 797C boom crawler crane 16, a crane model inventoried at POLB. Figure 2.12: Crane Sweepers Four sweepers were identified. Their model years ranged from 1983 to 2000, with an average model year of The engine power ranged from 100 hp to 130 hp, with an average of 122 hp. Annual operating time ranged from 250 hrs to 365 hrs, with an average of 327 hours. Figure 2.13 shows an Elgin sweeper with a 100 hp engine 17. Figure 2.13: Sweeper Starcrest Consulting Group, LLC 33 March 2004
42 Miscellaneous Equipment At the dry and break bulk terminals, one top handler, two dozers, and three excavators were also identified. The top loader was model year 1981; the engine power was 260 hp; and the annual operating time was 520 hrs. The dozers had an average model year of 1994; the engine power averaged 380 hp, with a range of 362 hp to 399 hp; and annual operating time averaged 400 hrs. The excavators had an average model year of 1998; the engine power ranged from 362 hp to 425 hp; and the annual operating time averaged 3,250 hrs Liquid Bulk Terminals Liquid bulk terminals predominantly import petroleum products. Some terminals export refined petroleum to other U.S. West Coast destinations and one small facility imports and exports vegetable oils. Table 2.4 provides a list of liquid bulk terminals at the POLB. Table 2.4: Liquid Bulk Terminals, 2002 Terminal Name Type of Cargo Baker Commodities Vegetable oils BP/Arco Pier B Petroleum products BP/Arco Pier T Petroleum products Chemoil Petroleum products Equillon Enterprise Petroleum products Petro Diamond Gasoline, petroleum products Compared to other types of terminals, liquid bulk cargo operations use little fuelpowered terminal equipment. All liquid cargo is transported in pipelines to or from the refineries. The pump stations at the terminals operate on electricity that is supplied by the utility grid. Emissions from the vessel unloading pumps are not within the scope of this inventory. Only six forklifts were found at the liquid terminals. Two of the six forklifts used LPG fuel. They are used occasionally to lift heavy loads and piping as needed. Model years ranged from 1961 to 1998, with an average model year of The engine power ranged from 40 hp to 100 hp, with an average of 85 hp. Annual operating time ranged from 3.5 hrs to 450 hrs, with an average of 111 hrs. Starcrest Consulting Group, LLC 34 March 2004
43 2.1.4 Auto Terminals The U.S. is a major importer of vehicles and California is a significant market. West Coast ports are a port of entry for many automobiles manufactured in Asia, and for the local market. POLB has one acre automarine terminal, which serves mostly the local California market. In the year 2002, approximately 340,000 automobiles, mostly passenger cars and sport utility vehicles (SUVs), were imported through the POLB automarine terminal. Loading and unloading of automobiles does not require the use of a large amount of cargo handling equipment. Being selfpropelled, the vehicles are discharged (or loaded) by driving them off (or onto) the vessel. The terminal workers drive the cars to a first point of rest, from where they are driven to an area where accessories may be installed as needed. After accessorizing, the automobiles are driven to dedicated parking areas on the terminal. Shipment out of the terminal is by truck or rail. Exhaust and evaporative emissions were estimated for the automobiles and are listed separately emissions at the end of section 2.3. The emissions are also included in Table 2.6 (CHE Emissions by Terminal Types) combined with the small amount of emissions from automobile terminal CHE (such as diesel powered car ramps for loading railcars), and in the CHE total for the summary tables in the Executive Summary and Introduction Section. 2.2 Methodology This section discusses how the data was acquired and how the emission estimates were developed based on the data collected. The complete cargo handling equipment list input file and the ARB output emissions file with added conversion columns are found in Appendix A Data Collection Each terminal at the POLB was contacted for information. Initial in-person interviews were conducted with terminal owners, equipment operators, and others having firsthand knowledge of equipment details or operational parameters. The larger terminals were visited more than once to gather the detailed operational data needed. Additional information was also requested during the interviews, or by telephone after the initial information was reviewed. The collected information was compared with information collected from similar operations at other locations as a reasonableness check on the quality of the data. Starcrest Consulting Group, LLC 35 March 2004
44 The CHE equipment details requested for each piece of equipment included the following: Equipment type Equipment identification number Equipment make and model Engine make and model Rated horsepower Model year Type of fuel used Annual hours of operation A column heading for each of the details listed above is found in the cargo handling equipment data list submitted to ARB Emissions Estimation The ARB has developed the OFFROAD model to estimate emissions from off-road equipment fleets in the State of California, including industrial equipment such as CHE; therefore, this model was used to estimate emissions for this emission inventory. Because the ARB has not developed a publicly available version of the OFFROAD model, the agency ran the model using the data collected from terminal operators and augmented by data provided to ARB through the Wilmington Air Quality Study. Model Input Before submitting the CHE data file to ARB, the data was pre-processed as follows: Data provided by ARB for facilities ARB had contacted were incorporated into the data file. Several of the smaller facilities ARB had contacted were included in the master inventory data file. ARB s files were reviewed and the information relevant to this inventory and listed in section was included in the CHE data file. Horsepower and hours-of-use data gaps were filled by using category averages. For example, a forklift for which horsepower was not available would be assigned a horsepower value equal to the port-wide average forklift horsepower. The OFFROAD equipment type corresponding to the reported terminal equipment type was added to each record. Starcrest Consulting Group, LLC 36 March 2004
45 The terminal equipment type is the name commonly used by the terminal operators, whereas the OFFROAD equipment type is used by the model to assign variable values, such as load factor. Table 2.5 shows the terminal and OFFROAD equipment type categories used for each piece of equipment, along with its corresponding load factor. The load factor and the OFFROAD equipment type were added to each record before ARB input the data into the OFFROAD model. The equipment type designations may be the same, such as with cranes, or they may be different. An example of different designations is the yard tractors, which have been classified as off-highway trucks for the OFFROAD modeling. The OFFROAD equipment type corresponding to the reported terminal equipment type was added to each record. The terminal (survey) equipment type is the name commonly used by the terminal operators, whereas the OFFROAD equipment type is used by the model to assign variable values such as load factor. Table 2.5 shows the OFFROAD categories used for each piece of equipment with its load factor. The corresponding load factor was added to each record along with the OFFROAD equipment type before ARB input the data into its OFFROAD model. Starcrest Consulting Group, LLC 37 March 2004
46 Table 2.5: Terminal and OFFROAD Equipment Type Cross-Reference Terminal OFFROAD Equipment Type OFFROAD Load Factor Equipment Type Category Crane Crane Construction 0.43 Dozer Tractor/Loader/Backhoe Construction 0.55 Excavator Excavator Construction 0.57 Forklift Forklift Industrial 0.30 Reach stacker Other general industrial equipment Industrial 0.51 RTG crane Crane Construction 0.43 Rubber tired loader Rubber tired loader Construction 0.54 Side handler Other general industrial equipment Industrial 0.51 Skid loader Skid steer loader Construction 0.55 Sweeper Sweeper Industrial 0.68 Top handler Other general industrial equipment Industrial 0.51 Yard tractor Off highway truck Construction 0.57 For 28 pieces of equipment for which the model year was not identified by smaller facilities (not container terminals), a default model year was used, which varied by equipment. The model year 1995 was used for two forklifts, one dozer, one rubber tired loader and one skid steer loader because the total equipment inventory averaged a model year of The model year 1984 was used for 11 forklifts and the model year 1987 was used for 12 forklifts because the information given for the 23 forklifts at one terminal was prior to Since model years prior to 1992 could fall into two different OFFROAD model year groups, half of the forklifts were assigned a model year within each of the two OFFROAD model year groups. The forklifts each had the same horsepower and annual operating hours, and were located at the same terminal, so assigning any individual piece of equipment into either of the two groups did not affect the emission estimates, but using the model years from the two groups adequately simulated the effect of the reported prior to 1992 model years. Starcrest Consulting Group, LLC 38 March 2004
47 Estimating Methodology The modeling procedures discussed below are as reported by ARB. The ARB stated in their model output summary that: the emissions calculations were consistent with the OFFROAD methodology; averages for horsepower and usage were taken within the terminal, fuel type, and horsepower group for each equipment type; usage rates were assumed to be constant for each year; and, the sulfur content was assumed to be 500 [parts per million] ppm for diesel fuel. These aspects of the modeling are consistent with the methodology discussed among the Port, the ARB, and the Port s consultant. The diesel fuel actually used by the POLB terminals may have lower sulfur content than the 500 ppm used in the modeling (the actual sulfur content of diesel fuel is typically lower than the 500 ppm standard). Additional research into the sulfur content of in-use fuels may refine the estimate of sulfur dioxide emissions for future inventories. The ARB has also separately confirmed that the model was run in by-model year mode, meaning that the model took into account emission factors for specific model year groups, and the number of pieces of equipment in each of these subgroups. The emission factors differ, for example, as emission standards have changed for particular model years. The ARB grouped each piece of equipment according to terminal, fuel type, and horsepower range using the following ranges: up to 25 hp hp hp hp hp hp hp 751 hp and up Within the groups, ARB then averaged the horsepower and annual hours of use, and ran OFFROAD using these averages instead of the corresponding default OFFROAD values. Starcrest Consulting Group, LLC 39 March 2004
48 In general, off-road equipment emissions for a population of equipment would be estimated using the following equation. E = EF * HP * LF * Act * FCF where: E = emissions in short tons EF = emission factor, grams of pollutant per horsepower-hour (g/hp-hr) HP = average rated horsepower for the equipment type and horsepower category LF = load factor (assumed average percentage of full load) Act = equipment activity, hours of use per year FCF = fuel correction factor The emissions for a given year were calculated by multiplying the emission factor for the particular pollutant times the equipment horsepower times the load factor times the annual equipment hours of use for that year. The fuel correction factor which accounts for changes in the emission rates due to the use of Clean Diesel Fuel is applied, when applicable. The emission factor, in turn, is a combination of the base emission factor for the equipment model year (g/hp-hr) plus a deterioration factor that is calculated as: EF = EF BASE + (DF * Act * Age) where: EF BASE = base emission factor for a given horsepower category and model year DF = deterioration factor (estimate of emissions increase as an engine ages, expressed as g/hp-hr 2 ) Act = equipment activity, hours of use per year Age = age of equipment in years The deterioration factor is a means of accounting for changes in the emissions from engines as they accumulate hours of operation, and is based on certification testing of similar engines designed for on-road use. The base deterioration factor is expressed as g/hp-hr 2 which, when multiplied by the equipment s annual activity in hours/year and its age in years, is converted to g/hp-hr, which is added to the base emission factor, resulting in the deterioration-adjusted emission factor. Starcrest Consulting Group, LLC 40 March 2004
49 Model Output The OFFROAD output file received from ARB consisted of several worksheets, one for each pollutant, plus a summary sheet. For each pollutant, the emissions were listed by equipment type, horsepower category, and terminal. The ARB provided emission estimates for the following pollutants for each terminal by equipment type and horsepower group: NO x CO SO 2 PM HC The OFFROAD output reported emissions in grams per day (g/day) for each type of equipment by terminal and horsepower category. These were summed and the totals were converted from g/day to pounds per day (lb/day) and tons/day. To account for the terminals that did not operate for the entire year 2002, or that operated in two different locations during the year, the OFFROAD output was adjusted for the actual months of operation in Specifically, Maersk-Sealand was assumed to operate within the POLB for 9 of 12 months (completing their move by the end of September), and SSA s Pier C operations were assumed to be on-going for 11 of 12 months (ending on Pier C in November, with negligible operation on Pier A in late December). The Hanjin terminal, moving from Pier A to Pier T, was assumed to operate all 12 months no adjustments were made. See Section 1.4 for a summary of the terminal movements. Appendix A includes the OFFROAD output received from ARB with columns added for conversion to tons/day (the two facilities mentioned above were also adjusted). The sum of the calculated emissions for all the terminals was converted to tons/day and tons/year. The tons/year values are calculated by multiplying the tons/day values by 365 days/year. As discussed in subsection 1.5, PM 2.5 has been estimated to be 92% of PM 10, and diesel particulate matter was estimated by subtracting the non-diesel emissions from the PM 10 emission estimates. According to ARB, the HC value reported in the OFFROAD output is the value for total organic gases, TOG. Therefore, no conversion factor was applied to the reported HC value. Starcrest Consulting Group, LLC 41 March 2004
50 Note on OFFROAD / NONROAD Difference The OFFROAD model was chosen for this study because it is the appropriate modeling tool used in California to estimate emissions from fleets of off-road equipment. The model is designed to estimate emissions based on average equipment activity for the entire State of California or subdivisions such as counties or air basins. In this study it was used to estimate emissions from a particular subset of equipment (i.e., port cargo handling equipment used at individual terminals) and, in some cases, the model predicted disproportionately high emissions for certain terminals when compared with other similarly sized terminals. This is believed to be largely due to the deterioration function. Container terminal cargo handling equipment fleets are high activity fleets, and pieces of equipment may be operated for up to 12 years with the same engine, at much higher annual utilization rates than seen in most off-road equipment. These kinds of fleets have advanced engine maintenance/servicing programs so as to keep the engines in service well beyond the certification/warranty requirements (e.g., over about 10,000 hours). The EPA s NONROAD model is designed to cap the increases in emissions due to deterioration after an engine reaches its median age, but the ARB s OFFROAD model will continue to deteriorate (increase) emissions for a longer period of time. (Median age is roughly equivalent to 50% of the engine s expected useful life, in hours, based on operation at 100% load factor.) In the course of this study, the NONROAD model was used to evaluate emissions from some of the same terminals as the OFFROAD model, and the NONROAD results were somewhat lower, especially for the higher-activity fleets. Because of these model differences, it will be difficult to compare POLB s cargo handling equipment emission estimates with those of a port in a different state that has used the EPA model for estimating emissions. However, the emission estimates will be comparable with other California ports that have used OFFROAD. 2.3 Emission Estimates A summary of the CHE emission estimates by terminal type for all pollutants for the year 2002 is presented in Table 2.6. The evaporative and exhaust emissions for the 340,000 new autos at the auto terminal emissions listed for auto in the table below. Table 2.6: CHE Emissions by Terminal Type Terminal Type NO X TOG CO PM 10 PM 2.5 DPM SO 2 (tpy) (tpy) (tpy) (tpy) (tpy) (tpy) (tpy) Container 2, Break and Dry Bulk Liquid Bulk Automobile Totals (tpy) 2, , Totals (tpd) Starcrest Consulting Group, LLC 42 March 2004
51 Estimated CHE emissions are compared with estimated port-wide emissions in Figure Figure 2.14: Comparison of CHE Emissions with Port-Wide Emissions, tpy 3,500 3,000 2,500 2,000 1,500 1, NOx TOG CO PM10 PM2.5 DPM SO2 CHE Total The estimated amounts of each pollutant are presented in further detail in the remainder of this section. The CHE emissions total at the bottom of each table below does not include the emissions from the new vehicles at the auto terminal. The emissions from new autos are included in Table 2.6 with the terminal emissions and also separately listed in Table NO x Emission Estimates Of the four terminal types, the container terminals had the highest emissions, with approximately 2,162 tpy of NO x or approximately 91% of the CHE NO x emissions. As expected, the CHE emissions for liquid and auto terminals are low due to the fact that the loading and unloading of the vessels does not require the typical diesel-powered CHE found at other terminals. A breakdown of the NO x emissions by equipment inventoried is presented in Table 2.7 and Figure Starcrest Consulting Group, LLC 43 March 2004
52 Table 2.7: CHE NO x Emissions Survey Equipment NO x NO x (tpy) (%) Yard tractors 1, Top and Side Loaders RTG cranes, cranes Forklifts Rubber tired loaders Excavators Sweepers Dozers Skid loaders ,370.6 Figure 2.15: CHE NO x Emissions, tpy Rubber Tired Loaders % Side and Top Handlers % Crawler Tractors % Excavators % Sweepers % Skid Steer Loaders % Cranes % Forklifts % Yard Tractors % The yard tractor emissions account for approximately 59% of the total CHE NO x emissions. Side and top loaders account for 15% of the total NO x emissions. The crane source category, which includes RTGs, account for approximately 15% of the total NO x emissions. The NO x emissions for forklifts comprise almost 6% of the total NO x emissions. Rubber tired loaders account for 3% of the total NO x emissions. Excavators account for 1% of the total NO x emissions. Less than 1% of the NO x emissions are attributed to sweepers, dozers and skid steer loaders. Starcrest Consulting Group, LLC 44 March 2004
53 TOG Emissions Estimates Once again, container terminals had the highest emissions of the terminal types, at 90% of the 267 total tons of TOG.A breakdown of the TOG emissions by equipment inventoried is presented in Table 2.8 and Figure Table 2.8: CHE TOG Emissions Survey Equipment Types TOG TOG (tpy) (%) Yard tractors RTG cranes, cranes Top and Side Loaders Forklifts Rubber tired loaders Excavators Sweepers Dozers Skid loaders Total Figure 2.16: CHE TOG Emissions, tpy Side and Top Handlers % Skid Steer Loaders % Rubber Tired Loaders % Sweepers % Cranes % Crawler Tractors % Excavators % Forklifts % Yard Tractors % Starcrest Consulting Group, LLC 45 March 2004
54 Yard tractors account for 60% of the total TOG emissions. RTGs and other cranes account for 13% of the TOG emissions. Side and top loaders account for 13% of the TOG emissions. LPG and diesel powered forklifts account for 11% of the TOG emissions. Rubber tired loaders account for 3% of the total TOG emissions. Sweepers, skid loaders, dozers and excavators account for less than 1% of the TOG emissions. CO Emissions Estimates Container terminals accounted for 78% of the 1182 tons of CO, while break bulk and dry bulk terminals accounted for 22%. This profile differs from the proportions seen for the other pollutants because of the operation of propane-powered forklifts at the bulk terminals, which emit relatively more CO than diesel engines. A breakdown of the CO emissions by equipment inventoried is presented in Table 2.9 and Figure Table 2.9: CHE CO Emissions Survey Equipment Types CO CO (tpy) (%) Yard tractors RTG cranes, cranes Top and Side Loaders Forklifts Rubber tired loaders Excavators Sweepers Dozers Skid loaders Total 1,179.6 Starcrest Consulting Group, LLC 46 March 2004
55 Figure 2.17: CHE CO Emissions, tpy Rubber Tired Loaders % Sweepers % Skid Steer Loaders % Cranes % Excavators % Side and Top Handlers % Crawler Tractors % Yard Tractors % Forklifts % Yard tractors account for approximately 44% of the total CO emissions. RTG cranes and other cranes account for 20% of the CO emissions. Side and top loaders account for 8% of the CO emissions. LPG and diesel-powered forklifts account for 16% of the CO emissions. Rubber tired loaders and other miscellaneous equipment account for 12% of the total CO emissions. Sweepers, skid loaders, dozers and excavators account for less than 1% of the CO emissions. PM 10, PM 2.5, and DPM Emission Estimates The PM 10 contribution of container terminals was 91% of the total of 147 tons. The relative proportions of PM 2.5 and DPM were similar. A breakdown of the PM 10, PM 2.5, and DPM emissions by equipment inventoried is presented in Table 2.10 and Figures 2.18, 2.19 and Starcrest Consulting Group, LLC 47 March 2004
56 Table 2.10: CHE PM 10, PM 2.5, and DPM Emissions All Survey Equipment PM 10 PM 2.5 DPM PM (tpy) (tpy) (tpy) (%) Yard tractors RTG cranes, cranes Top and Side loaders Forklifts Rubber tired loaders Excavators Sweepers Dozers Skid loaders POLB Baseline EI Figure 2.18: CHE PM 10 Emissions, tpy Rubber Tired Loaders % Side and Top Handlers % Sweepers % Skid Steer Loaders % Cranes % Crawler Tractors % Excavators % Forklifts % Yard Tractors % Starcrest Consulting Group, LLC 48 March 2004
57 Figure 2.19: CHE PM 2.5 Emissions, tpy Sweepers % Rubber Tired Loaders % Side and Top Handlers % Skid Steer Loaders % Cranes % Crawler Tractors % Excavators % Forklifts % Yard Tractors % Yard tractors account for approximately 64% of the total PM 10 and PM 2.5 emissions. RTGs and other cranes account for 13% of the PM 10 and PM 2.5 emissions. Side loaders, top loaders, and reach stackers also account for 13% of the PM 10 and PM 2.5 emissions. LPG and diesel-powered forklifts account for 6% of the PM 10 and PM 2.5 emissions. Rubber tired loaders and other miscellaneous equipment account for 3% of the total PM 10 and PM 2.5 emissions. Sweepers, skid loaders, dozers and excavators account for less than 1% of the PM 10 and PM 2.5 emissions. Starcrest Consulting Group, LLC 49 March 2004
58 Figure 2.20: CHE DPM Emissions, tpy Sweepers % Skid Steer Loaders % Cranes % Side and Top Handlers % Rubber Tired Loaders % Crawler Tractors % Excavators % Forklifts % Yard Tractors % Yard tractors account for approximately 64% of the total DPM emissions. RTGs and other cranes account for 13% of the DPM emissions. Side loaders, top loaders, and reach stackers also account for 13% of the DPM emissions. Diesel-powered forklifts account for 5% of the DPM emissions. Rubber tired loaders and other miscellaneous equipment account for almost 4% of the total DPM emissions. Sweepers, skid loaders, dozers and excavators account for less than 1% of the DPM emissions. Starcrest Consulting Group, LLC 50 March 2004
59 SO 2 Emissions Estimates Once again, container terminals had the highest emissions of the terminal types, at 93% of the 50 total tons of SO 2. A breakdown of the SO 2 emissions by equipment inventoried is presented in Table 2.11 and Figure Table 2.11: CHE SO 2 Emissions Survey Equipment Types SO 2 SO 2 (tpy) (%) Yard tractors RTG cranes, cranes Top and Side Loaders Forklifts Rubber tired loaders Excavators Sweepers Dozers Skid loaders Total 50.1 Figure 2.21: CHE SO 2 Emissions, tpy Side and Top Handlers % Skid Steer Loaders % Rubber Tired Loaders-0.8-2% Sweepers % Cranes % Crawler Tractors % Excavators % Forklifts % Yard Tractors % Starcrest Consulting Group, LLC 51 March 2004
60 Yard tractors account for approximately 60% of the total SO 2 emissions. RTGs and other cranes account for 14% of the SO 2 emissions. Side and top loaders account for 17% of the SO 2 emissions. LPG and diesel-powered forklifts account for 5% of the SO 2 emissions. Rubber tired loaders account for 2% of the total SO 2 emissions. Sweepers, skid loaders, dozers and excavators account for less than 1% of the SO 2 emissions. Auto Terminal Emissions Estimates The total annual emissions for the new autos in 2002 at the auto terminal are listed in Table Table 2.12 New Automobile Emissions, tons/year Vehicle Class NO X TOG CO PM 10 PM 2.5 SO 2 (tpy) (tpy) (tpy) (tpy) (tpy) (tpy) LDA LDT Totals These emission estimates are based on a total of 340,000 automobiles, out of which 231,600 were gasoline light duty automobiles (LDA) and 108,400 gasoline light duty trucks (LDT1). The new vehicles travel an average of 0.5 miles at 15 mph from the ship to the parking area for loading unto trucks or rail. The following tables summarize the running (15 mph) and starting emission factors from the EMFAC2002 model. Table 2.13 Running Emission Factors, grams/mile Vehicle Class NO X TOG CO PM 10 SO 2 (g/mi) (g/mi) (g/mi) (g/mi) (g/mi) LDA LDT Table 2.14 Starting Emission Factors, grams/start Vehicle Class NO X TOG CO PM 10 SO 2 LDA LDT Starcrest Consulting Group, LLC 52 March 2004
61 For the evaporative emissions, Table 2.15 presents the TOG emission factors that were used. Table 2.15 Evaporative Emission Factors Vehicle Class Start Run (g/start) (g/mi) LDA LDT Starcrest Consulting Group, LLC 53 March 2004
62 (This page intentionally left blank)
63 SECTION 3 RAILROAD LOCOMOTIVES This section discusses the rail systems that operate at POLB, including the types of activities performed, the equipment used, and the methods of estimating emissions. As noted in Section 1.2, different methods have been used for different types of activity to make best use of the information that was made available by the various railroads operating in POLB. Section 3.1 describes the locomotives, Section 3.2 provides further detail on the emission estimating methodology, and Section 3.3 presents the results for this source category. 3.1 Rail System and Locomotives Railroad operations are typically described in terms of two different types of operation, line haul and switching. Line haul refers to the movement of cargo over long distances (e.g., cross-country) and occurs within the POLB at the initiation or termination of a line haul trip, as cargo is either picked up for transport to destinations across the country or is dropped off for shipment overseas. Switching refers to the assembling and disassembling of trains at various locations in and around the POLB, sorting of the cars of inbound cargo trains into contiguous fragments for subsequent delivery to terminals, and the short distance hauling of rail cargo within the port. It is important to recognize that outbound rail freight is cargo that has arrived on vessels and is being shipped to locations across the U.S., whereas inbound rail freight is destined for shipment out of the port by vessel. This is contrary to the usual terminology of cargo off-loaded from vessels referred to as inbound and that loaded onto vessels as outbound. Locomotives used for line haul operations are typically large, powerful engines of 3,000 hp or more, while switch engines are smaller, typically having 1,200 to 3,000 hp. Older line haul locomotives have often been converted to switch duty as newer line haul locomotives with more horsepower have become available. The POLB is served by three railway companies: Burlington Northern and Santa Fe (BNSF) Union Pacific (UP) Pacific Harbor Line (PHL) These railroads handle dry bulk, liquid bulk, car-load (box car), and intermodal flatcar transportation. The locomotive section of the EI presents an estimate of emissions associated with portrelated activities of the locomotives operating within the POLB. Information regarding these operations has been obtained through interviews with railroad operators and others with knowledge of rail activities associated with the POLB. Starcrest Consulting Group, LLC 54 March 2004
64 3.1.1 Rail System Description The rail system is described below in terms of the activities that are undertaken by locomotive operators. Specifically, descriptions are provided for the assembly of outbound trains, the disassembly of inbound trains, and the performance of switching operations, as well as a detailed listing of the activities of line haul and switching operations. Outbound Trains The assembly of outbound trains occurs in one of three ways. Container terminals with sufficient track space build trains on-terminal, using flat cars that have remained on site after the off-loading of inbound containers or those brought in by one of the railroads. Alternatively, containers can be trucked (drayed) to an off-terminal transfer facility where the containers are transferred from truck chassis to railcar. A third option is for the terminal to store individual railcars or build a partial train onterminal, to be collected later and moved to a rail yard with sufficient track to build an entire train. Within the POLB, trains can be built at the Pier G Yard, the Pier B Yard, and most of the container terminals. Trains can be built at the Pier G Yard, the ITS terminal, the Hanjin terminal, and the Pier G and Pier B Yards. Complete trains are also built outside of the POLB at the Watson Yard, the Dolores Yard, and the Manuel Yard. If containers to be transported by rail are not loaded onto railcars at the Port, they are drayed to off-port locations operated by the line haul railroads. The containers are loaded onto railcars at these locations. Inbound Trains In-bound trains that carry cargo (or empty containers) that are all destined for the same terminal are delivered directly to the terminal by the line haul railroad if the receiving terminal has the track space to accommodate all of the cars at one time (i.e., ITS and Hanjin). Trains carrying cargo that is bound for multiple terminals with one or both ports are staged by the line haul railroads at several locations, where they are broken up by switch engines and delivered to their destination terminals. Within POLB, these locations include the Hanjin terminal, and the Pier G, Pier B, and Mead Yards. Inbound trains are also dropped off at the ICTF, the Dolores Yard, the Watson Yard, and the Manuel Yard. Switching Switching locomotives deliver and pick up railcars to and from the non-container terminals at both ports, including liquid and dry bulk terminals and general cargo terminals, as well as the container terminals. Starcrest Consulting Group, LLC 55 March 2004
65 Switching operations take place around the clock, seven days per week, although weekend activity is generally lower than weekday or weeknight activity. The primary switching company s operations are organized into scheduled shifts, each shift being dispatched to do specified tasks in shift-specific areas covering all areas of the ports having rail service. For example, there is a daily shift that operates in the POLB servicing the Toyota import terminal and various other non-container terminals in the port. As another example, another daily shift operates on the west side of the POLA, servicing liquid bulk terminals and storage facilities in that area. Other shifts move empty or laden container flat cars to and from container terminals. Much of the work involves rearranging the order of railcars in a train to locate cars bound for the same destinations (inbound or outbound) in contiguous segments of the train, and to ensure proper train dynamics. (Train dynamics can include, for example, locating railcars carrying hazardous materials the appropriate minimum distance from the locomotives, and properly distributing the train s weight.). Although there is a defined schedule of shifts that perform the same basic tasks, there is little consistency or predictability to the work performed during a given shift or at a particular time. Specific Activities Locomotive activities of the line haul railway companies consist of: Delivering inbound trains (and/or empty railcars) to terminals or to the nearby rail yards, using line haul locomotives. Picking up trains from the terminals or nearby rail yards and transporting them to destinations across the country, using line haul locomotives. Breaking up inbound trains and sorting rail cars into contiguous fragments, and delivering the fragments to terminals, using switch locomotives. Locomotive switching activities consist of: Breaking up inbound trains and sorting railcars into contiguous fragments, and delivering the fragments to terminals. Delivering empty container flat cars to terminals. Delivering rail cars to non-container facilities, and removing previously delivered rail cars. (For example, delivering full tank cars to a terminal that ships product and removing empties, or delivering empty tank cars to a terminal that receives product and removing full ones.) Rearranging full and empty railcars to facilitate loading by a terminal. (For example, a break bulk terminal has two loading tracks and two storage tracks. BNSF delivers empty flat cars and positions four equal sets of the empty cars on the four tracks. After the terminal has loaded cargo onto the cars located on the loading tracks, PHL switches the full cars onto the storage tracks and the empty cars onto the loading tracks. After the terminal has completed loading the second set of empty rail cars, BNSF returns and picks up the train for transport out of the port.) Starcrest Consulting Group, LLC 56 March 2004
66 Picking up outbound containers in less than full train configuration and transporting them to a yard for assembly into full trains to be transported out of the port by one of the line haul railroads Description of Locomotives Physical and operational characteristics of the locomotives operating at the POLB are discussed in the following paragraphs. Locomotives operate differently from other types of mobile sources with respect to how they transmit power from engine to wheels. While most mobile sources use a physical coupling such as a transmission to transfer engine power to the wheels, a locomotive s engine turns a generator or alternator powering an electric motor that powers the locomotive s wheels. The physical connection of a typical mobile source means that the engine s speed is dictated by the vehicle s speed through a fixed set of gear ratios, resulting in the highly transient operating conditions (particularly engine speed and load) that characterize mobile source operations. In contrast, the locomotive s engine and drive system operate more independently, such that the engine can be operated at a particular speed without respect to the speed of the locomotive itself. This allows operation under more steady-state load and speed conditions, and as a result locomotives have been designed to operate in a series of discrete throttle settings called notches, ranging from notch positions one through eight, plus an idle position. Many locomotives also have a feature known as dynamic braking, in which the electric drive engine operates as a generator to help slow the locomotive, with the resistance-generated power being dissipated as heat. While the engine is not generating motive power under dynamic braking, it is generating power to run cooling fans, so this operating condition is somewhat different from idling. Switch engines typically do not feature dynamic braking. Line Haul Locomotives Line haul locomotives are operated in the Port by BNSF and UP. Because the function of line haul locomotives is to transport freight to and from destinations across the country, there is no readily identifiable fleet of line haul locomotives that call on the Port other than the railroads nation-wide fleets. The characteristics of BNSF line haul locomotives operating within the Port have been estimated from a sampling of BNSF locomotives that called on the Port area in 2001 BNSF provided this sample of locomotives as being representative of their line haul locomotives calling on the Port. The sample of locomotives, primarily the 6-axle GE C44-9W (also known as Dash 9 s) has an average of 4,256 horsepower. Basic specifications of UP locomotives have been obtained from the railroad s Internet website ( The UP website lists approximately 6,500 line haul locomotives in the company s nation-wide fleet, with an average power rating of 3,655 horsepower. Most of the locomotives (78%) are six-axle units, the remainder (22%) being 4-axle units. Six-axle locomotives are generally more powerful than four-axle locomotives. Most of the UP locomotives calling on the POLB are six-axle, 4,000-horsepower Electromotive Division (EMD) SD70s. Starcrest Consulting Group, LLC 57 March 2004
67 Line haul locomotives are typically operated in groups of two to five units, with three or four units being most common, depending on the power requirements of the specific train being pulled and the horsepower capacities of available locomotives. Thus, two higher-horsepower locomotives may be able to pull a train that would take three units with lower power outputs. Locomotives operated in sets are connected such that every engine in the set is operated in unison by an engineer in one of the locomotives. Switching Locomotives Most switching within the POLB is conducted by one company. The other railroad companies that work in the area also conduct limited switching, primarily at their offport locations. The on-port switching fleet in 2002 consisted of 13 switch engines ranging from 1,200 to 2,000 hp, with an average of 1,573 hp. While this fleet consists of several models, all are powered by 12- or 16-cylinder EMD engines. The other railroads also operate switch engines in and around the POLB, primarily at their switching yards outside of the port. Table 3.2 lists the switch engines that have been reported as working in the area. They are typically powered by EMD engines, with an average power rating of 2,167 hp. Table 3.1 presents make, model, and horsepower information of switching engines working on-port and off-port. Starcrest Consulting Group, LLC 58 March 2004
68 Table 3.1: Typical On and Off-Port Switching Locomotives POLB Baseline EI Locomotive Engine Engine Model Horsepower Model Mfr (each) SW-1200 EMD C 1,200 SW-1200 EMD C 1,200 SW-1200 EMD BC 1,200 SW-1200 EMD C 1,200 SW-1200 EMD C 1,200 GP-7 EMD BC 1,500 GP-9 EMD C 1,750 SD-18 EMD D3 1,800 SD-18 EMD D3 1,800 SD-18 EMD D3 1,800 SD-18 EMD D3 1,800 SD-20 EMD D1 2,000 SD-20 EMD CE 2,000 GP-7 EMD not known 1,500 GP-7 EMD not known 1,500 GP-9 EMD not known 1,750 GP-30 EMD not known 2,250 GP-30 EMD not known 2,250 GP-30 EMD not known 2,250 GP-39-2 EMD not known 2,300 GP-39-2 EMD not known 2,300 GP-39-2 EMD not known 2,300 GP-39-2 EMD not known 2,300 GP-39-2 EMD not known 2,300 SD-40 EMD not known 3, Methodology The following section provides a discussion of how railroad and locomotive data were collected and a detailed description of the methods used to estimate emissions Data Collection The primary switch engine operator within the POLB generously provided data in the form of files downloaded from their locomotives electronic event recorders. Similar to the black boxes installed in aircraft, the event recorders maintain a record of several locomotive operating parameters on a second-by-second basis, including throttle notch setting, locomotive speed, and direction of travel. The recorders have limited storage capacity and typically maintain two to three days of data with the oldest data being overwritten as new data is accumulated. The switch engine operator provided a download from each of its locomotives covering the same approximate 2-day period of operation. While two days of operation is relatively short compared with the operating time in a year, the railroad operator confirmed that the period of time covered by the download had been a typical period regarding locomotive operations. Starcrest Consulting Group, LLC 59 March 2004
69 In addition to providing event recorder data, the switch engine operator allowed access to their switch engines as they operated. A Port consultant rode along with the switching crew on seven of the 24 shifts, covering all hours of operation and most areas of the port to gain an understanding of the work performed and the types of cargo handled. One of the line haul railway companies provided valuable information on their switch engines, including representative fuel usage, as well as emissions data and limited throttle notch data for switching and line haul locomotives. In addition, railroad personnel were interviewed for an overview of their operations in the area. To date, the other line haul railroad company has provided limited but valuable information, which has been incorporated into the emission estimates presented in this report. As stated previously, certain information related to line haul locomotive fleets has been obtained from railroad companies Internet websites. Additionally, terminal operators who use the rail system have also provided valuable information, including the percentage of their cargo shipped by rail, where and how cargo is loaded, and other operational details Emissions Estimation Emissions have been estimated using the information provided by the railroads and the terminals, and from published information sources such as the EPA s Regulatory Support Document (RSD) published as background to EPA s locomotive rulemaking process. 18 For in-port switching operations, the throttle notch data and schedule/operational information provided by the switching companies has been used along with EPA data on emission rates by throttle notch. Off-port switching emissions have been estimated using throttle notch, emissions, and fuel use data provided by one of the railroad companies. For the limited line haul operations in the POLB, emission estimates have been based on schedule and throughput information provided by terminal operators and on EPA operational and emission factors. The throttle notch setting approach to estimating locomotive emissions has been selected as the preferred method to provide better spatial resolution than alternative approaches. However, specific throttle notch information has only been provided for switching operations. Therefore, throttle notch information published by EPA and described below has been used to estimate line haul emissions. A detailed explanation of emission calculation methods is presented in the following section, and back-up data tables are provided in Appendix B. 18 EPA Office of Mobile Sources, April 1998, revised. Locomotive Emission Standards Regulatory Support Document. Starcrest Consulting Group, LLC 60 March 2004
70 3.3 Emission Estimates A summary of estimated emissions from locomotive operations in the POLB are presented in Table 3.2. Estimated locomotive emissions are compared with estimated port-wide emissions in Figure 3.1. These emissions include operations within the POLB and portrelated emissions out to (and including) Watson, Dolores, and Manuel Yards. Table 3.2: Locomotive Operations Estimated Emissions NO x TOG CO PM 10 PM 2.5 DPM SO 2 Line Haul In-Port Switching Out-of Port Switching Totals (tpy) Totals (tpd) Figure 3.1: Comparison of Locomotive Emissions with Port-Wide Emissions, tpy 3,500 3,000 2,500 2,000 1,500 1, NOx TOG CO PM10 PM2.5 DPM SO2 Rail Total Starcrest Consulting Group, LLC 61 March 2004
71 Emissions from rail operations have been calculated using information provided by the railroads and the terminals, and from published EPA documents including the RSD, previously cited, and Technical Highlights Emission Factors for Locomotives 19. These publications were issued in support and clarification of EPA s locomotive emissions rule. Different calculation methods were required because different types of information were provided for different activities. For example, an activity and throttle notch-based approach has been used for one company s switching emissions, whereas a fuel use-based approach has been used for another. These methods are described below Switching Emissions Separate emission estimates have been prepared for the companies that provide switching services within the POLB based on the information each company provided. Estimation methods differ because the companies provided different types of information, as described below. Switching Emission Estimation Method No. 1 Emissions from the first set of switching operations have been based on the railroad company s schedule of operations and site-specific throttle notch frequencies, and emission factors from the EPA documents cited above. First, the characteristics of the railroad company s fleet operating in 2002 have been evaluated to develop a fleet average horsepower rating. Because several locomotives normally operate as coupled pairs, these pairs were considered as one locomotive when developing the averages. Table 3.3 lists the in-use rated horsepower characteristics of this company s 2002 fleet. Note that there are two pairs of 1,200- hp SW-1200s, each pair having a combined 2,400 hp, for a total of 4,800 hp. Table 3.3: In-use Horsepower Characteristics of Switch Locomotives Locomotive Number Horsepower Model Each Total Pair of SW-1200s 2 2,400 4,800 Single SW ,200 1,200 SD ,800 7,200 SD ,000 4,000 GP-7/GP-9 Pair 1 3,250 3,250 Total 10 20,450 Average locomotive horsepower: 2, EPA Office of Mobile Sources, December Technical Highlights Emission Factors for Locomotives, EPA420-F Starcrest Consulting Group, LLC 62 March 2004
72 Next, the average notch-specific horsepower values for the average switch locomotive operated by this company have been calculated by multiplying the average rated horsepower value by notch-specific percentages derived from the EPA s RSD cited above. The percentages represent the fraction of total rated horsepower that is produced in each throttle setting. The results of this process are illustrated in Table 3.4. The values in the column % of Avg. Rated bhp are obtained by dividing the RSD notch-specific horsepower value (e.g., 83 hp for notch position 1) by the average RSD horsepower rating, 1,750 hp. These percentages are multiplied by the average in-use horsepower of the local in-port switching fleet (2,045 hp) to provide the estimates of average in-use horsepower for each throttle notch position. Table 3.4: Calculation of Notch-Specific In-Use Horsepower (Switch Engines) RSD Notch Power in % of Avg. Avg. in-use Notch, bhp Rated bhp Power, bhp DB % 78 Idle % % % % % , % 1, , % 1, , % 1, , % 2,153 Average RSD hp: 1,750 Avg. local hp: 2,045 (Note: in these tables, DB refers to dynamic braking, a feature of some locomotives operation that does not apply to this switching locomotive fleet. The term is included because it is part of the published EPA data set.) The next step is to develop notch-weighted hourly emission rates, first by using the in-use horsepower values described above to convert the RSD average switching emission rates from grams per horsepower-hour (g/hp-hr) to pounds per hour (lbs/hr). The equation is: g/hp-hr x hp = lb/hr g/lb The two sets of emission rates are presented in Tables 3.5 and 3.6, where the values in Table 3.6 have been obtained by multiplying those in Table 3.5 by the in-use horsepower figures presented in Table 3.4. For example, the CO calculation for notch position 1 would be: 2.56 g/hp-hr x 96 hp = 0.54 lb/hr g/lb Starcrest Consulting Group, LLC 63 March 2004
73 This value (0.54 lb/hr) is shown in Table 3.6 under CO opposite notch position 1. Table 3.5: Horsepower-Based Emission Factors from RSD (Switch Engines) Notch HC CO NO X PM g/bhp-hr g/bhp-hr g/bhp-hr g/bhp-hr DB Idle Table 3.6: Hourly Notch-Specific Emission Rates (Switch Engines) Notch HC CO NO X PM SO 2 lb/hr lb/hr lb/hr lb/hr lb/hr DB Idle Table 3.6 also includes hourly emission rates of SO 2 that have been estimated on the basis of a mass balance approach and a typical fuel sulfur content of 350 ppm by weight. The mass balance approach assumes that the sulfur (S) in the fuel is converted to SO 2 and emitted during the combustion process. The following example shows the calculation for throttle notch position 1. Starcrest Consulting Group, LLC 64 March 2004
74 350 lbs S x lbs fuel x 2 lbs SO 2 x 97 hp = 0.02 lbs SO 2 /hr 1,000,000 lbs fuel hp-hr lb S In this calculation, 350 ppm S is written as 350 lbs S per million lbs of fuel. The value of lbs fuel/hp-hr is an average brake-specific fuel consumption derived from EPA s technical literature on locomotive emission factors. Two pounds of SO 2 is emitted for each pound of sulfur in the fuel because the atomic weight of sulfur is 32 while that of SO 2 is 64, meaning that the weight of an amount of sulfur doubles when it is expressed as SO 2. Finally, the average in-use horsepower value for throttle notch position 1 is 97 hp, as presented in Table 3.4. This calculation was carried out for each throttle notch position; the results are shown in Table 3.6. The SO 2 calculations have been based on an assumed fuel sulfur content of 350 ppm. A switching company maintenance representative reported that low sulfur California diesel is the fuel typically used in the locomotives, which is typically accepted to have a sulfur content of 350 ppm or less. As with other components of the port-wide EI (e.g., vessels, cargo-handling equipment), more in-depth study for fuel sulfur could improve the accuracy of the locomotive SO 2 emission estimates. A notch-weighted average emission rate is estimated using time-in-notch percentages developed from the event recorder data provided by the switching company. Each hourly value in Table 3.6 is multiplied by the percentage corresponding to the respective notch setting. The percentages and resulting fractional emission rates are shown in Table 3.7. Because the time-in-notch fractions represent all of the locomotive operating times, the products obtained from the multiplication of pounds per hour by time fraction, can be summed to provide a notch-weighted hourly emission rate that is representative of the average switching locomotive (or pair of locomotives) operating with an average site-specific throttle notch distribution. As an example, the notch 1 CO value of 0.54 lb/hr in Table 3.6 is multiplied by the notch 1 percentage of 5.9% listed under wt d avg % in mode on Table 3.7 to arrive at the fractional emission rate of 0.03 that is shown under the Table 3.7 column headed CO % x lb/hr, adjacent to the throttle notch 1 percentage value. All of the fractional CO values calculated in this manner are summed at the bottom of Table 3.7 to calculate the weighted average emission rate. Starcrest Consulting Group, LLC 65 March 2004
75 Table 3.7: Time-in-Notch and Weighted Average Emission Rates POLB Baseline EI Notch wt'd avg HC CO NO X PM SO 2 % in mode % x lb/hr % x lb/hr % x lb/hr % x lb/hr % x lb/hr DB 0.0% Idle 67.4% % % % % % % % % Weighted average lb/hr An estimate of the operating hours of these switching locomotives has been developed by evaluating the number and duration of work shifts. Company staff noted that locomotives are shut off when they are not in use, so by-shift operations represent the appropriate measure of operating time. The schedule of shifts is well defined, with 23 shifts per day during the week, and 20 per day on weekend days. While shifts may last up to 12 hours (the federally mandated limit for railroad crews) they are usually shorter. An average of 8 hours per weekday shift has been assumed based on an evaluation of shift duration records. Four hours has been assumed for Saturday and Sunday shifts because weekend shifts are reportedly shorter than weekday shifts. These assumptions provide the basis of an estimate of annual hours of locomotive operation, as presented in Table 3.8. Table 3.8: Estimate of Annual Switching Locomotive Hours of Operation Approx. Operating Operating Operating hours/day Shifts/day hours/shift (shifts/day x hours/shift) Weekdays Saturdays Sundays Operating hrs/week 1,080 Operating hrs/year (52 wks/year) 56,160 Starcrest Consulting Group, LLC 66 March 2004
76 The switching company operates within both the POLB and the POLA. While some of the shifts are focused on activities in only one of the ports, such as the 13:00 Long Beach shift, other shifts may work in either or both ports depending upon the day s needs for switching services. Therefore, a method is required for apportioning emissions between the two ports. To do this, the shifts have been evaluated as to whether they were likely to work in either port exclusively or in both ports. If a shift could work in both ports it is assumed that, on average, each port receives an equal amount of time. This assumption was made because no data were available to substantiate a more definitive apportionment. In this manner, a value of or 0 is assigned to each port for each shift, as shown in Table 3.9. The sum of the values for each port is used to estimate the distribution of activity between the two ports. Table 3.9: Estimate of Distribution of Emissions Between Ports Port of Port of Shift Name Start Time Days Los Angeles Long Beach BNSF 0:01 Every day UP 0:01 Every day APL 1:30 Every day 1 0 BNSF 2:00 Every day Pier A / IC switcher 3:00 Mon-Sat (off Sun) 1 0 Pier A switcher 8:00 Every day 1 0 BNSF dock 8:00 Sat/Sun Hanjin 10:00 Mon-Fri (off Sat/Sun) 0 1 BNSF dock 10:00 Every day Yang Ming 10:00 Tues-Sun (03:00 Monday) 1 0 BNSF dock / Pier :30 Every day 1 0 NYK 10:30 Sun-Fri (off Sat) 1 0 TICTF 10:30 Every day 1 0 UP 12:01 Every day Long Beach 13:00 Mon-Fri (off Sat/Sun) 0 1 APL 14:00 Every day 1 0 BNSF dock 14:30 Every day BNSF dock 15:30 Every day West Basin 17:00 Every day 1 0 Manual / Terminal Island 18:00 Mon-Fri (off Sat/Sun) NYK switcher 20:00 Sat-Thur (off Fri) 1 0 DAS switcher 20:00 Every day 1 0 BNSF dock 22:30 Every day UP dock 22:30 Every day Total Percentage of emissions apportioned to each port: 69% 31% Starcrest Consulting Group, LLC 67 March 2004
77 As the final step, emissions from the locomotives attributable to the POLB have been calculated by multiplying the hourly notch-weighted emission rates shown in Table 3.7 by the annual operating hours shown in Table 3.8 and the POLB activity percentage from Table 3.9. For example, the CO emission rate of 0.92 lb/hr multiplied by 56,160 hours/year (from Table 3.8) and the 31% POLB fraction (from Table 3.9), and divided by 2,000 lbs/ton, results in the 8.0 tons per year shown in Table lb/hr x 56,160 hr/yr x 0.31 = 8.0 tpy 2,000 lb/ton The results shown in Table 3.10 include emissions from the primary POLB switching company as well as emissions from switch locomotives operated by a POLB terminal, estimated using similar methods. Table 3.10: Estimated Switching Emissions for POLB NO x TOG CO PM 10 PM 2.5 DPM SO 2 Switching Company Terminal <0.1 Totals (tpy) Totals (tpd) Note: All particulate emissions are assumed to be PM 10 and diesel particulate matter (DPM); PM-2.5 emissions have been estimated as 92% of PM 10 emissions. In addition, the hydrocarbon (HC) emission rate presented in Table 3.8 has been converted to total organic gases (TOG) using a conversion factor of 1.07 (HC x 1.07 = TOG), as discussed in subsection 1.5. To evaluate the relative accuracy of these estimates, the amount of fuel that would be required to operate the estimated number of hours was calculated and compared with the switching company s reported fuel usage of approximately 45,000 gallons per month. Expected fuel consumption was determined by multiplying the number of hours per year by the estimated in-use horsepower and by a fuel consumption factor derived from EPA s Technical Highlights document cited previously. The in-use horsepower was estimated by multiplying the notch-specific horsepower estimates presented in Table 3.4 by the percent time-in-notch values in Table 3.7 and summing the notch-specific results. This procedure estimated an average of 228 horsepower as illustrated in Table Starcrest Consulting Group, LLC 68 March 2004
78 Table 3.11: Calculation of Average In-Use Horsepower Notch wt'd avg Avg. in-use A % in mode Power, bhp % x bhp DB 0.0% Idle 67.4% % % % % % 1, % 1, % 1, % 2, Weighted average horsepower 228 The fuel-use factor (gallons of fuel per horsepower-hour, gal/hp-hr) was derived from the EPA emission factors by dividing their gram/horsepower-hour emission factors by their gram/gallon emission factors. The results were consistently gal/hp-hr. Although these fuel use factors, known as brake-specific fuel consumption, or BSFC, vary by engine type and by engine operating conditions, this value is typical of diesel engine BSFC values. The product of annual hours, in-use horsepower, and BSFC predict the annual and monthly fuel consumption amounts illustrated in Table The predicted monthly amount is approximately 14% higher than the 45,000 gallon-per-month figure provided by the switching company, indicating fairly good agreement and a conservatively high emission estimate. Table 3.12: Fuel Use Estimate for In-Port Switching Factor Value Explanation Weighted avg. operating horsepower 229 (sum of hp in notch x Brake-specific fuel consumption, gal/hp-hr % time in notch) (derived from EPA's technical Estimated fuel use, gals/year 616,733 literature on locomotive emission factors) (hp x operating hours x Estimated fuel use, gals/month 51,394 gal/hp-hr) (annual fuel use estimate /12 months/year) Reported actual fuel use, gals/month 45,000 (reported by switching railroad) Difference, % 14% (estimated - reported) /reported Starcrest Consulting Group, LLC 69 March 2004
79 Switching Emission Estimation Method No. 2 Another railroad company operates a number of switching locomotives at their offport rail yard, which is about three miles northwest of the POLB, to help make up the trains that are hauled out of the region. A second method of estimating emissions was needed for these locomotives because the company reported different information than the switching company discussed above. This company provided a refueling record of two to three months for their locomotives operating in the off-port yard and elsewhere in the region. Expected annual fuel use was extrapolated from this record and the average annual perlocomotive estimated fuel usage was used to estimate emissions from the locomotives operating in the off-port rail yard. The refueling record and estimate of annual fuel use are presented in Table Annual fuel use was estimated for each locomotive individually, then summed to estimate fuel usage for all 12 of this company s locomotives. The following method was used to estimate annual fuel use: 1) The number of days between refueling events was calculated by subtracting the dates of each two consecutive refueling events; for example, a fueling event on 6/20 followed by a fueling event on 6/27 would be calculated as 7 days of use between fueling events. 2) The amount of fuel presumed to be used during the period between refueling events was calculated by subtracting the pre-fill volume of each refueling event from the ending volume of the previous refueling event; for the 7 days mentioned above, the pre-fill volume of zero gallons on 6/27 (empty tank) was subtracted from the 6/20 ending volume of 900 gallons, to indicate that 900 gallons of fuel was used over the seven days between 6/20 and 6/27. (The locomotive s fuel tank held 900 gallons after being filled on 6/20 and held 0 gallons by 6/27 when it was refilled.) In a few cases, the ending volume was less than the following pre-fill volume, for unknown reasons. These anomalies were not factored into the fuel use estimates, but are indicated in Table 3.13 by grey shading. 3) The average daily volume of fuel used for each period was calculated by dividing the volume of fuel (step 2) by the number of days (step 1); 4) The average daily volume for each locomotive was calculated by dividing the sum of the volumes for that locomotive by the sum of the days; for example, a locomotive was indicated by the record to use 4,920 gallons over 50 days the average daily usage for that locomotive was calculated to be 4,920/50 = 98.4 gallons per day. 5) The projected annual volume for each locomotive was calculated by multiplying the average daily volume by 365 days per year; for the locomotive discussed above, the annual rate would be calculated as 98.4 x 365 = 35,916 gallons per year. Starcrest Consulting Group, LLC 70 March 2004
80 Table 3.13: Off-Port Rail Yard Locomotive Fuel Use Record POLB Baseline EI Locomotive Date Location Pre-Fill (Gallons) Ending Days of Use Gallons Used Gallons per Day Projected Gals per Year EMD GP-7 7/25/03 POLA/POLB area 1, HP 7/29/03 POLA/POLB area total: average: ,063 EMD GP-7 6/25/03 POLA/POLB area HP 7/1/03 POLA/POLB area 800 1, /8/03 POLA/POLB area , /15/03 POLA/POLB area /19/03 POLA/POLB area 0 1, /31/03 POLA/POLB area , total: average: 30 3, ,416 EMD GP-9 6/9/03 POLA/POLB area HP 6/15/03 POLA/POLB area 200 1, /20/03 POLA/POLB area , /27/03 POLA/POLB area 0 1, /7/03 POLA/POLB area 0 1, , /25/03 POLA/POLB area 705 1, /29/03 POLA/POLB area total: average: 50 4, ,916 EMD GP-30 4/6/03 Kaiser 1, HP 4/13/03 Kaiser 600 1, , /14/03 Riverbank 700 2, /29/03 POLA/POLB area 1, total: average: 114 2, ,533 EMD GP /9/03 POLA/POLB area 2, HP 6/15/03 POLA/POLB area 1,200 2, /20/03 POLA/POLB area 1,600 2, /27/03 POLA/POLB area 1,200 2, /3/03 POLA/POLB area 1,600 2, /7/03 POLA/POLB area 1, total: average: 28 3, ,714 EMD GP /2/03 Stockton 1, HP 5/19/03 POLA/POLB area 2,355 2, /24/03 POLA/POLB area 200 2, , /1/03 POLA/POLB area 600 1, , /15/03 POLA/POLB area 200 2, , /19/03 POLA/POLB area 2, total: average: 61 5, ,196 EMD GP /6/03 Kaiser 2, HP 4/13/03 Kaiser 1,600 2, /27/03 Kaiser 1,350 2, , /11/03 Kaiser 2,500 3, /18/03 Kaiser 2,050 2, , /25/03 Kaiser , /19/03 POLA/POLB area 2,200 2, ,800 6/28/03 POLA/POLB area 1,050 2, , /14/03 POLA/POLB area , total: average: 60 8, ,708 Starcrest Consulting Group, LLC 71 March 2004
81 Table 3.13: Off-Port Rail Yard Locomotive Fuel Use Record (cont d) Locomotive Date Location Pre-Fill (Gallons) Ending Days of Use Gallons Used Gallons per Day EMD GP-30 6/23/03 San Bernadino 2, HP 7/12/03 San Bernadino 1,500 3, /16/03 San Bernadino 1,750 2, , /20/03 San Bernadino 1, total: average: Projected Gals per Year 27 3, ,963 EMD GP-30 5/25/03 Kaiser 2, HP 6/1/03 Kaiser 1,750 2, /8/03 Kaiser 1,350 2, , /15/03 San Bernadino 1,400 2, /22/03 Kaiser 1,000 1, , /29/03 Kaiser 1,600 2, /6/03 Kaiser 1,500 2, /13/03 Kaiser 1,400 2, /20/03 Kaiser 1, , total: average: 49 6, ,163 EMD GP /2/03 POLA/POLB area 3, HP 4/16/03 POLA/POLB area 500 2, , /27/03 Kaiser 1,700 3, /11/03 Kaiser 2,350 3, /18/03 Kaiser 2,350 3, /25/03 Kaiser 2,900 3, /1/03 Kaiser 2,800 3, /8/03 Kaiser 2,100 2, , /15/03 San Bernadino 2,000 2, /22/03 Kaiser 1,700 3, /29/03 Kaiser 2,400 3, /6/03 Kaiser 2,600 3, /13/03 Kaiser 1, , total: average: , ,500 EMD GP /25/03 Corona 2, HP 5/8/03 Corona 1,000 2, , /31/03 Corona 350 2, , /19/03 Corona , total: average: 55 5, ,841 EMD SD-40 4/3/03 San Bernadino 3, HP 4/6/03 San Bernadino 1,500 2, , /14/03 San Bernadino 0 1, , /15/03 San Bernadino 1,950 2, /18/03 San Bernadino 2,500 3, /28/03 San Bernadino 600 3, , /4/03 San Bernadino 400 3, , /9/03 San Bernadino 2, , total: average: 35 12, ,229 Total 553,242 The projected annual fuel use values for the 12 locomotives for which data was provided were added together to provide an estimate of fuel usage for the 12 locomotives. Six locomotives are shown as being primarily or exclusively fueled in the off-port rail yard it has been assumed that six locomotives normally operate within this yard although not necessarily the same six. This is seen as a reasonable method of apportioning activity based on fuel consumption without access to detailed locomotive movement information. The estimated fuel usage per locomotive was calculated as the total for all 12 locomotives divided by 12. Starcrest Consulting Group, LLC 72 March 2004
82 Rail cargo from both the POLB and the POLA are handled at this off-port yard, and the complexities of the rail system are such that apportionment of activity (and emissions) between the two ports is difficult. At the present time an apportionment of 50% to each port has been assumed. This assumption can be refined as additional information on rail activities becomes available. Regardless of apportionment, the sum of the two ports emissions represent all of the estimated switching emissions from locomotives operated by this railroad company at the off-port rail yard. Emission factors based on fuel use have been obtained from the EPA Technical Highlights document, Table 3. These are EPA s baseline emission factors that do not take into account the effects of EPA s recent locomotive emission control rules affecting new and rebuilt locomotives. These are the appropriate emission factors since switch engines are generally older, and lacking detailed information from the railroads the assumption must be made that the locomotives have not been rebuilt. The other major line haul company also operates a rail yard north of the Port. This company has reported that three sets of two locomotives work at this yard. In the absence of more detailed information, it has been assumed that these locomotives perform an equivalent level of activity as the other company s switching locomotives and that their fuel usage and emission levels are equivalent. Table 3.14 illustrates the factors going into the estimate of fuel use for off-port switching activity apportioned to POLB, while Table 3.15 shows the emission factors and estimated emissions. Table 3.14: Switching Activity Fuel Use at the Off-Port Rail Yard Factor Value Notes Projected fuel use for 12 locomotives: 553,242 gals/year Average per-locomotive fuel use: 46,104 gals/year Locomotives working rail yard: 6 (based on fuel use record) Annual switching yard fuel use: 276,621 gals/year Percentage supporting POLB 50% based on what is known of terminals served Annual fuel apportioned to POLB 138,311 annual gals/year x POLB percentage Extrapolation to 2nd line haul railroad 138,311 gals/year additional Total fuel usage - both railroads 276,621 sum of two values above Table 3.15: Estimated Off-Port Rail Yard Emissions NO x TOG CO PM 10 PM 2.5 DPM SO 2 Baseline EFs, g/gal na na 2.2 Totals, tpy Totals, tpd Starcrest Consulting Group, LLC 73 March 2004
83 The emission estimates listed above were calculated by multiplying the emission factor listed in Table 3.15 by the estimated annual fuel use shown in Table The resulting emission estimates (in grams per year) were divided by grams per pound and 2,000 pounds per ton to produce the ton-per-year estimates, which were then divided by 365 days per year to produce the daily emission estimate. The HC emission rate published by EPA has been converted to TOG using a conversion factor of 1.07 as previously noted in subsection Line Haul Emissions Emissions from line haul locomotives operating in the POLB have been estimated on an activity basis, i.e., estimates of the number and characteristics of locomotives that arrive and depart with cargo. The information used in developing these estimates has been obtained from the line haul railroad companies and the POLB terminals. The number of locomotive trips in the POLB has been estimated by evaluating cargo movements, percentage of cargo transported by rail, and typical number of locomotives per train. Locomotive characteristics were primarily obtained from the locomotive information discussed in subsection of his report, and from information reported by the line haul railroad companies. Emission factors have been taken from EPA s RSD throttle notch-specific data, as shown on Table This table also lists the average percentage of rated power in each throttle notch setting for the locomotives listed in the RSD. These percentages represent the fraction of total rated horsepower that is produced in each throttle setting. Table 3.16: EPA Line Haul Locomotive Data RSD Average Line Haul Locomotive EFs RSD Notch NO x HC CO PM % of Power g/bhp-hr g/bhp-hr g/bhp-hr g/bhp-hr in Notch, bhp DB % Idle % % % % % % % % % The average notch-specific horsepower values for a typical line haul locomotive calling on the POLB were calculated by multiplying the assumed typical rated horsepower value by the RSD notch-specific percentages (shown on Table 3.16). The results of this process are illustrated in the Power in Notch, bhp column in Starcrest Consulting Group, LLC 74 March 2004
84 Table For example, for throttle position 1, the POLB horsepower value of 4,250 hp (shown at the bottom of Table 3.17) was multiplied by the percentage in Table 3.16 corresponding to notch position 1 (5.0%). This results in the value of 213 hp shown adjacent to notch position 1 in Table 3.17 (4,250 x 0.05 = 212.5, which rounds to 213). Table 3.17 also shows the result of converting the RSD average line haul emission rates from g/hp-hr to lbs/hr for the locomotive horsepower noted on Table The equation described for the switch engine calculations (Method No. 1) was used. For example, again for throttle position 1, the Table 3.16 NO x emission factor of g/hp-hr was multiplied by the 213 hp for notch position 1 in Table 3.17, and divided by g/lb g/hp-hr x 213 hp = 6.42 lb/hr g/lb This result is shown under NO X in Table 3.17, adjacent to notch position 1. Table 3.17: POLB Notch-Specific Emission Rates (Line Haul) Notch Power in NO x HC CO PM SO 2 Notch, bhp lb/hr lb/hr lb/hr lb/hr lb/hr DB Idle , , , , , Based on: 4,250 horsepower per line haul locomotive A notch-weighted average emission rate was then estimated using time-in-notch percentages published by EPA in their RSD. More representative throttle notch percentages could be used to improve these calculations but this information has not been made available by the railroads. Each hourly value in Table 3.17 was multiplied by the percentage corresponding to the respective notch setting. The percentages and resulting fractional emission rates are shown in Table Each column in Table 3.18 is summed to provide a notchweighted hourly emission rate representing the average line haul locomotive operating with an average throttle notch distribution. Starcrest Consulting Group, LLC 75 March 2004
85 As an example, the notch 1 NO x value of 6.42 lb/hr in Table 3.17 was multiplied by the notch 1 percentage of 6.5% listed under RSD avg % in mode on Table 3.18 to arrive at the fractional emission rate of 0.42 that is shown under the Table 3.18 column headed NO x lb/hr x %, adjacent to the throttle notch 1 percentage value. All of the fractional NO x values calculated in this manner are summed at the bottom of Table 3.18 to calculate the weighted average emission rate. Table 3.18: POLB Line Haul Time-in-Notch and Weighted Average Emission Rates Notch RSD avg. NO X HC CO PM SO 2 % in mode lb/hr x % lb/hr x % lb/hr x % lb/hr x % lb/hr x % DB 12.5% Idle 38.0% % % % % % % % % Wtd. Avg. Emission Rates: An estimate of the number of hours that line haul locomotives spend in the POLB has been based on terminal throughputs, percentages of cargo by rail, and the railroad s descriptions of their operations. This estimate is presented in Table Table 3.19: POLB Line Haul Locomotive Activity Estimate Activity Measure Inbound Outbound Totals # of Trains per Year 1,081 1,233 2,314 # of Locomotives per Train 3 3 Hours on Port per Trip Locomotive Hours per Year 3,243 9,247 12,490 Emission estimates have been calculated by multiplying the total number of locomotive hours per year by the hourly per-locomotive emission rates presented in Table These estimates are presented in Table For example, for NO x, the lb/hr value of in Table 3.18 was multiplied by the total of 12,490 hrs/year in Table 3.19, and divided by 2,000 lbs/ton to result in an annual emission estimate of tpy. This figure was converted to a daily average of 0.55 tons by dividing the yearly total by 365 days/year. Starcrest Consulting Group, LLC 76 March 2004
86 The TOG emission rate presented in Table 3.20 is based on the conversion of HC to TOG by multiplying the HC value by 1.07, as described in subsection 1.5. The estimate of SO 2 emissions has been based on the use of 50% high-sulfur fuel (at an average of 3,500 ppm) and 50% low sulfur fuel (at an average of 350 ppm). These assumptions were made to account for the probable use of both California diesel fuel and higher sulfur fuel from outside California, since the line haul locomotives are not restricted in their geographical areas of use or in where they are fueled. More detailed information on the fueling practices of the line haul railroads would allow the improvement of these assumptions. Table 3.20: POLB Line Haul Locomotive Emission Estimates NO x TOG CO PM 10 PM 2.5 DPM SO 2 Emission rates, lb/hr Totals (tpy) Totals (tpd) Starcrest Consulting Group, LLC 77 March 2004
 activities and emissions are included. Section 4.1 describes HDV types and methods of operation, Section 4.")
87 SECTION 4 HEAVY-DUTY VEHICLES This section discusses heavy-duty diesel vehicle (HDV) operations and emissions as they relate to POLB terminals. As noted in Section 1.2, on-terminal and on-road (off-terminal) activities and emissions are included. Section 4.1 describes HDV types and methods of operation, Section 4.2 provides further detail on the emission estimating methodology, and Section 4.3 presents the emission estimates for this source category. 4.1 HDV Types and Activity The ARB categorizes HDVs into three groups: light, medium, and heavy HDVs. These categories are based on the gross vehicle weight rating (GVWR) of the truck, including its trailer if so equipped. Light HDV: 10,000 to 14,000 pounds Medium HDV: 14,000 to 33,000 pounds Heavy HDV: over 33,000 pounds This report deals exclusively with diesel-fueled HDVs, as there are few, if any, gasolinefueled counterparts. The most common configuration of HDV is the articulated tractortrailer (truck and semi-trailer) having five axles, including the trailer axles. The most common type of trailer in the study area is the container trailer, built to accommodate standard-sized cargo containers. Additional trailer types include tankers, boxes, and flatbeds. A tractor traveling without an attached trailer is called a bobtail. A tractor pulling an unloaded container trailer chassis is known simply as a chassis. These vehicles are all classified as heavy HDVs regardless of their actual weight because the classification is based on GVWR, which is a rating of the vehicle s total carrying capacity. Therefore, the emission estimates do not distinguish among the different configurations. As examples, Figure 4.1 shows a container truck transporting a container in a terminal, and Figure 4.2 shows a bobtail. Figure 4.1: Truck with Container Starcrest Consulting Group, LLC 78 March 2004

88 Figure 4.2: Bobtail Truck For this emissions inventory, HDV activity has been divided into two components: On-terminal operations, including waiting for terminal entry, transiting the terminal to drop off and/or pick up cargo, and departing the terminals. On-road operations, consisting of travel on public roads within the port boundaries. While the wait at a terminal s gate may, at least in part, occur off the terminal operator s property, the emissions have been included with on-terminal emissions because the gate wait time is closely related to other terminal operations. These vehicles are all classified as heavy HDVs regardless of their actual weight because the classification is based on GVWR, which is a rating of the vehicle s total carrying capacity. Therefore, the emission estimates do not distinguish among the different configurations. 4.2 Methodology This section discusses how the data was acquired and how the emission estimates were developed based on the data collected Data Collection Data for the HDV emission estimates came from three basic sources: terminal interviews, idle time modeling, and modeling of on-road HDV volumes, distances, and speeds. Starcrest Consulting Group, LLC 79 March 2004
89 Terminal Interviews The project team collected information regarding on-terminal truck activity during in-person and telephone interviews with terminal personnel. This information included their gate operating schedules, on-terminal speeds, time and distance traveled on terminal while dropping off and/or picking up loads, and time spent idling at the entry and exit gates. Most terminals were able to provide estimates of these activity parameters, although few keep detailed records of information such as gate wait times and on-terminal turn-around time. However, the reported values appear to be reasonable and have been used in estimating on-terminal emissions, except as noted in the following text. Table 4.1 illustrates the reported characteristics of on-terminal truck activities at POLB container terminals in terms of average, maximum, and minimum values. Table 4.1: Terminal Operating Characteristics Load / Hrs/day Speed Distance Annual Gate In Unload Gate Out (mph) (miles) Trips (hrs) (hrs) (hrs) Average , Maximum Minimum Total 3,225,446 Idle Time Modeling Estimates of container terminal gate idling emissions were developed for the time trucks spend idling while waiting to reach the container terminal gates. These idle times are currently lower than in the study year (2002) because of the introduction of an idling limitation law that limits the amount of time trucks are allowed to wait for terminal entry (AB 2650). The POLB retained M&N to estimate pre-ab 2650 terminal-gate wait times. To do this, M&N used a computer simulation model they have previously used for the POLB in similar traffic-related studies, designed to estimate terminal throughput and traffic volumes. One feature of this model is an estimate of truck idling time, based on terminal operating parameters such as gate schedule, container throughput, and import vs export percentage. The model is designed to run on a monthly basis, and the highest monthly throughput for 2002 was used as the throughput input for each terminal, ensuring that idling times were not underestimated. Starcrest Consulting Group, LLC 80 March 2004
90 The average idling time estimated by the model for the container terminals was 14.2 minutes per truck visit, with a range from 12.3 minutes to 16.4 minutes. The terminal-specific idling time for each terminal was used with the idling emission factors from EMFAC2002 (discussed below) to estimate container terminal gate idling emissions. Idling emissions from trucks waiting for entry into other terminals (non-container terminals) were estimated on the basis of information provided by the terminals. Further details on gate idling emissions are presented in Appendix C. On-Road HDV Modeling The POLB retained MMA to develop estimates of on-road truck activity within the POLB Harbor District. MMA used trip generation and travel demand models they have used in a previous POLB transportation study 20 to estimate the volumes (number of trucks) and average speeds on port roadway segments between defined intersections. The trip generation model was derived from the terminal operation/throughput model discussed above, which had been developed by M&N, who were team members on the transportation study. MMA developed and validated the trip generation model using data obtained through traffic counts and driver surveys. MMA reported in the traffic study report that the model validation confirmed that the model was able to predict truck movement to within 5 to 10 percent of actual truck counts for all the container terminals combined, and to within 15 percent or better for the majority of individual terminals. (MMA, 2001) These were considered to be excellent validation results considering the variability of operating conditions and actual gate counts on any given day. The results of the trip generation model were input to a port-area travel demand model also developed by MMA. This model was developed as an offshoot of the regional model used for transportation planning by the Southern California Association of Governments (SCAG), the federally designated Metropolitan Planning Organization for the Los Angeles area. MMA incorporated port-specific truck travel information from the trip generation model, as well as the results of an origin/destination survey of approximately 3,300 port-area truck drivers, into the port-area travel demand model. The travel demand model produced estimates of truck traffic volumes and speeds over defined port roadway segments. These estimates are reproduced in Appendix C. The traffic volumes and distances were combined to produce estimates of vehicle miles of travel (VMT), which in turn were used with the speed-specific EMFAC 2002 emission factors to estimate on-road driving emissions. 20 Meyer, Mohaddes Associates, Inc., June Ports of Long Beach/Los Angeles Transportation Study. Starcrest Consulting Group, LLC 81 March 2004
91 4.2.2 Emissions Estimation The general form of the equation for estimating vehicle emissions is: where: E = EF * A E = emissions EF = emission factor A = activity There are two types of HDV activity: engine running with vehicle moving at a given speed, and engine idling with vehicle at rest. Running emission factors are expressed in terms of grams per mile (g/mi) while idling emission factors are expressed in terms of grams per hour (g/hr). Therefore, the activity measure used for estimating running emissions is miles (VMT) and the activity measure used for estimating idling emissions is hours. The emission factor (g/mi or g/hr) is multiplied by the activity measure (VMT or hours) to estimate grams of emissions. The time period covered by the emission estimate corresponds to the time period of the activity measure. For example, an annual VMT figure (miles per year) multiplied by a g/mi emission factor results in a gram-per-year emission estimate. The ARB and EPA have developed computer models that calculate emission factors for fleets of vehicles. The EMFAC model has EPA approval for use in California, whereas the MOBILE6 22 model is used in the other 49 states. Because these models estimate emission factors, the actual emission calculations (emission factor multiplied by activity measure) are carried out using custom-designed spreadsheets. 21 California ARB, EMFAC2002, See EMFAC2002 is the emission factor model approved by EPA for use in estimating emissions for on-road vehicles in California; it is not approved for off-highway CHE or for emissions outside California. 22 EPA, MOBILE6, See MOBILE6 is an emission factor model for predicting gram per mile emissions of HC, CO, NOx, carbon dioxide (CO 2 ), PM, and toxics from cars, trucks, and motorcycles under various conditions. Starcrest Consulting Group, LLC 82 March 2004
92 The EMFAC2002 model was used for this study. The model contains three different output options: BURDEN EMFAC CALIMFAC Of the three options, EMFAC was deemed to be the most appropriate tool for this emissions inventory. The BURDEN option is more appropriate as an agency tool for planning inventories based on a standard population of vehicles, with little control over applying emission factors, while the CALIMFAC option is not currently suitable for a diesel-only vehicle population. (It assumes that a certain percentage of vehicles are gasoline fueled.) The model year distribution of the fleet of trucks operating at the POLB was developed by ARB and SCAQMD, who ran license plate numbers provided by several POLB and POLA terminals through the California DMV registration database. Over 7,000 license plate numbers were included in this study. Model years ranged from 1958 to The distribution is graphically depicted in Figure 4.3 below. Appendix C includes more detail on the model year distribution, including a comparison of the port-specific distribution illustrated in Figure 4.3 with the default EMFAC vehicle age distribution. Starcrest Consulting Group, LLC 83 March 2004
93 Figure 4.3: Model Year Distribution 10% 9% 8% 7% Percent of Fleet 6% 5% 4% 3% 2% 1% 0% Model Year The EMFAC2002 model was configured for this study to estimate emission factors by speed bin where each bin represents a five mph increment between zero (idling) and 65 mph. Therefore, for example, if there are speeds between 5 and 10 mph, the output for the 10 mph bin would be used to estimate emissions. As most on-terminal speeds are 15 mph, only three bins would be needed for this group (i.e., 1-5 mph, 6-10 mph, mph); however, as on-road speeds within the Harbor District are higher, those speeds are also needed. The highest average speed output by the model is 65 mph, so modeled or observed speeds over that limit were effectively capped at the 65 mph level. Technical inputs to the EMFAC model include selections for: Los Angeles County 2002 annual emissions EMFAC model Program constants edited for: o Addition of zero mph speed bin for idling o Population by vehicle and fuel type Model results were output in rich text language (RTL) format that allowed them to be imported into Microsoft Excel. Extracts from the results relating to diesel HDVs were copied into the calculation spreadsheet. Starcrest Consulting Group, LLC 84 March 2004
94 The emission factors in grams per hour (for idling) and grams per mile (for driving) calculated by the EMFAC2002 model are presented in Table 4.2. Note that the same suite of emission factors was used for on-terminal on-road activities. Speeds over 65 mph are not available in the EMFAC model. Table 4.2: EMFAC Output for HDV Speed, mph TOG CO NO X SO 2 PM Emission Estimates A summary of HDV emission estimates for the year 2002 is presented in Table 4.3. Estimated HDV emissions are compared with estimated port-wide emissions in Figure 4.4. A more detailed breakdown of the components of these emission totals is provided in the remainder of this section. Table 4.3: Summary of POLB Highway HDV Emission Estimates Emission Component NO x TOG CO PM 10 PM 2.5 DPM SO 2 On Terminal Travel On Terminal Idling Container Term. Gate Idling On-Road Travel Totals (tpy) Totals (tpd) Starcrest Consulting Group, LLC 85 March 2004
95 Figure 4.4: Comparison of HDV Emissions with Port-Wide Emissions, tpy 3,500 3,000 2,500 2,000 1,500 1, NOx TOG CO PM10 PM2.5 DPM SO2 HDV Total On-Terminal Results The emission estimates for on-terminal driving and idling are shown in Table 4.4. The on-terminal idling includes idling emissions from trucks waiting at gates of terminals other than container terminals. Gate idling emissions for container terminals are included in Table 4.5. Table 4.4: POLB On-Terminal HDV Emission Estimates Emission NO x TOG CO PM 10 PM 2.5 DPM SO 2 Component Travel Idling Totals (tpy) Totals (tpd) Starcrest Consulting Group, LLC 86 March 2004
96 Table 4.5: Container Terminal Gate Queue Emission Estimates POLB Baseline EI NO x TOG CO PM 10 PM 2.5 DPM SO 2 Totals (tpy) Totals (tpd) As discussed above, modeled estimates of the amount of time trucks spent idling at container terminal gates were used to estimate gate queue idling emissions. Average daily emissions from on-terminal operations were estimated by dividing the annual estimates by 365 (days per year) On-Road Results The MMA data includes approximately 1,024 highway trips by road segment during the morning rush hour (AM), midday (MD), evening rush hour (PM), and overnight (NT) periods. The on-road emission estimates results are summarized in Table 4.6 below. Table 4.6: POLB On-Road Emission Estimates Period NO x TOG CO PM 10 PM 2.5 DPM SO 2 AM MD PM NT Totals (tpy) Totals (tpd) Unlike the on-terminal HDV emission estimates that are based on annual data, onroad emissions were estimated based on average weekday activity (Monday-Friday), and then summed to produce annual totals. It should be noted that weekend traffic volumes were not included in the MMA modeling. While many terminals report being open on weekends, their levels of activity are reported to be lower, in terms of hours of operation and/or vehicle throughput. Therefore, basing annual estimates on 365 days per year may somewhat overstate annual emissions. This issue is addressed in Section 5, Conclusions. Starcrest Consulting Group, LLC 87 March 2004
97 SECTION 5 CONCLUSIONS As with any endeavor of this nature, there are strengths and limitations, as well as opportunities for improvement. This section provides a discussion of these. 5.1 Strengths A significant strength of this study is that Port of Long Beach and their consultant held regular discussions with ARB, SCAQMD, and EPA personnel regarding the scope of the study, the emission estimating protocols that were followed, and project status. These discussions also usually included personnel of the Port of Los Angeles, who were developing their own port-wide EI. The close involvement by regulatory authorities and coordination with the neighboring port have helped to ensure that the most appropriate and approvable methods have been used in the development of this EI. Another significant strength of this emissions inventory lies in the cooperation and work of the many individuals who provided knowledge and information regarding the cargo handling and transport operations at the Port of Long Beach. Additional strengths include: During the course of the project, the port s consultants visited or evaluated all of the Port terminals, and interviewed the terminal operators. This type of resource investment increases the accuracy of the data obtained, and thus of the emission estimates. The extensive 2002 cargo handling equipment inventory provided by the Port s tenants resulted in a detailed set of emission estimates. The level of detail provided by the terminal operators allowed the Port s consultant and the ARB to use the OFFROAD model with a large amount of site-specific information, such as equipment age, horsepower ratings, and annual hours of use, substituting for the more general OFFROAD default values. A considerable amount of information was provided by the Port area switching railroad and, as a result, the emission estimates seem to be fairly robust. A crosscheck, detailed in the text, between estimated fuel usage based on activity assumptions and the railroads reported monthly fuel consumption agree to within 14%, indicating that assumptions about activities and locomotive operating characteristics are close to the mark. All of the railroads provided information that has been useful in developing the emission estimates, and all seem interested in providing additional data as their time and resources permit. The development and use of a site-specific diesel truck model year distribution from actual license plate records from POLB and POLA terminals for the HDV emissions inventory enhanced the site-specificity of the EMFAC model used to estimate onroad truck emission factors. Starcrest Consulting Group, LLC 88 March 2004
98 The incorporation of modeling information from local transportation planning companies having specific experience with POLB traffic modeling for off-terminal truck driving activity and idling times helped to maintain consistency between different elements of the Port s planning operations (e.g., environmental and transportation planning functions). 5.2 Limitations There are also limitations to a study such as this one, since there are always opportunities to continue to enhance data precision and accuracy. Limitations to this study include: A key component of the CHE emission calculations is the annual activity (hours of operation) of the equipment. This variable is used in two places in the emission calculations. One of these is the basic equation presented in subsection 2.2.2: E = EF*HP*LF*Act*FCF, where Act is the annual hours of operation. The other is in the calculation of the deterioration factor that is added to the base emission factor, also presented in subsection 2.2.2: EF = EF BASE + (DF*Act*Age). One limitation of this method is the assumption that a piece of equipment has operated the same number of hours over its lifetime when, in fact, annual usage for any particular piece of equipment may vary. Another limitation with regard to the CHE emission estimates relates to the deterioration factor equation this equation assumes that the emission increase due to deterioration continues in a linear fashion for the life of the equipment. In equipment that is used intensively, such as much of the container terminals CHE, this may result in unrealistically high emission estimates. In order to maximize the use of their equipment and achieve the high utilization reported by the terminals (up to 4,000 hours per year for some equipment), the terminals have implemented effective maintenance programs that enable the equipment to operate for longer lifetimes that the typical off-road equipment fleets for which the OFFROAD model was developed. While the activity-based approach utilized for this emissions inventory helps to minimize uncertainties in such parameters as equipment population, activity, horsepower, and age, the emission factors and load factors are internal to the OFFROAD model and, thus, may not reflect the parameters of specific engines included in the Port terminals equipment fleets. In addition, the ARB s OFF- ROAD model is not publicly available. Therefore, the ARB ran the model using input provided by the authors. This limits the ability of third-party reviewers to reproduce the results using the data and methods presented in this report. The emission estimates for CHE developed using the OFF-ROAD model cannot be compared with CHE emission estimates for ports outside California because the ARB is the only state agency to use this model. (Other states use the EPA model NONROAD, which produces different results.) Starcrest Consulting Group, LLC 89 March 2004
99 The preferred approach to estimating locomotive emissions for this study was the use of throttle notch data, which was only obtained for in-port switching operations. Alternate methods were substituted where throttle notch data was not available. It would be preferable to base estimates of similar types of emissions on similar types of data. The railroad locomotive emissions inventory would have benefited from more detailed information from the line haul railroad companies. While both major railroads conducting line haul operations to and from the POLB provided information, more detail as to locomotive operating characteristics and activities could greatly increase the accuracy of the emission estimates. Emissions of SO 2 depend on the sulfur content of the fuel being burned. While fuel sulfur content information was solicited during the data collection for this EI, a more in-depth study would benefit the knowledge of local fuel sulfur content and improve the SO 2 emission estimates. Estimates of line haul locomotive emissions within the Port have been based on terminal throughput information, as well as train arrival and departure information that has been provided by the line haul railroads. The throughput information is quite good for the container terminals but less detailed for other types of terminals. However, an effort has been made to combine the quantitative nature of the throughput information with the more average or typical nature of the information provided by the railroads. The on-terminal HDV analysis is based on estimates of average time on terminal, which does not account for peaking, a phenomenon where queue lines could be longer than normal, thus potentially increasing idling times on the terminal. The on-road HDV traffic models were constructed as a function of Monday through Friday activity, and do not address weekend activity. Weekend HDV activity is less than weekday activity because terminal gate opening times are shorter, but there is HDV activity on weekends. Annual emission estimates have been based on weekday emissions occurring 7 days per week, which will over-estimate annual emissions to some extent. 5.3 Recommendations Since the inventory is based on information provided for calendar year 2002, any future updates will require careful evaluation of the recent changes in terminal alignment. It must also be remembered that terminals frequently update their equipment and move equipment from one terminal to another. Therefore, terminal expansions, relocations, and fluctuating activity levels need to be taken into consideration when attempting to extrapolate the results of this study to later periods. Changes in the CHE fleet as growth occurs should also be kept in mind, since container terminal activity is expected to grow, and future acquisitions could include alternatively fueled equipment, which could change the emissions profiles of the terminals. Starcrest Consulting Group, LLC 90 March 2004
100 With regard to CHE, there are several recommendations for future inventories: Work to clarify and refine the effect of deterioration on emissions, especially from high-usage equipment. This would include components such as o in-use testing, o evaluation of load factors, o developing a greater understanding of terminal operator maintenance practices. With regard to rail, recommended next steps include: Maintain and expand a dialogue with the railroads working in and around the Port (PHL, BNSF, UP) to improve our understanding of the complex operations of these railroads as they relate to Port cargo transportation, and to obtain more detailed information regarding these operations. Work with the railroads working in and around the Port to improve our knowledge about the fuels burned in local (switching) and transient (line haul) locomotives. Develop and implement an emission testing program to improve the emission factors by making them more specific to locomotives in use locally. Future effort with regard to HDVs should focus on temporal variability. For example: Levels of weekend vs weekday activity, both on-terminal and off-terminal. Seasonal variability of weekend activity (e.g., times of year when more terminals are open on weekends). More detailed evaluation of variability in on-terminal gate-in to gate-out times. Starcrest Consulting Group, LLC 91 March 2004
101 Port of Long Beach - Draft 2002 Baseline Emission Inventory Response to Agency Comments March 25, 2004 ATTACHMENT 1 AGENCY REVIEW COMMENTS AND RESPONSES The following table details the changes made to the draft Port of Long Beach 2002 Baseline Emission Inventory in response to comments received from the California Air Resources Board, the South Coast Air Quality Management District, and the U.S. EPA. The table lists each comment and a response, including a description of the change made to the document, if appropriate. Following this table are copies of the actual comments received from each of the three agencies. Starcrest Consulting Group, LLC 92 March 2004
102 Port of Long Beach - Draft 2002 Baseline Emission Inventory Response to Agency Comments No Section [Agency] Comment Response March 25, General [ARB General Comment 1] The categorization of cargo handling equipment by terminal is appropriate in that it groups equipment according to predictable and calculable operating cycles. This type of grouping should allow for more precise activity estimates, thereby improving the accuracy and localization of emissions estimates. No action required. 2 General [ARB General Comment 2] The report should include a list of emission sources within the Port of Long Beach boundaries that were not included in the report. This would include commercial ocean going vessels, commercial harbor craft, sources of toxics, and any others not included. Emission sources not included in the report are listed in Section 1 Introduction; specifically in Sections 1.1 Purpose & Scope and 1.2 General Methodology. 3 General [ARB General Comment 3] The report makes pertinent points concerning the differences between emissions based on the differences between activities at wheeled, grounded, and combination terminals. We would like to recommend that the POLB consider including a brief discussion about how the emission inventory would change if future growth results in changes in the current distribution of terminal types. Section 1.4 Terminal Configurations briefly discusses terminal changes in We agree that forecasting the effect of future changes to terminal activities would be a useful exercise, but it is beyond the scope of this inventory. 4 General [ARB General Comment 4] There is little discussion of the spatial allocation of emissions in the report. The ARB wants to reaffirm the Port s commitment to provide that information to the ARB. The ARB looks forward to receiving the data file containing the appropriate spatial allocation of the emission inventory for all three data sources in the document. Spatial allocation will be addressed in a separate document. 5 General [ARB General Comment 5] The report refers to the ARB s model as OFF-ROAD. The correct reference is OFFROAD. References to the model have been corrected to OFFROAD. Starcrest Consulting Group, LLC 93 March 2004
103 Port of Long Beach - Draft 2002 Baseline Emission Inventory Response to Agency Comments March 25, General [ARB General Comment 6] There are several areas in the report where there are discrepancies in the values reported. Examples include: A) In Figure 2.1, there are 9 total sweepers listed, 4 sweepers listed in Figure 2.8, none in Figure 2.2, and 10 listed in Appendix A. There are 6 total cranes listed in Figure 2.1 and 7 listed in Appendix A. B) In Figure 2.1, the total number of yard tractors is 566. When one adds the total numbers of yard tractors in Figures 2.2 and 2.8, the total number of yard tractors is 574. Similar discrepancies appear for forklifts, sweepers, top loaders, and other. The Appendix A table and Figures 2.1, 2.2 and 2.8 have been reconciled. Note that the figures reflect equipment by survey type (names in common usage), not OFFROAD equipment category. ARB staff realizes that these kinds of issues are difficult to resolve in any presentation of an emission inventory. As such, we recommend that the document be reviewed an additional time to attempt to eliminate as many of these types of discrepancies as possible from the document. 7 General [AQMD General Comment] The emission contribution from the Maersk Sealand APM Terminal has been included in the estimate for the POLB. Since these operations are now located in the POLA, is it possible to identify the emissions foregone due to the relocation. Do these emissions represent those from a new tenant occupying the vacated terminal? The emission estimates for Maersk Sealand represent their 2002 terminal operations at POLB Piers J and G, based on information provided by Maersk Sealand during the development of the EI. Those locations are now occupied by other terminal operators as discussed in Subsection 1.4 of the report. Emissions from equipment operated by the new tenants occurred after the period covered by this EI. Starcrest Consulting Group, LLC 94 March 2004
104 Port of Long Beach - Draft 2002 Baseline Emission Inventory Response to Agency Comments March 25, General [EPA General Comment 1] We believe by updating the 1999 South Coast Air Quality Management District Arcadis marine vessel inventory could be better developed, especially due to the fact that the Arcadis report lack sufficient data for some categories (i.e., auxiliary engines and fishing vessel calculations). Also, we believe that updates to that inventory for oceangoing vessels calling on the ports and transiting vessels have increased dramatically, therefore updates to these activities also need to be better characterized, and would address some of the many uncertainties regarding marine diesel emissions. An update to the SCAQMD s marine vessel EI is beyond the scope of this project. Further, better inventory updates would support both the CARB and SCAQMD s efforts revising air quality attainment plans. Therefore, we believe a comprehensive reassessment of marine vessel emission inventory is needed. 9 General [EPA General Comment 2] US EPA looks to CARB and SCAQMD to provide detailed comments, especially on the POLB baseline emissions inventory methodology. No action required. 10 CHE, Section 2 [ARB CHE Comment 1] The last paragraph in section on page 43 of the draft report discusses techniques for estimating PM 2.5 from PM 10 and Total Organic Gas from Hydrocarbon. It references Subsection 1.6 of the report for a more detailed discussion of the rationale behind these techniques. This reference is incorrect and should instead be replaced with a reference to Subsection 1.5 Results. The correct reference to subsection 1.5 has been included in the revised version. Starcrest Consulting Group, LLC 95 March 2004
105 Port of Long Beach - Draft 2002 Baseline Emission Inventory Response to Agency Comments March 25, CHE, Section 2 [ARB CHE Comment 2] The report refers to the conversion of Hydrocarbon estimates to Total Organic Gas (TOG) estimates. Because the ARB staff provided TOG emission estimates, there should be no need for conversions. We now understand that the OFFROAD output labeled as HC was indeed TOG. The TOG emissions value and report wording have been revised accordingly. 12 CHE [ARB CHE Comment 3] The ARB, Starcrest, and the Port of Long Beach collectively agreed that the sulfur content should be 500 ppm. The last sentence of the first paragraph should be rewritten to reflect this fact. As currently written, it implies that the ARB directed the use of 500 ppm in the diesel calculations. The wording has been revised to clarify that the sulfur percentage was agreed among the parties involved. 13 CHE, Section 2 [ARB CHE Comment 4] The text on page 39 (under Table 2.5) states, ARB used a default model year. It should be revised to reflect that Starcrest suggested using the default model years and splitting up the unknown forklift model years into two groups. The wording has been revised to clarify the rationale for the model year choices. 14 CHE, Section 2 [ARB CHE Comment 5] An additional variable should be added to this equation for the fuel correction factor. E = EF * HP * LF * Act * FCF The variable FCF was added to the emissions equation. Where FCF = fuel correction factor (if applicable). Starcrest Consulting Group, LLC 96 March 2004
106 Port of Long Beach - Draft 2002 Baseline Emission Inventory Response to Agency Comments March 25, CHE, Section 2 [ARB CHE Comment 6] The last paragraph about uncapped deterioration should state that this is true only for equipment for which emission standards are not in effect. The discussion regarding the deterioration function has been substantially revised and broken out at the end of Subsection CHE, Section 2 [ARB CHE Comment 7] Starcrest suggested that yard tractors be classified as Off- Highway Trucks in the OFFROAD model. In the first paragraph on page 42, the text states, yard tractors retain their engines for up to 12 years, often exceeding their expected useful lives, as estimated by EPA and ARB, by three or four times, contradicts the OFFROAD model s estimate that the useful life of an off-highway truck of 10 years. The text needs to be revised to eliminate this discrepancy. This discussion has been revised as noted in the response above. 17 CHE, Section 2 [ARB CHE Comment 8] Also in the first paragraph on page 42, the last sentence implies that the OFFROAD model will produce higher emission estimates than the NONROAD model when estimating comparable fleets. Unless emissions from the POLB fleet have been estimated using both models, it is inappropriate to make that statement. This discussion has been revised as noted in the responses above. Nonetheless, the equipment fleet was evaluated using both models, with the results bearing out the statement made in the report. 18 CHE, Section 2 [ARB CHE Comment 9] Vehicles are driven off the vessels and onto the terminals. Evaporative and exhaust emissions from the 274,228 autos in 2002 should be estimated and included in the inventory. Emissions from the new automobiles have been estimated and are included in Section 2 of the revised report. Starcrest Consulting Group, LLC 97 March 2004
107 Port of Long Beach - Draft 2002 Baseline Emission Inventory Response to Agency Comments March 25, CHE, Section 2 [ARB CHE Comment 10] We recommend identifying all cases where horsepower and hours-of-use data gaps were filled using category averages. The revised appendix A CHE table indicates in bold type the hours and model year used to fill gaps. CHE, Section 2 [ARB CHE Comment 11] In some cases, the values set forth in the several tables and in Appendix A do not exactly match the ARB s estimates. The estimates match when given in grams per day for each terminal and equipment type, but the conversion to tons per day produces different values. Those differences do not appear to be due to rounding. For example, Table A.3 sums the total NOx for cranes to be ARB estimates the total NOx for cranes to be The differences arise from the adjustments made to account for terminals that did not operate for a full year during This is discussed in Subsection under the heading Model Output and in Appendix A. 20 CHE, Section 2 [ARB CHE Comment 12] There are discrepancies between the text associated with Figures 2.15 through The text refers to yard tractors and the figure refers to offhighway trucks. That discrepancy needs to be resolved. The figures have been revised to match the text in referring to equipment by survey name rather than OFFROAD category. 21 CHE, Section 2 [ARB CHE Comment 13] In the version the ARB was provided, there are 27 pages repeated in Appendix A. Pages A-4 thorough A-31 appear twice in the document. The duplicate pages should be removed. Duplicate pages were removed. 22 App A [ARB CHE Comment 14] The pagination of Appendix A appears to be incorrect. The document goes from A-31 to A-33 Page numbering was corrected. Starcrest Consulting Group, LLC 98 March 2004
108 Port of Long Beach - Draft 2002 Baseline Emission Inventory Response to Agency Comments March 25, CHE [AQMD CHE Comment] Breakout emissions separately for Cranes (i.e., RTGs and crawler cranes) and for Other Industrial Equipment (i.e., side picks, top picks, and reach stackers) rather than combining them. The OFFROAD model output provides emission estimates based on OFFROAD equipment categories. Therefore, the emissions for individual types of equipment within the OFFROAD source category cannot be separated. 24 Rail, General [ARB General Rail Comment] Upon initial review, overall this analysis appears to be a reasonable estimation of POLB locomotive emissions based on the information available to the authors. The comments below reflect corrections, areas where more explanation would be helpful, or areas where the analysis could be improved if the data is available. No action required. 25 Rail, Switch Method 1 [ARB Rail Comment 1] Time-in-notch data is based on two days of data and projected for the entire year. While it is preferable to use real data such as this, as opposed to just using the federal EPA switcher cycle, there is no information provided as to how representative these two days are. Are there daily, weekly, monthly, seasonal variations in operation? The authors note that the schedule of shifts is "well defined" however the length of the shifts, and thus the operation cycle, may vary. The POLB primary switcher operator may be able to provide insight as to how representative these two days are. The text has been revised to state that the switch operator represented the period as being representative of normal operations. Because throttle notch usage varies over a matter of seconds or minutes, longer-term variations in activity (e.g.., hours per day) would not be expected to change the frequency (percentage) of throttle notch positions. (As noted in the report, these locomotives are reported to be shut down when not in use.) Starcrest Consulting Group, LLC 99 March 2004
109 Port of Long Beach - Draft 2002 Baseline Emission Inventory Response to Agency Comments March 25, Rail Table 3.5 [ARB Rail Comment 2] The "average" emission factors provided in Table 3.5 do not appear to include the emission factor data from the federal Regulatory Support Document (RSD) for the switcher engine EMD C. However, the horsepower averages provided in the previous table (Table 3.4) do include this engine. Why is this engine left out? (Please see corresponding comment below regarding Appendix B, Table B-3.) The RSD dataset has been corrected as suggested in comment #40, and the revised factors have been incorporated into the emission estimates. 27 Rail, Switch Method 1 [ARB Rail Comment 3] In calculating SO2 (Table 3.6), the authors assume 350 ppm Sulfur fuel. There is no information provided regarding why 350 ppm S was assumed. While the sulfur content of fuel used in locomotives in California can be as low, or lower than, 350 ppm, locomotives can and are fueled with fuel that has a much higher sulfur content. Since these locomotives are captive in California, it is likely that the fuel is around 350 ppm S, however more explanation on this assumption would be helpful. What fuel is available at the ports? The switching railroad operating at the POLB reported they typically use low sulfur fuel, which is assumed to have an average sulfur content of 350 ppm. More in-depth study on the sulfur content of fuel used by all of the source categories evaluated by this emission inventory would be needed to resolve this issue. 28 Rail, 29 Rail, Switch Method 1 Switch Method 1 [ARB Rail Comment 4] It would be helpful if the authors provided the "POLB terminal" and "POLB switcher" emissions separately in Table [ARB Rail Comment 5] Some of the switcher locomotives at the Port of Long Beach are quite old. There is no indication as to whether some sort of deterioration curve was used to characterize emissions from these locomotives. It needs to be clearer as to how the emissions from the older locomotives were estimated. These emissions have been separately reported in the revised report. No deterioration curve was used in developing the switch engine emission estimates. Emission testing to establish a basis for such a curve would be useful but beyond the scope of this project. Starcrest Consulting Group, LLC 100 March 2004
110 Port of Long Beach - Draft 2002 Baseline Emission Inventory Response to Agency Comments March 25, Rail, 31 Rail, Switch Method 2 Switch Method 2 [ARB Rail Comment 6] The authors' analysis appears reasonable for the data that was available to them. [AQMD Rail Comment] The assumption that the locomotives have not been rebuilt to Tier 0 standards may not be accurate. This information may be verified by contacting rail operators, at least for the switch engines constantly operating at the ports. No action required. The assumption is that the locomotives have not been rebuilt to a newer standard, which would lower the emission factors. The text has been revised to clarify this. (Given that there is no discussion of deterioration rates in the source document, the emission factors for Tier 0 locomotives would be the same whether applied to an aged fleet or to one composed of engines that had been rebuilt to the Tier 0 level.) 32 Rail, Method 3 (Line Haul) [ARB Rail Comment 7] The authors' analysis appears reasonable for the data that was available to them. It would be beneficial if more detailed data is obtained during future emissions inventory updates. For instance, as is mentioned by the authors in the report, actual time-in-notch data would be helpful. Since the ports are at the beginning and end of the line-haul runs, it could be assumed that more time is spent in the DB and idle notches, and less at notch 8, than is represented by the federal EPA line-haul cycle which is used by the authors. No action required at this time. While it is true that incoming trains may spend relatively more time in lower throttle notch settings, it may be that departing trains use the higher notch settings more than typical to overcome inertia as they start to move. As suggested, more detailed data would help to clarify these issues. Rail (Line Haul) [AQMD Rail Comment] ARB estimates that the average sulfur content of locomotives fueled in California is about 350 ppm. The fuel sulfur content of out-of-state fueled locomotives such as line haul engines is much higher and should be considered to estimate SOx emissions. The fuel sulfur assumptions for line haul locomotives have been revised to include use of high-sulfur (3,500 ppm) fuel. Starcrest Consulting Group, LLC 101 March 2004
111 Port of Long Beach - Draft 2002 Baseline Emission Inventory Response to Agency Comments March 25, HDV [ARB HDV Comment ] There are distinctions made between the three sub-groups of heavy-duty vehicles, loaded, chassis, and bobtails. This information is provided, but then there appears to be no distinction between the emissions from each group. The text has been revised to state that the subgroups fall within the same weight category (heavy HDV), so the emission factors do not vary by subgroup. 34 HDV [AQMD HDV Comment] It appears that the EMFAC2002 idling NOx emission factor of 80.7 g/hr was used to estimate the idling emissions. This is the same emission factor used by the District to estimate idling emissions in the AQMP as well as Rule 1634, so it is consistent with our approach. No action required. 35 HDV [ARB HDV Comment] On page 86, the text refers to the BURDEN, EMFAC, and CALIMFAC output options as programs. That wording needs to be revised to identify the three as output options. This change has been made. 36 HDV [ARB HDV Comment] The paragraph on page 86 which begins, The main variables in the EMFAC model, is unnecessary. Temperature and humidity are irrelevant to the estimation of emissions from diesel-fueled engines. The referenced paragraph has been removed. 37 HDV [ARB HDV Comment] On page 87, it should be made clear that, in addition, the EMFAC2002 model can provide output for any speed specified between 0 and 65 miles per hour, as well as providing speed bin data. The text has been revised to explain that the speed bin approach is a feature of this study; the text no longer implies that this is the only output format. Starcrest Consulting Group, LLC 102 March 2004
112 Port of Long Beach - Draft 2002 Baseline Emission Inventory Response to Agency Comments March 25, App B [ARB Rail Comment] Table B-2: Unit 45 appears to be an anomaly (It was, for the most part, only run at idle), and likely not typical of operation. It is possible it should not be used. Unit 45 was included as part of the representation of a normal operating period for the fleet as a whole, which could include an occasional anomaly such a locomotive that was started but not used. Unit 45 has been included for that reason. (The effect of removing Unit 45 from the database would be a net change in the emission estimates of less than 1%.) 39 App B [ARB Rail Comment] Table B-2: Section 2 mentions 13 POLB switchers, but this table lists 15 units. Are the additional switchers those at the POLB terminal? 40 App B [ARB Rail Comment] Table B-3: For the EMD C, the g/bhp-hr emissions are incorrect (note: they are also incorrect in the federal RSD from which this information was obtained). For all notches, the g/hr data were incorrectly divided by the DB horsepower instead of by the corresponding notch horsepower. Table B-2 includes two additional switch engines that were included in the throttle notch data provided by the railroad. These engines were placed in service after the period covered by the emission inventory. The RSD dataset has been corrected as suggested and the emission estimates have been revised. The ARB recommends that this data be recalculated by multiplying the current values by the DB horsepower and then dividing that product by the notch horsepower. Starcrest Consulting Group, LLC 103 March 2004
113 Port of Long Beach - Draft 2002 Baseline Emission Inventory Response to Agency Comments March 25, App B [ARB Rail Comment] Table B-3: The "average" g/bhp-hr data do not match what is in Table 3.5. The "average" emission factors provided in Table 3.5 do not appear to include the emission factor data from the federal RSD for the switcher engine EMD C. However, the horsepower averages provided in the previous table (Table 3.4) do include this engine. Why is this engine left out? The averages in Table 3.5 did not include the factors attributed to the EMD C, for which incorrect data had been included in the RSD. The averages in Table B-3 did include the (incorrect) factors for this engine. These factors and tables have been reconciled with the correction of the RSD dataset. Starcrest Consulting Group, LLC 104 March 2004
114 (This page intentionally left blank)
115
116
117
118
119
120
121
122
123
124 (This page intentionally left blank)
125 COMMENTS RECEIVED FROM SCAQMD Tables 2-7, 2-8, 2-9, 2-10, and 2-11 Figures 2-15, 2-16, 2-17, 2-18, 2-19, 2-20, and 2-21 Breakout emissions separately for Cranes (i.e., RTGs and crawler cranes) and for Other Industrial Equipment (i.e., side picks, top picks, and reach stackers) rather than combining them. Page 77, second paragraph The assumption that the locomotives have not been rebuilt to Tier 0 standards may not be accurate. This information may be verified by contacting rail operators, at least for the switch engines constantly operating at the ports. Idling of On-Road Trucks It appears that the EMFAC2002 idling NOx emission factor of 80.7 g/hr was used to estimate the idling emissions. This is the same emission factor used by the District to estimate idling emissions in the AQMP as well as Rule 1634, so it is consistent with our approach. Maersk Sealand s Relocation The emission contribution from the Maersk Sealand APM Terminal has been included in the estimate for the POLB. Since these operations are now located in the POLA, is it possible to identify the emissions foregone due to the relocation. Do these emissions represent those from a new tenant occupying the vacated terminal? Sulfur Content of Locomotive Fuel ARB estimates that the average sulfur content of locomotives fueled in California is about 350 ppm. The fuel sulfur content of out-of-state fueled locomotives such as line haul engines is much higher and should be considered to estimate SOx emissions. Starcrest Consulting Group, LLC 105 March 2004
126 (This page intentionally left blank)
127 Draft US EPA Comments Port of Long Beach 2002 Baseline Emissions Inventory March 10, 2004 Thank you for the opportunity to comment on the Revised Draft 2002 Baseline Emissions Inventory. We appreciate the POLB efforts to improve port-wide mobile emissions data. We believe the report provided extensive documentation of port-wide mobile source baseline information. However, we believe the POLB should have updated the marine vessel emission inventory as well. The following are our main comments: 1) We believe by updating the 1999 South Coast Air Quality Management District Arcadis marine vessel inventory could be better developed, especially due to the fact that the Arcadis report lack sufficient data for some categories (i.e., auxiliary engines and fishing vessel calculations). Also, we believe that updates to that inventory for oceangoing vessels calling on the ports and transiting vessels have increased dramatically, therefore updates to these activities also need to be better characterized, and would address some of the many uncertainties regarding marine diesel emissions. Further, better inventory updates would support both the CARB and SCAQMD s efforts revising air quality attainment plans. Therefore, we believe a comprehensive reassessment of marine vessel emission inventory in needed. 2) US EPA looks to CARB and SCAQMD to provide detailed comments, especially on the POLB baseline emissions inventory methodology.
128 (This page intentionally left blank)
129 APPENDIX A CARGO HANDLING EQUIPMENT INVENTORY AND CALCULATIONS Starcrest Consulting Group, LLC A-1 March 2004
130 (This page intentionally left blank)
131 APPENDIX A TABLE OF CONTENTS Table A.1 Cargo Handling Equipment List...3 Table A.2 Cargo Handling Equipment Load Factor...32 Table A.3 NO x Emissions, Cranes and Crawler Tractors...33 Table A.4 NO x Emissions, Excavators and Forklifts...34 Table A.5 NO x Emissions, Off-Highway and Other General Industrial Equipment...35 Table A.6 NO x Emissions, Rubber Tired Loaders and Skid Steer Loaders...36 Table A.7 NO x Emissions, Sweepers...37 Table A.8 CO Emissions, Cranes and Crawler Tractors...38 Table A.9 CO Emissions, Excavators and Forklifts...39 Table A.10 CO Emissions, Off-Highway Trucks and Other General Industrial Equipment...40 Table A.11 CO Emissions, Rubber Tired Loaders and Skid Steer Loaders Table A.12 CO Emissions, Sweepers...42 Table A.13 HC Emissions, Cranes and Crawler Tractors...43 Table A.14 HC Emissions, Excavators and Forklifts...44 Table A.15 HC Emissions, Off-Highway Trucks and Other General Industrial Equipment45 Table A.16 HC Emissions, Rubber Tired Loaders and Skid Steer Loaders...46 Table A.17 HC Emissions, Sweepers...47 Table A.18 PM Emissions, Cranes and Crawler Tractors...48 Table A.19 PM Emissions, Excavators and Forklifts...49 Table A.20 PM Emissions, Off-Highway Trucks and Other General Industrial Equipment50 Table A.21 PM Emissions, Rubber Tired Loaders and Skid Steer Loaders Table A.22 PM Emissions, Sweepers...52 Table A.23 SO2 Emissions, Cranes and Crawler Tractors...53 Table A.24 SO 2 Emissions, Excavators and Forklifts...54 Table A.25 SO 2 Emissions, Off-Highway Trucks and Other General Industrial Equipment55 Table A.26 SO 2 Emissions, Rubber Tired Loaders and Skid Steer Loaders...56 Table A.27 SO 2 Emissions, Sweepers...57 Table A.28 LPG Forklift Emissions...58 Table A.30 Emissions by Terminal (tpd)...60 Starcrest Consulting Group, LLC A-2 March 2004
132 Table A.1 Cargo Handling Equipment List (Pages A-4 through A-36) Table A.1, pages A-4 through A-31, lists the cargo handling equipment (CHE) inventoried at the POLB facilities for the baseline year The ARB used this information as input into the OFFROAD model. For this appendix, the list was sorted by equipment type and each piece of equipment was given an arbitrary identification number (ID# in the first column of Table A.1). The second column is the equipment type name given by the facility inventoried. The third column is the OFFROAD equipment type which shows how each piece of equipment was categorized by ARB for OFFROAD model input. The equipment make and model, and engine make and engine model were given by the facilities interviewed. The space was left blank when the information was not known or given. The year column is the model year of the equipment. The HP column is the engine horsepower. The annual activity (hours) column is the 2002 annual hours for the equipment given by the facility operators. In most cases, this is an estimate of the average number of hours used in one year. Actual hours were used when known for the equipment annual activity. The last column is fuel type. Starcrest Consulting Group, LLC A-3 March 2004
133 Table A.1 Cargo Handling Equipment List Annual ID # Port Equip Type OFFROAD Equipment Equipment Engine Engine Model Year HP Activity Fuel LF Equipment Type Make Model (hours) Type LB001 Crane Cranes FMC Linkbelt HSP-8015 Detroit Diesel Diesel 0.43 LB002 Crane, Cable Cranes American 797-C Detroit Diesel ,000 Diesel 0.43 LB003 Crane, Cable Cranes American 797-C Detroit Diesel ,000 Diesel 0.43 LB004 Crane, Hydraulic Cranes Linkbelt LS5800C-II Isuzu 6 RB 1 T ,000 Diesel 0.43 LB005 Crane, Hydraulic Cranes Caterpillar 345MH Caterpillar ,000 Diesel 0.43 LB006 Crane, Hydraulic Cranes Caterpillar 345MH Caterpillar ,000 Diesel 0.43 LB007 Reach Stacker Cranes Taylor Cummins C 8.3-C (6 CT) ,000 Diesel 0.43 LB008 Reach Stacker Cranes Taylor Cummins C 8.3-C (6 CT) ,000 Diesel 0.43 LB009 Rubber-tired gantry crane Cranes Paceco LB Diesel 0.43 LB010 Rubber-tired gantry crane Cranes Paceco LB Diesel 0.43 LB011 Rubber-tired gantry crane Cranes Paceco ,664 Diesel 0.43 LB012 Rubber-tired gantry crane Cranes Paceco ,664 Diesel 0.43 LB013 Rubber-tired gantry crane Cranes Paceco ,664 Diesel 0.43 LB014 Rubber-tired gantry crane Cranes Paceco Cummins KTA ,664 Diesel 0.43 LB015 Rubber-tired gantry crane Cranes Paceco Cummins KTA ,664 Diesel 0.43 LB016 Rubber-tired gantry crane Cranes MIT-Paceco Cummins KTA ,664 Diesel 0.43 LB017 Rubber-tired gantry crane Cranes MIT-Paceco Cummins KTA ,664 Diesel 0.43 LB018 Rubber-tired gantry crane Cranes MIT-Paceco Cummins KTA ,664 Diesel 0.43 LB019 Rubber-tired gantry crane Cranes MIT-Paceco Cummins KTA ,664 Diesel 0.43 LB020 Rubber-tired gantry crane Cranes MIT-Paceco Cummins KTA ,664 Diesel 0.43 LB021 Rubber-tired gantry crane Cranes MIT-Paceco Cummins KTA ,664 Diesel 0.43 LB022 Rubber-tired gantry crane Cranes MIT-Paceco Cummins KTA ,664 Diesel 0.43 LB023 Rubber-tired gantry crane Cranes MIT-Paceco Cummins KTA ,664 Diesel 0.43 LB024 Rubber-tired gantry crane Cranes MIT-Paceco Cummins KTA ,664 Diesel 0.43 LB025 Rubber-tired gantry crane Cranes Detroit Diesel Diesel 0.43 LB026 Rubber-tired gantry crane Cranes Detroit Diesel Diesel 0.43 LB027 Rubber-tired gantry crane Cranes Detroit Diesel ,442 Diesel 0.43 LB028 Rubber-tired gantry crane Cranes Detroit Diesel ,572 Diesel 0.43 LB029 Rubber-tired gantry crane Cranes Detroit Diesel ,148 Diesel 0.43 LB030 Rubber-tired gantry crane Cranes Detroit Diesel ,991 Diesel 0.43 LB031 Rubber-tired gantry crane Cranes Detroit Diesel ,433 Diesel 0.43 LB032 Rubber-tired gantry crane Cranes Detroit Diesel ,088 Diesel 0.43 LB033 Rubber-tired gantry crane Cranes Cummins KTA 19 GP ,660 Diesel 0.43 LB034 Rubber-tired gantry crane Cranes Cummins KTA 19 GP ,751 Diesel 0.43 LB035 Rubber-tired gantry crane Cranes Cummins KTA 19 GP ,211 Diesel 0.43 LB036 Rubber-tired gantry crane Cranes Krupp 40 LT Detroit Diesel ,248 Diesel 0.43 LB037 Rubber-tired gantry crane Cranes Krupp 40 LT Detroit Diesel ,248 Diesel 0.43 LB038 Rubber-tired gantry crane Cranes Krupp 40 LT Detroit Diesel ,248 Diesel 0.43 LB039 Rubber-tired gantry crane Cranes Paceco 40 LT Detroit Diesel ,560 Diesel 0.43 Starcrest Consulting Group, LLC A-4 March 2004
134 Table A.1 Cargo Handling Equipment List (contd) Annual ID # Port Equip Type OFFROAD Equipment Equipment Engine Engine Model Year HP Activity Fuel LF Equipment Type Make Model (hours) Type LB040 Rubber-tired gantry crane Cranes Paceco 40 LT Detroit Diesel ,560 Diesel 0.43 LB041 Rubber-tired gantry crane Cranes ZPMC RC50.8/66 Caterpillar 2WJ1-UP ,496 Diesel 0.43 LB042 Rubber-tired gantry crane Cranes ZPMC RC50.8/66 Caterpillar 2WJ1-UP ,496 Diesel 0.43 LB043 Rubber-tired gantry crane Cranes ZPMC RC50.8/66 Caterpillar 2WJ1-UP ,496 Diesel 0.43 LB044 Rubber-tired gantry crane Cranes ZPMC RC50.8/66 Caterpillar 2WJ1-UP ,496 Diesel 0.43 LB045 Rubber-tired gantry crane Cranes Krupp 40 LT Detroit Diesel ,248 Diesel 0.43 LB046 Rubber-tired gantry crane Cranes ZPMC RC50.8/66 Caterpillar 2WJ1-UP ,496 Diesel 0.43 LB047 Rubber-tired gantry crane Cranes ZPMC RC50.8/66 Caterpillar 2WJ1-UP ,496 Diesel 0.43 LB048 Rubber-tired gantry crane Cranes ZPMC RC50.8/66 Caterpillar 2WJ1-UP ,496 Diesel 0.43 LB049 Rubber-tired gantry crane Cranes ZPMC RC50.8/66 Caterpillar 2WJ1-UP ,496 Diesel 0.43 LB050 Rubber-tired gantry crane Cranes ZPMC RC50.8/66 Caterpillar 2WJ1-UP ,496 Diesel 0.43 LB051 Rubber-tired gantry crane Cranes Paceco Detroit Diesel ,040 Diesel 0.43 LB052 Rubber-tired gantry crane Cranes Paceco Detroit Diesel ,040 Diesel 0.43 LB053 Rubber-tired gantry crane Cranes ZPMC Cummins KTA 19 G Diesel 0.43 LB054 Rubber-tired gantry crane Cranes ZPMC Cummins KTA 19 G Diesel 0.43 LB055 Rubber-tired gantry crane Cranes ZPMC Cummins KTA 19 G Diesel 0.43 LB056 Rubber-tired gantry crane Cranes ZPMC Cummins KTA 19 G Diesel 0.43 LB057 Rubber-tired gantry crane Cranes ZPMC Cummins KTA 19 G ,650 Diesel 0.43 LB058 Rubber-tired gantry crane Cranes ZPMC Cummins KTA 19 G ,650 Diesel 0.43 LB059 Rubber-tired gantry crane Cranes Paceco/ZPMC ,100 Diesel 0.43 LB060 Rubber-tired gantry crane Cranes Paceco/ZPMC ,100 Diesel 0.43 LB061 Rubber-tired gantry crane Cranes Paceco/ZPMC ,100 Diesel 0.43 LB062 Rubber-tired gantry crane Cranes Paceco/ZPMC ,100 Diesel 0.43 LB063 Rubber-tired gantry crane Cranes Paceco/ZPMC ,100 Diesel 0.43 LB064 Rubber-tired gantry crane Cranes Paceco/ZPMC ,100 Diesel 0.43 LB065 Rubber-tired gantry crane Cranes Paceco/ZPMC ,100 Diesel 0.43 LB066 Rubber-tired gantry crane Cranes Paceco/ZPMC ,100 Diesel 0.43 LB067 Rubber-tired gantry crane Cranes Paceco/ZPMC ,100 Diesel 0.43 LB068 Rubber-tired gantry crane Cranes Paceco/ZPMC ,100 Diesel 0.43 LB069 Rubber-tired gantry crane Cranes Paceco/ZPMC ,100 Diesel 0.43 LB070 Rubber-tired gantry crane Cranes Paceco/ZPMC ,100 Diesel 0.43 LB071 Rubber-tired gantry crane Cranes Paceco/ZPMC ,100 Diesel 0.43 LB072 Rubber-tired gantry crane Cranes Paceco/ZPMC ,100 Diesel 0.43 LB073 Rubber-tired gantry crane Cranes Paceco/ZPMC ,100 Diesel 0.43 LB074 Rubber-tired gantry crane Cranes Paceco/ZPMC ,100 Diesel 0.43 LB075 Rubber-tired gantry crane Cranes Mitsubishi Cummins NTA ,280 Diesel 0.43 LB076 Rubber-tired gantry crane Cranes Mitsubishi Cummins NTA ,280 Diesel 0.43 LB077 Rubber-tired gantry crane Cranes Mitsubishi Cummins NTA ,280 Diesel 0.43 LB078 Rubber-tired gantry crane Cranes Mitsubishi Cummins NTA ,280 Diesel 0.43 Starcrest Consulting Group, LLC A-5 March 2004
135 Table A.1 Cargo Handling Equipment List (contd) Annual ID # Port Equip Type OFFROAD Equipment Equipment Engine Engine Model Year HP Activity Fuel LF Equipment Type Make Model (hours) Type LB079 Rubber-tired gantry crane Cranes Mitsubishi Cummins NTA ,280 Diesel 0.43 LB080 Rubber-tired gantry crane Cranes Mitsui Cummins TA855G ,280 Diesel 0.43 LB081 Rubber-tired gantry crane Cranes Mitsui Cummins GL855G ,280 Diesel 0.43 LB082 Rubber-tired gantry crane Cranes Mitsui Cummins GL855G ,280 Diesel 0.43 LB083 Rubber-tired gantry crane Cranes Mitsui Cummins GL855G ,280 Diesel 0.43 LB084 Rubber-tired gantry crane Cranes Mitsui Cummins GL855G ,280 Diesel 0.43 LB085 Rubber-tired gantry crane Cranes Mitsui Cummins GL855G ,280 Diesel 0.43 LB086 Rubber-tired gantry crane Cranes Mitsui Cummins GL855G ,280 Diesel 0.43 LB087 Rubber-tired gantry crane Cranes ZPMC Cummins KTA ,280 Diesel 0.43 LB088 Rubber-tired gantry crane Cranes ZPMC Cummins KTA ,280 Diesel 0.43 LB089 Dozer Crawler Tractors Caterpillar D6H Caterpillar Diesel 0.64 LB090 Dozer Crawler Tractors Caterpillar D8N Caterpillar Diesel 0.64 LB091 Excavator Excavators Caterpillar 350L Caterpillar ,500 Diesel 0.57 LB092 Excavator Excavators Caterpillar 345BL Caterpillar ,000 Diesel 0.57 LB093 Excavator Excavators Caterpillar 345BL Caterpillar ,000 Diesel 0.57 LB094 Forklift Forklifts Hyster H330B Detroit Diesel ,000 Diesel 0.3 LB095 Forklift Forklifts Hyster Perkins ,000 Diesel 0.3 LB096 Forklift Forklifts Mitsubishi Mitsubishi ED Diesel 0.3 LB097 Forklift Forklifts Mitsubishi Mitsubishi ED Diesel 0.3 LB098 Forklift Forklifts Mitsubishi Mitsubishi ED Diesel 0.3 LB099 Forklift Forklifts Mitsubishi Mitsubishi ED Diesel 0.3 LB100 Forklift Forklifts Mitsubishi Mitsubishi ED Diesel 0.3 LB101 Forklift Forklifts Caterpillar Caterpillar ,376 LPG 0.3 LB102 Forklift Forklifts White Perkins Diesel 0.3 LB103 Forklift Forklifts White Perkins Diesel 0.3 LB104 Forklift Forklifts White Perkins Diesel 0.3 LB105 Forklift Forklifts White Perkins Diesel 0.3 LB106 Forklift Forklifts Hyster Perkins Diesel 0.3 LB107 Forklift Forklifts Hyster Perkins Diesel 0.3 LB108 Forklift Forklifts Hyster Perkins Diesel 0.3 LB109 Forklift Forklifts Wiggins Cummins Diesel 0.3 LB110 Forklift Forklifts Wiggins Cummins C 5.9-C (6 BT, 6 BTA) Diesel 0.3 LB111 Forklift Forklifts Wiggins Cummins C 5.9-C (6 BT, 6 BTA) Diesel 0.3 LB112 Forklift Forklifts Wiggins Cummins C 5.9-C (6 BT, 6 BTA) Diesel 0.3 LB113 Forklift Forklifts Wiggins Cummins C 5.9-C (6 BT, 6 BTA) Diesel 0.3 LB114 Forklift Forklifts Wiggins Cummins C 5.9-C (6 BT, 6 BTA) Diesel 0.3 LB115 Forklift Forklifts Kalmar Volvo TD Diesel 0.3 LB116 Forklift Forklifts Kalmar Volvo TD Diesel 0.3 LB117 Forklift Forklifts Kalmar Volvo TD Diesel 0.3 Starcrest Consulting Group, LLC A-6 March 2004
136 Table A.1 Cargo Handling Equipment List (contd) Annual ID # Port Equip Type OFFROAD Equipment Equipment Engine Engine Model Year HP Activity Fuel LF Equipment Type Make Model (hours) Type LB118 Forklift Forklifts Kalmar Volvo TD Diesel 0.3 LB119 Forklift Forklifts Kalmar Volvo TD Diesel 0.3 LB120 Forklift Forklifts Kalmar Volvo TD Diesel 0.3 LB121 Forklift Forklifts Wiggins Cummins C 5.9-C (6 BT, 6 BTA) Diesel 0.3 LB122 Forklift Forklifts Wiggins Cummins C 5.9-C (6 BT, 6 BTA) Diesel 0.3 LB123 Forklift Forklifts Wiggins Cummins C 5.9-C (6 BT, 6 BTA) Diesel 0.3 LB124 Forklift Forklifts Wiggins Cummins C 5.9-C (6 BT, 6 BTA) Diesel 0.3 LB125 Forklift Forklifts Wiggins Cummins C 5.9-C (6 BT, 6 BTA) Diesel 0.3 LB126 Forklift Forklifts Wiggins Cummins C 5.9-C (6 BT, 6 BTA) Diesel 0.3 LB127 Forklift Forklifts Wiggins Cummins C 5.9-C (6 BT, 6 BTA) Diesel 0.3 LB128 Forklift Forklifts Wiggins Cummins C 5.9-C (6 BT, 6 BTA) Diesel 0.3 LB129 Forklift Forklifts Wiggins Cummins C 5.9-C (6 BT, 6 BTA) Diesel 0.3 LB130 Forklift Forklifts Wiggins Cummins C 5.9-C (6 BT, 6 BTA) Diesel 0.3 LB131 Forklift Forklifts Wiggins Cummins C 5.9-C (6 BT, 6 BTA) Diesel 0.3 LB132 Forklift Forklifts Wiggins Cummins C 5.9-C (6 BT, 6 BTA) ,525 Diesel 0.3 LB133 Forklift Forklifts Kalmar Volvo TD Diesel 0.3 LB134 Forklift Forklifts Kalmar Volvo TDC 100 G Diesel 0.3 LB135 Forklift Forklifts Mitsubishi Mitsubishi 6D ,700 Diesel 0.3 LB136 Forklift Forklifts Mitsubishi Mitsubishi 6D ,700 Diesel 0.3 LB137 Forklift Forklifts Mitsubishi Mitsubishi 6D ,700 Diesel 0.3 LB138 Forklift Forklifts Mitsubishi Mitsubishi 6D ,700 Diesel 0.3 LB139 Forklift Forklifts Mitsubishi FD 150 Mitsubishi 6D Diesel 0.3 LB140 Forklift Forklifts Mitsubishi FD 150 Mitsubishi 6D Diesel 0.3 LB141 Forklift Forklifts Mitsubishi FD 150 Mitsubishi 6D Diesel 0.3 LB142 Forklift Forklifts Mitsubishi FD 150 Mitsubishi 6D Diesel 0.3 LB143 Forklift Forklifts Mitsubishi FD 150 Mitsubishi 6D Diesel 0.3 LB144 Forklift Forklifts Mitsubishi FD 150 Mitsubishi 6D Diesel 0.3 LB145 Forklift Forklifts Mitsubishi FD 150 Mitsubishi 6D Diesel 0.3 LB146 Forklift Forklifts Mitsubishi FD 150 Mitsubishi 6D Diesel 0.3 LB147 Forklift Forklifts Mitsubishi FD 150 Mitsubishi 6D Diesel 0.3 LB148 Forklift Forklifts Mitsubishi FD 150 Mitsubishi 6D Diesel 0.3 LB149 Forklift Forklifts Mitsubishi FD 150 Mitsubishi 6D Diesel 0.3 LB150 Forklift Forklifts Mitsubishi FD 150 Mitsubishi 6D Diesel 0.3 LB151 Forklift Forklifts Mitsubishi FD 150 Mitsubishi 6D Diesel 0.3 LB152 Forklift Forklifts Mitsubishi FD 150 Mitsubishi 6D Diesel 0.3 LB153 Forklift Forklifts Taylor TE300 Detroit Diesel Diesel 0.3 LB154 Forklift Forklifts Taylor TE300 Detroit Diesel Diesel 0.3 LB155 Forklift Forklifts Taylor TE300 Detroit Diesel Diesel 0.3 LB156 Forklift Forklifts Taylor TE300 Detroit Diesel ,040 Diesel 0.3 Starcrest Consulting Group, LLC A-7 March 2004
137 Table A.1 Cargo Handling Equipment List (contd) Annual ID # Port Equip Type OFFROAD Equipment Equipment Engine Engine Model Year HP Activity Fuel LF Equipment Type Make Model (hours) Type LB157 Forklift Forklifts Taylor TE300 Cummins C 5.9-C ,250 Diesel 0.3 LB158 Forklift Forklifts Taylor TE300 Cummins C 5.9-C ,250 Diesel 0.3 LB159 Forklift Forklifts Hyster 300S Cummins C 5.9-C ,660 Diesel 0.3 LB160 Forklift Forklifts Hyster 300S Cummins C 5.9-C ,660 Diesel 0.3 LB161 Forklift Forklifts Taylor THD 300 Cummins C 5.9-C ,660 Diesel 0.3 LB162 Forklift Forklifts Taylor THD 300 Cummins C 5.9-C ,660 Diesel 0.3 LB163 Forklift Forklifts Taylor THD 300 Cummins C 5.9-C ,870 Diesel 0.3 LB164 Forklift Forklifts Taylor THD 300 Cummins C 5.9-C ,870 Diesel 0.3 LB165 Forklift Forklifts Taylor Cummins Diesel 0.3 LB166 Forklift Forklifts Hyster Cummins Diesel 0.3 LB167 Forklift Forklifts Taylor Cummins C 5.9-C ,870 Diesel 0.3 LB168 Forklift Forklifts Taylor Cummins C 5.9-C ,870 Diesel 0.3 LB169 Forklift Forklifts Hyster H820B Detroit Diesel Diesel 0.3 LB170 Forklift Forklifts Taylor Detroit Diesel Diesel 0.3 LB171 Forklift Forklifts Otek 55SC Caterpillar ,200 Diesel 0.3 LB172 Forklift Forklifts Otek 55SC Caterpillar ,200 Diesel 0.3 LB173 Forklift Forklifts Otek 55SC Caterpillar ,200 Diesel 0.3 LB174 Forklift Forklifts Otek 55SC Caterpillar ,200 Diesel 0.3 LB175 Forklift Forklifts Otek 55SC Caterpillar ,200 Diesel 0.3 LB176 Forklift Forklifts Otek Caterpillar ,870 Diesel 0.3 LB177 Forklift Forklifts Otek Caterpillar ,870 Diesel 0.3 LB178 Forklift Forklifts Otek 55SC Caterpillar ,200 Diesel 0.3 LB179 Forklift Forklifts Otek 55SC Caterpillar ,200 Diesel 0.3 LB180 Forklift Forklifts Komatsu FD 40 Nissan TB LPG 0.3 LB181 Forklift Forklifts Komatsu FD 40 Nissan TB LPG 0.3 LB182 Forklift Forklifts Hyster H 200 Perkins ,040 Diesel 0.3 LB183 Forklift Forklifts Hyster H 200 Perkins ,040 Diesel 0.3 LB184 Forklift Forklifts Hyster H 200 Perkins ,040 Diesel 0.3 LB185 Forklift Forklifts Hyster H 200 Perkins ,040 Diesel 0.3 LB186 Forklift Forklifts Hyster H 210 XL Perkins T ,040 Diesel 0.3 LB187 Forklift Forklifts Hyster H 210 XL Perkins T ,040 Diesel 0.3 LB188 Forklift Forklifts Hyster H 250 XLZ Perkins T ,040 Diesel 0.3 LB189 Forklift Forklifts Hyster H 250 XLZ Perkins T ,040 Diesel 0.3 LB190 Forklift Forklifts Hyster H 250 XLZ Perkins T ,040 Diesel 0.3 LB191 Forklift Forklifts Hyster H 250 XLZ Perkins T ,040 Diesel 0.3 LB192 Forklift Forklifts Hyster H 210 XL Perkins T ,040 Diesel 0.3 LB193 Forklift Forklifts Hyster H 210 XL Perkins T ,040 Diesel 0.3 LB194 Forklift Forklifts Komatsu FD 100 Isuzu 6 B GIT ,040 Diesel 0.3 LB195 Forklift Forklifts 10,000 ton LPG 0.3 Starcrest Consulting Group, LLC A-8 March 2004
138 Table A.1 Cargo Handling Equipment List (contd) Annual ID # Port Equip Type OFFROAD Equipment Equipment Engine Engine Model Year HP Activity Fuel LF Equipment Type Make Model (hours) Type LB196 Forklift Forklifts 10,000 ton LPG 0.3 LB197 Forklift Forklifts 10,000 ton LPG 0.3 LB198 Forklift Forklifts 10,000 ton LPG 0.3 LB199 Forklift Forklifts 10,000 ton LPG 0.3 LB200 Forklift Forklifts 10,000 ton LPG 0.3 LB201 Forklift Forklifts 10,000 ton LPG 0.3 LB202 Forklift Forklifts 10,000 ton LPG 0.3 LB203 Forklift Forklifts 10,000 ton LPG 0.3 LB204 Forklift Forklifts 10,000 ton LPG 0.3 LB205 Forklift Forklifts 10,000 ton LPG 0.3 LB206 Forklift Forklifts 10,000 ton LPG 0.3 LB207 Forklift Forklifts 10,000 ton LPG 0.3 LB208 Forklift Forklifts 10,000 ton LPG 0.3 LB209 Forklift Forklifts 10,000 ton LPG 0.3 LB210 Forklift Forklifts 10,000 ton LPG 0.3 LB211 Forklift Forklifts 10,000 ton LPG 0.3 LB212 Forklift Forklifts 10,000 ton LPG 0.3 LB213 Forklift Forklifts 10,000 ton LPG 0.3 LB214 Forklift Forklifts 10,000 ton LPG 0.3 LB215 Forklift Forklifts 10,000 ton LPG 0.3 LB216 Forklift Forklifts 10,000 ton LPG 0.3 LB217 Forklift Forklifts 10,000 ton LPG 0.3 LB218 Forklift Forklifts Hyster Perkins T ,080 Diesel 0.3 LB219 Forklift Forklifts Hyster Perkins T ,080 Diesel 0.3 LB220 Forklift Forklifts Hyster Perkins T ,080 Diesel 0.3 LB221 Forklift Forklifts Hyster Perkins T ,080 Diesel 0.3 LB222 Forklift Forklifts Hyster Perkins T ,080 Diesel 0.3 LB223 Forklift Forklifts Hyster Perkins T ,080 Diesel 0.3 LB224 Forklift Forklifts Hyster Perkins T ,080 Diesel 0.3 LB225 Forklift Forklifts Hyster Perkins T ,080 Diesel 0.3 LB226 Forklift Forklifts Hyster Perkins T ,080 Diesel 0.3 LB227 Forklift Forklifts Hyster Perkins T ,080 Diesel 0.3 LB228 Forklift Forklifts Hyster Perkins T ,080 Diesel 0.3 LB229 Forklift Forklifts Hyster Perkins T ,080 Diesel 0.3 LB230 Forklift Forklifts Toyota Toyota ,375 LPG 0.3 LB231 Forklift Forklifts Toyota Toyota ,375 LPG 0.3 LB232 Forklift Forklifts Hyster H250 ED Hyster ,375 LPG 0.3 LB233 Forklift Forklifts Hyster S40 CP Hyster ,375 LPG 0.3 LB234 Forklift Forklifts Hyster S40 CP Hyster ,375 LPG 0.3 Starcrest Consulting Group, LLC A-9 March 2004
139 Table A.1 Cargo Handling Equipment List (contd) Annual ID # Port Equip Type OFFROAD Equipment Equipment Engine Engine Model Year HP Activity Fuel LF Equipment Type Make Model (hours) Type LB235 Forklift Forklifts Hyster 540 CP Hyster ,375 LPG 0.3 LB236 Forklift Forklifts Hyster 540 CP Hyster ,375 LPG 0.3 LB237 Forklift Forklifts Toyota Toyota ,768 LPG 0.3 LB238 Forklift Forklifts Toyota Toyota ,375 LPG 0.3 LB239 Forklift Forklifts Toyota Toyota ,375 LPG 0.3 LB240 Forklift Forklifts Toyota Toyota ,375 LPG 0.3 LB241 Forklift Forklifts Toyota Toyota ,375 LPG 0.3 LB242 Forklift Forklifts Toyota Toyota ,768 LPG 0.3 LB243 Forklift Forklifts Toyota Toyota ,375 LPG 0.3 LB244 Forklift Forklifts Toyota Toyota ,375 LPG 0.3 LB245 Forklift Forklifts Toyota Toyota ,375 LPG 0.3 LB246 Forklift Forklifts Toyota FECO6001 Toyota ,375 LPG 0.3 LB247 Forklift Forklifts Toyota Toyota ,375 LPG 0.3 LB248 Forklift Forklifts Toyota Toyota ,375 LPG 0.3 LB249 Forklift Forklifts Toyota Toyota ,375 LPG 0.3 LB250 Forklift Forklifts Toyota Toyota ,375 LPG 0.3 LB251 Forklift Forklifts Toyota Toyota ,375 LPG 0.3 LB252 Forklift Forklifts Toyota FECO6055 Toyota ,375 LPG 0.3 LB253 Forklift Forklifts Toyota 7FGCU45 Toyota ,768 LPG 0.3 LB254 Forklift Forklifts Clark C500YS80D Diesel 0.3 LB255 Forklift Forklifts Hyster H80XL Diesel 0.3 LB256 Forklift Forklifts Hyster H80XL Diesel 0.3 LB257 Forklift Forklifts Hyster H80XL Diesel 0.3 LB258 Forklift Forklifts Mitsubishi FD150A Mitsubishi ,000 Diesel 0.3 LB259 Forklift Forklifts Taylor TY300M ,000 Diesel 0.3 LB260 Forklift Forklifts Clark C500YS80D ,300 Diesel 0.3 LB261 Forklift Forklifts Hyster H80XL ,300 Diesel 0.3 LB262 Forklift Forklifts Hyster H80XL ,300 Diesel 0.3 LB263 Forklift Forklifts Hyster H300XL Diesel 0.3 LB264 Forklift Forklifts Hyster H155XL ,300 Diesel 0.3 LB265 Forklift Forklifts Taylor Y45WO ,300 Diesel 0.3 LB266 Forklift Forklifts Caterpillar V60B ,300 Diesel 0.3 LB267 Forklift Forklifts Mitsubishi FD ,300 Diesel 0.3 LB268 Forklift Forklifts Mitsubishi FD ,300 Diesel 0.3 LB269 Forklift Forklifts Mitsubishi FD ,300 Diesel 0.3 LB270 Forklift Forklifts Mitsubishi FD ,300 Diesel 0.3 LB271 Forklift Forklifts Mitsubishi FD ,300 Diesel 0.3 LB272 Forklift Forklifts Taylor TEC300S ,300 Diesel 0.3 LB273 Forklift Forklifts Mitsubishi FD ,300 Diesel 0.3 Starcrest Consulting Group, LLC A-10 March 2004
140 Table A.1 Cargo Handling Equipment List (contd) Annual ID # Port Equip Type OFFROAD Equipment Equipment Engine Engine Model Year HP Activity Fuel LF Equipment Type Make Model (hours) Type LB274 Forklift Forklifts Kalmar ,300 Diesel 0.3 LB275 Forklift Forklifts Hyster H300XL ,300 Diesel 0.3 LB276 Forklift Forklifts Mitsubishi FD150A ,300 Diesel 0.3 LB277 Forklift Forklifts Mitsubishi FD150A ,300 Diesel 0.3 LB278 Forklift Forklifts Mitsubishi FD150A ,300 Diesel 0.3 LB279 Forklift Forklifts Mitsubishi FD150A ,300 Diesel 0.3 LB280 Forklift Forklifts Mitsubishi FD150A ,300 Diesel 0.3 LB281 Forklift Forklifts Taylor TY300M ,300 Diesel 0.3 LB282 Forklift Forklifts Mitsubishi Mitsubishi FG LPG 0.3 LB283 Forklift Forklifts Mitsubishi Mitsubishi FG LPG 0.3 LB284 Forklift Forklifts Mitsubishi Mitsubishi FG LPG 0.3 LB285 Forklift Forklifts Mitsubishi Mitsubishi FG LPG 0.3 LB286 Forklift Forklifts Mitsubishi Mitsubishi FG LPG 0.3 LB287 Forklift Forklifts Mitsubishi Mitsubishi FG LPG 0.3 LB288 Forklift Forklifts Mitsubishi Mitsubishi FG LPG 0.3 LB289 Forklift Forklifts Taylor John Deere Diesel 0.3 LB290 Forklift Forklifts Taylor Detroit Diesel Diesel 0.3 LB291 Forklift Forklifts Taylor Detroit Diesel Diesel 0.3 LB292 Forklift Forklifts Taylor Cummins C 5.9-C (6 BT, 6 BTA) Diesel 0.3 LB293 Forklift Forklifts Taylor Cummins C 5.9-C (6 BT, 6 BTA) Diesel 0.3 LB294 Forklift Forklifts Towmotor Diesel 0.3 LB295 Forklift Forklifts Hyster Diesel 0.3 LB296 Forklift Forklifts Taylor Diesel 0.3 LB297 Forklift Forklifts Taylor Diesel 0.3 LB298 Forklift Forklifts Kalmar 600-XL Cummins ,680 Diesel 0.3 LB299 Forklift Forklifts Mitsubishi FD-115 Cummins ,680 Diesel 0.3 LB300 Forklift Forklifts Taylor Cummins ,680 Diesel 0.3 LB301 Forklift Forklifts Taylor GT-360 Perkins ,680 Diesel 0.3 LB302 Forklift Forklifts Taylor GT-360 Perkins ,680 Diesel 0.3 LB303 Forklift Forklifts Taylor TE-300-M Cummins ,680 Diesel 0.3 LB304 Forklift Forklifts Taylor TE-300-M Cummins ,680 Diesel 0.3 LB305 Forklift Forklifts Taylor TE-250-M Cummins ,680 Diesel 0.3 LB306 Forklift Forklifts Kalmar Volvo ,680 Diesel 0.3 LB307 Forklift Forklifts Twomotor Diesel 0.3 LB308 Forklift Forklifts Taylor GMC Diesel 0.3 LB309 Forklift Forklifts Hyster Perkins Diesel 0.3 LB310 Forklift Forklifts Caterpillar Caterpillar Diesel 0.3 LB311 Forklift Forklifts 20T Diesel 0.3 LB312 Forklift Forklifts Hyster ,375 LPG 0.3 Starcrest Consulting Group, LLC A-11 March 2004
141 Table A.1 Cargo Handling Equipment List (contd) Annual ID # Port Equip Type OFFROAD Equipment Equipment Engine Engine Model Year HP Activity Fuel LF Equipment Type Make Model (hours) Type LB313 Forklift Forklifts Hyster ,375 LPG 0.3 LB314 Forklift Forklifts Clark ,375 LPG 0.3 LB315 Forklift Forklifts Hyster ,375 LPG 0.3 LB316 Forklift Forklifts Hyster ,375 LPG 0.3 LB317 Forklift Forklifts Hyster ,375 LPG 0.3 LB318 Forklift Forklifts Hyster ,375 LPG 0.3 LB319 Forklift Forklifts Hyster ,375 LPG 0.3 LB320 Forklift Forklifts Datsun ,375 LPG 0.3 LB321 Forklift Forklifts Datsun ,375 LPG 0.3 LB322 Forklift Forklifts Datsun ,375 LPG 0.3 LB323 Forklift Forklifts Nissan ,375 LPG 0.3 LB324 Forklift Forklifts 4,500 lbs Diesel 0.3 LB325 Forklift Forklifts Hyster 7,000 lbs Diesel 0.3 LB326 Forklift Forklifts Ford Ford V Diesel 0.3 LB327 Forklift Forklifts Grove 6 cyl Diesel 0.3 LB328 Forklift Forklifts Ford 4 cyl LPG 0.3 LB329 Forklift Forklifts Caterpillar 744 Caterpillar LPG 0.3 LB330 Lift Forklifts Hyster H210XL Perkins ,600 Diesel 0.3 LB331 Lift Forklifts Hyster H210X Perkins ,820 Diesel 0.3 LB332 Lift truck Forklifts Hyster Perkins ,820 Diesel 0.3 LB333 Yard tractor Off-Highway Trucks Capacity YT-50 Cummins C 5.9-C Diesel 0.57 LB334 Yard tractor Off-Highway Trucks Capacity YT-50 Cummins C 5.9-C Diesel 0.57 LB335 Yard tractor Off-Highway Trucks Capacity TJ7000 Detroit Diesel 8.2L Diesel 0.57 LB336 Yard tractor Off-Highway Trucks Capacity TJ7000 Detroit Diesel 8.2L Diesel 0.57 LB337 Yard tractor Off-Highway Trucks Capacity TJ7000 Detroit Diesel 8.2L Diesel 0.57 LB338 Yard tractor Off-Highway Trucks Rhino Caterpillar Diesel 0.57 LB339 Yard tractor Off-Highway Trucks Ottawa YT-30 Detroit Diesel 212 CL ,561 Diesel 0.57 LB340 Yard tractor Off-Highway Trucks Ottawa YT-30 Detroit Diesel 212 CL ,561 Diesel 0.57 LB341 Yard tractor Off-Highway Trucks Ottawa YT-30 Detroit Diesel 212 CL ,561 Diesel 0.57 LB342 Yard tractor Off-Highway Trucks Ottawa YT-30 Detroit Diesel 212 CL ,561 Diesel 0.57 LB343 Yard tractor Off-Highway Trucks Ottawa YT-30 Detroit Diesel 212 CL ,561 Diesel 0.57 LB344 Yard tractor Off-Highway Trucks Capacity TJ-4000 Detroit Diesel 212 CL ,561 Diesel 0.57 LB345 Yard tractor Off-Highway Trucks Capacity TJ-4000 Detroit Diesel 212 CL ,561 Diesel 0.57 LB346 Yard tractor Off-Highway Trucks Capacity TJ-4000 Detroit Diesel 212 CL ,561 Diesel 0.57 LB347 Yard tractor Off-Highway Trucks Ottawa YT-50 Cummins C 5.9-C (6 BT, 6 BTA) ,561 Diesel 0.57 LB348 Yard tractor Off-Highway Trucks Ottawa YT-50 Cummins C 5.9-C (6 BT, 6 BTA) ,561 Diesel 0.57 LB349 Yard tractor Off-Highway Trucks Ottawa YT-50 Cummins C 5.9-C (6 BT, 6 BTA) ,561 Diesel 0.57 LB350 Yard tractor Off-Highway Trucks Ottawa YT-50 Cummins C 5.9-C (6 BT, 6 BTA) ,561 Diesel 0.57 LB351 Yard tractor Off-Highway Trucks Ottawa YT-50 Cummins C 5.9-C (6 BT, 6 BTA) ,561 Diesel 0.57 Starcrest Consulting Group, LLC A-12 March 2004
142 Table A.1 Cargo Handling Equipment List (contd) Annual ID # Port Equip Type OFFROAD Equipment Equipment Engine Engine Model Year HP Activity Fuel LF Equipment Type Make Model (hours) Type LB352 Yard tractor Off-Highway Trucks Ottawa YT-50 Cummins C 5.9-C (6 BT, 6 BTA) ,561 Diesel 0.57 LB353 Yard tractor Off-Highway Trucks Ottawa YT-50 Cummins C 5.9-C (6 BT, 6 BTA) ,561 Diesel 0.57 LB354 Yard tractor Off-Highway Trucks Ottawa YT-50 Cummins C 5.9-C (6 BT, 6 BTA) ,561 Diesel 0.57 LB355 Yard tractor Off-Highway Trucks Ottawa YT-50 Cummins C 5.9-C (6 BT, 6 BTA) ,561 Diesel 0.57 LB356 Yard tractor Off-Highway Trucks Ottawa YT-50 Cummins C 5.9-C (6 BT, 6 BTA) ,561 Diesel 0.57 LB357 Yard tractor Off-Highway Trucks Ottawa YT-50 Cummins C 5.9-C (6 BT, 6 BTA) ,561 Diesel 0.57 LB358 Yard tractor Off-Highway Trucks Ottawa YT-50 Cummins C 5.9-C (6 BT, 6 BTA) ,561 Diesel 0.57 LB359 Yard tractor Off-Highway Trucks Ottawa YT-50 Cummins C 5.9-C (6 BT, 6 BTA) ,561 Diesel 0.57 LB360 Yard tractor Off-Highway Trucks Ottawa YT-50 Cummins C 5.9-C (6 BT, 6 BTA) ,561 Diesel 0.57 LB361 Yard tractor Off-Highway Trucks Ottawa YT-50 Cummins C 5.9-C (6 BT, 6 BTA) ,561 Diesel 0.57 LB362 Yard tractor Off-Highway Trucks Ottawa YT-50 Cummins C 5.9-C (6 BT, 6 BTA) ,561 Diesel 0.57 LB363 Yard tractor Off-Highway Trucks Ottawa YT-50 Cummins C 5.9-C (6 BT, 6 BTA) ,561 Diesel 0.57 LB364 Yard tractor Off-Highway Trucks Ottawa YT-50 Cummins C 5.9-C (6 BT, 6 BTA) ,561 Diesel 0.57 LB365 Yard tractor Off-Highway Trucks Ottawa YT-50 Cummins C 5.9-C (6 BT, 6 BTA) ,561 Diesel 0.57 LB366 Yard tractor Off-Highway Trucks Ottawa YT-50 Cummins C 5.9-C (6 BT, 6 BTA) ,561 Diesel 0.57 LB367 Yard tractor Off-Highway Trucks Ottawa YT-50 Cummins C 5.9-C (6 BT, 6 BTA) ,561 Diesel 0.57 LB368 Yard tractor Off-Highway Trucks Ottawa YT-50 Cummins C 5.9-C (6 BT, 6 BTA) ,561 Diesel 0.57 LB369 Yard tractor Off-Highway Trucks Ottawa YT-50 Cummins C 5.9-C (6 BT, 6 BTA) ,561 Diesel 0.57 LB370 Yard tractor Off-Highway Trucks Ottawa YT-50 Cummins C 5.9-C (6 BT, 6 BTA) ,561 Diesel 0.57 LB371 Yard tractor Off-Highway Trucks Ottawa YT-50 Cummins C 5.9-C (6 BT, 6 BTA) ,561 Diesel 0.57 LB372 Yard tractor Off-Highway Trucks Ottawa YT-50 Cummins C 5.9-C (6 BT, 6 BTA) ,561 Diesel 0.57 LB373 Yard tractor Off-Highway Trucks Ottawa YT-50 Cummins C 5.9-C (6 BT, 6 BTA) ,561 Diesel 0.57 LB374 Yard tractor Off-Highway Trucks Ottawa YT-50 Cummins C 5.9-C (6 BT, 6 BTA) ,561 Diesel 0.57 LB375 Yard tractor Off-Highway Trucks Ottawa YT-50 Cummins C 5.9-C (6 BT, 6 BTA) ,561 Diesel 0.57 LB376 Yard tractor Off-Highway Trucks Ottawa YT-50 Cummins C 5.9-C (6 BT, 6 BTA) ,561 Diesel 0.57 LB377 Yard tractor Off-Highway Trucks Ottawa YT-50 Cummins C 5.9-C (6 BT, 6 BTA) ,561 Diesel 0.57 LB378 Yard tractor Off-Highway Trucks Ottawa YT-50 Cummins C 5.9-C (6 BT, 6 BTA) ,561 Diesel 0.57 LB379 Yard tractor Off-Highway Trucks Ottawa YT-50 Cummins C 5.9-C (6 BT, 6 BTA) ,561 Diesel 0.57 LB380 Yard tractor Off-Highway Trucks Ottawa YT-50 Cummins C 5.9-C (6 BT, 6 BTA) ,561 Diesel 0.57 LB381 Yard tractor Off-Highway Trucks Ottawa YT-50 Cummins C 5.9-C (6 BT, 6 BTA) ,561 Diesel 0.57 LB382 Yard tractor Off-Highway Trucks Ottawa YT-50 Cummins C 5.9-C (6 BT, 6 BTA) ,561 Diesel 0.57 LB383 Yard tractor Off-Highway Trucks Ottawa YT-50 Cummins C 5.9-C (6 BT, 6 BTA) ,561 Diesel 0.57 LB384 Yard tractor Off-Highway Trucks Ottawa YT-50 Cummins C 5.9-C (6 BT, 6 BTA) ,561 Diesel 0.57 LB385 Yard tractor Off-Highway Trucks Ottawa YT-50 Cummins C 5.9-C (6 BT, 6 BTA) ,561 Diesel 0.57 LB386 Yard tractor Off-Highway Trucks Ottawa YT-50 Cummins C 5.9-C (6 BT, 6 BTA) ,561 Diesel 0.57 LB387 Yard tractor Off-Highway Trucks Ottawa YT-50 Cummins C 5.9-C (6 BT, 6 BTA) ,561 Diesel 0.57 LB388 Yard tractor Off-Highway Trucks Ottawa YT-50 Cummins C 5.9-C (6 BT, 6 BTA) ,561 Diesel 0.57 LB389 Yard tractor Off-Highway Trucks Ottawa YT-50 Cummins C 5.9-C (6 BT, 6 BTA) ,561 Diesel 0.57 LB390 Yard tractor Off-Highway Trucks Ottawa YT-50 Cummins C 5.9-C (6 BT, 6 BTA) ,561 Diesel 0.57 Starcrest Consulting Group, LLC A-13 March 2004
143 Table A.1 Cargo Handling Equipment List (contd) Annual ID # Port Equip Type OFFROAD Equipment Equipment Engine Engine Model Year HP Activity Fuel LF Equipment Type Make Model (hours) Type LB391 Yard tractor Off-Highway Trucks Ottawa YT-50 Cummins C 5.9-C (6 BT, 6 BTA) ,561 Diesel 0.57 LB392 Yard tractor Off-Highway Trucks Ottawa YT-50 Cummins C 5.9-C (6 BT, 6 BTA) ,561 Diesel 0.57 LB393 Yard tractor Off-Highway Trucks Ottawa YT-50 Cummins C 5.9-C (6 BT, 6 BTA) ,561 Diesel 0.57 LB394 Yard tractor Off-Highway Trucks Ottawa YT-50 Cummins C 5.9-C (6 BT, 6 BTA) ,561 Diesel 0.57 LB395 Yard tractor Off-Highway Trucks Ottawa YT-50 Cummins C 5.9-C (6 BT, 6 BTA) ,561 Diesel 0.57 LB396 Yard tractor Off-Highway Trucks Ottawa YT-50 Cummins C 5.9-C (6 BT, 6 BTA) ,561 Diesel 0.57 LB397 Yard tractor Off-Highway Trucks Ottawa YT-50 Cummins C 5.9-C (6 BT, 6 BTA) ,561 Diesel 0.57 LB398 Yard tractor Off-Highway Trucks Ottawa YT-50 Cummins C 5.9-C (6 BT, 6 BTA) ,561 Diesel 0.57 LB399 Yard tractor Off-Highway Trucks Ottawa YT-50 Cummins C 5.9-C (6 BT, 6 BTA) ,561 Diesel 0.57 LB400 Yard tractor Off-Highway Trucks Ottawa YT-50 Cummins C 5.9-C (6 BT, 6 BTA) ,561 Diesel 0.57 LB401 Yard tractor Off-Highway Trucks Ottawa YT-50 Cummins C 5.9-C (6 BT, 6 BTA) ,561 Diesel 0.57 LB402 Yard tractor Off-Highway Trucks Ottawa YT-50 Cummins C 5.9-C (6 BT, 6 BTA) ,561 Diesel 0.57 LB403 Yard tractor Off-Highway Trucks Ottawa YT-50 Cummins C 5.9-C (6 BT, 6 BTA) ,561 Diesel 0.57 LB404 Yard tractor Off-Highway Trucks Ottawa YT-50 Cummins C 5.9-C (6 BT, 6 BTA) ,561 Diesel 0.57 LB405 Yard tractor Off-Highway Trucks Ottawa YT-50 Cummins C 5.9-C (6 BT, 6 BTA) ,561 Diesel 0.57 LB406 Yard tractor Off-Highway Trucks Ottawa YT-50 Cummins C 5.9-C (6 BT, 6 BTA) ,561 Diesel 0.57 LB407 Yard tractor Off-Highway Trucks Ottawa YT-50 Cummins C 5.9-C (6 BT, 6 BTA) ,561 Diesel 0.57 LB408 Yard tractor Off-Highway Trucks Ottawa YT-50 Cummins C 5.9-C (6 BT, 6 BTA) ,561 Diesel 0.57 LB409 Yard tractor Off-Highway Trucks Ottawa YT-50 Cummins C 5.9-C (6 BT, 6 BTA) ,561 Diesel 0.57 LB410 Yard tractor Off-Highway Trucks Ottawa YT-50 Cummins C 5.9-C (6 BT, 6 BTA) ,561 Diesel 0.57 LB411 Yard tractor Off-Highway Trucks Ottawa YT-50 Cummins C 5.9-C (6 BT, 6 BTA) ,561 Diesel 0.57 LB412 Yard tractor Off-Highway Trucks Ottawa YT-50 Cummins C 5.9-C (6 BT, 6 BTA) ,561 Diesel 0.57 LB413 Yard tractor Off-Highway Trucks Ottawa YT-50 Cummins C 5.9-C (6 BT, 6 BTA) ,561 Diesel 0.57 LB414 Yard tractor Off-Highway Trucks Ottawa YT-50 Cummins C 5.9-C (6 BT, 6 BTA) ,561 Diesel 0.57 LB415 Yard tractor Off-Highway Trucks Ottawa YT-50 Cummins C 5.9-C (6 BT, 6 BTA) ,561 Diesel 0.57 LB416 Yard tractor Off-Highway Trucks Ottawa YT-50 Cummins C 5.9-C (6 BT, 6 BTA) ,561 Diesel 0.57 LB417 Yard tractor Off-Highway Trucks Ottawa YT-50 Cummins C 5.9-C (6 BT, 6 BTA) ,561 Diesel 0.57 LB418 Yard tractor Off-Highway Trucks Ottawa YT-30 Detroit Diesel 8.2L ,561 Diesel 0.57 LB419 Yard tractor Off-Highway Trucks Ottawa YT-30 Detroit Diesel 8.2L ,561 Diesel 0.57 LB420 Yard tractor Off-Highway Trucks Ottawa YT-30 Detroit Diesel 8.2L ,561 Diesel 0.57 LB421 Yard tractor Off-Highway Trucks Ottawa YT-30 Detroit Diesel 8.2L ,561 Diesel 0.57 LB422 Yard tractor Off-Highway Trucks Ottawa YT-30 Detroit Diesel 8.2L ,561 Diesel 0.57 LB423 Yard tractor Off-Highway Trucks Ottawa YT-30 Detroit Diesel 8.2L ,561 Diesel 0.57 LB424 Yard tractor Off-Highway Trucks Ottawa YT-30 Detroit Diesel 8.2L ,561 Diesel 0.57 LB425 Yard tractor Off-Highway Trucks Ottawa YT-30 Detroit Diesel 8.2L ,561 Diesel 0.57 LB426 Yard tractor Off-Highway Trucks Ottawa YT-30 Detroit Diesel 8.2L ,561 Diesel 0.57 LB427 Yard tractor Off-Highway Trucks Ottawa Detroit Diesel 8.2 L Diesel 0.57 LB428 Yard tractor Off-Highway Trucks Ottawa Detroit Diesel 8.2 L Diesel 0.57 LB429 Yard tractor Off-Highway Trucks Ottawa Cummins C 8.3-C (6 CT) Diesel 0.57 Starcrest Consulting Group, LLC A-14 March 2004
144 Table A.1 Cargo Handling Equipment List (contd) Annual ID # Port Equip Type OFFROAD Equipment Equipment Engine Engine Model Year HP Activity Fuel LF Equipment Type Make Model (hours) Type LB430 Yard tractor Off-Highway Trucks Ottawa Cummins C 8.3-C (6 CT) Diesel 0.57 LB431 Yard tractor Off-Highway Trucks Ottawa Cummins C 8.3-C (6 CT) Diesel 0.57 LB432 Yard tractor Off-Highway Trucks Ottawa Cummins C 8.3-C (6 CT) Diesel 0.57 LB433 Yard tractor Off-Highway Trucks Ottawa Cummins C 8.3-C (6 CT) Diesel 0.57 LB434 Yard tractor Off-Highway Trucks Ottawa Cummins C 8.3-C (6 CT) Diesel 0.57 LB435 Yard tractor Off-Highway Trucks Ottawa Cummins C 8.3-C (6 CT) Diesel 0.57 LB436 Yard tractor Off-Highway Trucks Ottawa Cummins C 8.3-C (6 CT) Diesel 0.57 LB437 Yard tractor Off-Highway Trucks Ottawa Cummins C 8.3-C (6 CT) Diesel 0.57 LB438 Yard tractor Off-Highway Trucks Ottawa Cummins C 8.3-C (6 CT) Diesel 0.57 LB439 Yard tractor Off-Highway Trucks Ottawa Cummins C 8.3-C (6 CT) ,112 Diesel 0.57 LB440 Yard tractor Off-Highway Trucks Ottawa Cummins C 8.3-C (6 CT) Diesel 0.57 LB441 Yard tractor Off-Highway Trucks Ottawa Cummins C 8.3-C (6 CT) ,043 Diesel 0.57 LB442 Yard tractor Off-Highway Trucks Ottawa Cummins C 8.3-C (6 CT) ,365 Diesel 0.57 LB443 Yard tractor Off-Highway Trucks Ottawa Cummins C 8.3-C (6 CT) Diesel 0.57 LB444 Yard tractor Off-Highway Trucks Ottawa Cummins C 8.3-C (6 CT) ,045 Diesel 0.57 LB445 Yard tractor Off-Highway Trucks Ottawa Cummins C 8.3-C (6 CT) ,349 Diesel 0.57 LB446 Yard tractor Off-Highway Trucks Ottawa Cummins C 8.3-C (6 CT) ,357 Diesel 0.57 LB447 Yard tractor Off-Highway Trucks Ottawa Cummins C 8.3-C (6 CT) ,368 Diesel 0.57 LB448 Yard tractor Off-Highway Trucks Ottawa Cummins C 8.3-C (6 CT) ,454 Diesel 0.57 LB449 Yard tractor Off-Highway Trucks Ottawa Cummins C 8.3-C (6 CT) ,584 Diesel 0.57 LB450 Yard tractor Off-Highway Trucks Ottawa Cummins C 8.3-C (6 CT) ,690 Diesel 0.57 LB451 Yard tractor Off-Highway Trucks Ottawa Cummins C 8.3-C (6 CT) ,329 Diesel 0.57 LB452 Yard tractor Off-Highway Trucks Ottawa Cummins C 8.3-C (6 CT) ,392 Diesel 0.57 LB453 Yard tractor Off-Highway Trucks Ottawa Cummins C 8.3-C (6 CT) ,526 Diesel 0.57 LB454 Yard tractor Off-Highway Trucks Ottawa Cummins C 8.3-C (6 CT) ,599 Diesel 0.57 LB455 Yard tractor Off-Highway Trucks Ottawa Cummins C 8.3-C (6 CT) ,690 Diesel 0.57 LB456 Yard tractor Off-Highway Trucks Ottawa Cummins C 8.3-C (6 CT) ,717 Diesel 0.57 LB457 Yard tractor Off-Highway Trucks Ottawa Cummins C 8.3-C (6 CT) ,766 Diesel 0.57 LB458 Yard tractor Off-Highway Trucks Ottawa Cummins C 8.3-C (6 CT) ,847 Diesel 0.57 LB459 Yard tractor Off-Highway Trucks Ottawa Cummins C 8.3-C (6 CT) ,872 Diesel 0.57 LB460 Yard tractor Off-Highway Trucks Ottawa Cummins C 8.3-C (6 CT) ,181 Diesel 0.57 LB461 Yard tractor Off-Highway Trucks Ottawa Cummins C 8.3-C (6 CT) ,783 Diesel 0.57 LB462 Yard tractor Off-Highway Trucks Ottawa Cummins C 8.3-C (6 CT) ,804 Diesel 0.57 LB463 Yard tractor Off-Highway Trucks Ottawa Cummins C 8.3-C (6 CT) ,138 Diesel 0.57 LB464 Yard tractor Off-Highway Trucks Ottawa Cummins C 8.3-C (6 CT) ,350 Diesel 0.57 LB465 Yard tractor Off-Highway Trucks Ottawa Cummins C 8.3-C (6 CT) ,367 Diesel 0.57 LB466 Yard tractor Off-Highway Trucks Ottawa Cummins C 8.3-C (6 CT) ,518 Diesel 0.57 LB467 Yard tractor Off-Highway Trucks Ottawa Cummins C 8.3-C (6 CT) ,063 Diesel 0.57 LB468 Yard tractor Off-Highway Trucks Ottawa Cummins C 8.3-C (6 CT) ,074 Diesel 0.57 Starcrest Consulting Group, LLC A-15 March 2004
145 Table A.1 Cargo Handling Equipment List (contd) Annual ID # Port Equip Type OFFROAD Equipment Equipment Engine Engine Model Year HP Activity Fuel LF Equipment Type Make Model (hours) Type LB469 Yard tractor Off-Highway Trucks Ottawa Cummins C 8.3-C (6 CT) ,089 Diesel 0.57 LB470 Yard tractor Off-Highway Trucks Ottawa Cummins C 8.3-C (6 CT) ,205 Diesel 0.57 LB471 Yard tractor Off-Highway Trucks Ottawa Cummins C 8.3-C (6 CT) ,658 Diesel 0.57 LB472 Yard tractor Off-Highway Trucks Ottawa YT-50 Cummins C 5.9-C (6 BT, 6 BTA) ,300 Diesel 0.57 LB473 Yard tractor Off-Highway Trucks Ottawa YT-50 Cummins C 5.9-C (6 BT, 6 BTA) ,300 Diesel 0.57 LB474 Yard tractor Off-Highway Trucks Ottawa YT-50 Cummins C 5.9-C (6 BT, 6 BTA) ,300 Diesel 0.57 LB475 Yard tractor Off-Highway Trucks Ottawa C-50 Cummins C 5.9-C (6 BT, 6 BTA) ,300 Diesel 0.57 LB476 Yard tractor Off-Highway Trucks Ottawa C-50 Cummins C 5.9-C (6 BT, 6 BTA) ,300 Diesel 0.57 LB477 Yard tractor Off-Highway Trucks Ottawa C-50 Cummins C 5.9-C (6 BT, 6 BTA) ,300 Diesel 0.57 LB478 Yard tractor Off-Highway Trucks Ottawa C-50 Cummins C 5.9-C (6 BT, 6 BTA) ,300 Diesel 0.57 LB479 Yard tractor Off-Highway Trucks Ottawa C-50 Cummins C 5.9-C (6 BT, 6 BTA) ,300 Diesel 0.57 LB480 Yard tractor Off-Highway Trucks Ottawa YT-50 Cummins C 5.9-C (6 BT, 6 BTA) ,300 Diesel 0.57 LB481 Yard tractor Off-Highway Trucks Ottawa YT-50 Cummins C 5.9-C (6 BT, 6 BTA) ,300 Diesel 0.57 LB482 Yard tractor Off-Highway Trucks Ottawa YT-50 Cummins C 5.9-C (6 BT, 6 BTA) ,300 Diesel 0.57 LB483 Yard tractor Off-Highway Trucks Ottawa YT-50 Cummins C 5.9-C (6 BT, 6 BTA) ,300 Diesel 0.57 LB484 Yard tractor Off-Highway Trucks Ottawa YT-50 Cummins C 5.9-C (6 BT, 6 BTA) ,300 Diesel 0.57 LB485 Yard tractor Off-Highway Trucks Ottawa YT-50 Cummins C 5.9-C (6 BT, 6 BTA) ,300 Diesel 0.57 LB486 Yard tractor Off-Highway Trucks Ottawa YT-50 Cummins C 5.9-C (6 BT, 6 BTA) ,300 Diesel 0.57 LB487 Yard tractor Off-Highway Trucks Ottawa YT-50 Cummins C 5.9-C (6 BT, 6 BTA) ,300 Diesel 0.57 LB488 Yard tractor Off-Highway Trucks Ottawa YT-50 Cummins C 5.9-C (6 BT, 6 BTA) ,300 Diesel 0.57 LB489 Yard tractor Off-Highway Trucks Ottawa YT-50 Cummins C 5.9-C (6 BT, 6 BTA) ,300 Diesel 0.57 LB490 Yard tractor Off-Highway Trucks Capacity TJ7000 Cummins C 5.9-C (6 BT, 6 BTA) ,300 Diesel 0.57 LB491 Yard tractor Off-Highway Trucks Capacity TJ7000 Cummins C 5.9-C (6 BT, 6 BTA) ,300 Diesel 0.57 LB492 Yard tractor Off-Highway Trucks Capacity TJ7000 Cummins C 5.9-C (6 BT, 6 BTA) ,300 Diesel 0.57 LB493 Yard tractor Off-Highway Trucks Capacity TJ7000 Cummins C 5.9-C (6 BT, 6 BTA) ,300 Diesel 0.57 LB494 Yard tractor Off-Highway Trucks Capacity TJ7000 Cummins C 5.9-C (6 BT, 6 BTA) ,300 Diesel 0.57 LB495 Yard tractor Off-Highway Trucks Capacity TJ7000 Cummins C 5.9-C (6 BT, 6 BTA) ,300 Diesel 0.57 LB496 Yard tractor Off-Highway Trucks Capacity TJ7000 Cummins C 5.9-C (6 BT, 6 BTA) ,300 Diesel 0.57 LB497 Yard tractor Off-Highway Trucks Capacity TJ7000 Cummins C 5.9-C (6 BT, 6 BTA) ,300 Diesel 0.57 LB498 Yard tractor Off-Highway Trucks Capacity TJ7000 Cummins C 5.9-C (6 BT, 6 BTA) ,300 Diesel 0.57 LB499 Yard tractor Off-Highway Trucks Capacity TJ7000 Cummins C 5.9-C (6 BT, 6 BTA) ,300 Diesel 0.57 LB500 Yard tractor Off-Highway Trucks Capacity TJ7000 Cummins C 5.9-C (6 BT, 6 BTA) ,300 Diesel 0.57 LB501 Yard tractor Off-Highway Trucks Capacity TJ7000 Cummins C 5.9-C (6 BT, 6 BTA) ,300 Diesel 0.57 LB502 Yard tractor Off-Highway Trucks Capacity TJ7000 Cummins C 5.9-C (6 BT, 6 BTA) ,300 Diesel 0.57 LB503 Yard tractor Off-Highway Trucks Capacity TJ7000 Cummins C 5.9-C (6 BT, 6 BTA) ,300 Diesel 0.57 LB504 Yard tractor Off-Highway Trucks Capacity TJ7000 Cummins C 5.9-C (6 BT, 6 BTA) ,300 Diesel 0.57 LB505 Yard tractor Off-Highway Trucks Capacity TJ7000 Cummins C 5.9-C (6 BT, 6 BTA) ,300 Diesel 0.57 LB506 Yard tractor Off-Highway Trucks Capacity TJ7000 Cummins C 5.9-C (6 BT, 6 BTA) ,300 Diesel 0.57 LB507 Yard tractor Off-Highway Trucks Capacity TJ7000 Cummins C 5.9-C (6 BT, 6 BTA) ,300 Diesel 0.57 Starcrest Consulting Group, LLC A-16 March 2004
146 Table A.1 Cargo Handling Equipment List (contd) Annual ID # Port Equip Type OFFROAD Equipment Equipment Engine Engine Model Year HP Activity Fuel LF Equipment Type Make Model (hours) Type LB508 Yard tractor Off-Highway Trucks Capacity TJ7000 Cummins C 5.9-C (6 BT, 6 BTA) ,300 Diesel 0.57 LB509 Yard tractor Off-Highway Trucks Capacity TJ7000 Cummins C 5.9-C (6 BT, 6 BTA) ,300 Diesel 0.57 LB510 Yard tractor Off-Highway Trucks Capacity TJ7000 Cummins C 5.9-C (6 BT, 6 BTA) ,300 Diesel 0.57 LB511 Yard tractor Off-Highway Trucks Capacity TJ7000 Cummins C 5.9-C (6 BT, 6 BTA) ,300 Diesel 0.57 LB512 Yard tractor Off-Highway Trucks Capacity TJ7000 Cummins C 5.9-C (6 BT, 6 BTA) ,300 Diesel 0.57 LB513 Yard tractor Off-Highway Trucks Capacity TJ7000 Cummins C 5.9-C (6 BT, 6 BTA) ,300 Diesel 0.57 LB514 Yard tractor Off-Highway Trucks Ottawa YT-30 Cummins C 5.9-C (6 BT, 6 BTA) ,800 Diesel 0.57 LB515 Yard tractor Off-Highway Trucks Ottawa YT-30 Cummins C 5.9-C (6 BT, 6 BTA) ,800 Diesel 0.57 LB516 Yard tractor Off-Highway Trucks Ottawa YT-30 Cummins C 5.9-C (6 BT, 6 BTA) ,800 Diesel 0.57 LB517 Yard tractor Off-Highway Trucks Ottawa YT-50 Cummins C 5.9-C (6 BT, 6 BTA) ,800 Diesel 0.57 LB518 Yard tractor Off-Highway Trucks Ottawa YT-50 Cummins C 5.9-C (6 BT, 6 BTA) ,800 Diesel 0.57 LB519 Yard tractor Off-Highway Trucks Ottawa YT-50 Cummins C 5.9-C (6 BT, 6 BTA) ,800 Diesel 0.57 LB520 Yard tractor Off-Highway Trucks Ottawa YT-50 Cummins C 5.9-C (6 BT, 6 BTA) ,800 Diesel 0.57 LB521 Yard tractor Off-Highway Trucks Ottawa YT-50 Cummins C 5.9-C (6 BT, 6 BTA) ,800 Diesel 0.57 LB522 Yard tractor Off-Highway Trucks Ottawa YT-50 Cummins C 5.9-C (6 BT, 6 BTA) ,800 Diesel 0.57 LB523 Yard tractor Off-Highway Trucks Ottawa YT-50 Cummins C 5.9-C (6 BT, 6 BTA) ,800 Diesel 0.57 LB524 Yard tractor Off-Highway Trucks Ottawa YT-50 Cummins C 5.9-C (6 BT, 6 BTA) ,800 Diesel 0.57 LB525 Yard tractor Off-Highway Trucks Ottawa YT-50 Cummins C 5.9-C (6 BT, 6 BTA) ,800 Diesel 0.57 LB526 Yard tractor Off-Highway Trucks Ottawa YT-50 Cummins C 5.9-C (6 BT, 6 BTA) ,800 Diesel 0.57 LB527 Yard tractor Off-Highway Trucks Ottawa YT-50 Cummins C 5.9-C (6 BT, 6 BTA) ,800 Diesel 0.57 LB528 Yard tractor Off-Highway Trucks Ottawa YT-50 Cummins C 5.9-C (6 BT, 6 BTA) ,800 Diesel 0.57 LB529 Yard tractor Off-Highway Trucks Ottawa YT-50 Cummins C 5.9-C (6 BT, 6 BTA) ,800 Diesel 0.57 LB530 Yard tractor Off-Highway Trucks Ottawa YT-50 Cummins C 5.9-C (6 BT, 6 BTA) ,800 Diesel 0.57 LB531 Yard tractor Off-Highway Trucks Ottawa YT-50 Cummins C 5.9-C (6 BT, 6 BTA) ,800 Diesel 0.57 LB532 Yard tractor Off-Highway Trucks Ottawa YT-50 Cummins C 5.9-C (6 BT, 6 BTA) ,800 Diesel 0.57 LB533 Yard tractor Off-Highway Trucks Ottawa YT-50 Cummins C 5.9-C (6 BT, 6 BTA) ,800 Diesel 0.57 LB534 Yard tractor Off-Highway Trucks Ottawa YT-50 Cummins C 5.9-C (6 BT, 6 BTA) ,800 Diesel 0.57 LB535 Yard tractor Off-Highway Trucks Ottawa YT-50 Cummins C 5.9-C (6 BT, 6 BTA) ,800 Diesel 0.57 LB536 Yard tractor Off-Highway Trucks Ottawa YT-50 Cummins C 5.9-C (6 BT, 6 BTA) ,800 Diesel 0.57 LB537 Yard tractor Off-Highway Trucks Ottawa YT-50 Cummins C 5.9-C (6 BT, 6 BTA) ,800 Diesel 0.57 LB538 Yard tractor Off-Highway Trucks Ottawa YT-50 Cummins C 5.9-C (6 BT, 6 BTA) ,800 Diesel 0.57 LB539 Yard tractor Off-Highway Trucks Ottawa YT-50 Cummins C 5.9-C (6 BT, 6 BTA) ,800 Diesel 0.57 LB540 Yard tractor Off-Highway Trucks Ottawa YT-50 Cummins C 5.9-C (6 BT, 6 BTA) ,800 Diesel 0.57 LB541 Yard tractor Off-Highway Trucks Ottawa YT-50 Cummins C 5.9-C (6 BT, 6 BTA) ,800 Diesel 0.57 LB542 Yard tractor Off-Highway Trucks Ottawa YT-50 Cummins C 5.9-C (6 BT, 6 BTA) ,800 Diesel 0.57 LB543 Yard tractor Off-Highway Trucks Ottawa YT-50 Cummins C 5.9-C (6 BT, 6 BTA) ,800 Diesel 0.57 LB544 Yard tractor Off-Highway Trucks Ottawa YT-50 Cummins C 5.9-C (6 BT, 6 BTA) ,800 Diesel 0.57 LB545 Yard tractor Off-Highway Trucks Ottawa YT-50 Cummins C 5.9-C (6 BT, 6 BTA) ,800 Diesel 0.57 LB546 Yard tractor Off-Highway Trucks Ottawa YT-50 Cummins C 5.9-C (6 BT, 6 BTA) ,800 Diesel 0.57 Starcrest Consulting Group, LLC A-17 March 2004
147 Table A.1 Cargo Handling Equipment List (contd) Annual ID # Port Equip Type OFFROAD Equipment Equipment Engine Engine Model Year HP Activity Fuel LF Equipment Type Make Model (hours) Type LB547 Yard tractor Off-Highway Trucks Ottawa YT-50 Cummins C 5.9-C (6 BT, 6 BTA) ,800 Diesel 0.57 LB548 Yard tractor Off-Highway Trucks Ottawa YT-50 Cummins C 5.9-C (6 BT, 6 BTA) ,800 Diesel 0.57 LB549 Yard tractor Off-Highway Trucks Ottawa YT-50 Cummins C 5.9-C (6 BT, 6 BTA) ,800 Diesel 0.57 LB550 Yard tractor Off-Highway Trucks Ottawa YT-50 Cummins C 5.9-C (6 BT, 6 BTA) ,800 Diesel 0.57 LB551 Yard tractor Off-Highway Trucks Ottawa YT-50 Cummins C 5.9-C (6 BT, 6 BTA) ,800 Diesel 0.57 LB552 Yard tractor Off-Highway Trucks Ottawa YT-50 Cummins C 5.9-C (6 BT, 6 BTA) ,800 Diesel 0.57 LB553 Yard tractor Off-Highway Trucks Ottawa YT-50 Cummins C 5.9-C (6 BT, 6 BTA) ,800 Diesel 0.57 LB554 Yard tractor Off-Highway Trucks Ottawa YT-50 Cummins C 5.9-C (6 BT, 6 BTA) ,800 Diesel 0.57 LB555 Yard tractor Off-Highway Trucks Ottawa YT-50 Cummins C 5.9-C (6 BT, 6 BTA) ,800 Diesel 0.57 LB556 Yard tractor Off-Highway Trucks Ottawa YT-50 Cummins C 5.9-C (6 BT, 6 BTA) ,800 Diesel 0.57 LB557 Yard tractor Off-Highway Trucks Ottawa YT-50 Cummins C 5.9-C (6 BT, 6 BTA) ,800 Diesel 0.57 LB558 Yard tractor Off-Highway Trucks Ottawa YT-50 Cummins C 5.9-C (6 BT, 6 BTA) ,800 Diesel 0.57 LB559 Yard tractor Off-Highway Trucks Ottawa YT-50 Cummins C 5.9-C (6 BT, 6 BTA) ,800 Diesel 0.57 LB560 Yard tractor Off-Highway Trucks Ottawa YT-50 Cummins C 5.9-C (6 BT, 6 BTA) ,800 Diesel 0.57 LB561 Yard tractor Off-Highway Trucks Ottawa YT-50 Cummins C 5.9-C (6 BT, 6 BTA) ,800 Diesel 0.57 LB562 Yard tractor Off-Highway Trucks Ottawa YT-50 Cummins C 5.9-C (6 BT, 6 BTA) ,800 Diesel 0.57 LB563 Yard tractor Off-Highway Trucks Ottawa YT-50 Cummins C 5.9-C (6 BT, 6 BTA) ,800 Diesel 0.57 LB564 Yard tractor Off-Highway Trucks Ottawa YT-50 Cummins C 5.9-C (6 BT, 6 BTA) ,800 Diesel 0.57 LB565 Yard tractor Off-Highway Trucks Ottawa YT-50 Cummins C 5.9-C (6 BT, 6 BTA) ,800 Diesel 0.57 LB566 Yard tractor Off-Highway Trucks Ottawa YT-50 Cummins C 5.9-C (6 BT, 6 BTA) ,800 Diesel 0.57 LB567 Yard tractor Off-Highway Trucks Capacity TJ7000 Cummins C 5.9-C (6 BT, 6 BTA) ,800 Diesel 0.57 LB568 Yard tractor Off-Highway Trucks Capacity TJ7000 Cummins C 5.9-C (6 BT, 6 BTA) ,800 Diesel 0.57 LB569 Yard tractor Off-Highway Trucks Capacity TJ7000 Cummins C 5.9-C (6 BT, 6 BTA) ,800 Diesel 0.57 LB570 Yard tractor Off-Highway Trucks Ottawa YT-50 Cummins C 5.9-C (6 BT, 6 BTA) ,800 Diesel 0.57 LB571 Yard tractor Off-Highway Trucks Capacity TJ7000 Cummins C 5.9-C (6 BT, 6 BTA) ,800 Diesel 0.57 LB572 Yard tractor Off-Highway Trucks Capacity TJ7000 Cummins C 5.9-C (6 BT, 6 BTA) ,800 Diesel 0.57 LB573 Yard tractor Off-Highway Trucks Capacity TJ7000 Cummins C 5.9-C (6 BT, 6 BTA) ,800 Diesel 0.57 LB574 Yard tractor Off-Highway Trucks Capacity TJ7000 Cummins C 5.9-C (6 BT, 6 BTA) ,800 Diesel 0.57 LB575 Yard tractor Off-Highway Trucks Capacity TJ7000 Cummins C 5.9-C (6 BT, 6 BTA) ,800 Diesel 0.57 LB576 Yard tractor Off-Highway Trucks Capacity TJ7000 Cummins C 5.9-C (6 BT, 6 BTA) ,800 Diesel 0.57 LB577 Yard tractor Off-Highway Trucks Capacity TJ7000 Cummins C 5.9-C (6 BT, 6 BTA) ,800 Diesel 0.57 LB578 Yard tractor Off-Highway Trucks Capacity TJ7000 Cummins C 5.9-C (6 BT, 6 BTA) ,800 Diesel 0.57 LB579 Yard tractor Off-Highway Trucks Capacity TJ7000 Cummins C 5.9-C (6 BT, 6 BTA) ,800 Diesel 0.57 LB580 Yard tractor Off-Highway Trucks Capacity TJ7000 Cummins C 5.9-C (6 BT, 6 BTA) ,800 Diesel 0.57 LB581 Yard tractor Off-Highway Trucks Capacity TJ7000 Cummins C 5.9-C (6 BT, 6 BTA) ,800 Diesel 0.57 LB582 Yard tractor Off-Highway Trucks Ottawa Detroit Diesel 453 T ,190 Diesel 0.57 LB583 Yard tractor Off-Highway Trucks Ottawa Detroit Diesel 453 T ,190 Diesel 0.57 LB584 Yard tractor Off-Highway Trucks Ottawa Detroit Diesel 453 T ,190 Diesel 0.57 LB585 Yard tractor Off-Highway Trucks Ottawa Detroit Diesel 453 T ,190 Diesel 0.57 Starcrest Consulting Group, LLC A-18 March 2004
148 Table A.1 Cargo Handling Equipment List (contd) Annual ID # Port Equip Type OFFROAD Equipment Equipment Engine Engine Model Year HP Activity Fuel LF Equipment Type Make Model (hours) Type LB586 Yard tractor Off-Highway Trucks Ottawa Detroit Diesel 453 T ,190 Diesel 0.57 LB587 Yard tractor Off-Highway Trucks Ottawa Detroit Diesel 453 T ,190 Diesel 0.57 LB588 Yard tractor Off-Highway Trucks Ottawa Detroit Diesel 453 T ,190 Diesel 0.57 LB589 Yard tractor Off-Highway Trucks Ottawa Detroit Diesel 453 T ,190 Diesel 0.57 LB590 Yard tractor Off-Highway Trucks Ottawa Detroit Diesel 453 T ,190 Diesel 0.57 LB591 Yard tractor Off-Highway Trucks Ottawa Detroit Diesel 453 T ,190 Diesel 0.57 LB592 Yard tractor Off-Highway Trucks Ottawa Detroit Diesel 453 T ,190 Diesel 0.57 LB593 Yard tractor Off-Highway Trucks Ottawa Detroit Diesel 453 T ,190 Diesel 0.57 LB594 Yard tractor Off-Highway Trucks Ottawa Detroit Diesel 453 T ,190 Diesel 0.57 LB595 Yard tractor Off-Highway Trucks Ottawa Cummins C 8.3-C (6 CT) ,190 Diesel 0.57 LB596 Yard tractor Off-Highway Trucks Ottawa Cummins C 8.3-C (6 CT) ,190 Diesel 0.57 LB597 Yard tractor Off-Highway Trucks Ottawa Cummins C 8.3-C (6 CT) ,190 Diesel 0.57 LB598 Yard tractor Off-Highway Trucks Ottawa Cummins C 8.3-C (6 CT) ,190 Diesel 0.57 LB599 Yard tractor Off-Highway Trucks Ottawa Cummins C 8.3-C (6 CT) ,190 Diesel 0.57 LB600 Yard tractor Off-Highway Trucks Ottawa Cummins C 8.3-C (6 CT) ,190 Diesel 0.57 LB601 Yard tractor Off-Highway Trucks Ottawa Cummins C 8.3-C (6 CT) ,190 Diesel 0.57 LB602 Yard tractor Off-Highway Trucks Ottawa Cummins C 8.3-C (6 CT) ,190 Diesel 0.57 LB603 Yard tractor Off-Highway Trucks Ottawa Cummins C 8.3-C (6 CT) ,190 Diesel 0.57 LB604 Yard tractor Off-Highway Trucks Ottawa Cummins C 8.3-C (6 CT) ,190 Diesel 0.57 LB605 Yard tractor Off-Highway Trucks Ottawa Cummins C 8.3-C (6 CT) ,190 Diesel 0.57 LB606 Yard tractor Off-Highway Trucks Ottawa Cummins C 8.3-C (6 CT) ,190 Diesel 0.57 LB607 Yard tractor Off-Highway Trucks Ottawa Cummins C 8.3-C (6 CT) ,190 Diesel 0.57 LB608 Yard tractor Off-Highway Trucks Ottawa Cummins C 8.3-C (6 CT) ,190 Diesel 0.57 LB609 Yard tractor Off-Highway Trucks Ottawa Cummins C 8.3-C (6 CT) ,190 Diesel 0.57 LB610 Yard tractor Off-Highway Trucks Ottawa Cummins C 8.3-C (6 CT) ,190 Diesel 0.57 LB611 Yard tractor Off-Highway Trucks Ottawa Cummins C 8.3-C (6 CT) ,190 Diesel 0.57 LB612 Yard tractor Off-Highway Trucks Ottawa Cummins C 8.3-C (6 CT) ,190 Diesel 0.57 LB613 Yard tractor Off-Highway Trucks Ottawa Cummins C 8.3-C (6 CT) ,190 Diesel 0.57 LB614 Yard tractor Off-Highway Trucks Ottawa Cummins C 8.3-C (6 CT) ,190 Diesel 0.57 LB615 Yard tractor Off-Highway Trucks Ottawa Cummins C 8.3-C (6 CT) ,190 Diesel 0.57 LB616 Yard tractor Off-Highway Trucks Ottawa Cummins C 8.3-C (6 CT) ,190 Diesel 0.57 LB617 Yard tractor Off-Highway Trucks Ottawa Cummins C 8.3-C (6 CT) ,190 Diesel 0.57 LB618 Yard tractor Off-Highway Trucks Ottawa Cummins C 8.3-C (6 CT) ,190 Diesel 0.57 LB619 Yard tractor Off-Highway Trucks Ottawa Cummins C 8.3-C (6 CT) ,190 Diesel 0.57 LB620 Yard tractor Off-Highway Trucks Ottawa Cummins C 8.3-C (6 CT) ,190 Diesel 0.57 LB621 Yard tractor Off-Highway Trucks Ottawa Cummins C 8.3-C (6 CT) ,190 Diesel 0.57 LB622 Yard tractor Off-Highway Trucks Ottawa Cummins C 8.3-C (6 CT) ,190 Diesel 0.57 LB623 Yard tractor Off-Highway Trucks Ottawa Cummins C 8.3-C (6 CT) ,190 Diesel 0.57 LB624 Yard tractor Off-Highway Trucks Ottawa Cummins C 8.3-C (6 CT) ,190 Diesel 0.57 Starcrest Consulting Group, LLC A-19 March 2004
149 Table A.1 Cargo Handling Equipment List (contd) Annual ID # Port Equip Type OFFROAD Equipment Equipment Engine Engine Model Year HP Activity Fuel LF Equipment Type Make Model (hours) Type LB625 Yard tractor Off-Highway Trucks Ottawa Cummins C 8.3-C (6 CT) ,190 Diesel 0.57 LB626 Yard tractor Off-Highway Trucks Ottawa Cummins C 8.3-C (6 CT) ,190 Diesel 0.57 LB627 Yard tractor Off-Highway Trucks Ottawa Cummins C 8.3-C (6 CT) ,190 Diesel 0.57 LB628 Yard tractor Off-Highway Trucks Ottawa Cummins C 8.3-C (6 CT) ,190 Diesel 0.57 LB629 Yard tractor Off-Highway Trucks Ottawa Cummins C 8.3-C (6 CT) ,190 Diesel 0.57 LB630 Yard tractor Off-Highway Trucks Ottawa Cummins C 8.3-C (6 CT) ,190 Diesel 0.57 LB631 Yard tractor Off-Highway Trucks Ottawa Cummins C 8.3-C (6 CT) ,190 Diesel 0.57 LB632 Yard tractor Off-Highway Trucks Ottawa Cummins C 8.3-C (6 CT) ,190 Diesel 0.57 LB633 Yard tractor Off-Highway Trucks Ottawa Cummins C 8.3-C (6 CT) ,190 Diesel 0.57 LB634 Yard tractor Off-Highway Trucks Ottawa Cummins C 8.3-C (6 CT) ,190 Diesel 0.57 LB635 Yard tractor Off-Highway Trucks Ottawa Cummins C 8.3-C (6 CT) ,190 Diesel 0.57 LB636 Yard tractor Off-Highway Trucks Ottawa Cummins C 8.3-C (6 CT) ,190 Diesel 0.57 LB637 Yard tractor Off-Highway Trucks Ottawa Cummins C 8.3-C (6 CT) ,190 Diesel 0.57 LB638 Yard tractor Off-Highway Trucks Ottawa Cummins C 8.3-C (6 CT) ,190 Diesel 0.57 LB639 Yard tractor Off-Highway Trucks Ottawa Cummins C 8.3-C (6 CT) ,190 Diesel 0.57 LB640 Yard tractor Off-Highway Trucks Ottawa Cummins C 8.3-C (6 CT) ,190 Diesel 0.57 LB641 Yard tractor Off-Highway Trucks Ottawa Cummins C 8.3-C (6 CT) ,190 Diesel 0.57 LB642 Yard tractor Off-Highway Trucks Sisu Cummins C 5.9-C (6 BT, 6 BTA) ,400 Diesel 0.57 LB643 Yard tractor Off-Highway Trucks Sisu Cummins C 5.9-C (6 BT, 6 BTA) ,400 Diesel 0.57 LB644 Yard tractor Off-Highway Trucks Sisu Cummins C 5.9-C (6 BT, 6 BTA) ,400 Diesel 0.57 LB645 Yard tractor Off-Highway Trucks Sisu Cummins C 5.9-C (6 BT, 6 BTA) ,400 Diesel 0.57 LB646 Yard tractor Off-Highway Trucks Sisu Cummins C 5.9-C (6 BT, 6 BTA) ,400 Diesel 0.57 LB647 Yard tractor Off-Highway Trucks Sisu Cummins C 5.9-C (6 BT, 6 BTA) ,400 Diesel 0.57 LB648 Yard tractor Off-Highway Trucks Sisu Cummins C 5.9-C (6 BT, 6 BTA) ,400 Diesel 0.57 LB649 Yard tractor Off-Highway Trucks Sisu Cummins C 5.9-C (6 BT, 6 BTA) ,400 Diesel 0.57 LB650 Yard tractor Off-Highway Trucks Sisu Cummins C 5.9-C (6 BT, 6 BTA) ,400 Diesel 0.57 LB651 Yard tractor Off-Highway Trucks Sisu Cummins C 5.9-C (6 BT, 6 BTA) ,400 Diesel 0.57 LB652 Yard tractor Off-Highway Trucks Sisu Cummins C 5.9-C (6 BT, 6 BTA) ,400 Diesel 0.57 LB653 Yard tractor Off-Highway Trucks Sisu Cummins C 5.9-C (6 BT, 6 BTA) ,400 Diesel 0.57 LB654 Yard tractor Off-Highway Trucks Sisu Cummins C 5.9-C (6 BT, 6 BTA) ,400 Diesel 0.57 LB655 Yard tractor Off-Highway Trucks Sisu Cummins C 5.9-C (6 BT, 6 BTA) ,400 Diesel 0.57 LB656 Yard tractor Off-Highway Trucks Sisu Cummins C 5.9-C (6 BT, 6 BTA) ,400 Diesel 0.57 LB657 Yard tractor Off-Highway Trucks Sisu Cummins C 5.9-C (6 BT, 6 BTA) ,400 Diesel 0.57 LB658 Yard tractor Off-Highway Trucks Sisu Cummins C 5.9-C (6 BT, 6 BTA) ,400 Diesel 0.57 LB659 Yard tractor Off-Highway Trucks Sisu Cummins C 5.9-C (6 BT, 6 BTA) ,400 Diesel 0.57 LB660 Yard tractor Off-Highway Trucks Sisu Cummins C 5.9-C (6 BT, 6 BTA) ,400 Diesel 0.57 LB661 Yard tractor Off-Highway Trucks Sisu Cummins C 5.9-C (6 BT, 6 BTA) ,400 Diesel 0.57 LB662 Yard tractor Off-Highway Trucks Sisu Cummins C 5.9-C (6 BT, 6 BTA) ,400 Diesel 0.57 LB663 Yard tractor Off-Highway Trucks Sisu Cummins C 5.9-C (6 BT, 6 BTA) ,400 Diesel 0.57 Starcrest Consulting Group, LLC A-20 March 2004
150 Table A.1 Cargo Handling Equipment List (contd) Annual ID # Port Equip Type OFFROAD Equipment Equipment Engine Engine Model Year HP Activity Fuel LF Equipment Type Make Model (hours) Type LB664 Yard tractor Off-Highway Trucks Sisu Cummins C 5.9-C (6 BT, 6 BTA) ,400 Diesel 0.57 LB665 Yard tractor Off-Highway Trucks Sisu Cummins C 5.9-C (6 BT, 6 BTA) ,400 Diesel 0.57 LB666 Yard tractor Off-Highway Trucks Sisu Cummins C 5.9-C (6 BT, 6 BTA) ,400 Diesel 0.57 LB667 Yard tractor Off-Highway Trucks Sisu Cummins C 5.9-C (6 BT, 6 BTA) ,400 Diesel 0.57 LB668 Yard tractor Off-Highway Trucks Sisu Cummins C 5.9-C (6 BT, 6 BTA) ,400 Diesel 0.57 LB669 Yard tractor Off-Highway Trucks Sisu Cummins C 5.9-C (6 BT, 6 BTA) ,400 Diesel 0.57 LB670 Yard tractor Off-Highway Trucks Ottawa Cummins C 5.9-C (6 BT, 6 BTA) ,400 Diesel 0.57 LB671 Yard tractor Off-Highway Trucks Ottawa Cummins C 5.9-C (6 BT, 6 BTA) ,400 Diesel 0.57 LB672 Yard tractor Off-Highway Trucks Ottawa Cummins C 5.9-C (6 BT, 6 BTA) ,400 Diesel 0.57 LB673 Yard tractor Off-Highway Trucks Ottawa Cummins C 5.9-C (6 BT, 6 BTA) ,400 Diesel 0.57 LB674 Yard tractor Off-Highway Trucks Ottawa Cummins C 5.9-C (6 BT, 6 BTA) ,400 Diesel 0.57 LB675 Yard tractor Off-Highway Trucks Ottawa Cummins C 5.9-C (6 BT, 6 BTA) ,400 Diesel 0.57 LB676 Yard tractor Off-Highway Trucks Ottawa Cummins C 5.9-C (6 BT, 6 BTA) ,400 Diesel 0.57 LB677 Yard tractor Off-Highway Trucks Ottawa Cummins C 5.9-C (6 BT, 6 BTA) ,400 Diesel 0.57 LB678 Yard tractor Off-Highway Trucks Ottawa Cummins C 5.9-C (6 BT, 6 BTA) ,400 Diesel 0.57 LB679 Yard tractor Off-Highway Trucks Ottawa Cummins C 5.9-C (6 BT, 6 BTA) ,400 Diesel 0.57 LB680 Yard tractor Off-Highway Trucks Ottawa Cummins C 5.9-C (6 BT, 6 BTA) ,400 Diesel 0.57 LB681 Yard tractor Off-Highway Trucks Ottawa Cummins C 5.9-C (6 BT, 6 BTA) ,400 Diesel 0.57 LB682 Yard tractor Off-Highway Trucks Ottawa Cummins C 5.9-C (6 BT, 6 BTA) ,400 Diesel 0.57 LB683 Yard tractor Off-Highway Trucks Ottawa Cummins C 5.9-C (6 BT, 6 BTA) ,400 Diesel 0.57 LB684 Yard tractor Off-Highway Trucks Ottawa Cummins C 5.9-C (6 BT, 6 BTA) ,400 Diesel 0.57 LB685 Yard tractor Off-Highway Trucks Ottawa Cummins C 5.9-C (6 BT, 6 BTA) ,400 Diesel 0.57 LB686 Yard tractor Off-Highway Trucks Ottawa Cummins C 5.9-C (6 BT, 6 BTA) ,400 Diesel 0.57 LB687 Yard tractor Off-Highway Trucks Ottawa Cummins C 5.9-C (6 BT, 6 BTA) ,400 Diesel 0.57 LB688 Yard tractor Off-Highway Trucks Ottawa Cummins C 5.9-C (6 BT, 6 BTA) ,400 Diesel 0.57 LB689 Yard tractor Off-Highway Trucks Ottawa Cummins C 5.9-C (6 BT, 6 BTA) ,400 Diesel 0.57 LB690 Yard tractor Off-Highway Trucks Ottawa Cummins C 5.9-C (6 BT, 6 BTA) ,400 Diesel 0.57 LB691 Yard tractor Off-Highway Trucks Ottawa Cummins C 5.9-C (6 BT, 6 BTA) ,400 Diesel 0.57 LB692 Yard tractor Off-Highway Trucks Ottawa Cummins C 5.9-C (6 BT, 6 BTA) ,400 Diesel 0.57 LB693 Yard tractor Off-Highway Trucks Ottawa Cummins C 5.9-C (6 BT, 6 BTA) ,400 Diesel 0.57 LB694 Yard tractor Off-Highway Trucks Ottawa Cummins C 5.9-C (6 BT, 6 BTA) ,400 Diesel 0.57 LB695 Yard tractor Off-Highway Trucks Ottawa Cummins C 5.9-C (6 BT, 6 BTA) ,400 Diesel 0.57 LB696 Yard tractor Off-Highway Trucks Ottawa Cummins C 5.9-C (6 BT, 6 BTA) ,400 Diesel 0.57 LB697 Yard tractor Off-Highway Trucks Ottawa Cummins C 5.9-C (6 BT, 6 BTA) ,400 Diesel 0.57 LB698 Yard tractor Off-Highway Trucks Ottawa Cummins C 5.9-C (6 BT, 6 BTA) ,400 Diesel 0.57 LB699 Yard tractor Off-Highway Trucks Ottawa Cummins C 5.9-C (6 BT, 6 BTA) ,400 Diesel 0.57 LB700 Yard tractor Off-Highway Trucks Ottawa Cummins C 5.9-C (6 BT, 6 BTA) ,400 Diesel 0.57 LB701 Yard tractor Off-Highway Trucks Ottawa Cummins C 5.9-C (6 BT, 6 BTA) ,400 Diesel 0.57 LB702 Yard tractor Off-Highway Trucks Ottawa Cummins C 5.9-C (6 BT, 6 BTA) ,400 Diesel 0.57 Starcrest Consulting Group, LLC A-21 March 2004
151 Table A.1 Cargo Handling Equipment List (contd) Annual ID # Port Equip Type OFFROAD Equipment Equipment Engine Engine Model Year HP Activity Fuel LF Equipment Type Make Model (hours) Type LB703 Yard tractor Off-Highway Trucks Ottawa Cummins C 5.9-C (6 BT, 6 BTA) ,400 Diesel 0.57 LB704 Yard tractor Off-Highway Trucks Ottawa Cummins C 5.9-C (6 BT, 6 BTA) ,400 Diesel 0.57 LB705 Yard tractor Off-Highway Trucks Ottawa Cummins C 5.9-C (6 BT, 6 BTA) ,400 Diesel 0.57 LB706 Yard tractor Off-Highway Trucks Ottawa Cummins C 5.9-C (6 BT, 6 BTA) ,400 Diesel 0.57 LB707 Yard tractor Off-Highway Trucks Ottawa Cummins C 5.9-C (6 BT, 6 BTA) ,400 Diesel 0.57 LB708 Yard tractor Off-Highway Trucks Ottawa Cummins C 5.9-C (6 BT, 6 BTA) ,400 Diesel 0.57 LB709 Yard tractor Off-Highway Trucks Ottawa Cummins C 5.9-C (6 BT, 6 BTA) ,400 Diesel 0.57 LB710 Yard tractor Off-Highway Trucks Ottawa Cummins C 5.9-C (6 BT, 6 BTA) ,400 Diesel 0.57 LB711 Yard tractor Off-Highway Trucks Ottawa Cummins C 5.9-C (6 BT, 6 BTA) ,400 Diesel 0.57 LB712 Yard tractor Off-Highway Trucks Ottawa Cummins C 5.9-C (6 BT, 6 BTA) ,400 Diesel 0.57 LB713 Yard tractor Off-Highway Trucks Ottawa Cummins C 5.9-C (6 BT, 6 BTA) ,400 Diesel 0.57 LB714 Yard tractor Off-Highway Trucks Ottawa Cummins C 5.9-C (6 BT, 6 BTA) ,400 Diesel 0.57 LB715 Yard tractor Off-Highway Trucks Ottawa Cummins C 5.9-C (6 BT, 6 BTA) ,400 Diesel 0.57 LB716 Yard tractor Off-Highway Trucks Ottawa Cummins C 5.9-C (6 BT, 6 BTA) ,400 Diesel 0.57 LB717 Yard tractor Off-Highway Trucks Ottawa Cummins C 5.9-C (6 BT, 6 BTA) ,400 Diesel 0.57 LB718 Yard tractor Off-Highway Trucks Ottawa Cummins C 5.9-C (6 BT, 6 BTA) ,400 Diesel 0.57 LB719 Yard tractor Off-Highway Trucks Ottawa Cummins C 5.9-C (6 BT, 6 BTA) ,400 Diesel 0.57 LB720 Yard tractor Off-Highway Trucks Ottawa Cummins C 5.9-C (6 BT, 6 BTA) ,400 Diesel 0.57 LB721 Yard tractor Off-Highway Trucks Ottawa Cummins C 5.9-C (6 BT, 6 BTA) ,400 Diesel 0.57 LB722 Yard tractor Off-Highway Trucks Ottawa Cummins C 5.9-C (6 BT, 6 BTA) ,400 Diesel 0.57 LB723 Yard tractor Off-Highway Trucks Ottawa Cummins C 5.9-C (6 BT, 6 BTA) ,400 Diesel 0.57 LB724 Yard tractor Off-Highway Trucks Ottawa Cummins C 5.9-C (6 BT, 6 BTA) ,400 Diesel 0.57 LB725 Yard tractor Off-Highway Trucks Ottawa Cummins C 5.9-C (6 BT, 6 BTA) ,400 Diesel 0.57 LB726 Yard tractor Off-Highway Trucks Ottawa Cummins C 5.9-C (6 BT, 6 BTA) ,400 Diesel 0.57 LB727 Yard tractor Off-Highway Trucks Ottawa Cummins C 5.9-C (6 BT, 6 BTA) ,400 Diesel 0.57 LB728 Yard tractor Off-Highway Trucks Ottawa Cummins C 5.9-C (6 BT, 6 BTA) ,400 Diesel 0.57 LB729 Yard tractor Off-Highway Trucks Ottawa Cummins C 5.9-C (6 BT, 6 BTA) ,400 Diesel 0.57 LB730 Yard tractor Off-Highway Trucks Ottawa Cummins C 5.9-C (6 BT, 6 BTA) ,400 Diesel 0.57 LB731 Yard tractor Off-Highway Trucks Ottawa Cummins C 5.9-C (6 BT, 6 BTA) ,400 Diesel 0.57 LB732 Yard tractor Off-Highway Trucks Ottawa Cummins C 5.9-C (6 BT, 6 BTA) ,400 Diesel 0.57 LB733 Yard tractor Off-Highway Trucks Ottawa Cummins C 5.9-C (6 BT, 6 BTA) ,400 Diesel 0.57 LB734 Yard tractor Off-Highway Trucks Ottawa Cummins C 5.9-C (6 BT, 6 BTA) ,400 Diesel 0.57 LB735 Yard tractor Off-Highway Trucks Ottawa Cummins C 5.9-C (6 BT, 6 BTA) ,400 Diesel 0.57 LB736 Yard tractor Off-Highway Trucks Ottawa Cummins C 5.9-C (6 BT, 6 BTA) ,400 Diesel 0.57 LB737 Yard tractor Off-Highway Trucks Ottawa Cummins C 5.9-C (6 BT, 6 BTA) ,400 Diesel 0.57 LB738 Yard tractor Off-Highway Trucks Ottawa Cummins C 5.9-C (6 BT, 6 BTA) ,400 Diesel 0.57 LB739 Yard tractor Off-Highway Trucks Ottawa Cummins C 5.9-C (6 BT, 6 BTA) ,400 Diesel 0.57 LB740 Yard tractor Off-Highway Trucks Ottawa Cummins C 5.9-C (6 BT, 6 BTA) ,400 Diesel 0.57 LB741 Yard tractor Off-Highway Trucks Ottawa Cummins C 5.9-C (6 BT, 6 BTA) ,400 Diesel 0.57 Starcrest Consulting Group, LLC A-22 March 2004
152 Table A.1 Cargo Handling Equipment List (contd) Annual ID # Port Equip Type OFFROAD Equipment Equipment Engine Engine Model Year HP Activity Fuel LF Equipment Type Make Model (hours) Type LB742 Yard tractor Off-Highway Trucks Ottawa Cummins C 5.9-C (6 BT, 6 BTA) ,400 Diesel 0.57 LB743 Yard tractor Off-Highway Trucks Ottawa Cummins C 5.9-C (6 BT, 6 BTA) ,400 Diesel 0.57 LB744 Yard tractor Off-Highway Trucks Ottawa Cummins C 5.9-C (6 BT, 6 BTA) ,400 Diesel 0.57 LB745 Yard tractor Off-Highway Trucks Ottawa Cummins C 5.9-C (6 BT, 6 BTA) ,400 Diesel 0.57 LB746 Yard tractor Off-Highway Trucks Ottawa Cummins C 5.9-C (6 BT, 6 BTA) ,400 Diesel 0.57 LB747 Yard tractor Off-Highway Trucks Ottawa Cummins C 5.9-C (6 BT, 6 BTA) ,400 Diesel 0.57 LB748 Yard tractor Off-Highway Trucks Ottawa Cummins C 5.9-C (6 BT, 6 BTA) ,400 Diesel 0.57 LB749 Yard tractor Off-Highway Trucks Ottawa Cummins C 5.9-C (6 BT, 6 BTA) ,400 Diesel 0.57 LB750 Yard tractor Off-Highway Trucks Ottawa Cummins C 5.9-C (6 BT, 6 BTA) ,400 Diesel 0.57 LB751 Yard tractor Off-Highway Trucks Ottawa Cummins C 5.9-C (6 BT, 6 BTA) ,400 Diesel 0.57 LB752 Yard tractor Off-Highway Trucks Ottawa Cummins C 5.9-C (6 BT, 6 BTA) ,400 Diesel 0.57 LB753 Yard tractor Off-Highway Trucks Ottawa Cummins C 5.9-C (6 BT, 6 BTA) ,400 Diesel 0.57 LB754 Yard tractor Off-Highway Trucks Ottawa Cummins C 5.9-C (6 BT, 6 BTA) ,400 Diesel 0.57 LB755 Yard tractor Off-Highway Trucks Ottawa Cummins C 5.9-C (6 BT, 6 BTA) ,400 Diesel 0.57 LB756 Yard tractor Off-Highway Trucks Ottawa Cummins C 5.9-C (6 BT, 6 BTA) ,400 Diesel 0.57 LB757 Yard tractor Off-Highway Trucks Ottawa Cummins C 5.9-C (6 BT, 6 BTA) ,400 Diesel 0.57 LB758 Yard tractor Off-Highway Trucks Ottawa Cummins C 5.9-C (6 BT, 6 BTA) ,400 Diesel 0.57 LB759 Yard tractor Off-Highway Trucks Ottawa Cummins C 5.9-C (6 BT, 6 BTA) ,400 Diesel 0.57 LB760 Yard tractor Off-Highway Trucks Ottawa Cummins C 5.9-C (6 BT, 6 BTA) ,400 Diesel 0.57 LB761 Yard tractor Off-Highway Trucks Ottowa C-50 Cummins C8.3L ,024 Diesel 0.57 LB762 Yard tractor Off-Highway Trucks Ottowa C-50 Cummins C8.3L ,024 Diesel 0.57 LB763 Yard tractor Off-Highway Trucks Ottowa C-50 Cummins C8.3L ,024 Diesel 0.57 LB764 Yard tractor Off-Highway Trucks Ottowa YT-30 Cummins C8.3L ,024 Diesel 0.57 LB765 Yard tractor Off-Highway Trucks Ottowa C-50 Cummins C8.3L ,024 Diesel 0.57 LB766 Yard tractor Off-Highway Trucks Ottowa C-50 Cummins C8.3L ,024 Diesel 0.57 LB767 Yard tractor Off-Highway Trucks Ottowa C-50 Cummins C8.3L ,024 Diesel 0.57 LB768 Yard tractor Off-Highway Trucks Ottowa YT-30 Cummins C8.3L ,024 Diesel 0.57 LB769 Yard tractor Off-Highway Trucks Ottowa C-50 Cummins C8.3L ,024 Diesel 0.57 LB770 Yard tractor Off-Highway Trucks Ottowa C-50 Cummins C8.3L ,024 Diesel 0.57 LB771 Yard tractor Off-Highway Trucks Ottowa YT-30 Cummins C8.3L ,024 Diesel 0.57 LB772 Yard tractor Off-Highway Trucks Ottowa YT-30 Cummins C8.3L ,024 Diesel 0.57 LB773 Yard tractor Off-Highway Trucks Ottowa C-50 Cummins C8.3L ,024 Diesel 0.57 LB774 Yard tractor Off-Highway Trucks Ottowa C-50 Cummins C8.3L ,024 Diesel 0.57 LB775 Yard tractor Off-Highway Trucks Ottowa C-50 Cummins C8.3L ,024 Diesel 0.57 LB776 Yard tractor Off-Highway Trucks Ottowa C-50 Cummins C8.3L ,024 Diesel 0.57 LB777 Yard tractor Off-Highway Trucks Ottowa C-50 Cummins C8.3L ,024 Diesel 0.57 LB778 Yard tractor Off-Highway Trucks Ottowa C-50 Cummins C8.3L ,024 Diesel 0.57 LB779 Yard tractor Off-Highway Trucks Ottowa C-50 Cummins C8.3L ,024 Diesel 0.57 LB780 Yard tractor Off-Highway Trucks Ottowa C-50 Cummins C8.3L ,024 Diesel 0.57 Starcrest Consulting Group, LLC A-23 March 2004
153 Table A.1 Cargo Handling Equipment List (contd) Annual ID # Port Equip Type OFFROAD Equipment Equipment Engine Engine Model Year HP Activity Fuel LF Equipment Type Make Model (hours) Type LB781 Yard tractor Off-Highway Trucks Ottowa C-50 Cummins C8.3L ,024 Diesel 0.57 LB782 Yard tractor Off-Highway Trucks Ottowa C-50 Cummins C8.3L ,024 Diesel 0.57 LB783 Yard tractor Off-Highway Trucks Ottowa C-50 Cummins C8.3L ,024 Diesel 0.57 LB784 Yard tractor Off-Highway Trucks Ottowa C-50 Cummins C8.3L ,024 Diesel 0.57 LB785 Yard tractor Off-Highway Trucks Ottowa C-50 Cummins C8.3L ,024 Diesel 0.57 LB786 Yard tractor Off-Highway Trucks Ottowa C-50 Cummins C8.3L ,024 Diesel 0.57 LB787 Yard tractor Off-Highway Trucks Ottowa C-50 Cummins C8.3L ,024 Diesel 0.57 LB788 Yard tractor Off-Highway Trucks Ottowa C-50 Cummins C8.3L ,024 Diesel 0.57 LB789 Yard tractor Off-Highway Trucks Ottowa C-50 Cummins C8.3L ,024 Diesel 0.57 LB790 Yard tractor Off-Highway Trucks Ottowa C-50 Cummins C8.3L ,024 Diesel 0.57 LB791 Yard tractor Off-Highway Trucks Ottowa C-50 Cummins C8.3L ,024 Diesel 0.57 LB792 Yard tractor Off-Highway Trucks Ottowa C-50 Cummins C8.3L ,024 Diesel 0.57 LB793 Yard tractor Off-Highway Trucks Ottowa C-50 Cummins C8.3L ,024 Diesel 0.57 LB794 Yard tractor Off-Highway Trucks Ottowa C-50 Cummins C8.3L ,024 Diesel 0.57 LB795 Yard tractor Off-Highway Trucks Ottowa C-50 Cummins C8.3L ,024 Diesel 0.57 LB796 Yard tractor Off-Highway Trucks Ottowa C-50 Cummins C8.3L ,024 Diesel 0.57 LB797 Yard tractor Off-Highway Trucks Ottowa C-50 Cummins C8.3L ,024 Diesel 0.57 LB798 Yard tractor Off-Highway Trucks Ottowa C-50 Cummins C8.3L ,024 Diesel 0.57 LB799 Yard tractor Off-Highway Trucks Ottowa C-50 Cummins C8.3L ,024 Diesel 0.57 LB800 Yard tractor Off-Highway Trucks Ottowa C-50 Cummins C8.3L ,024 Diesel 0.57 LB801 Yard tractor Off-Highway Trucks Ottowa C-50 Cummins C8.3L ,024 Diesel 0.57 LB802 Yard tractor Off-Highway Trucks Ottowa C-50 Cummins C8.3L ,024 Diesel 0.57 LB803 Yard tractor Off-Highway Trucks Ottowa C-50 Cummins C8.3L ,024 Diesel 0.57 LB804 Yard tractor Off-Highway Trucks Ottowa C-50 Cummins C8.3L ,024 Diesel 0.57 LB805 Yard tractor Off-Highway Trucks Ottowa C-50 Cummins C8.3L ,024 Diesel 0.57 LB806 Yard tractor Off-Highway Trucks Ottowa C-50 Cummins C8.3L ,024 Diesel 0.57 LB807 Yard tractor Off-Highway Trucks Ottowa C-50 Cummins C8.3L ,024 Diesel 0.57 LB808 Yard tractor Off-Highway Trucks Ottowa C-50 Cummins C8.3L ,024 Diesel 0.57 LB809 Yard tractor Off-Highway Trucks Ottowa C-50 Cummins C8.3L ,024 Diesel 0.57 LB810 Yard tractor Off-Highway Trucks Ottowa C-50 Cummins C8.3L ,024 Diesel 0.57 LB811 Yard tractor Off-Highway Trucks Ottowa C-50 Cummins C8.3L ,024 Diesel 0.57 LB812 Yard tractor Off-Highway Trucks Ottowa C-50 Cummins C8.3L ,024 Diesel 0.57 LB813 Yard tractor Off-Highway Trucks Ottowa C-50 Cummins C8.3L ,024 Diesel 0.57 LB814 Yard tractor Off-Highway Trucks Ottowa C-50 Cummins C8.3L ,024 Diesel 0.57 LB815 Yard tractor Off-Highway Trucks Ottowa C-50 Cummins C8.3L ,024 Diesel 0.57 LB816 Yard tractor Off-Highway Trucks Ottowa C-50 Cummins C8.3L ,024 Diesel 0.57 LB817 Yard tractor Off-Highway Trucks Ottowa C-50 Cummins C8.3L ,024 Diesel 0.57 LB818 Yard tractor Off-Highway Trucks Ottowa C-50 Cummins C8.3L ,024 Diesel 0.57 LB819 Yard tractor Off-Highway Trucks Ottowa C-50 Cummins C8.3L ,024 Diesel 0.57 Starcrest Consulting Group, LLC A-24 March 2004
154 Table A.1 Cargo Handling Equipment List (contd) Annual ID # Port Equip Type OFFROAD Equipment Equipment Engine Engine Model Year HP Activity Fuel LF Equipment Type Make Model (hours) Type LB820 Yard tractor Off-Highway Trucks Ottowa C-50 Cummins C8.3L ,024 Diesel 0.57 LB821 Yard tractor Off-Highway Trucks Ottowa C-50 Cummins C8.3L ,024 Diesel 0.57 LB822 Yard tractor Off-Highway Trucks Ottowa C-50 Cummins C8.3L ,024 Diesel 0.57 LB823 Yard tractor Off-Highway Trucks Ottowa C-50 Cummins C8.3L ,024 Diesel 0.57 LB824 Yard tractor Off-Highway Trucks Ottowa YT-30 Cummins C8.3L ,024 Diesel 0.57 LB825 Yard tractor Off-Highway Trucks Ottowa YT-30 Cummins C8.3L ,024 Diesel 0.57 LB826 Yard tractor Off-Highway Trucks Ottowa YT-30 Cummins C8.3L ,024 Diesel 0.57 LB827 Yard tractor Off-Highway Trucks Ottowa YT-30 Cummins C8.3L ,024 Diesel 0.57 LB828 Yard tractor Off-Highway Trucks Ottowa YT-30 Cummins C8.3L ,024 Diesel 0.57 LB829 Yard tractor Off-Highway Trucks Ottowa YT-30 Cummins C8.3L ,024 Diesel 0.57 LB830 Yard tractor Off-Highway Trucks Ottowa YT-30 Cummins C8.3L ,024 Diesel 0.57 LB831 Yard tractor Off-Highway Trucks Ottowa YT-30 Cummins C8.3L ,024 Diesel 0.57 LB832 Yard tractor Off-Highway Trucks Ottowa YT-30 Cummins C8.3L ,024 Diesel 0.57 LB833 Yard tractor Off-Highway Trucks Ottowa YT-30 Cummins C8.3L ,024 Diesel 0.57 LB834 Yard tractor Off-Highway Trucks Ottowa YT-30 Cummins C8.3L ,024 Diesel 0.57 LB835 Yard tractor Off-Highway Trucks Ottowa YT-30 Cummins C8.3L ,024 Diesel 0.57 LB836 Yard tractor Off-Highway Trucks Ottowa YT-30 Cummins C8.3L ,024 Diesel 0.57 LB837 Yard tractor Off-Highway Trucks Ottowa YT-30 Cummins C8.3L ,024 Diesel 0.57 LB838 Yard tractor Off-Highway Trucks Ottowa YT-30 Cummins C8.3L ,024 Diesel 0.57 LB839 Yard tractor Off-Highway Trucks Ottowa YT-30 Cummins C8.3L ,024 Diesel 0.57 LB840 Yard tractor Off-Highway Trucks Ottowa C-50 Cummins C8.3L ,024 Diesel 0.57 LB841 Yard tractor Off-Highway Trucks Ottowa C-50 Cummins C8.3L ,024 Diesel 0.57 LB842 Yard tractor Off-Highway Trucks Ottowa C-50 Cummins C8.3L ,024 Diesel 0.57 LB843 Yard tractor Off-Highway Trucks Ottowa C-50 Cummins C8.3L ,024 Diesel 0.57 LB844 Yard tractor Off-Highway Trucks Ottowa C-50 Cummins C8.3L ,024 Diesel 0.57 LB845 Yard tractor Off-Highway Trucks Ottowa C-50 Cummins C8.3L ,024 Diesel 0.57 LB846 Yard tractor Off-Highway Trucks Ottowa C-50 Cummins C8.3L ,024 Diesel 0.57 LB847 Yard tractor Off-Highway Trucks Ottowa C-50 Cummins C8.3L ,024 Diesel 0.57 LB848 Yard tractor Off-Highway Trucks Ottowa C-50 Cummins C8.3L ,024 Diesel 0.57 LB849 Yard tractor Off-Highway Trucks Ottowa C-50 Cummins C8.3L ,024 Diesel 0.57 LB850 Yard tractor Off-Highway Trucks Ottowa C-50 Cummins B5.9L ,024 Diesel 0.57 LB851 Yard tractor Off-Highway Trucks Ottowa C-50 Cummins B5.9L ,024 Diesel 0.57 LB852 Yard tractor Off-Highway Trucks Ottowa C-50 Cummins B5.9L ,024 Diesel 0.57 LB853 Yard tractor Off-Highway Trucks Ottowa C-50 Cummins B5.9L ,024 Diesel 0.57 LB854 Yard tractor Off-Highway Trucks Ottowa C-50 Cummins B5.9L ,024 Diesel 0.57 LB855 Yard tractor Off-Highway Trucks Ottowa C-50 Cummins B5.9L ,024 Diesel 0.57 LB856 Yard tractor Off-Highway Trucks Ottowa C-50 Cummins B5.9L ,024 Diesel 0.57 LB857 Yard tractor Off-Highway Trucks Ottowa C-50 Cummins B5.9L ,024 Diesel 0.57 LB858 Yard tractor Off-Highway Trucks Ottowa C-50 Cummins B5.9L ,024 Diesel 0.57 Starcrest Consulting Group, LLC A-25 March 2004
155 Table A.1 Cargo Handling Equipment List (contd) Annual ID # Port Equip Type OFFROAD Equipment Equipment Engine Engine Model Year HP Activity Fuel LF Equipment Type Make Model (hours) Type LB859 Yard tractor Off-Highway Trucks Ottowa C-50 Cummins B5.9L ,024 Diesel 0.57 LB860 Yard tractor Off-Highway Trucks Ottowa C-50 Cummins B5.9L ,024 Diesel 0.57 LB861 Yard tractor Off-Highway Trucks Ottowa C-50 Cummins B5.9L ,024 Diesel 0.57 LB862 Yard tractor Off-Highway Trucks Ottowa C-50 Cummins B5.9L ,024 Diesel 0.57 LB863 Yard tractor Off-Highway Trucks Ottowa C-50 Cummins B5.9L ,024 Diesel 0.57 LB864 Yard tractor Off-Highway Trucks Ottowa C-50 Cummins B5.9L ,024 Diesel 0.57 LB865 Yard tractor Off-Highway Trucks Ottowa C-50 Cummins B5.9L ,024 Diesel 0.57 LB866 Yard tractor Off-Highway Trucks Ottowa C-50 Cummins B5.9L ,024 Diesel 0.57 LB867 Yard tractor Off-Highway Trucks Ottowa C-50 Cummins B5.9L ,024 Diesel 0.57 LB868 Yard tractor Off-Highway Trucks Ottowa C-50 Cummins B5.9L ,024 Diesel 0.57 LB869 Yard tractor Off-Highway Trucks Ottowa C-50 Cummins B5.9L ,024 Diesel 0.57 LB870 Yard tractor Off-Highway Trucks Ottowa C-50 Cummins B5.9L ,024 Diesel 0.57 LB871 Yard tractor Off-Highway Trucks Ottowa C-50 Cummins B5.9L ,024 Diesel 0.57 LB872 Yard tractor Off-Highway Trucks Ottowa C-50 Cummins B5.9L ,024 Diesel 0.57 LB873 Yard tractor Off-Highway Trucks Ottowa C-50 Cummins B5.9L ,024 Diesel 0.57 LB874 Yard tractor Off-Highway Trucks Ottowa C-50 Cummins B5.9L ,024 Diesel 0.57 LB875 Yard tractor Off-Highway Trucks Ottowa C-50 Cummins B5.9L ,024 Diesel 0.57 LB876 Yard tractor Off-Highway Trucks Ottowa C-50 Cummins B5.9L ,024 Diesel 0.57 LB877 Yard tractor Off-Highway Trucks Ottowa C-50 Cummins B5.9L ,024 Diesel 0.57 LB878 Yard tractor Off-Highway Trucks Ottowa C-50 Cummins B5.9L ,024 Diesel 0.57 LB879 Yard tractor Off-Highway Trucks Ottowa C-50 Cummins B5.9L ,024 Diesel 0.57 LB880 Yard tractor Off-Highway Trucks Ottowa C-50 Cummins B5.9L ,024 Diesel 0.57 LB881 Yard tractor Off-Highway Trucks Ottowa C-50 Cummins B5.9L ,024 Diesel 0.57 LB882 Yard tractor Off-Highway Trucks Ottowa C-50 Cummins C8.3L ,024 Diesel 0.57 LB883 Yard tractor Off-Highway Trucks Ottowa C-50 Cummins C8.3L ,024 Diesel 0.57 LB884 Yard tractor Off-Highway Trucks Ottowa C-50 Cummins C8.3L ,024 Diesel 0.57 LB885 Yard tractor Off-Highway Trucks Ottowa C-50 Cummins C8.3L ,024 Diesel 0.57 LB886 Yard tractor Off-Highway Trucks Ottowa C-50 Cummins C8.3L ,024 Diesel 0.57 LB887 Yard tractor Off-Highway Trucks Ottowa C-50 Cummins C8.3L ,024 Diesel 0.57 LB888 Yard tractor Off-Highway Trucks Ottowa C-50 Cummins C8.3L ,024 Diesel 0.57 LB889 Yard tractor Off-Highway Trucks Ottowa C-50 Cummins C8.3L ,024 Diesel 0.57 LB890 Yard tractor Off-Highway Trucks Ottowa C-50 Cummins C8.3L ,024 Diesel 0.57 LB891 Yard tractor Off-Highway Trucks Ottowa C-50 Cummins C8.3L ,024 Diesel 0.57 LB892 Yard tractor Off-Highway Trucks Ottowa C-50 Cummins C8.3L ,024 Diesel 0.57 LB893 Yard tractor Off-Highway Trucks Ottowa C-50 Cummins C8.3L ,024 Diesel 0.57 LB894 Yard tractor Off-Highway Trucks Ottowa C-50 Cummins C8.3L ,024 Diesel 0.57 LB895 Yard tractor Off-Highway Trucks Ottowa C-50 Cummins C8.3L ,024 Diesel 0.57 LB896 Yard tractor Off-Highway Trucks MF MF 50EX Perkins Diesel 0.57 LB897 Yard tractor Off-Highway Trucks Ottawa 90T Caterpillar 3126E Diesel 0.57 Starcrest Consulting Group, LLC A-26 March 2004
156 Table A.1 Cargo Handling Equipment List (contd) Annual ID # Port Equip Type OFFROAD Equipment Equipment Engine Engine Model Year HP Activity Fuel LF Equipment Type Make Model (hours) Type LB898 Yard tractor Off-Highway Trucks Ottawa 60 Caterpillar 3126E Diesel 0.57 LB899 Reach Stacker Other Gen'l Indust Equip Kalmar Volvo TWD 730 ME Diesel 0.51 LB900 Side pick Other Gen'l Indust Equip Taylor Detroit Diesel ,515 Diesel 0.51 LB901 Side pick Other Gen'l Indust Equip Taylor Detroit Diesel ,515 Diesel 0.51 LB902 Side pick Other Gen'l Indust Equip Taylor Cummins C 5.9-C (6 BT, 6 BTA) ,515 Diesel 0.51 LB903 Side pick Other Gen'l Indust Equip Taylor Cummins C 5.9-C (6 BT, 6 BTA) ,515 Diesel 0.51 LB904 Side pick Other Gen'l Indust Equip Taylor Cummins C 5.9-C (6 BT, 6 BTA) ,515 Diesel 0.51 LB905 Side pick Other Gen'l Indust Equip Taylor Cummins C 5.9-C (6 BT, 6 BTA) ,515 Diesel 0.51 LB906 Side pick Other Gen'l Indust Equip Taylor Cummins C 5.9-C (6 BT, 6 BTA) ,515 Diesel 0.51 LB907 Side pick Other Gen'l Indust Equip Taylor Cummins C 5.9-C (6 BT, 6 BTA) ,515 Diesel 0.51 LB908 Side pick Other Gen'l Indust Equip Taylor Cummins C 5.9-C (6 BT, 6 BTA) ,515 Diesel 0.51 LB909 Side pick Other Gen'l Indust Equip Taylor Cummins C 5.9-C (6 BT, 6 BTA) ,515 Diesel 0.51 LB910 Side pick Other Gen'l Indust Equip Taylor Cummins C 5.9-C (6 BT, 6 BTA) ,515 Diesel 0.51 LB911 Side pick Other Gen'l Indust Equip Taylor Cummins C 5.9-C (6 BT, 6 BTA) Diesel 0.51 LB912 Side pick Other Gen'l Indust Equip Taylor Cummins C 5.9-C (6 BT, 6 BTA) ,239 Diesel 0.51 LB913 Side pick Other Gen'l Indust Equip Taylor Cummins C 5.9-C (6 BT, 6 BTA) ,507 Diesel 0.51 LB914 Side pick Other Gen'l Indust Equip Taylor Cummins C 5.9-C (6 BT, 6 BTA) ,013 Diesel 0.51 LB915 Side pick Other Gen'l Indust Equip Taylor Cummins C 5.9-C (6 BT, 6 BTA) ,393 Diesel 0.51 LB916 Side pick Other Gen'l Indust Equip Taylor Cummins C 5.9-C (6 BT, 6 BTA) Diesel 0.51 LB917 Side pick Other Gen'l Indust Equip Taylor Cummins C 5.9-C (6 BT, 6 BTA) Diesel 0.51 LB918 Side pick Other Gen'l Indust Equip Taylor Cummins C 5.9-C (6 BT, 6 BTA) ,080 Diesel 0.51 LB919 Side pick Other Gen'l Indust Equip Taylor Cummins C 5.9-C (6 BT, 6 BTA) ,080 Diesel 0.51 LB920 Side pick Other Gen'l Indust Equip Taylor Cummins C 5.9-C (6 BT, 6 BTA) ,080 Diesel 0.51 LB921 Side pick Other Gen'l Indust Equip Taylor Cummins C 5.9-C (6 BT, 6 BTA) ,500 Diesel 0.51 LB922 Side pick Other Gen'l Indust Equip Taylor Cummins C 5.9-C (6 BT, 6 BTA) ,500 Diesel 0.51 LB923 Side pick Other Gen'l Indust Equip Taylor Cummins C 5.9-C (6 BT, 6 BTA) ,500 Diesel 0.51 LB924 Side pick Other Gen'l Indust Equip Taylor Cummins C 5.9-C (6 BT, 6 BTA) ,500 Diesel 0.51 LB925 Side pick Other Gen'l Indust Equip Taylor Cummins C 5.9-C (6 BT, 6 BTA) ,500 Diesel 0.51 LB926 Side pick Other Gen'l Indust Equip Taylor Detroit Diesel Diesel 0.51 LB927 Side pick Other Gen'l Indust Equip Taylor Cummins C 5.9-C (6 BT, 6 BTA) ,560 Diesel 0.51 LB928 Side pick Other Gen'l Indust Equip Taylor Cummins C 5.9-C (6 BT, 6 BTA) ,560 Diesel 0.51 LB929 Side pick Other Gen'l Indust Equip Taylor Cummins C 5.9-C (6 BT, 6 BTA) ,560 Diesel 0.51 LB930 Side pick Other Gen'l Indust Equip Taylor Cummins C 5.9-C (6 BT, 6 BTA) ,650 Diesel 0.51 LB931 Side pick Other Gen'l Indust Equip Taylor Cummins C 5.9-C (6 BT, 6 BTA) ,650 Diesel 0.51 LB932 Side pick Other Gen'l Indust Equip Taylor Cummins C 5.9-C (6 BT, 6 BTA) ,650 Diesel 0.51 LB933 Side pick Other Gen'l Indust Equip Taylor Cummins C 5.9-C (6 BT, 6 BTA) ,650 Diesel 0.51 LB934 Side pick Other Gen'l Indust Equip Taylor Cummins C 5.9-C (6 BT, 6 BTA) ,650 Diesel 0.51 LB935 Side pick Other Gen'l Indust Equip Taylor 155 Cummins B5.9L ,764 Diesel 0.51 LB936 Side pick Other Gen'l Indust Equip Taylor 155 Cummins B5.9L ,764 Diesel 0.51 Starcrest Consulting Group, LLC A-27 March 2004
157 Table A.1 Cargo Handling Equipment List (contd) Annual ID # Port Equip Type OFFROAD Equipment Equipment Engine Engine Model Year HP Activity Fuel LF Equipment Type Make Model (hours) Type LB937 Side pick Other Gen'l Indust Equip Taylor 155 Cummins B5.9L ,764 Diesel 0.51 LB938 Side pick Other Gen'l Indust Equip Kalmar DCD.90E Cummins B5.9L ,764 Diesel 0.51 LB939 Side pick Other Gen'l Indust Equip Kalmar DCD.90E Cummins B5.9L ,764 Diesel 0.51 LB940 Side pick Other Gen'l Indust Equip Kalmar DCD.90E Cummins B5.9L ,764 Diesel 0.51 LB941 Top handler Other Gen'l Indust Equip Taylor Cummins LT 10-C ,253 Diesel 0.51 LB942 Top handler Other Gen'l Indust Equip Taylor Cummins LT 10-C ,253 Diesel 0.51 LB943 Top handler Other Gen'l Indust Equip Taylor Cummins LT 10-C ,253 Diesel 0.51 LB944 Top handler Other Gen'l Indust Equip Taylor Cummins LT 10-C ,253 Diesel 0.51 LB945 Top handler Other Gen'l Indust Equip Taylor Cummins LT 10-C ,253 Diesel 0.51 LB946 Top handler Other Gen'l Indust Equip Taylor Cummins LT 10-C ,253 Diesel 0.51 LB947 Top handler Other Gen'l Indust Equip Taylor Cummins M 11-C ,253 Diesel 0.51 LB948 Top handler Other Gen'l Indust Equip Taylor Cummins M 11-C ,253 Diesel 0.51 LB949 Top handler Other Gen'l Indust Equip Taylor Cummins M 11-C ,253 Diesel 0.51 LB950 Top handler Other Gen'l Indust Equip Taylor Cummins M 11-C ,253 Diesel 0.51 LB951 Top handler Other Gen'l Indust Equip Kalmar Volvo TW 1031 VE ,253 Diesel 0.51 LB952 Top handler Other Gen'l Indust Equip Kalmar Volvo TW 1031 VE ,253 Diesel 0.51 LB953 Top handler Other Gen'l Indust Equip Kalmar Volvo TW 1031 VE ,253 Diesel 0.51 LB954 Top handler Other Gen'l Indust Equip Taylor Cummins M 11-C ,712 Diesel 0.51 LB955 Top handler Other Gen'l Indust Equip Kalmar Volvo TD 2030 ME Diesel 0.51 LB956 Top handler Other Gen'l Indust Equip Kalmar Volvo TD 2030 ME Diesel 0.51 LB957 Top handler Other Gen'l Indust Equip Kalmar Volvo TD 2030 ME ,066 Diesel 0.51 LB958 Top handler Other Gen'l Indust Equip Kalmar Volvo TD 2030 ME ,504 Diesel 0.51 LB959 Top handler Other Gen'l Indust Equip Mi-Jack MJ 500-SH ,600 Diesel 0.51 LB960 Top handler Other Gen'l Indust Equip Taylor THDC955 Cummins C 8.3-C (6 CT) ,600 Diesel 0.51 LB961 Top handler Other Gen'l Indust Equip Taylor THDC955 Cummins C 8.3-C (6 CT) ,600 Diesel 0.51 LB962 Top handler Other Gen'l Indust Equip Taylor THDC955 Cummins C 8.3-C (6 CT) ,600 Diesel 0.51 LB963 Top handler Other Gen'l Indust Equip Taylor THDC955 Cummins C 8.3-C (6 CT) ,600 Diesel 0.51 LB964 Top handler Other Gen'l Indust Equip Taylor THDC955 Cummins C 8.3-C (6 CT) ,600 Diesel 0.51 LB965 Top handler Other Gen'l Indust Equip Taylor THDC955 Cummins C 8.3-C (6 CT) ,600 Diesel 0.51 LB966 Top handler Other Gen'l Indust Equip Taylor THDC955 Cummins C 8.3-C (6 CT) ,600 Diesel 0.51 LB967 Top handler Other Gen'l Indust Equip Taylor THDC955 Cummins C 8.3-C (6 CT) ,600 Diesel 0.51 LB968 Top handler Other Gen'l Indust Equip Taylor THDC955 Cummins C 8.3-C (6 CT) ,600 Diesel 0.51 LB969 Top handler Other Gen'l Indust Equip Taylor THDC955 Cummins C 8.3-C (6 CT) ,600 Diesel 0.51 LB970 Top handler Other Gen'l Indust Equip Taylor THDC955 Cummins C 8.3-C (6 CT) ,600 Diesel 0.51 LB971 Top handler Other Gen'l Indust Equip Taylor THDC955 Cummins C 8.3-C (6 CT) ,600 Diesel 0.51 LB972 Top handler Other Gen'l Indust Equip Taylor Cummins C 8.3-C (6 CT) ,328 Diesel 0.51 LB973 Top handler Other Gen'l Indust Equip Taylor Cummins C 8.3-C (6 CT) ,328 Diesel 0.51 LB974 Top handler Other Gen'l Indust Equip Taylor Cummins C 8.3-C (6 CT) ,328 Diesel 0.51 LB975 Top handler Other Gen'l Indust Equip Taylor Cummins C 8.3-C (6 CT) ,328 Diesel 0.51 Starcrest Consulting Group, LLC A-28 March 2004
158 Table A.1 Cargo Handling Equipment List (contd) Annual ID # Port Equip Type OFFROAD Equipment Equipment Engine Engine Model Year HP Activity Fuel LF Equipment Type Make Model (hours) Type LB976 Top handler Other Gen'l Indust Equip Taylor Cummins C 8.3-C (6 CT) ,328 Diesel 0.51 LB977 Top handler Other Gen'l Indust Equip Taylor Cummins C 8.3-C (6 CT) ,328 Diesel 0.51 LB978 Top handler Other Gen'l Indust Equip Taylor Cummins C 8.3-C (6 CT) ,328 Diesel 0.51 LB979 Top handler Other Gen'l Indust Equip Taylor Cummins C 8.3-C (6 CT) ,328 Diesel 0.51 LB980 Top handler Other Gen'l Indust Equip Taylor Cummins C 8.3-C (6 CT) ,328 Diesel 0.51 LB981 Top handler Other Gen'l Indust Equip Taylor Cummins C 8.3-C (6 CT) ,328 Diesel 0.51 LB982 Top handler Other Gen'l Indust Equip Taylor Cummins C 8.3-C (6 CT) ,328 Diesel 0.51 LB983 Top handler Other Gen'l Indust Equip Taylor Cummins C 8.3-C (6 CT) ,328 Diesel 0.51 LB984 Top handler Other Gen'l Indust Equip Taylor Cummins C 8.3-C (6 CT) ,328 Diesel 0.51 LB985 Top handler Other Gen'l Indust Equip Taylor Cummins C 8.3-C (6 CT) ,328 Diesel 0.51 LB986 Top handler Other Gen'l Indust Equip Taylor Cummins LT 10-C ,456 Diesel 0.51 LB987 Top handler Other Gen'l Indust Equip Taylor Cummins M 11-C ,456 Diesel 0.51 LB988 Top handler Other Gen'l Indust Equip Taylor Cummins LT 10-C ,870 Diesel 0.51 LB989 Top handler Other Gen'l Indust Equip Taylor Cummins LT 10-C ,870 Diesel 0.51 LB990 Top handler Other Gen'l Indust Equip Taylor Cummins LT 10-C ,870 Diesel 0.51 LB991 Top handler Other Gen'l Indust Equip Taylor Cummins LT 10-C ,870 Diesel 0.51 LB992 Top handler Other Gen'l Indust Equip Taylor Cummins LT 10-C ,870 Diesel 0.51 LB993 Top handler Other Gen'l Indust Equip Taylor Cummins LT 10-C ,870 Diesel 0.51 LB994 Top handler Other Gen'l Indust Equip Taylor Cummins LT 10-C ,870 Diesel 0.51 LB995 Top handler Other Gen'l Indust Equip Taylor Cummins LT 10-C ,870 Diesel 0.51 LB996 Top handler Other Gen'l Indust Equip Taylor Cummins LT 10-C ,870 Diesel 0.51 LB997 Top handler Other Gen'l Indust Equip Taylor Cummins M 11-C ,870 Diesel 0.51 LB998 Top handler Other Gen'l Indust Equip Taylor Cummins M 11-C ,870 Diesel 0.51 LB999 Top handler Other Gen'l Indust Equip Taylor Cummins M 11-C ,870 Diesel 0.51 LB1000 Top handler Other Gen'l Indust Equip Taylor Cummins M 11-C ,870 Diesel 0.51 LB1001 Top handler Other Gen'l Indust Equip Taylor Cummins M 11-C ,870 Diesel 0.51 LB1002 Top handler Other Gen'l Indust Equip Taylor Cummins M 11-C ,870 Diesel 0.51 LB1003 Top handler Other Gen'l Indust Equip Taylor Cummins M 11-C ,870 Diesel 0.51 LB1004 Top handler Other Gen'l Indust Equip Taylor 950 Cummins M ,360 Diesel 0.51 LB1005 Top handler Other Gen'l Indust Equip Taylor 950 Cummins M ,360 Diesel 0.51 LB1006 Top handler Other Gen'l Indust Equip Taylor 950 Cummins M ,360 Diesel 0.51 LB1007 Top handler Other Gen'l Indust Equip Taylor 950 Cummins M ,360 Diesel 0.51 LB1008 Top handler Other Gen'l Indust Equip Taylor 950 Cummins M ,360 Diesel 0.51 LB1009 Top handler Other Gen'l Indust Equip Taylor 950 Cummins M ,360 Diesel 0.51 LB1010 Top handler Other Gen'l Indust Equip Taylor 950 Cummins M ,360 Diesel 0.51 LB1011 Top handler Other Gen'l Indust Equip Taylor 950 Cummins M ,360 Diesel 0.51 LB1012 Top handler Other Gen'l Indust Equip Taylor 950 Cummins M ,360 Diesel 0.51 LB1013 Top handler Other Gen'l Indust Equip Taylor 950 Cummins M ,360 Diesel 0.51 LB1014 Top handler Other Gen'l Indust Equip Taylor 950 Cummins M ,360 Diesel 0.51 Starcrest Consulting Group, LLC A-29 March 2004
159 Table A.1 Cargo Handling Equipment List (contd) Annual ID # Port Equip Type OFFROAD Equipment Equipment Engine Engine Model Year HP Activity Fuel LF Equipment Type Make Model (hours) Type LB1015 Top handler Other Gen'l Indust Equip Taylor 950 Cummins M ,360 Diesel 0.51 LB1016 Top handler Other Gen'l Indust Equip Taylor 950 Cummins M ,360 Diesel 0.51 LB1017 Top handler Other Gen'l Indust Equip Taylor 950 Cummins M ,360 Diesel 0.51 LB1018 Top handler Other Gen'l Indust Equip Taylor 950 Cummins M ,360 Diesel 0.51 LB1019 Top handler Other Gen'l Indust Equip Taylor 950 Cummins M ,360 Diesel 0.51 LB1020 Top handler Other Gen'l Indust Equip Taylor 954 Cummins M ,360 Diesel 0.51 LB1021 Top handler Other Gen'l Indust Equip Hyster 1055E Cummins QSM11C ,360 Diesel 0.51 LB1022 Top handler Other Gen'l Indust Equip Hyster 1055E Cummins QSM11C ,360 Diesel 0.51 LB1023 Top handler Other Gen'l Indust Equip Hyster 1055E Cummins QSM11C ,360 Diesel 0.51 LB1024 Top handler Other Gen'l Indust Equip Hyster 1055E Cummins QSM11C ,360 Diesel 0.51 LB1025 Top handler Other Gen'l Indust Equip Hyster 1055E Cummins QSM11C ,360 Diesel 0.51 LB1026 Top handler Other Gen'l Indust Equip Hyster 1055E Cummins QSM11C ,360 Diesel 0.51 LB1027 Top handler Other Gen'l Indust Equip Hyster 1055E Cummins QSM11C ,360 Diesel 0.51 LB1028 Top handler Other Gen'l Indust Equip Hyster 1055E Cummins QSM11C ,360 Diesel 0.51 LB1029 Top handler Other Gen'l Indust Equip Hyster Caterpillar V8 Diesel Diesel 0.51 LB1030 Rubber tired loader Rubber Tired Loaders Caterpillar 988 B Caterpillar ,500 Diesel 0.54 LB1031 Rubber tired loader Rubber Tired Loaders Caterpillar 988 B Caterpillar ,500 Diesel 0.54 LB1032 Rubber tired loader Rubber Tired Loaders Caterpillar Caterpillar Diesel 0.54 LB1033 Rubber tired loader Rubber Tired Loaders Caterpillar 966D Caterpillar ,092 Diesel 0.54 LB1034 Rubber tired loader Rubber Tired Loaders Caterpillar 966D Caterpillar ,092 Diesel 0.54 LB1035 Rubber tired loader Rubber Tired Loaders Caterpillar 988B Caterpillar ,144 Diesel 0.54 LB1036 Rubber tired loader Rubber Tired Loaders Caterpillar 988B Caterpillar ,144 Diesel 0.54 LB1037 Rubber tired loader Rubber Tired Loaders Caterpillar 988B Caterpillar ,144 Diesel 0.54 LB1038 Rubber tired loader Rubber Tired Loaders Caterpillar 988B Caterpillar ,144 Diesel 0.54 LB1039 Rubber tired loader Rubber Tired Loaders Caterpillar 988B Caterpillar ,144 Diesel 0.54 LB1040 Rubber tired loader Rubber Tired Loaders Caterpillar 9-14G Caterpillar Diesel 0.54 LB1041 Rubber tired loader Rubber Tired Loaders Caterpillar 9-14G Caterpillar Diesel 0.54 LB1042 Rubber tired loader Rubber Tired Loaders unkown unkown unkown unkown Diesel 0.54 LB1043 Rubber tired loader Rubber Tired Loaders unkown unkown unkown unkown Diesel 0.54 LB1044 Rubber tired loader Rubber Tired Loaders unkown unkown unkown unkown Diesel 0.54 LB1045 Rubber tired loader Rubber Tired Loaders unkown unkown unkown unkown Diesel 0.54 LB1046 Rubber tired loader Rubber Tired Loaders unkown unkown unkown unkown Diesel 0.54 LB1047 Rubber tired loader Rubber Tired Loaders unkown unkown unkown unkown Diesel 0.54 LB1048 Rubber tired loader Rubber Tired Loaders Caterpillar Caterpillar Diesel 0.54 LB1049 Skid Steer Loader Skid Steer Loaders Bobcat 743B Kubota V 1702 BA ,040 Diesel 0.55 LB1050 Skid Steer Loader Skid Steer Loaders Bobcat 753 Kubota V 2203 B ,040 Diesel 0.55 LB1051 Skid Steer Loader Skid Steer Loaders Toyota Diesel 0.55 LB1052 Sweeper Sweepers/Scrubbers FMC Detroit Diesel 8.2L Diesel 0.68 LB1053 Sweeper Sweepers/Scrubbers Mobil GMC 8.2L Diesel 0.68 Starcrest Consulting Group, LLC A-30 March 2004
160 Table A.1 Cargo Handling Equipment List (contd) Annual ID # Port Equip Type OFFROAD Equipment Equipment Engine Engine Model Year HP Activity Fuel LF Equipment Type Make Model (hours) Type LB1054 Sweeper Sweepers/Scrubbers Elgin John Deere 4045 TF/50 B Diesel 0.68 LB1055 Sweeper Sweepers/Scrubbers Schwarze Isuzu 4B02TC Diesel 0.68 LB1056 Sweeper Sweepers/Scrubbers FMC Diesel 0.68 LB1057 Sweeper Sweepers/Scrubbers Elgin Diesel 0.68 LB1058 Sweeper Sweepers/Scrubbers Johnston Diesel 0.68 LB1059 Sweeper Sweepers/Scrubbers Johnston Diesel 0.68 LB1060 Sweeper Sweepers/Scrubbers Elgin Crosswind Cummins B5.9L ,024 Diesel 0.68 Starcrest Consulting Group, LLC A-31 March 2004
161 Table A.2, below, lists the CHE OFFROAD equipment type, load factor and OFFROAD category. Once the CHE equipment inventory was complete, the inventory was forwarded to ARB who then assigned to each piece of equipment an OFFROAD equipment type and category based on their function. This table lists the OFFROAD load factor for the particular equipment type and category used in the OFFROAD model. Table A.2 Cargo Handling Equipment Load Factor Survey Equipment Type OFF-ROAD Equipment Type OFF-ROAD Category Load Factor Crane Crane Construction 0.43 Dozer Tractor/Loader/Backhoe Construction 0.55 Excavator Excavator Construction 0.57 Forklift Forklift Industrial 0.3 Reach stacker Other general industrial equipment Industrial 0.51 RTG crane Crane Construction 0.43 Rubber tired loader Rubber tired loader Construction 0.54 Side handler Other general industrial equipment Industrial 0.51 Skid loader Skid steer loader Construction 0.55 Sweeper Sweeper Industrial 0.68 Top handler Other general industrial equipment Industrial 0.51 Yard tractor Off highway truck Construction 0.57 Tables A.3-A.30 Emissions Output Tables Tables A.3 through A.27 show ARB s OFFROAD output for diesel engines in grams/day by hp category for each of the pollutants. Table A.28 presents the same information for propane-powered equipment. After being received from the ARB, the emissions results by equipment and horsepower category were summed up and converted from grams/day to tons per day (tpd). Grams are converted to tons by dividing by grams per pound and 2,000 pounds per ton (907,200 grams per ton). Each row represents emissions from a terminal at POLB and the columns with the numbers at the top are the emissions in grams per day for each horsepower category (ie. 25, 50, 120, 175, 250, 500, 750, 999 hp). The bold column is the converted sum of the emissions by each terminal for that equipment type. The equipment type is shown above the hp type. The tons per day values are totaled at the bottom. Tables A.29 and A.30 summarize the emission estimates, A.29 by equipment type and A.30 by terminal. For two terminals, in rows eleven and fifteen in Table A.30, the appropriate number of months of 2002 operations was apportioned, because these terminals did not operate for an entire year. The PM 10 values in the report tables are assumed to be 100% of the PM values. The PM 2.5 values are assumed to be 92% of the PM values. DPM values are PM values for diesel only because DPM is defined as PM emitted from diesel engines. Lastly, the values in the report summary tables were rounded to the nearest second decimal place for tons per day and first decimal place for tons per year. Starcrest Consulting Group, LLC A-32 March 2004
162 Table A.3 NO x Emissions, Cranes and Crawler Tractors Cranes (g/day) NO x Crawler Tractors (g/day) NO x (tpd) (tpd) Total, tpd Note: For rows eleven and fifteen, the appropriate number of months of 2002 operations was apportioned to those terminals in the converted tons per day column. Therefore, the total converted tons will not match the total grams. Starcrest Consulting Group, LLC A-33 March 2004
163 Table A.4 NO x Emissions, Excavators and Forklifts Excavators (g/day) NO x Forklifts (g/day) NO x (tpd) (tpd) Total, tpd Note: For rows eleven and fifteen, the appropriate number of months of 2002 operations was apportioned to those terminals in the converted tons per day column. Therefore, the total converted tons will not match the total grams. Starcrest Consulting Group, LLC A-34 March 2004
164 Table A.5 NO x Emissions, Off-Highway and Other General Industrial Equipment Off-Highway Trucks (g/day) NO x Other General Industrial Equ (g/day) NO x (tpd) (tpd) Total, tpd Note: For rows eleven and fifteen, the appropriate number of months of 2002 operations was apportioned to those terminals in the converted tons per day column. Therefore, the total converted tons will not match the total grams. Starcrest Consulting Group, LLC A-35 March 2004
165 Table A.6 NO x Emissions, Rubber Tired Loaders and Skid Steer Loaders Rubber Tired Loaders (g/day) NO x Skid Steer Loaders (g/day) NO x (tpd) (tpd) Total, tpd Note: For rows eleven and fifteen, the appropriate number of months of 2002 operations was apportioned to those terminals in the converted tons per day column. Therefore, the total converted tons will not match the total grams. Starcrest Consulting Group, LLC A-36 March 2004
166 Table A.7 NO x Emissions, Sweepers Sweepers/Scrubbers (g/day) NO x (tpd) Total, tpd Note: For rows eleven and fifteen, the appropriate number of months of 2002 operations was apportioned to those terminals in the converted tons per day column. Therefore, the total converted tons will not match the total grams. Starcrest Consulting Group, LLC A-37 March 2004
167 Table A.8 CO Emissions, Cranes and Crawler Tractors Cranes (g/day) CO Crawler Tractors (g/day) CO (tpd) (tpd) Totals, tpd Note: For rows eleven and fifteen, the appropriate number of months of 2002 operations was apportioned to those terminals in the converted tons per day column. Therefore, the total converted tons will not match the total grams. Starcrest Consulting Group, LLC A-38 March 2004
168 Table A.9 CO Emissions, Excavators and Forklifts Excavators (g/day) CO Forklifts (g/day) CO (tpd) (tpd) Totals, tpd Note: For rows eleven and fifteen, the appropriate number of months of 2002 operations was apportioned to those terminals in the converted tons per day column. Therefore, the total converted tons will not match the total grams. Starcrest Consulting Group, LLC A-39 March 2004
169 Table A.10 CO Emissions, Off-Highway Trucks and Other General Industrial Equipment Off-Highway Trucks (g/day) CO Other General Industrial Equ (g/day) CO (tpd) (tpd) Totals, tpd Note: For rows eleven and fifteen, the appropriate number of months of 2002 operations was apportioned to those terminals in the converted tons per day column. Therefore, the total converted tons will not match the total grams. Starcrest Consulting Group, LLC A-40 March 2004
170 Table A.11 CO Emissions, Rubber Tired Loaders and Skid Steer Loaders Rubber Tired Loaders (g/day) CO Skid Steer Loaders (g/day) CO (tpd) (tpd) Totals, tpd Note: For rows eleven and fifteen, the appropriate number of months of 2002 operations was apportioned to those terminals in the converted tons per day column. Therefore, the total converted tons will not match the total grams. Starcrest Consulting Group, LLC A-41 March 2004
171 Table A.12 CO Emissions, Sweepers Sweepers/Scrubbers (g/day) CO (tpd) Totals, tpd Note: For rows eleven and fifteen, the appropriate number of months of 2002 operations was apportioned to those terminals in the converted tons per day column. Therefore, the total converted tons will not match the total grams. Starcrest Consulting Group, LLC A-42 March 2004
172 Table A.13 HC Emissions, Cranes and Crawler Tractors Cranes (g/day) HC Crawler Tractors (g/day) HC (tpd) (tpd) Totals, tpd Note: For rows eleven and fifteen, the appropriate number of months of 2002 operations was apportioned to those terminals in the converted tons per day column. Therefore, the total converted tons will not match the total grams. Starcrest Consulting Group, LLC A-43 March 2004
173 Table A.14 HC Emissions, Excavators and Forklifts Excavators (g/day) HC Forklifts (g/day) HC (tpd) (tpd) Note: For rows eleven and fifteen, the appropriate number of months of 2002 operations was apportioned to those terminals in the converted tons per day column. Therefore, the total converted tons will not match the total grams. Starcrest Consulting Group, LLC A-44 March 2004
174 Table A.15 HC Emissions, Off-Highway Trucks and Other General Industrial Equipment Off-Highway Trucks (g/day) HC Other General Industrial Equ (g/day) HC (tpd) (tpd) Totals, tpd Note: For rows eleven and fifteen, the appropriate number of months of 2002 operations was apportioned to those terminals in the converted tons per day column. Therefore, the total converted tons will not match the total grams. Starcrest Consulting Group, LLC A-45 March 2004
175 Table A.16 HC Emissions, Rubber Tired Loaders and Skid Steer Loaders Rubber Tired Loaders (g/day) HC Skid Steer Loaders (g/day) HC (tpd) (tpd) Totals, tpd Note: For rows eleven and fifteen, the appropriate number of months of 2002 operations was apportioned to those terminals in the converted tons per day column. Therefore, the total converted tons will not match the total grams. Starcrest Consulting Group, LLC A-46 March 2004
176 Table A.17 HC Emissions, Sweepers Sweepers/Scrubbers (g/day) HC (tpd) Totals, tpd Note: For rows eleven and fifteen, the appropriate number of months of 2002 operations was apportioned to those terminals in the converted tons per day column. Therefore, the total converted tons will not match the total grams. Starcrest Consulting Group, LLC A-47 March 2004
177 Table A.18 PM Emissions, Cranes and Crawler Tractors Cranes (g/day) PM Crawler Tractors (g/day) PM (tpd) (tpd) Totals, tpd Note: For rows eleven and fifteen, the appropriate number of months of 2002 operations was apportioned to those terminals in the converted tons per day column. Therefore, the total converted tons will not match the total grams. Starcrest Consulting Group, LLC A-48 March 2004
178 Table A.19 PM Emissions, Excavators and Forklifts Excavators (g/day) PM Forklifts (g/day) PM (tpd) (tpd) Totals, tpd Note: For rows eleven and fifteen, the appropriate number of months of 2002 operations was apportioned to those terminals in the converted tons per day column. Therefore, the total converted tons will not match the total grams. Starcrest Consulting Group, LLC A-49 March 2004
179 Table A.20 PM Emissions, Off-Highway Trucks and Other General Industrial Equipment Off-Highway Trucks (g/day) PM Other General Industrial Equ (g/day) PM (tpd) (tpd) Totals, tpd Note: For rows eleven and fifteen, the appropriate number of months of 2002 operations was apportioned to those terminals in the converted tons per day column. Therefore, the total converted tons will not match the total grams. Starcrest Consulting Group, LLC A-50 March 2004
180 Table A.21 PM Emissions, Rubber Tired Loaders and Skid Steer Loaders Rubber Tired Loaders (g/day) PM Skid Steer Loaders (g/day) PM (tpd) (tpd) Totals, tpd Note: For rows eleven and fifteen, the appropriate number of months of 2002 operations was apportioned to those terminals in the converted tons per day column. Therefore, the total converted tons will not match the total grams. Starcrest Consulting Group, LLC A-51 March 2004
181 Table A.22 PM Emissions, Sweepers Sweepers/Scrubbers (g/day) PM (tpd) Totals, tpd Note: For rows eleven and fifteen, the appropriate number of months of 2002 operations was apportioned to those terminals in the converted tons per day column. Therefore, the total converted tons will not match the total grams. Starcrest Consulting Group, LLC A-52 March 2004
182 Table A.23 SO2 Emissions, Cranes and Crawler Tractors Cranes (g/day) SO 2 Crawler Tractors (g/day) SO (tpd) (tpd) Totals, tpd Note: For rows eleven and fifteen, the appropriate number of months of 2002 operations was apportioned to those terminals in the converted tons per day column. Therefore, the total converted tons will not match the total grams. Starcrest Consulting Group, LLC A-53 March 2004
183 Table A.24 SO 2 Emissions, Excavators and Forklifts Excavators (g/day) SO 2 Forklifts (g/day) SO (tpd) (tpd) Totals, tpd Note: For rows eleven and fifteen, the appropriate number of months of 2002 operations was apportioned to those terminals in the converted tons per day column. Therefore, the total converted tons will not match the total grams. Starcrest Consulting Group, LLC A-54 March 2004
184 Table A.25 SO 2 Emissions, Off-Highway Trucks and Other General Industrial Equipment Off-Highway Trucks (g/day) SO 2 Other General Industrial Equ (g/day) SO (tpd) (tpd) Totals, tpd Note: For rows eleven and fifteen, the appropriate number of months of 2002 operations was apportioned to those terminals in the converted tons per day column. Therefore, the total converted tons will not match the total grams. Starcrest Consulting Group, LLC A-55 March 2004
185 Table A.26 SO 2 Emissions, Rubber Tired Loaders and Skid Steer Loaders Rubber Tired Loaders (g/day) SO 2 Skid Steer Loaders (g/day) SO (tpd) (tpd) Totals, tpd Note: For rows eleven and fifteen, the appropriate number of months of 2002 operations was apportioned to those terminals in the converted tons per day column. Therefore, the total converted tons will not match the total grams. Starcrest Consulting Group, LLC A-56 March 2004
186 Table A.27 SO 2 Emissions, Sweepers Sweepers/Scrubbers (g/day) SO (tpd) Totals, tpd Note: For rows eleven and fifteen, the appropriate number of months of 2002 operations was apportioned to those terminals in the converted tons per day column. Therefore, the total converted tons will not match the total grams. Starcrest Consulting Group, LLC A-57 March 2004
187 Table A.28 LPG Forklift Emissions Forklifts (g/day) HC (g/day) Forklifts (g/day) CO (g/day) Forklifts (g/day) NO x (g/day) Forklifts (g/day) PM (g/day) Forklifts (g/day) SO 2 (g/day) Total Total Total Total Total g/day 36, ,445 71,773 3,137 1,347 tpd tpy Starcrest Consulting Group, LLC A-58 March 2004
188 Table A POLB CHE Emissions by Equipment Type Equipment Category NOx CO TOG PM 10 PM 2.5 DPM SO 2 (tpd) (tpd) (tpd) (tpd) (tpd) (tpd) (tpd) Cranes Crawler Tractors Excavators Forklifts Off-Highway Trucks Other General Industrial Equipment Rubber Tired Loaders Skid Steer Loaders Sweepers/Scrubbers Totals, tpd Note: The equipment summary values above include diesel and LPG emissions. Equipment Category NOx CO TOG PM 10 PM 2.5 DPM SO 2 (tpy) (tpy) (tpy) (tpy) (tpy) (tpy) (tpy) Cranes Crawler Tractors Excavators Forklifts Off-Highway Trucks Other General Industrial Equipment Rubber Tired Loaders Skid Steer Loaders Sweepers/Scrubbers Totals, tpy Starcrest Consulting Group, LLC A-59 March 2004
189 Table A.30 Emissions by Terminal (tpd) (diesel) (LPG) HC CO NO x PM SO 2 HC CO NOx PM SO 2 NOx TOG CO PM 10 PM 2.5 DPM SO tpd tpy Starcrest Consulting Group, LLC A-60 March 2004
190 (This page intentionally left blank)
191 APPENDIX B RAILROAD LOCOMOTIVES Starcrest Consulting Group, LLC B-1 March 2004
192 (This page intentionally left blank)
193 APPENDIX B TABLE OF CONTENTS Table B.1: Switching Operation Shifts...4 Table B.2: In-Port Switch Engine Throttle Notch Distribution Data...5 Figure B.1: Throttle Notch Frequency Distributions...6 Figure B.2: Example Shift Activity Record...7 Table B.3: Switching Locomotive Emission Factors EPA Regulatory Support Document.. 12 Table B.4: Line Haul Locomotive Emission Factors EPA Regulatory Support Document.. 13 Starcrest Consulting Group, LLC B-2 March 2004
194 Table B.1 lists the shifts operated by the local switching railroad, covering both the POLB and the POLA. The table lists the shift name, which indicates the general area in which the shift operates, and/or the terminal or line haul railroad whose cargo is handled during that shift, the starting time of the shift, and the days of the week on which the shift operates. This schedule accounts for all of the operations of the switching railroad. For example, there is a shift that starts every day at midnight (0:01) servicing BNSF railcars at various locations. As another example, the Long Beach shift starts at 1:00 p.m. (13:00) Monday through Friday, picking up and delivering railcars from and to various POLB facilities. Although called the Long Beach shift, it is not the only shift to operate within the POLB, and not all Long Beach shift operations are necessarily within the POLB. As stated above, these are general area designations for the railroad s own uses. Table B.2 presents a summary of the second-by-second throttle notch data provided by the local switching railroad. The upper part of the table lists the total times in each setting for each locomotive, and all locomotives combined, over a 2-day period. The lower part of the table shows the percentage of time in each notch setting for each locomotive and for all locomotives combined. Figure B.1 graphically depicts the percent time-in-notch data listed in Table B.2. Figure B.2 is a detailed chart showing throttle notch activity for a typical switch locomotive shift. The chart shows throttle notch position and locomotive speed as a function of time. Direction of travel (forward/reverse) is indicated by speed being shown above or below the center line of the chart. Notations beneath the chart indicate the locomotive s activity or location at the time shown. This chart graphically illustrates the frequency of throttle notch adjustment during normal operation. Table B.3 presents the switch engine emission factor data published by EPA in support of their Regulatory Support Document cited in the EI report. Table B.4 presents the line haul locomotive emission factor data published by EPA in support of their Regulatory Support Document cited in the EI report. Starcrest Consulting Group, LLC B-3 March 2004
195 Table B.1: Switching Operation Shifts Shift Name Start Time Days BNSF 0:01 Every day UP 0:01 Every day APL 1:30 Every day BNSF 2:00 Every day Pier A / IC switcher 3:00 Mon-Sat (off Sun) Pier A switcher 8:00 Every day BNSF dock 8:00 Sat/Sun Hanjin 10:00 Mon-Fri (off Sat/Sun) BNSF dock 10:00 Every day Yang Ming 10:00 Tues-Sun (03:00 Monday) BNSF dock / Pier :30 Every day NYK 10:30 Sun-Fri (off Sat) TICTF 10:30 Every day UP 12:01 Every day Long Beach 13:00 Mon-Fri (off Sat/Sun) APL 14:00 Every day BNSF dock 14:30 Every day BNSF dock 15:30 Every day WB 17:00 Every day Manual / TI 18:00 Mon-Fri (off Sat/Sun) NYK switcher 20:00 Sat-Thur (off Fri) DAS switcher 20:00 Every day BNSF dock 22:30 Every day UP dock 22:30 Every day Starcrest Consulting Group, LLC B-4 March 2004
196 Table B.2: In-Port Switch Engine Throttle Notch Distribution Data Individual Data Points (seconds) Notch Unit #32 Unit #35 Unit #36a Unit #37 Unit #38 Unit #40 Unit #41 PHL42 Idle 30,663 64,169 39,553 28,272 28,240 48,816 19,107 20, ,836 5,177 3,124 2,087 2,107 3,728 1,614 2, ,900 7,041 4,310 3,683 3,684 3,791 1,507 3, ,818 7,214 4,423 3,514 3,497 3,530 2,149 1, ,129 5,896 3,568 2,439 2,446 3,012 1,833 3, ,506 1,461 1,601 1,646 2,760 1, ,070 1, , , , , Totals 39,044 99,443 58,945 42,866 42,910 70,130 28,479 33,118 Individual Data Points (seconds) Notch Unit #43 Unit #45 Unit #46 Unit #101 Unit #103 Unit #2026 Unit #2036 Totals Idle 59,587 11,122 67,097 33,479 51,496 58,503 47, , , ,360 4,713 6,163 6,572 3,921 52, , ,946 4,485 6,921 11,616 6,237 69, , ,434 3,361 4,800 8,824 6,581 60, , ,022 1,772 2,138 6,829 5,656 47, , , ,040 2,506 27, , , ,325 1,175 18, , , , , , ,865 77,125 11, ,283 49,212 72, ,453 74, ,672 Frequency Distribution Notch Unit #32 Unit #35 Unit #36a Unit #37 Unit #38 Unit #40 Unit #41 PHL42 Idle 78.5% 64.5% 67.1% 66.0% 65.8% 69.6% 67.1% 63.1% 1 4.7% 5.2% 5.3% 4.9% 4.9% 5.3% 5.7% 7.0% 2 4.9% 7.1% 7.3% 8.6% 8.6% 5.4% 5.3% 12.0% 3 4.7% 7.3% 7.5% 8.2% 8.1% 5.0% 7.5% 5.7% 4 2.9% 5.9% 6.1% 5.7% 5.7% 4.3% 6.4% 9.5% 5 2.3% 3.5% 2.5% 3.7% 3.8% 3.9% 3.8% 1.9% 6 1.9% 3.1% 2.0% 1.1% 1.2% 3.5% 2.3% 0.8% 7 0.2% 1.6% 1.2% 0.6% 0.6% 1.8% 1.2% 0.0% 8 0.0% 1.8% 1.1% 1.3% 1.3% 1.1% 0.6% 0.0% 100.0% 100.0% 100.0% 100.0% 100.0% 100.0% 100.0% 100.0% Frequency Distribution Notch Unit #43 Unit #45 Unit #46 Unit #101 Unit #103 Unit #2026 Unit #2036 Overall Idle 77.3% 99.8% 66.2% 68.0% 70.6% 57.7% 63.2% 67.4% 1 4.0% 0.2% 6.3% 9.6% 8.4% 6.5% 5.3% 5.9% 2 4.4% 0.0% 6.9% 9.1% 9.5% 11.4% 8.4% 7.7% 3 3.4% 0.0% 6.4% 6.8% 6.6% 8.7% 8.8% 6.7% 4 2.3% 0.0% 5.9% 3.6% 2.9% 6.7% 7.6% 5.3% 5 2.0% 0.0% 2.6% 2.0% 1.4% 5.0% 3.4% 3.0% 6 2.3% 0.0% 3.1% 0.7% 0.5% 2.3% 1.6% 2.0% 7 1.6% 0.0% 1.0% 0.1% 0.1% 0.8% 0.9% 0.9% 8 2.7% 0.0% 1.6% 0.0% 0.0% 0.9% 0.9% 1.1% 100.0% 100.0% 100.0% 100.0% 100.0% 100.0% 100.0% 100.0% Starcrest Consulting Group, LLC B-5 March 2004
197 Figure B.1: Throttle Notch Frequency Distributions 100% 90% 80% 70% 60% 50% 40% 30% 20% 10% 0% Idle Starcrest Consulting Group, LLC B-6 March 2004
198 Figure B.2: Example Shift Activity Record Speed & Throttle / Idle 13:20 13:25 13:30 13:35 13:40 13: Time: 13:21 13:22 13:23 13:24 13:25 13:26 13:27 13:28 13:29 13:30 13:31 13:32 13:33 13:34 13:35 13:36 13:37 13:38 13:39 13:40 13:41 13:42 13:43 13:44 13:45 13:46 Activity Starting work in Pier A yard Backing into Pier A yard Moving railcars in yard Leaving yard Throttle Notch Speed, mph Port of Long Beach B-7 March 2004
199 Figure B.2: Example Shift Activity Record Speed & Throttle / Idle 13:45 13:50 13:55 14:00 14:05 14:10 14: Time: Activity Crossing Avalon Heading NE across Fries w/freight cars 13:47 13:48 13:49 13:50 13:51 13:52 13:53 13:54 13:55 13:56 13:57 13:58 13:59 14:00 14:01 14:02 14:03 14:04 14:05 14:06 14:07 14:08 14:09 14:10 14:11 14:12 14:13 14:14 N of Alameda passing auto terminals Anaheim Turning right at Wilmington Y Crossing Alameda Corridor tracks Under Hwy 103 then Anaheim In Pier B yard Stopped adjacent to Toyota terminal Throttle Notch Speed, mph Port of Long Beach B-8 March 2004
200 Figure B.2: Example Shift Activity Record Speed & Throttle / Idle 14:15 14:20 14:25 14:30 14:35 14: Time: Activity Switching tracks Dropped off the freight cars near Berth 55 then cont'd S Passing Berth 55 14:15 14:16 14:17 14:18 14:19 14:20 14:21 14:22 14:23 14:24 14:25 14:26 14:27 14:28 14:29 14:30 14:31 14:32 14:33 14:34 14:35 14:36 14:37 14:38 14:39 14:40 14:41 14:42 Moving S Changing control locomotive to PHL-35 Pulled off to W alongside Berth 48 Working at LG Everist facility Throttle Notch Speed, mph Port of Long Beach B-9 March 2004
201 Figure B.2: Example Shift Activity Record Speed & Throttle / Idle 14:40 14:45 14:50 14:55 15:00 15:05 15: Time: Activity 14:43 14:44 14:45 14:46 14:47 14:48 14:49 14:50 14:51 14:52 14:53 14:54 14:55 14:56 14:57 14:58 14:59 15:00 15:01 15:02 15:03 15:04 15:05 15:06 15:07 15:08 15:09 15:10 Working at LG Everist facility North-bound from Berth 55 area Back in Pier B yard N end of Pier B yard Throttle Notch Speed, mph Port of Long Beach B-10 March 2004
202 Figure B.2: Example Shift Activity Record Speed & Throttle / Idle 15:10 15:15 15:20 15:25 15:30 15:35 15: Time: Activity 15:11 15:12 15:13 15:14 15:15 15:16 15:17 15:18 15:19 15:20 15:21 15:22 15:23 15:24 15:25 15:26 15:27 15:28 15:29 15:30 15:31 15:32 15:33 15:34 15:35 15:36 15:37 15:38 Backed into J.H. Baxter Co yard, left freight car Moving adjacent to Edison Ave Waiting for tracks to clear Waiting Pulling out with auto carriers Throttle Notch Speed, mph Port of Long Beach B-11 March 2004
203 Figure B.2: Example Shift Activity Record Speed & Throttle / Idle 15:35 15:40 15:45 15:50 15: Time: Activity Stopped at Crucero signal Passing under Hwy 103 Passing under Anaheim Waiting alongside Domingez Cannel Sharp left turn 15:39 15:40 15:41 15:42 15:43 15:44 15:45 15:46 15:47 15:48 15:49 15:50 15:51 15:52 15:53 15:54 15:55 15:56 15:57 15:58 15:59 16:00 16:01 16:02 Heading toward Manuel yard Dropping off cars near PCH Throttle Notch Speed, mph Port of Long Beach B-12 March 2004
204 Table B.3: Switching Locomotive Emission Factors EPA Regulatory Support Document Rated Power in HC CO NOx PM Notch Model Power, bhp Notch, bhp g/bhp-hr g/bhp-hr g/bhp-hr g/bhp-hr DB Average - switch locomotiv I Avg. rated HP: DB EMD C I EMD C EMD C EMD C EMD C EMD C EMD C EMD C EMD C EMD C DB EMD E I EMD E EMD E EMD E EMD E EMD E EMD E EMD E EMD E EMD E DB EMD E I EMD E EMD E EMD E EMD E EMD E EMD E EMD E EMD E EMD E Starcrest Consulting Group, LLC B-12 March 2004
205 Table B.4: Line Haul Locomotive Emission Factors EPA Regulatory Support Document Rated Power in HC CO NOx PM Notch Model Power, bhp Notch, bhp g/bhp-hr g/bhp-hr g/bhp-hr g/bhp-hr DB Average - line haul locomotives I Avg. rated HP: DB EMD E I EMD E EMD E EMD E EMD E EMD E EMD E EMD E EMD E EMD E DB EMD E I EMD E EMD E EMD E EMD E EMD E EMD E EMD E EMD E EMD E DB EMD E3B I EMD E3B EMD E3B EMD E3B EMD E3B EMD E3B EMD E3B EMD E3B EMD E3B EMD E3B Starcrest Consulting Group, LLC B-13 March 2004
206 Table B.4: EPA Regulatory Support Document Line Haul Locomotive Emission Factors (cont d) Rated Power in HC CO NOx PM Notch Model Power, bhp Notch, bhp g/bhp-hr g/bhp-hr g/bhp-hr g/bhp-hr DB EMD E3B* NA* 0.64 I EMD E3B NA* EMD E3B NA* EMD E3B NA* EMD E3B NA* EMD E3B NA* EMD E3B NA* EMD E3B NA* EMD E3B NA* EMD E3B NA* 0.26 DB EMD F I EMD F EMD F EMD F EMD F EMD F EMD F EMD F EMD F EMD F DB EMD F3B I EMD F3B EMD F3B EMD F3B EMD F3B EMD F3B EMD F3B EMD F3B EMD F3B EMD F3B DB EMD F3B I EMD F3B EMD F3B EMD F3B EMD F3B EMD F3B EMD F3B EMD F3B EMD F3B EMD F3B Starcrest Consulting Group, LLC B-14 March 2004
207 Table B.4: EPA Regulatory Support Document Line Haul Locomotive Emission Factors (cont d) Rated Power in HC CO NOx PM Notch Model Power, bhp Notch, bhp g/bhp-hr g/bhp-hr g/bhp-hr g/bhp-hr DB EMD G I EMD G EMD G EMD G EMD G EMD G EMD G EMD G EMD G EMD G DB EMD G I EMD G EMD G EMD G EMD G EMD G EMD G EMD G EMD G EMD G DB EMD G3A I EMD G3A EMD G3A EMD G3A EMD G3A EMD G3A EMD G3A EMD G3A EMD G3A EMD G3A DB EMD G3A I EMD G3A EMD G3A EMD G3A EMD G3A EMD G3A EMD G3A EMD G3A EMD G3A EMD G3A Starcrest Consulting Group, LLC B-15 March 2004
208 Table B.4: EPA Regulatory Support Document Line Haul Locomotive Emission Factors (cont d) Rated Power in HC CO NOx PM Notch Model Power, bhp Notch, bhp g/bhp-hr g/bhp-hr g/bhp-hr g/bhp-hr DB GE I GE GE GE GE GE GE GE GE GE DB GE I GE GE GE GE GE GE GE GE GE DB GE I GE GE GE GE GE GE GE GE GE DB GE I GE GE GE GE GE GE GE GE GE Starcrest Consulting Group, LLC B-16 March 2004
209 Table B.4: EPA Regulatory Support Document Line Haul Locomotive Emission Factors (cont d) Rated Power in HC CO NOx PM Notch Model Power, bhp Notch, bhp g/bhp-hr g/bhp-hr g/bhp-hr g/bhp-hr DB GE I GE GE GE GE GE GE GE GE GE DB GE I GE GE GE GE GE GE GE GE GE Starcrest Consulting Group, LLC B-17 March 2004
210 (This page intentionally left blank)
211 APPENDIX C ON-ROAD TRUCKS Starcrest Consulting Group, LLC C-1 March 2004
212 (This page intentionally left blank)
213 APPENDIX C TABLE OF CONTENTS Table C.1 Truck Age Distribution Data Number of License Plates...4 Table C.2 Truck Age Distribution Data Percentage of License Plates...5 Table C.3 EMFAC Model Input File...9 Table C.4 EMFAC Model Output File Table C.5 POLB Off-Terminal Mileage and Emissions Table C.6 POLB On-Terminal Activity Summary Table C.7 POLB On-Terminal Idling Emissions Table C.8 POLB Container Terminal Gate Idling Table C.9 POLB On-Terminal Driving Emissions Table C.10 POLB On-Terminal Emission Summary Figure C.1 Overall Age Distribution of Port Trucks...6 Figure C.2 Age Distributions of Component Data Sets...7 Figure C.3 Comparison of EMFAC with Port-Specific Age Distributions...8 ATTACHMENT C-1: Excerpt from POLB Traffic Study Starcrest Consulting Group, LLC C-2 March 2004
214 Model Year Distribution The distribution of model years in the fleet of trucks operating at the POLB was estimated by running license plate numbers obtained from several POLB and POLA terminals through the California DMV registration database. Tables C.1 and C.2 provide the count and percentage of each model year found for the four terminals that provided license plate numbers. The distribution is graphically depicted in Figures C.1 and C.2. Figure C.3 depicts a comparison of the overall port-specific distribution illustrated in Figure C.1 with the default EMFAC vehicle age distribution. Starcrest Consulting Group, LLC C-3 March 2004
215 Table C.1 Truck Age Distribution Data Number of License Plates MY Term A Term S Term Y Term T ALL totals 1,066 3, ,973 7,162 Starcrest Consulting Group, LLC C-4 March 2004
216 Table C.2 Truck Age Distribution Data Percentage of License Plates MY Term A Term S Term Y Term T ALL % 0.0% 0.8% 0.5% 0.3% % 0.0% 1.0% 0.7% 0.4% % 0.4% 1.8% 1.1% 0.7% % 0.7% 1.8% 1.0% 0.9% % 0.3% 1.6% 1.6% 1.1% % 0.5% 3.0% 4.4% 2.6% % 1.7% 5.6% 8.6% 5.3% % 4.2% 7.0% 9.9% 7.2% % 8.0% 8.6% 11.3% 9.5% % 9.1% 8.4% 9.7% 9.3% % 6.4% 5.2% 7.0% 6.5% % 7.1% 6.4% 7.1% 6.9% % 8.8% 6.5% 5.7% 7.2% % 10.0% 7.7% 7.2% 8.5% % 7.8% 5.5% 4.3% 5.9% % 5.5% 3.4% 3.4% 4.4% % 4.4% 3.0% 2.8% 3.6% % 7.9% 5.3% 4.9% 6.2% % 6.9% 5.1% 4.0% 5.5% % 2.7% 1.5% 1.2% 1.8% % 1.7% 1.8% 0.6% 1.3% % 1.4% 1.1% 0.7% 1.0% % 1.2% 1.7% 0.6% 1.0% % 0.9% 1.8% 0.5% 0.8% % 0.6% 0.6% 0.3% 0.5% % 0.4% 1.0% 0.2% 0.4% % 0.2% 0.4% 0.1% 0.2% % 0.3% 0.3% 0.3% 0.3% % 0.4% 0.4% 0.1% 0.3% % 0.3% 0.2% 0.1% 0.2% % 0.1% 0.5% 0.1% 0.1% % 0.1% 0.3% 0.1% 0.1% % 0.1% 0.1% 0.1% 0.1% % 0.0% 0.0% 0.0% 0.0% % 0.0% 0.0% 0.0% 0.0% % 0.0% 0.0% 0.0% 0.0% % 0.0% 0.2% 0.0% 0.0% % 0.0% 0.0% 0.0% 0.0% % 0.0% 0.0% 0.0% 0.0% % 0.0% 0.0% 0.0% 0.0% % 0.0% 0.0% 0.0% 0.0% % 0.0% 0.0% 0.0% 0.0% % 0.0% 0.0% 0.0% 0.0% % 0.0% 0.1% 0.0% 0.0% % 0.0% 0.3% 0.0% 0.0% totals 100.0% 100.0% 100.0% 100.0% 100.0% Starcrest Consulting Group, LLC C-5 March 2004
217 Figure C.1 Overall Age Distribution of Port Trucks 10% 9% 8% 7% 6% 5% 4% 3% 2% 1% 0% Percent of Fleet Model Year Starcrest Consulting Group, LLC C-6 March 2004
218 Figure C.2 Age Distributions of Component Data Sets Number of Tags Model Year Term A Term S Term Y Term T ALL Starcrest Consulting Group, LLC C-7 March 2004
219 Figure C.3 Comparison of EMFAC with Port-Specific Age Distributions 10.0% 9.0% 8.0% 7.0% 6.0% 5.0% 4.0% 3.0% 2.0% 1.0% 0.0% Percent of Fleet Model Year ALL EMFAC % Starcrest Consulting Group, LLC C-8 March 2004
220 (This page intentionally left blank)
221 (presented on the following 18 pages) Table C.3 EMFAC Model Input File The port-specific age distribution for heavy duty diesel trucks (HDVs) was entered into the EMFAC model by over-writing the defaults for Los Angeles County. All other input variables remained the same. The model was asked to output emission factors at various speeds, such as zero for idling and at 5 mph increments up to 65 MPH. One profile was used for humidity (40%) and temperature (70 degrees Fahrenheit). The model input file reproduced on the following pages has not been changed from its original format except to the extent needed for it to fit the page format of this report, and the addition of headers and footers. Because the file is designed for use by a computer program that uses the information it contains based on its position within the file, there are no column headings or other means to readily identify the meaning of individual components of the file. The file has been included for documentation purposes only. A detailed explanation of the format and content of this model input file would be beyond the scope of this emissions inventory. Starcrest Consulting Group, LLC C-9 March 2004
222 ! WIS data first, 1 scenarios follow ! Number of WIS data items to follow! Pop Tot A_A_A_Pop(age=:,veh=:,fuel=:,area= 0) E E E E E E E E E Starcrest Consulting Group, LLC C-10 March 2004
223 Starcrest Consulting Group, LLC C-11 March 2004
224 E E E E E E E E E E E E E E E E E E E E E E E E E E E Starcrest Consulting Group, LLC C-12 March 2004
225 E E E E+00 Starcrest Consulting Group, LLC C-13 March 2004
226 Starcrest Consulting Group, LLC C-14 March 2004
227 ! Acr Tot A_A_A_acr(age=:,veh=:,fuel=:,area= 0) Starcrest Consulting Group, LLC C-15 March 2004
228 Starcrest Consulting Group, LLC C-16 March 2004
229 Starcrest Consulting Group, LLC C-17 March 2004
230 Starcrest Consulting Group, LLC C-18 March 2004
231 Starcrest Consulting Group, LLC C-19 March 2004
232 Starcrest Consulting Group, LLC C-20 March 2004
233 ! Trips Tot A_A_A_Trips(hour=sum,age=sum,veh=:,fuel=:,area= 0) E E E E E+00 End of WIS data Starcrest Consulting Group, LLC C-21 March 2004
234 DRAFT POLB EI ! Number of scenarios in file, version info Los Angeles County Avg 2002 Annual Default Title! Scenario Title Emfac 8 2! Program mode TOG PM ! Calendar Year 15! Month/Season 4! Geographic area selection: Los Angeles County 19! County Number ! Number of "Emfac" mode speeds, temps, RHs! Emfac speeds (hours 1-24) ! Emfac temperatures (hours 1-24) ! Emfac rel humidities (hours 1-24) FFFFF! WEIGHT Output Options FFTTF! EMFAC Output Options TFFFF! BURDEN Output Options FTFFF! CALIMFAC Output Options FFFFF! EMFACnn Output Options 25! First hour printed for detailed Burden output 6 1! Bag and correction for Calimfac output 1965! First model year considered in calculations 2002! Last model year considered in calculations! Data on I/M Programs! ! Number of I/M programs (num_prog) in scenario 1 59! Area used for I/M basis: Los Angeles (SC) ! Subprograms, start month, and start year for I/M program 1 2 2! Inspection frequency (1=Annual, 2=Biennial) 1 2! Test method 2 2! Visual/Functional checks 1 1! Exhaust Cutpoint Stringency 1 1! Repair Cost 1 1! Mechanic Inspection Effectiveness 0 0! Minimum vehicle age 45 45! Maximum vehicle age ! Minimum model year ! Maximum model year 1 1! Free years 0 0! Years to skip 1 1! Mechanic Repair Effectiveness 1 1! Evap test: 1 => None, 2 => Gas Cap, 3 => Pressure-purge Starcrest Consulting Group, LLC C-22 March 2004
235 DRAFT POLB EI ! Change of ownership percentage ! Annual % vehs captured by random roadside program ! Annual % vehs captured by remote sensing program ! Annual % vehs captured by tamper detection program 0 0! Years of annual inspections for a gross polluter 0 0! Zero if high-emitter profile is not used F F! True if bad exhaust text algorithm is used T T! True if ARB's OBD II assumptions are used for OBD II vehicles T T! All PCs included in program [Yes(T) or No(F)] T T! All LDT included in program [Yes(T) or No(F)] T T! All MDV included in program [Yes(T) or No(F)] F F! All HDGV included in program [Yes(T) or No(F)] F F! All HDDV included in program [Yes(T) or No(F)] F F! All MCs included in program [Yes(T) or No(F)]! Tech groups (if any) in subprogram ! Subprograms, start month, and start year for I/M program ! Inspection frequency (1=Annual, 2=Biennial) 1 1 2! Test method 3 3 3! Visual/Functional checks 2 2 2! Exhaust Cutpoint Stringency 2 2 2! Repair Cost 2 2 2! Mechanic Inspection Effectiveness 0 0 0! Minimum vehicle age ! Maximum vehicle age ! Minimum model year ! Maximum model year 1 1 1! Free years 0 0 0! Years to skip 2 2 2! Mechanic Repair Effectiveness 1 1 1! Evap test: 1 => None, 2 => Gas Cap, 3 => Pressure-purge ! Change of ownership percentage ! Annual % vehs captured by random roadside program ! Annual % vehs captured by remote sensing program ! Annual % vehs captured by tamper detection program 0 0 0! Years of annual inspections for a gross polluter 0 0 0! Zero if high-emitter profile is not used F F F! True if bad exhaust text algorithm is used T T T! True if ARB's OBD II assumptions are used for OBD II vehicles F T T! All PCs included in program [Yes(T) or No(F)] F T T! All LDT included in program [Yes(T) or No(F)] F T T! All MDV included in program [Yes(T) or No(F)] T F F! All HDGV included in program [Yes(T) or No(F)] F F F! All HDDV included in program [Yes(T) or No(F)] F F F! All MCs included in program [Yes(T) or No(F)]! Tech groups (if any) in subprogram ! Subprograms, start month, and start year for I/M program 3 Starcrest Consulting Group, LLC C-23 March 2004
236 DRAFT POLB EI 2! Inspection frequency (1=Annual, 2=Biennial) 2! Test method 3! Visual/Functional checks 3! Exhaust Cutpoint Stringency 2! Repair Cost 2! Mechanic Inspection Effectiveness 0! Minimum vehicle age 45! Maximum vehicle age 1966! Minimum model year 2040! Maximum model year 1! Free years 0! Years to skip 2! Mechanic Repair Effectiveness 1! Evap test: 1 => None, 2 => Gas Cap, 3 => Pressure-purge 0.17! Change of ownership percentage 0.00! Annual % vehs captured by random roadside program 0.00! Annual % vehs captured by remote sensing program 0.00! Annual % vehs captured by tamper detection program 0! Years of annual inspections for a gross polluter 0! Zero if high-emitter profile is not used F! True if bad exhaust text algorithm is used T! True if ARB's OBD II assumptions are used for OBD II vehicles T! All PCs included in program [Yes(T) or No(F)] T! All LDT included in program [Yes(T) or No(F)] T! All MDV included in program [Yes(T) or No(F)] T! All HDGV included in program [Yes(T) or No(F)] F! All HDDV included in program [Yes(T) or No(F)] F! All MCs included in program [Yes(T) or No(F)]! Tech groups (if any) in subprogram ! Subprograms, start month, and start year for I/M program 4 2 2! Inspection frequency (1=Annual, 2=Biennial) 2 2! Test method 3 3! Visual/Functional checks 3 3! Exhaust Cutpoint Stringency 3 3! Repair Cost 2 2! Mechanic Inspection Effectiveness 0 0! Minimum vehicle age 30 30! Maximum vehicle age ! Minimum model year ! Maximum model year 4 4! Free years 0 0! Years to skip 2 2! Mechanic Repair Effectiveness 2 2! Evap test: 1 => None, 2 => Gas Cap, 3 => Pressure-purge ! Change of ownership percentage ! Annual % vehs captured by random roadside program Starcrest Consulting Group, LLC C-24 March 2004
237 DRAFT POLB EI ! Annual % vehs captured by remote sensing program ! Annual % vehs captured by tamper detection program 0 0! Years of annual inspections for a gross polluter 0 0! Zero if high-emitter profile is not used F F! True if bad exhaust text algorithm is used T T! True if ARB's OBD II assumptions are used for OBD II vehicles F T! All PCs included in program [Yes(T) or No(F)] F T! All LDT included in program [Yes(T) or No(F)] F T! All MDV included in program [Yes(T) or No(F)] T F! All HDGV included in program [Yes(T) or No(F)] F F! All HDDV included in program [Yes(T) or No(F)] F F! All MCs included in program [Yes(T) or No(F)]! Tech groups (if any) in subprogram ! Subprograms, start month, and start year for I/M program 5 2 2! Inspection frequency (1=Annual, 2=Biennial) 2 4! Test method 3 3! Visual/Functional checks 3 1! Exhaust Cutpoint Stringency 3 3! Repair Cost 2 2! Mechanic Inspection Effectiveness 0 0! Minimum vehicle age 30 30! Maximum vehicle age ! Minimum model year ! Maximum model year 4 4! Free years 0 0! Years to skip 2 2! Mechanic Repair Effectiveness 2 2! Evap test: 1 => None, 2 => Gas Cap, 3 => Pressure-purge ! Change of ownership percentage ! Annual % vehs captured by random roadside program ! Annual % vehs captured by remote sensing program ! Annual % vehs captured by tamper detection program 0 0! Years of annual inspections for a gross polluter 0 0! Zero if high-emitter profile is not used F F! True if bad exhaust text algorithm is used T T! True if ARB's OBD II assumptions are used for OBD II vehicles F T! All PCs included in program [Yes(T) or No(F)] F T! All LDT included in program [Yes(T) or No(F)] F T! All MDV included in program [Yes(T) or No(F)] T F! All HDGV included in program [Yes(T) or No(F)] F F! All HDDV included in program [Yes(T) or No(F)] F F! All MCs included in program [Yes(T) or No(F)]! Tech groups (if any) in subprogram. # Starcrest Consulting Group, LLC C-25 March 2004
238 (This page intentionally left blank)
239 Table C.4 EMFAC Model Output File (presented on the following 33 pages) The EMFAC model produces an output file that contains emission factors for many different vehicle and fuel types, for each speed range from 0 to 65 mph. The appropriate emission factors have been taken from this file to estimate emissions from diesel HDVs (listed in the output file in the group of emission factors under HHD DSL for heavy heavy-duty diesel vehicles. The first major group of factors (under the heading Table 1: Running Exhaust Emissions) contains the running emission factors in terms of grams per mile for speeds over 0 mph, and grams per hour for speed = 0 mph (i.e., idling time). The model output file reproduced on the following pages has not been changed from its original format except to the extent needed for it to fit the page format of this report, and the addition of headers and footers. The file has been included for documentation purposes only. A detailed explanation of the format and content of this model output file would be beyond the scope of this emissions inventory. Starcrest Consulting Group, LLC C-26 March 2004
240 Table C-4 EMFAC2002 Output POLB Baseline EI Title : Los Angeles County Avg 2002 Annual Default Title Version : Emfac2002 V2.2 Sept ** WIS Enabled ** Run Date : 10/31/03 15:55:47 Scen Year: Model Years: 1965 to 2002 Season : Annual Area : Los Angeles County ***************************************************************************************** Year: Model Years 1965 to 2002 Inclusive -- Annual Emfac2002 Emission Factors: V2.2 Sept WIS Enabled County Average Los Angeles Count County Average Table 1: Running Exhaust Emissions (grams/mile; grams/idle-hour) Pollutant Name: Total Organic Gases Temperature: 70F Relative Humidity: 40% Speed LDA LDA LDA LDA LDT1 LDT1 LDT1 LDT1 LDT2 LDT2 LDT2 LDT2 MDV MDV MDV MDV LHD1 LHD1 LHD1 MPH NCAT CAT DSL ALL NCAT CAT DSL ALL NCAT CAT DSL ALL NCAT CAT DSL ALL NCAT CAT DSL Pollutant Name: Carbon Monoxide Temperature: 70F Relative Humidity: 40% Speed LDA LDA LDA LDA LDT1 LDT1 LDT1 LDT1 LDT2 LDT2 LDT2 LDT2 MDV MDV MDV MDV LHD1 LHD1 LHD1 MPH NCAT CAT DSL ALL NCAT CAT DSL ALL NCAT CAT DSL ALL NCAT CAT DSL ALL NCAT CAT DSL Starcrest Consulting Group, LLC page 1 of 33 March 2004
241 Table C-4 EMFAC2002 Output POLB Baseline EI LHD1 LHD2 LHD2 LHD2 LHD2 MHD MHD MHD MHD HHD HHD HHD HHD LHV LHV LHV LHV UBUS UBUS UBUS ALL NCAT CAT DSL ALL NCAT CAT DSL ALL NCAT CAT DSL ALL NCAT CAT DSL ALL NCAT CAT DSL LHD1 LHD2 LHD2 LHD2 LHD2 MHD MHD MHD MHD HHD HHD HHD HHD LHV LHV LHV LHV UBUS UBUS UBUS ALL NCAT CAT DSL ALL NCAT CAT DSL ALL NCAT CAT DSL ALL NCAT CAT DSL ALL NCAT CAT DSL Starcrest Consulting Group, LLC page 2 of 33 March 2004
242 Table C-4 EMFAC2002 Output POLB Baseline EI UBUS MCY MCY MCY MCY SBUS SBUS SBUS SBUS MH MH MH MH ALL ALL ALL ALL ALL NCAT CAT DSL ALL NCAT CAT DSL ALL NCAT CAT DSL ALL NCAT CAT DSL ALL UBUS MCY MCY MCY MCY SBUS SBUS SBUS SBUS MH MH MH MH ALL ALL ALL ALL ALL NCAT CAT DSL ALL NCAT CAT DSL ALL NCAT CAT DSL ALL NCAT CAT DSL ALL Starcrest Consulting Group, LLC page 3 of 33 March 2004
243 Table C-4 EMFAC2002 Output POLB Baseline EI Pollutant Name: Oxides of Nitrogen Temperature: 70F Relative Humidity: 40% Speed LDA LDA LDA LDA LDT1 LDT1 LDT1 LDT1 LDT2 LDT2 LDT2 LDT2 MDV MDV MDV MDV LHD1 LHD1 LHD1 MPH NCAT CAT DSL ALL NCAT CAT DSL ALL NCAT CAT DSL ALL NCAT CAT DSL ALL NCAT CAT DSL Pollutant Name: Carbon Dioxide Temperature: 70F Relative Humidity: 40% Speed LDA LDA LDA LDA LDT1 LDT1 LDT1 LDT1 LDT2 LDT2 LDT2 LDT2 MDV MDV MDV MDV LHD1 LHD1 LHD1 MPH NCAT CAT DSL ALL NCAT CAT DSL ALL NCAT CAT DSL ALL NCAT CAT DSL ALL NCAT CAT DSL Pollutant Name: Sulfur Dioxide Temperature: 70F Relative Humidity: 40% Speed LDA LDA LDA LDA LDT1 LDT1 LDT1 LDT1 LDT2 LDT2 LDT2 LDT2 MDV MDV MDV MDV LHD1 LHD1 LHD1 MPH NCAT CAT DSL ALL NCAT CAT DSL ALL NCAT CAT DSL ALL NCAT CAT DSL ALL NCAT CAT DSL Starcrest Consulting Group, LLC page 4 of 33 March 2004
244 Table C-4 EMFAC2002 Output POLB Baseline EI LHD1 LHD2 LHD2 LHD2 LHD2 MHD MHD MHD MHD HHD HHD HHD HHD LHV LHV LHV LHV UBUS UBUS UBUS ALL NCAT CAT DSL ALL NCAT CAT DSL ALL NCAT CAT DSL ALL NCAT CAT DSL ALL NCAT CAT DSL LHD1 LHD2 LHD2 LHD2 LHD2 MHD MHD MHD MHD HHD HHD HHD HHD LHV LHV LHV LHV UBUS UBUS UBUS ALL NCAT CAT DSL ALL NCAT CAT DSL ALL NCAT CAT DSL ALL NCAT CAT DSL ALL NCAT CAT DSL LHD1 LHD2 LHD2 LHD2 LHD2 MHD MHD MHD MHD HHD HHD HHD HHD LHV LHV LHV LHV UBUS UBUS UBUS ALL NCAT CAT DSL ALL NCAT CAT DSL ALL NCAT CAT DSL ALL NCAT CAT DSL ALL NCAT CAT DSL Starcrest Consulting Group, LLC page 5 of 33 March 2004
245 Table C-4 EMFAC2002 Output POLB Baseline EI UBUS MCY MCY MCY MCY SBUS SBUS SBUS SBUS MH MH MH MH ALL ALL ALL ALL ALL NCAT CAT DSL ALL NCAT CAT DSL ALL NCAT CAT DSL ALL NCAT CAT DSL ALL UBUS MCY MCY MCY MCY SBUS SBUS SBUS SBUS MH MH MH MH ALL ALL ALL ALL ALL NCAT CAT DSL ALL NCAT CAT DSL ALL NCAT CAT DSL ALL NCAT CAT DSL ALL UBUS MCY MCY MCY MCY SBUS SBUS SBUS SBUS MH MH MH MH ALL ALL ALL ALL ALL NCAT CAT DSL ALL NCAT CAT DSL ALL NCAT CAT DSL ALL NCAT CAT DSL ALL Starcrest Consulting Group, LLC page 6 of 33 March 2004
246 Table C-4 EMFAC2002 Output POLB Baseline EI Pollutant Name: PM10 Temperature: 70F Relative Humidity: 40% Speed LDA LDA LDA LDA LDT1 LDT1 LDT1 LDT1 LDT2 LDT2 LDT2 LDT2 MDV MDV MDV MDV LHD1 LHD1 LHD1 MPH NCAT CAT DSL ALL NCAT CAT DSL ALL NCAT CAT DSL ALL NCAT CAT DSL ALL NCAT CAT DSL Pollutant Name: PM10 - Tire Wear Temperature: 70F Relative Humidity: 40% Speed LDA LDA LDA LDA LDT1 LDT1 LDT1 LDT1 LDT2 LDT2 LDT2 LDT2 MDV MDV MDV MDV LHD1 LHD1 LHD1 MPH NCAT CAT DSL ALL NCAT CAT DSL ALL NCAT CAT DSL ALL NCAT CAT DSL ALL NCAT CAT DSL Pollutant Name: PM10 - Break Wear Temperature: 70F Relative Humidity: 40% Speed LDA LDA LDA LDA LDT1 LDT1 LDT1 LDT1 LDT2 LDT2 LDT2 LDT2 MDV MDV MDV MDV LHD1 LHD1 LHD1 MPH NCAT CAT DSL ALL NCAT CAT DSL ALL NCAT CAT DSL ALL NCAT CAT DSL ALL NCAT CAT DSL Starcrest Consulting Group, LLC page 7 of 33 March 2004
247 Table C-4 EMFAC2002 Output POLB Baseline EI LHD1 LHD2 LHD2 LHD2 LHD2 MHD MHD MHD MHD HHD HHD HHD HHD LHV LHV LHV LHV UBUS UBUS UBUS ALL NCAT CAT DSL ALL NCAT CAT DSL ALL NCAT CAT DSL ALL NCAT CAT DSL ALL NCAT CAT DSL LHD1 LHD2 LHD2 LHD2 LHD2 MHD MHD MHD MHD HHD HHD HHD HHD LHV LHV LHV LHV UBUS UBUS UBUS ALL NCAT CAT DSL ALL NCAT CAT DSL ALL NCAT CAT DSL ALL NCAT CAT DSL ALL NCAT CAT DSL LHD1 LHD2 LHD2 LHD2 LHD2 MHD MHD MHD MHD HHD HHD HHD HHD LHV LHV LHV LHV UBUS UBUS UBUS ALL NCAT CAT DSL ALL NCAT CAT DSL ALL NCAT CAT DSL ALL NCAT CAT DSL ALL NCAT CAT DSL Starcrest Consulting Group, LLC page 8 of 33 March 2004
248 Table C-4 EMFAC2002 Output POLB Baseline EI UBUS MCY MCY MCY MCY SBUS SBUS SBUS SBUS MH MH MH MH ALL ALL ALL ALL ALL NCAT CAT DSL ALL NCAT CAT DSL ALL NCAT CAT DSL ALL NCAT CAT DSL ALL UBUS MCY MCY MCY MCY SBUS SBUS SBUS SBUS MH MH MH MH ALL ALL ALL ALL ALL NCAT CAT DSL ALL NCAT CAT DSL ALL NCAT CAT DSL ALL NCAT CAT DSL ALL UBUS MCY MCY MCY MCY SBUS SBUS SBUS SBUS MH MH MH MH ALL ALL ALL ALL ALL NCAT CAT DSL ALL NCAT CAT DSL ALL NCAT CAT DSL ALL NCAT CAT DSL ALL Starcrest Consulting Group, LLC page 9 of 33 March 2004
249 Table C-4 EMFAC2002 Output POLB Baseline EI Pollutant Name: Gasoline - mi/gal Temperature: 70F Relative Humidity: 40% Speed LDA LDA LDA LDA LDT1 LDT1 LDT1 LDT1 LDT2 LDT2 LDT2 LDT2 MDV MDV MDV MDV LHD1 LHD1 LHD1 MPH NCAT CAT DSL ALL NCAT CAT DSL ALL NCAT CAT DSL ALL NCAT CAT DSL ALL NCAT CAT DSL Pollutant Name: Diesel - mi/gal Temperature: 70F Relative Humidity: 40% Speed LDA LDA LDA LDA LDT1 LDT1 LDT1 LDT1 LDT2 LDT2 LDT2 LDT2 MDV MDV MDV MDV LHD1 LHD1 LHD1 MPH NCAT CAT DSL ALL NCAT CAT DSL ALL NCAT CAT DSL ALL NCAT CAT DSL ALL NCAT CAT DSL Starcrest Consulting Group, LLC page 10 of 33 March 2004
250 Table C-4 EMFAC2002 Output POLB Baseline EI LHD1 LHD2 LHD2 LHD2 LHD2 MHD MHD MHD MHD HHD HHD HHD HHD LHV LHV LHV LHV UBUS UBUS UBUS ALL NCAT CAT DSL ALL NCAT CAT DSL ALL NCAT CAT DSL ALL NCAT CAT DSL ALL NCAT CAT DSL LHD1 LHD2 LHD2 LHD2 LHD2 MHD MHD MHD MHD HHD HHD HHD HHD LHV LHV LHV LHV UBUS UBUS UBUS ALL NCAT CAT DSL ALL NCAT CAT DSL ALL NCAT CAT DSL ALL NCAT CAT DSL ALL NCAT CAT DSL Starcrest Consulting Group, LLC page 11 of 33 March 2004
251 Table C-4 EMFAC2002 Output POLB Baseline EI UBUS MCY MCY MCY MCY SBUS SBUS SBUS SBUS MH MH MH MH ALL ALL ALL ALL ALL NCAT CAT DSL ALL NCAT CAT DSL ALL NCAT CAT DSL ALL NCAT CAT DSL ALL UBUS MCY MCY MCY MCY SBUS SBUS SBUS SBUS MH MH MH MH ALL ALL ALL ALL ALL NCAT CAT DSL ALL NCAT CAT DSL ALL NCAT CAT DSL ALL NCAT CAT DSL ALL Starcrest Consulting Group, LLC page 12 of 33 March 2004
252 Table C-4 EMFAC2002 Output POLB Baseline EI Title : Los Angeles County Avg 2002 Annual Default Title Version : Emfac2002 V2.2 Sept ** WIS Enabled ** Run Date : 10/31/03 15:55:47 Scen Year: Model Years: 1965 to 2002 Season : Annual Area : Los Angeles County ***************************************************************************************** Year: Model Years 1965 to 2002 Inclusive -- Annual Emfac2002 Emission Factors: V2.2 Sept WIS Enabled County Average Los Angeles Count County Average Table 2: Starting Emissions (grams/trip) Pollutant Name: Total Organic Gases Temperature: 70F Relative Humidity: ALL Time LDA LDA LDA LDA LDT1 LDT1 LDT1 LDT1 LDT2 LDT2 LDT2 LDT2 MDV MDV MDV MDV LHD1 LHD1 LHD1 min NCAT CAT DSL ALL NCAT CAT DSL ALL NCAT CAT DSL ALL NCAT CAT DSL ALL NCAT CAT DSL Pollutant Name: Carbon Monoxide Temperature: 70F Relative Humidity: ALL Time LDA LDA LDA LDA LDT1 LDT1 LDT1 LDT1 LDT2 LDT2 LDT2 LDT2 MDV MDV MDV MDV LHD1 LHD1 LHD1 min NCAT CAT DSL ALL NCAT CAT DSL ALL NCAT CAT DSL ALL NCAT CAT DSL ALL NCAT CAT DSL Starcrest Consulting Group, LLC page 13 of 33 March 2004
253 Table C-4 EMFAC2002 Output POLB Baseline EI LHD1 LHD2 LHD2 LHD2 LHD2 MHD MHD MHD MHD HHD HHD HHD HHD LHV LHV LHV LHV UBUS UBUS UBUS ALL NCAT CAT DSL ALL NCAT CAT DSL ALL NCAT CAT DSL ALL NCAT CAT DSL ALL NCAT CAT DSL LHD1 LHD2 LHD2 LHD2 LHD2 MHD MHD MHD MHD HHD HHD HHD HHD LHV LHV LHV LHV UBUS UBUS UBUS ALL NCAT CAT DSL ALL NCAT CAT DSL ALL NCAT CAT DSL ALL NCAT CAT DSL ALL NCAT CAT DSL Starcrest Consulting Group, LLC page 14 of 33 March 2004
254 Table C-4 EMFAC2002 Output POLB Baseline EI UBUS MCY MCY MCY MCY SBUS SBUS SBUS SBUS MH MH MH MH ALL ALL ALL ALL ALL NCAT CAT DSL ALL NCAT CAT DSL ALL NCAT CAT DSL ALL NCAT CAT DSL ALL UBUS MCY MCY MCY MCY SBUS SBUS SBUS SBUS MH MH MH MH ALL ALL ALL ALL ALL NCAT CAT DSL ALL NCAT CAT DSL ALL NCAT CAT DSL ALL NCAT CAT DSL ALL Starcrest Consulting Group, LLC page 15 of 33 March 2004
255 Table C-4 EMFAC2002 Output POLB Baseline EI Pollutant Name: Oxides of Nitrogen Temperature: 70F Relative Humidity: ALL Time LDA LDA LDA LDA LDT1 LDT1 LDT1 LDT1 LDT2 LDT2 LDT2 LDT2 MDV MDV MDV MDV LHD1 LHD1 LHD1 min NCAT CAT DSL ALL NCAT CAT DSL ALL NCAT CAT DSL ALL NCAT CAT DSL ALL NCAT CAT DSL Pollutant Name: Carbon Dioxide Temperature: 70F Relative Humidity: ALL Time LDA LDA LDA LDA LDT1 LDT1 LDT1 LDT1 LDT2 LDT2 LDT2 LDT2 MDV MDV MDV MDV LHD1 LHD1 LHD1 min NCAT CAT DSL ALL NCAT CAT DSL ALL NCAT CAT DSL ALL NCAT CAT DSL ALL NCAT CAT DSL Starcrest Consulting Group, LLC page 16 of 33 March 2004
256 Table C-4 EMFAC2002 Output POLB Baseline EI LHD1 LHD2 LHD2 LHD2 LHD2 MHD MHD MHD MHD HHD HHD HHD HHD LHV LHV LHV LHV UBUS UBUS UBUS ALL NCAT CAT DSL ALL NCAT CAT DSL ALL NCAT CAT DSL ALL NCAT CAT DSL ALL NCAT CAT DSL LHD1 LHD2 LHD2 LHD2 LHD2 MHD MHD MHD MHD HHD HHD HHD HHD LHV LHV LHV LHV UBUS UBUS UBUS ALL NCAT CAT DSL ALL NCAT CAT DSL ALL NCAT CAT DSL ALL NCAT CAT DSL ALL NCAT CAT DSL Starcrest Consulting Group, LLC page 17 of 33 March 2004
257 Table C-4 EMFAC2002 Output DRAFT POLB EI UBUS MCY MCY MCY MCY SBUS SBUS SBUS SBUS MH MH MH MH ALL ALL ALL ALL ALL NCAT CAT DSL ALL NCAT CAT DSL ALL NCAT CAT DSL ALL NCAT CAT DSL ALL UBUS MCY MCY MCY MCY SBUS SBUS SBUS SBUS MH MH MH MH ALL ALL ALL ALL ALL NCAT CAT DSL ALL NCAT CAT DSL ALL NCAT CAT DSL ALL NCAT CAT DSL ALL Starcrest Consulting Group, LLC page 18 of 33 March 2004
258 Table C-4 EMFAC2002 Output POLB Baseline EI Pollutant Name: Sulfur Dioxide Temperature: 70F Relative Humidity: ALL Time LDA LDA LDA LDA LDT1 LDT1 LDT1 LDT1 LDT2 LDT2 LDT2 LDT2 MDV MDV MDV MDV LHD1 LHD1 LHD1 min NCAT CAT DSL ALL NCAT CAT DSL ALL NCAT CAT DSL ALL NCAT CAT DSL ALL NCAT CAT DSL Pollutant Name: PM10 Temperature: 70F Relative Humidity: ALL Time LDA LDA LDA LDA LDT1 LDT1 LDT1 LDT1 LDT2 LDT2 LDT2 LDT2 MDV MDV MDV MDV LHD1 LHD1 LHD1 min NCAT CAT DSL ALL NCAT CAT DSL ALL NCAT CAT DSL ALL NCAT CAT DSL ALL NCAT CAT DSL Starcrest Consulting Group, LLC page 19 of 33 March 2004
259 Table C-4 EMFAC2002 Output POLB Baseline EI LHD1 LHD2 LHD2 LHD2 LHD2 MHD MHD MHD MHD HHD HHD HHD HHD LHV LHV LHV LHV UBUS UBUS UBUS ALL NCAT CAT DSL ALL NCAT CAT DSL ALL NCAT CAT DSL ALL NCAT CAT DSL ALL NCAT CAT DSL LHD1 LHD2 LHD2 LHD2 LHD2 MHD MHD MHD MHD HHD HHD HHD HHD LHV LHV LHV LHV UBUS UBUS UBUS ALL NCAT CAT DSL ALL NCAT CAT DSL ALL NCAT CAT DSL ALL NCAT CAT DSL ALL NCAT CAT DSL Starcrest Consulting Group, LLC page 20 of 33 March 2004
260 Table C-4 EMFAC2002 Output POLB Baseline EI UBUS MCY MCY MCY MCY SBUS SBUS SBUS SBUS MH MH MH MH ALL ALL ALL ALL ALL NCAT CAT DSL ALL NCAT CAT DSL ALL NCAT CAT DSL ALL NCAT CAT DSL ALL UBUS MCY MCY MCY MCY SBUS SBUS SBUS SBUS MH MH MH MH ALL ALL ALL ALL ALL NCAT CAT DSL ALL NCAT CAT DSL ALL NCAT CAT DSL ALL NCAT CAT DSL ALL Starcrest Consulting Group, LLC page 21 of 33 March 2004
261 Table C-4 EMFAC2002 Output POLB Baseline EI Title : Los Angeles County Avg 2002 Annual Default Title Version : Emfac2002 V2.2 Sept ** WIS Enabled ** Run Date : 10/31/03 15:55:47 Scen Year: Model Years: 1965 to 2002 Season : Annual Area : Los Angeles County ***************************************************************************************** Year: Model Years 1965 to 2002 Inclusive -- Annual Emfac2002 Emission Factors: V2.2 Sept WIS Enabled County Average Los Angeles Count County Average Table 4: Hot Soak Emissions (grams/trip) Pollutant Name: Total Organic Gases Temperature: 70F Relative Humidity: ALL Time LDA LDA LDA LDA LDT1 LDT1 LDT1 LDT1 LDT2 LDT2 LDT2 LDT2 MDV MDV MDV MDV LHD1 LHD1 LHD1 min NCAT CAT DSL ALL NCAT CAT DSL ALL NCAT CAT DSL ALL NCAT CAT DSL ALL NCAT CAT DSL Hot soak results are scaled to reflect zero emissions for trip lengths of less than 5 minutes (about 25% of in-use trips). Title : Los Angeles County Avg 2002 Annual Default Title Version : Emfac2002 V2.2 Sept ** WIS Enabled ** Run Date : 10/31/03 15:55:47 Scen Year: Model Years: 1965 to 2002 Season : Annual Area : Los Angeles County ***************************************************************************************** Year: Model Years 1965 to 2002 Inclusive -- Annual Emfac2002 Emission Factors: V2.2 Sept WIS Enabled County Average Los Angeles Count County Average Table 5a: Partial Day Diurnal Loss Emissions (grams/hour) Pollutant Name: Total Organic Gases Temperature: ALL Relative Humidity: ALL Temp LDA LDA LDA LDA LDT1 LDT1 LDT1 LDT1 LDT2 LDT2 LDT2 LDT2 MDV MDV MDV MDV LHD1 LHD1 LHD1 degf NCAT CAT DSL ALL NCAT CAT DSL ALL NCAT CAT DSL ALL NCAT CAT DSL ALL NCAT CAT DSL Starcrest Consulting Group, LLC page 22 of 33 March 2004
262 Table C-4 EMFAC2002 Output POLB Baseline EI LHD1 LHD2 LHD2 LHD2 LHD2 MHD MHD MHD MHD HHD HHD HHD HHD LHV LHV LHV LHV UBUS UBUS UBUS ALL NCAT CAT DSL ALL NCAT CAT DSL ALL NCAT CAT DSL ALL NCAT CAT DSL ALL NCAT CAT DSL LHD1 LHD2 LHD2 LHD2 LHD2 MHD MHD MHD MHD HHD HHD HHD HHD LHV LHV LHV LHV UBUS UBUS UBUS ALL NCAT CAT DSL ALL NCAT CAT DSL ALL NCAT CAT DSL ALL NCAT CAT DSL ALL NCAT CAT DSL Starcrest Consulting Group, LLC page 23 of 33 March 2004
263 Table C-4 EMFAC2002 Output POLB Baseline EI UBUS MCY MCY MCY MCY SBUS SBUS SBUS SBUS MH MH MH MH ALL ALL ALL ALL ALL NCAT CAT DSL ALL NCAT CAT DSL ALL NCAT CAT DSL ALL NCAT CAT DSL ALL UBUS MCY MCY MCY MCY SBUS SBUS SBUS SBUS MH MH MH MH ALL ALL ALL ALL ALL NCAT CAT DSL ALL NCAT CAT DSL ALL NCAT CAT DSL ALL NCAT CAT DSL ALL Starcrest Consulting Group, LLC page 24 of 33 March 2004
264 Table C-4 EMFAC2002 Output POLB Baseline EI Title : Los Angeles County Avg 2002 Annual Default Title Version : Emfac2002 V2.2 Sept ** WIS Enabled ** Run Date : 10/31/03 15:55:47 Scen Year: Model Years: 1965 to 2002 Season : Annual Area : Los Angeles County ***************************************************************************************** Year: Model Years 1965 to 2002 Inclusive -- Annual Emfac2002 Emission Factors: V2.2 Sept WIS Enabled County Average Los Angeles Count County Average Table 5b: Multi-Day Diurnal Loss Emissions (grams/hour) Pollutant Name: Total Organic Gases Temperature: ALL Relative Humidity: ALL Temp LDA LDA LDA LDA LDT1 LDT1 LDT1 LDT1 LDT2 LDT2 LDT2 LDT2 MDV MDV MDV MDV LHD1 LHD1 LHD1 degf NCAT CAT DSL ALL NCAT CAT DSL ALL NCAT CAT DSL ALL NCAT CAT DSL ALL NCAT CAT DSL Title : Los Angeles County Avg 2002 Annual Default Title Version : Emfac2002 V2.2 Sept ** WIS Enabled ** Run Date : 10/31/03 15:55:47 Scen Year: Model Years: 1965 to 2002 Season : Annual Area : Los Angeles County ***************************************************************************************** Year: Model Years 1965 to 2002 Inclusive -- Annual Emfac2002 Emission Factors: V2.2 Sept WIS Enabled County Average Los Angeles Count County Average Table 6a: Partial Day Resting Loss Emissions (grams/hour) Pollutant Name: Total Organic Gases Temperature: ALL Relative Humidity: ALL Temp LDA LDA LDA LDA LDT1 LDT1 LDT1 LDT1 LDT2 LDT2 LDT2 LDT2 MDV MDV MDV MDV LHD1 LHD1 LHD1 degf NCAT CAT DSL ALL NCAT CAT DSL ALL NCAT CAT DSL ALL NCAT CAT DSL ALL NCAT CAT DSL Starcrest Consulting Group, LLC page 25 of 33 March 2004
265 Table C-4 EMFAC2002 Output POLB Baseline EI LHD1 LHD2 LHD2 LHD2 LHD2 MHD MHD MHD MHD HHD HHD HHD HHD LHV LHV LHV LHV UBUS UBUS UBUS ALL NCAT CAT DSL ALL NCAT CAT DSL ALL NCAT CAT DSL ALL NCAT CAT DSL ALL NCAT CAT DSL LHD1 LHD2 LHD2 LHD2 LHD2 MHD MHD MHD MHD HHD HHD HHD HHD LHV LHV LHV LHV UBUS UBUS UBUS ALL NCAT CAT DSL ALL NCAT CAT DSL ALL NCAT CAT DSL ALL NCAT CAT DSL ALL NCAT CAT DSL Starcrest Consulting Group, LLC page 26 of 33 March 2004
266 Table C-4 EMFAC2002 Output POLB Baseline EI UBUS MCY MCY MCY MCY SBUS SBUS SBUS SBUS MH MH MH MH ALL ALL ALL ALL ALL NCAT CAT DSL ALL NCAT CAT DSL ALL NCAT CAT DSL ALL NCAT CAT DSL ALL UBUS MCY MCY MCY MCY SBUS SBUS SBUS SBUS MH MH MH MH ALL ALL ALL ALL ALL NCAT CAT DSL ALL NCAT CAT DSL ALL NCAT CAT DSL ALL NCAT CAT DSL ALL Starcrest Consulting Group, LLC page 27 of 33 March 2004
267 Table C-4 EMFAC2002 Output POLB Baseline EI Title : Los Angeles County Avg 2002 Annual Default Title Version : Emfac2002 V2.2 Sept ** WIS Enabled ** Run Date : 10/31/03 15:55:47 Scen Year: Model Years: 1965 to 2002 Season : Annual Area : Los Angeles County ***************************************************************************************** Year: Model Years 1965 to 2002 Inclusive -- Annual Emfac2002 Emission Factors: V2.2 Sept WIS Enabled County Average Los Angeles Count County Average Table 6b: Multi-Day Resting Loss Emissions (grams/hour) Pollutant Name: Total Organic Gases Temperature: ALL Relative Humidity: ALL Temp LDA LDA LDA LDA LDT1 LDT1 LDT1 LDT1 LDT2 LDT2 LDT2 LDT2 MDV MDV MDV MDV LHD1 LHD1 LHD1 degf NCAT CAT DSL ALL NCAT CAT DSL ALL NCAT CAT DSL ALL NCAT CAT DSL ALL NCAT CAT DSL Title : Los Angeles County Avg 2002 Annual Default Title Version : Emfac2002 V2.2 Sept ** WIS Enabled ** Run Date : 10/31/03 15:55:47 Scen Year: Model Years: 1965 to 2002 Season : Annual Area : Los Angeles County ***************************************************************************************** Year: Model Years 1965 to 2002 Inclusive -- Annual Emfac2002 Emission Factors: V2.2 Sept WIS Enabled County Average Los Angeles Count County Average Table 7: Estimated Travel Fractions Pollutant Name: Temperature: ALL Relative Humidity: ALL LDA LDA LDA LDA LDT1 LDT1 LDT1 LDT1 LDT2 LDT2 LDT2 LDT2 MDV MDV MDV MDV LHD1 LHD1 LHD1 NCAT CAT DSL ALL NCAT CAT DSL ALL NCAT CAT DSL ALL NCAT CAT DSL ALL NCAT CAT DSL %VMT %TRIP %VEH Starcrest Consulting Group, LLC page 28 of 33 March 2004
268 Table C-4 EMFAC2002 Output POLB Baseline EI LHD1 LHD2 LHD2 LHD2 LHD2 MHD MHD MHD MHD HHD HHD HHD HHD LHV LHV LHV LHV UBUS UBUS UBUS ALL NCAT CAT DSL ALL NCAT CAT DSL ALL NCAT CAT DSL ALL NCAT CAT DSL ALL NCAT CAT DSL LHD1 LHD2 LHD2 LHD2 LHD2 MHD MHD MHD MHD HHD HHD HHD HHD LHV LHV LHV LHV UBUS UBUS UBUS ALL NCAT CAT DSL ALL NCAT CAT DSL ALL NCAT CAT DSL ALL NCAT CAT DSL ALL NCAT CAT DSL Starcrest Consulting Group, LLC page 29 of 33 March 2004
269 Table C-4 EMFAC2002 Output POLB Baseline EI UBUS MCY MCY MCY MCY SBUS SBUS SBUS SBUS MH MH MH MH ALL ALL ALL ALL ALL NCAT CAT DSL ALL NCAT CAT DSL ALL NCAT CAT DSL ALL NCAT CAT DSL ALL UBUS MCY MCY MCY MCY SBUS SBUS SBUS SBUS MH MH MH MH ALL ALL ALL ALL ALL NCAT CAT DSL ALL NCAT CAT DSL ALL NCAT CAT DSL ALL NCAT CAT DSL ALL Starcrest Consulting Group, LLC page 30 of 33 March 2004
270 Table C-4 EMFAC2002 Output POLB Baseline EI Title : Los Angeles County Avg 2002 Annual Default Title Version : Emfac2002 V2.2 Sept ** WIS Enabled ** Run Date : 10/31/03 15:55:47 Scen Year: Model Years: 1965 to 2002 Season : Annual Area : Los Angeles County ***************************************************************************************** Year: Model Years 1965 to 2002 Inclusive -- Annual Emfac2002 Emission Factors: V2.2 Sept WIS Enabled County Average Los Angeles Count County Average Table 8: Evaporative Running Loss Emissions (grams/minute) Pollutant Name: Total Organic Gases Temperature: 70F Relative Humidity: ALL Time LDA LDA LDA LDA LDT1 LDT1 LDT1 LDT1 LDT2 LDT2 LDT2 LDT2 MDV MDV MDV MDV LHD1 LHD1 LHD1 min NCAT CAT DSL ALL NCAT CAT DSL ALL NCAT CAT DSL ALL NCAT CAT DSL ALL NCAT CAT DSL Starcrest Consulting Group, LLC page 31 of 33 March 2004
271 Table C-4 EMFAC2002 Output POLB Baseline EI LHD1 LHD2 LHD2 LHD2 LHD2 MHD MHD MHD MHD HHD HHD HHD HHD LHV LHV LHV LHV UBUS UBUS UBUS ALL NCAT CAT DSL ALL NCAT CAT DSL ALL NCAT CAT DSL ALL NCAT CAT DSL ALL NCAT CAT DSL Starcrest Consulting Group, LLC page 32 of 33 March 2004
272 Table C-4 EMFAC2002 Output POLB Baseline EI UBUS MCY MCY MCY MCY SBUS SBUS SBUS SBUS MH MH MH MH ALL ALL ALL ALL ALL NCAT CAT DSL ALL NCAT CAT DSL ALL NCAT CAT DSL ALL NCAT CAT DSL ALL Starcrest Consulting Group, LLC page 33 of 33 March 2004
273 Table C.5 POLB Off-Terminal Mileage and Emissions (presented on the following 52 pages) This appendix details the emission calculations that were developed from the truck traffic volume information developed by Meyer-Mohaddes Associates, based on the highest monthly terminal throughputs for The table includes the following columns: Period Four daily periods are included in the model: AM (morning peak), MD (mid-day period), PM (afternoon peak), and NT (evening and night between AM and PM periods). These periods encompass a 24-hour day and represent an average day during the peak 2002 month. Roadway Segment The street for which the traffic volume has been estimated. From and To The end-points of the specific roadway segment for which the traffic volume has been estimated. Direction Direction of vehicle travel; travel in both directions was estimated. Bobtails / Chassis / Containers The number of each type of truck passing over the defined segment during the specified period. (The Containers group includes other types of truck, such as tanker trucks.) Total Trucks The sum of the three preceding columns; while the model has been designed to estimate separate volumes for each type of truck (bobtails, chasses, and containers), they are all classified as heavy HDVs and, therefore, all use the same emission factor. Distance The length of the specified street segment (between From and To ). VMT Total Trucks multiplied by Distance; the total mileage for the segment during the specified time period. Speed The average truck speed over the specified segment. Speed Bin The 5 mph speed group into which the average speed falls; speed groups correspond with emission factor speed groups. TOG_EF, CO_EF, NOX_EF, SO2_EF, PM10_EF Emission factors from the EMFAC model for the speed bin specified in the previous column. TOG_LBS, CO_LBS, NOX_LBS, SO2_LBS, PM10_LBS, PM25_LBS Emissions in pounds estimated by multiplying the mileage figure in the VMT column by the emission factor (grams per mile), divided by grams per pound. The column PM25_LBS is calculated by multiplying the PM10_LBS value by 0.92, as discussed in the EI report. Emissions are summed at the bottom of the last page of the table (page 52 of 52). Starcrest Consulting Group, LLC C-62 March 2004
274 Table C-5 On-Road Travel Model and Emission Estimates POLB Baseline EI Period Roadway Segment From To Direction Bobtails Chassis Containers Total Trucks Distance VMT Speed Speed Bin AM Anaheim St Anaheim Way 9th St East Bound AM Anaheim St Anaheim Way 9th St East Bound AM Anaheim St Anaheim Way 9th St East Bound AM Anaheim St 9th St Jackson East Bound AM Anaheim St 9th St Jackson East Bound AM Anaheim St Jackson Santa Fe East Bound AM Anaheim St Santa Fe Canal East Bound AM Anaheim St Canal Caspian East Bound AM Anaheim St Canal Caspian East Bound AM Anaheim St Harbor Ave I-710 SB ramp East Bound AM Anaheim St Harbor Ave I-710 SB ramp East Bound AM New Dock St Henry Ford SR-47 Off Ramp East Bound AM New Dock St SR-47 Off Ramp SR-47 On Ramp East Bound AM SR-47 On Ramp SR-47 NB On Ramp SR-47 NB On Ramp Northbound AM SR-47 SR-47 SR-47 Off Ramp Southbound AM SR-47 SR-47 Off Ramp Ocean Blvd Southbound AM SR-47 Ocean Blvd SR-47 On Ramp Northbound AM SR-47 SR-47 NB On Ramp Henry Ford NB Off RampNorthbound AM Pier A Way Pier B St Carrack Ave East Bound AM Pier B St Anaheim Way Carrack Ave Southbound AM Pier B St Anaheim Way Edison Ave Southbound AM Pier B St Edison Ave Pier B St Southbound AM Pier B St Edison Ave Pico Southbound AM Pier B St Edison Ave Pico Southbound AM Pier B St Edison Ave Pico Southbound AM Carrack Ave Pier A Way Pier A Entrance Southbound AM Carrack Ave Pier A Way Pier A Entrance Southbound AM Equilon Enterprises Carrack Ave Equilon East Bound AM Edison Avenue National Gypsum Co Pier B St Northbound AM Edison Avenue National Gypsum Co Pier B St Northbound AM Edison Avenue National Gypsum Co Pier B St Northbound AM Edison Avenue Pier B St 9th St Northbound AM Anaheim Way Anaheim St Pier B St Southbound AM 9th Street Anaheim St Edison Ave Southbound AM 9th Street Edison Ave Jackson Southbound AM 9th Street Jackson Santa Fe Southbound AM 9th Street Santa Fe Canal Southbound AM 9th Street Canal Caspian Southbound AM 9th Street Caspian Pico Southbound AM 9th Street Caspian Pico Southbound AM 9th Street Caspian Pico Southbound AM 9th Street Caspian Pico Southbound Starcrest Consulting Group, LLC page 1 of 50 March 2004
275 Table C-5 On-Road Travel Model and Emission Estimates POLB Baseline EI Period Roadway Segment AM Anaheim St AM Anaheim St AM Anaheim St AM Anaheim St AM Anaheim St AM Anaheim St AM Anaheim St AM Anaheim St AM Anaheim St AM Anaheim St AM Anaheim St AM New Dock St AM New Dock St AM SR-47 On Ramp AM SR-47 AM SR-47 AM SR-47 AM SR-47 AM Pier A Way AM Pier B St AM Pier B St AM Pier B St AM Pier B St AM Pier B St AM Pier B St AM Carrack Ave AM Carrack Ave AM Equilon Enterprises AM Edison Avenue AM Edison Avenue AM Edison Avenue AM Edison Avenue AM Anaheim Way AM 9th Street AM 9th Street AM 9th Street AM 9th Street AM 9th Street AM 9th Street AM 9th Street AM 9th Street AM 9th Street TOG_E F CO_EF NOX_E F SO2_E F PM10_E F TOG_LB S CO_LB S NOX_LB S SO2_LB S PM10_LB S PM25_LB S Starcrest Consulting Group, LLC page 2 of 50 March 2004
276 Table C-5 On-Road Travel Model and Emission Estimates POLB Baseline EI Period Roadway Segment From To Direction Bobtails Chassis Containers Total Trucks Distance VMT Speed Speed Bin AM 9th Street Pico I-710 Southbound AM 10th Street Caspian Harbor Ave Northbound AM 10th Street Caspian Harbor Ave Northbound AM I-710 9th St Off Ramp 9th St Off Ramp Northbound AM I-710 9th St Off Ramp 9th St Off Ramp Northbound AM I-710 9th St Off Ramp 9th St Off Ramp Northbound AM I-710 9th St Off Ramp 9th St Off Ramp Northbound AM I-710 9th St Off Ramp to Pico 9th St Off Ramp to Pico Southbound AM Pico Ave 9th Street EB 9th Street EB Southbound AM Pico Ave 9th Street WB 9th Street WB Northbound AM Pico Ave 9th Street WB 9th Street WB Northbound AM I-710 Pier B St On Ramp Connector to Ocean WB Southbound AM I-710 Anaheim SB On Ramp Pico SB Ramps Southbound AM I-710 n/o Anaheim SB On Rampn/o Anaheim SB On RampSouthbound AM I-710 s/o Anaheim SB Off Ramps/o Anaheim SB Off RampSouthbound AM Pico Ave 9th St Pier B St Southbound AM Pico Ave Pier B St Pier C St Southbound AM Pico Ave Pier C St Pier D St Southbound AM Pico Ave Pier C St Pier D St Southbound AM Pico Ave Pier D St Quick Stop Lube Southbound AM Pico Ave Pier D St Broadway Southbound AM Pico Ave Broadway Ocean Blvd Off ramp Southbound AM Pico Ave Ocean Blvd Ramps n/o Pier E St Southbound AM Pico Ave n/o Pier E St Pier E St Southbound AM Pico Ave Pier E St s/o Pier E St Southbound AM Pico Ave Connector Connector Southbound AM Pico Ave Connector Harbor Plaza Southbound AM Pico Ave Connector Harbor Plaza Southbound AM Pier E St Pico Ave Pier E Terminals Southbound AM Pier E St Pico Ave Pier E Terminals Southbound AM Pier G Ave Harbor Plaza AimChor North Southbound AM Pier G Ave AimChor North Pier G Way Southbound AM Pier G Way Pier G Ave Pier G Ave East Bound AM Pier G Ave Pier G Way Sea Land North Northbound AM Pier G Ave Sea Land North Pier G Ave Northbound AM Pier F Ave LBHD Transit Shed Middle Harbor Northbound AM Pier F Ave Middle Harbor Middle Harbor Northbound AM Pier F Ave Middle Harbor Chemoil Marine Northbound AM Pier F Ave Middle Harbor Chemoil Marine Northbound AM Pier F Ave Middle Harbor Chemoil Marine Northbound AM Pier F Ave Chemoil Marine Harbor Plaza Northbound AM Pier F Ave Harbor Plaza End of Pier F Northbound Starcrest Consulting Group, LLC page 3 of 50 March 2004
277 Table C-5 On-Road Travel Model and Emission Estimates POLB Baseline EI Period Roadway Segment AM 9th Street AM 10th Street AM 10th Street AM I-710 AM I-710 AM I-710 AM I-710 AM I-710 AM Pico Ave AM Pico Ave AM Pico Ave AM I-710 AM I-710 AM I-710 AM I-710 AM Pico Ave AM Pico Ave AM Pico Ave AM Pico Ave AM Pico Ave AM Pico Ave AM Pico Ave AM Pico Ave AM Pico Ave AM Pico Ave AM Pico Ave AM Pico Ave AM Pico Ave AM Pier E St AM Pier E St AM Pier G Ave AM Pier G Ave AM Pier G Way AM Pier G Ave AM Pier G Ave AM Pier F Ave AM Pier F Ave AM Pier F Ave AM Pier F Ave AM Pier F Ave AM Pier F Ave AM Pier F Ave TOG_E F CO_EF NOX_E F SO2_E F PM10_E F TOG_LB S CO_LB S NOX_LB S SO2_LB S PM10_LB S PM25_LB S Starcrest Consulting Group, LLC page 4 of 50 March 2004
278 Table C-5 On-Road Travel Model and Emission Estimates POLB Baseline EI Period Roadway Segment From To Direction Bobtails Chassis Containers Total Trucks Distance VMT Speed Speed Bin AM Harbor Plaza Pier F Ave Pier G Ave East Bound AM Harbor Plaza Pier G Ave Queens Way Bridge East Bound AM Harbor Plaza Pier G Ave Queens Way Bridge East Bound AM Harbor Plaza Harbor Plaza Harbor Plaza Southbound AM Harbor Plaza Harbor Plaza Harbor Plaza Southbound AM Harbor Plaza Harbor Plaza Harbor Scenic Dr East Bound AM Harbor Plaza Harbor Plaza Harbor Scenic Dr East Bound AM Harbor Plaza Harbor Scenic Dr Harbor Scenic Dr Ramp Northbound AM Harbor Plaza Harbor Scenic Dr Ramp Queensway Dr Northbound AM QueensHWY Harbor Scenic Dr Ramp Connector Southbound AM QueensHWY Harbor Scenic Dr Ramp Connector Southbound AM QueensHWY Connector Harbor Plaza Northbound AM QueensHWY Harbor Plaza Harbor Scenic Dr Northbound AM Connector QueensHWY Harbor Scenic Dr Westbound AM Pier J Way Pier J Pier J Ave East Bound AM Pier J Way Pier J Ave Dr East Bound AM Pier J Ave Pier J Way Harbor Scenic Dr Northbound AM Harbor Scenic Way Pacific Container Term Harbor Scenic Dr East Bound AM Harbor Scenic Way Pacific Container Term Harbor Scenic Dr East Bound AM Harbor Scenic Dr Harbor Scenic Way Pier J Ave Northbound AM Harbor Scenic Dr Harbor Scenic Way Pier J Ave Northbound AM Harbor Scenic Dr Pier J Ave Connector Northbound AM Harbor Scenic Dr Connector Harbor Plaza Northbound AM Harbor Scenic Dr Harbor Plaza SB Ramp Harbor Plaza SB Ramp Southbound AM Harbor Scenic Dr SB n/o Harbor Plaza Ram SB n/o Harbor Plaza Ram Southbound AM Harbor Scenic Dr Ramp Queens Way Bridge Northbound AM Harbor Scenic Dr Queens Way Bridge Connector Northbound AM Harbor Scenic Dr Connector Queens Way Dr Northbound AM Harbor Scenic Dr Queens Way Dr Connector Northbound AM Harbor Scenic Dr Connector I-710 On Ramp Northbound AM Harbor Scenic Dr I-710 On Ramp Ocean Blvd Northbound AM Harbor Scenic Dr I-710 Offramp I-710 On Ramp Southbound AM Pier D Ave n/o Pier D Entrance n/o Pier D Entrance Northbound AM Pier D Ave s/o Ocean Blvd s/o Ocean Blvd Westbound AM Pier D Ave Ocean Blvd undercrossing Ocean Blvd undercrossing Northbound AM Pier D St w/o Pico Ave w/o Pico Ave Westbound AM Pier C St w/o Pico Ave w/o Pico Ave East Bound AM Pier C St w/o Pico Ave w/o Pico Ave East Bound AM Queens Way Dr Harbor Plaza Queens Way Bridge Northbound AM Queens Way Dr Queens Way Bridge Harbor Scenic Way Northbound AM Seaside Blvd Ocean Blvd On Ramp Pier T East Bound AM Seaside Blvd Ocean Blvd On Ramp Pier T East Bound Starcrest Consulting Group, LLC page 5 of 50 March 2004
279 Table C-5 On-Road Travel Model and Emission Estimates POLB Baseline EI Period Roadway Segment AM Harbor Plaza AM Harbor Plaza AM Harbor Plaza AM Harbor Plaza AM Harbor Plaza AM Harbor Plaza AM Harbor Plaza AM Harbor Plaza AM Harbor Plaza AM QueensHWY AM QueensHWY AM QueensHWY AM QueensHWY AM Connector AM Pier J Way AM Pier J Way AM Pier J Ave AM Harbor Scenic Way AM Harbor Scenic Way AM Harbor Scenic Dr AM Harbor Scenic Dr AM Harbor Scenic Dr AM Harbor Scenic Dr AM Harbor Scenic Dr AM Harbor Scenic Dr AM Harbor Scenic Dr AM Harbor Scenic Dr AM Harbor Scenic Dr AM Harbor Scenic Dr AM Harbor Scenic Dr AM Harbor Scenic Dr AM Harbor Scenic Dr AM Pier D Ave AM Pier D Ave AM Pier D Ave AM Pier D St AM Pier C St AM Pier C St AM Queens Way Dr AM Queens Way Dr AM Seaside Blvd AM Seaside Blvd TOG_E F CO_EF NOX_E F SO2_E F PM10_E F TOG_LB S CO_LB S NOX_LB S SO2_LB S PM10_LB S PM25_LB S Starcrest Consulting Group, LLC page 6 of 50 March 2004
280 Table C-5 On-Road Travel Model and Emission Estimates D POLB Baseline EI Period Roadway Segment From To Direction Bobtails Chassis Containers Total Trucks Distance VMT Speed Speed Bin AM Pier T Ave s/o Seaside Blvd s/o Seaside Blvd Northbound AM Ocean Blvd Henry Ford SR-47 East Bound AM Ocean Blvd SR-47 Seaside Blvd OnRamp East Bound AM Ocean Blvd Seaside Blvd OnRamp Seaside Blvd East Bound AM Ocean Blvd WB Ocean Seaside EB Ramp East Bound AM Ocean Blvd WB Ramp e/o Ocean Blvd Ocean Blvd Westbound AM Ocean Blvd Seaside Off ramp Seaside On Ramp Westbound AM Ocean Blvd Ocean Blvd w/o Seaside Off Ramp Westbound AM Ocean Blvd Seaside Blvd OnRamp I-710 Offramp East Bound AM Ocean Blvd Seaside Blvd OnRamp I-710 Offramp East Bound AM Ocean Blvd Seaside Blvd OnRamp I-710 Offramp East Bound AM Connector to Ocean WBHarbor Scenic Drive Ocean Blvd Westbound AM EB OnRamp to I-710 Ocean Blvd Harbor Scenic Drive East Bound AM WB OnRamp to Ocean Pico Ave Ocean Blvd Westbound AM Pier E St On/Off Ramp Pico Ave Ocean Blvd East Bound AM Pier E St On/Off Ramp Pico Ave Ocean Blvd Westbound AM WB Off Ramp to Pico Ocean Blvd Pico Ave Westbound AM Broadway e/o Pico Ave e/o Pico Ave East Bound AM Broadway w/o Pico Ave w/o Pico Ave Westbound AM Santa Fe 9th St Anaheim St Northbound AM Santa Fe n/o Anaheim St s/o Willow St Northbound AM Canal 9th St Anaheim St Northbound AM Caspian 9th St Anaheim St Northbound AM Harbor Ave 9th St Anaheim St Northbound AM Anaheim St Anaheim Way 9th St Westbound AM Anaheim St Anaheim Way 9th St Westbound AM Anaheim St Anaheim Way 9th St Westbound AM Anaheim St 9th St Jackson Westbound AM Anaheim St 9th St Jackson Westbound AM Anaheim St Jackson Santa Fe Westbound AM Anaheim St Santa Fe Canal Westbound AM Anaheim St Canal Caspian Westbound AM Anaheim St Canal Caspian Westbound AM Anaheim St Harbor Ave I-710 SB ramp Westbound AM Anaheim St Harbor Ave I-710 SB ramp Westbound AM New Dock St Henry Ford SR-47 Off Ramp Westbound AM New Dock St SR-47 Off Ramp SR-47 On Ramp Westbound AM Pier A Way Pier B St Carrack Ave Westbound AM Pier B St Anaheim Way Carrack Ave Northbound AM Pier B St Anaheim Way Edison Ave Northbound AM Pier B St Edison Ave Pier B St Northbound AM Pier B St Edison Ave Pico Northbound Starcrest Consulting Group, LLC page 7 of 50 March 2004
281 Table C-5 On-Road Travel Model and Emission Estimates POLB Baseline EI Period Roadway Segment TOG_E F CO_EF NOX_E F SO2_E F PM10_E F TOG_LB S CO_LB S NOX_LB S SO2_LB S PM10_LB S PM25_LB S AM Pier T Ave AM Ocean Blvd AM Ocean Blvd AM Ocean Blvd AM Ocean Blvd AM Ocean Blvd WB Ramp AM Ocean Blvd AM Ocean Blvd AM Ocean Blvd AM Ocean Blvd AM Ocean Blvd AM Connector to Ocean WB AM EB OnRamp to I AM WB OnRamp to Ocean AM Pier E St On/Off Ramp AM Pier E St On/Off Ramp AM WB Off Ramp to Pico AM Broadway AM Broadway AM Santa Fe AM Santa Fe AM Canal AM Caspian AM Harbor Ave AM Anaheim St AM Anaheim St AM Anaheim St AM Anaheim St AM Anaheim St AM Anaheim St AM Anaheim St AM Anaheim St AM Anaheim St AM Anaheim St AM Anaheim St AM New Dock St AM New Dock St AM Pier A Way AM Pier B St AM Pier B St AM Pier B St AM Pier B St Starcrest Consulting Group, LLC page 8 of 50 March 2004
282 Table C-5 On-Road Travel Model and Emission Estimates POLB Baseline EI Period Roadway Segment From To Direction Bobtails Chassis Containers Total Trucks Distance VMT Speed Speed Bin AM Pier B St Edison Ave Pico Northbound AM Pier B St Edison Ave Pico Northbound AM Carrack Ave Pier A Way Pier A Entrance Northbound AM Carrack Ave Pier A Way Pier A Entrance Northbound AM Equilon Enterprises Carrack Ave Equilon Westbound AM Edison Avenue National Gypsum Co Pier B St Southbound AM Edison Avenue National Gypsum Co Pier B St Southbound AM Edison Avenue National Gypsum Co Pier B St Southbound AM Edison Avenue Pier B St 9th St Southbound AM Anaheim Way Anaheim St Pier B St Northbound AM 9th Street Anaheim St Edison Ave Northbound AM 9th Street Edison Ave Jackson Northbound AM 9th Street Jackson Santa Fe Northbound AM 9th Street Santa Fe Canal Northbound AM 9th Street Canal Caspian Northbound AM 9th Street Caspian Pico Northbound AM 9th Street Caspian Pico Northbound AM Pico Ave 9th St Pier B St Northbound AM Pico Ave Pier B St Pier C St Northbound AM Pico Ave Pier C St Pier D St Northbound AM Pico Ave Pier C St Pier D St Northbound AM Pico Ave Pier D St Quick Stop Lube Northbound AM Pico Ave Pier D St Broadway Northbound AM Pico Ave Broadway Ocean Blvd Off ramp Northbound AM Pico Ave Ocean Blvd Ramps n/o Pier E St Northbound AM Pico Ave n/o Pier E St Pier E St Northbound AM Pico Ave Pier E St s/o Pier E St Northbound AM Pico Ave Connector Connector Northbound AM Pico Ave Connector Harbor Plaza Northbound AM Pico Ave Connector Harbor Plaza Northbound AM Pier E St Pico Ave Pier E Terminals Northbound AM Pier G Ave Harbor Plaza AimChor North Northbound AM Pier F Ave LBHD Transit Shed Middle Harbor Southbound AM Pier F Ave Middle Harbor Middle Harbor Southbound AM Pier F Ave Middle Harbor Chemoil Marine Southbound AM Pier F Ave Middle Harbor Chemoil Marine Southbound AM Pier F Ave Middle Harbor Chemoil Marine Southbound AM Pier F Ave Chemoil Marine Harbor Plaza Southbound AM Pier F Ave Harbor Plaza End of Pier F Southbound AM Harbor Plaza Pier F Ave Pier G Ave Westbound AM Harbor Plaza Pier G Ave Queens Way Bridge Westbound AM Harbor Plaza Pier G Ave Queens Way Bridge Westbound Starcrest Consulting Group, LLC page 9 of 50 March 2004
283 Table C-5 On-Road Travel Model and Emission Estimates POLB Baseline EI Period Roadway Segment AM Pier B St AM Pier B St AM Carrack Ave AM Carrack Ave AM Equilon Enterprises AM Edison Avenue AM Edison Avenue AM Edison Avenue AM Edison Avenue AM Anaheim Way AM 9th Street AM 9th Street AM 9th Street AM 9th Street AM 9th Street AM 9th Street AM 9th Street AM Pico Ave AM Pico Ave AM Pico Ave AM Pico Ave AM Pico Ave AM Pico Ave AM Pico Ave AM Pico Ave AM Pico Ave AM Pico Ave AM Pico Ave AM Pico Ave AM Pico Ave AM Pier E St AM Pier G Ave AM Pier F Ave AM Pier F Ave AM Pier F Ave AM Pier F Ave AM Pier F Ave AM Pier F Ave AM Pier F Ave AM Harbor Plaza AM Harbor Plaza AM Harbor Plaza TOG_E F CO_EF NOX_E F SO2_E F PM10_E F TOG_LB S CO_LB S NOX_LB S SO2_LB S PM10_LB S PM25_LB S Starcrest Consulting Group, LLC page 10 of 50 March 2004
284 Table C-5 On-Road Travel Model and Emission Estimates POLB Baseline EI Period Roadway Segment From To Direction Bobtails Chassis Containers Total Trucks Distance VMT Speed Speed Bin AM Harbor Plaza Harbor Plaza Harbor Plaza Northbound AM Harbor Plaza Harbor Plaza Harbor Plaza Northbound AM Harbor Plaza Harbor Plaza Harbor Scenic Dr Westbound AM Harbor Plaza Harbor Plaza Harbor Scenic Dr Westbound AM Harbor Plaza Harbor Scenic Dr Harbor Scenic Dr Ramp Southbound AM Harbor Plaza Harbor Scenic Dr Ramp Queensway Dr Southbound AM Pier J Way Pier J Pier J Ave Westbound AM Pier J Way Pier J Ave Dr Westbound AM Pier J Ave Pier J Way Harbor Scenic Dr Southbound AM Harbor Scenic Way Pacific Container Term Harbor Scenic Dr Westbound AM Harbor Scenic Way Pacific Container Term Harbor Scenic Dr Westbound AM Harbor Scenic Dr Harbor Scenic Way Pier J Ave Southbound AM Harbor Scenic Dr Harbor Scenic Way Pier J Ave Southbound AM Harbor Scenic Dr Pier J Ave Connector Southbound AM Harbor Scenic Dr Connector Harbor Plaza Southbound AM Harbor Scenic Dr Ramp Queens Way Bridge Westbound AM Harbor Scenic Dr Queens Way Bridge Connector Westbound AM Harbor Scenic Dr Connector Queens Way Dr Westbound AM Harbor Scenic Dr Queens Way Dr Connector Westbound AM Harbor Scenic Dr Connector I-710 On Ramp Westbound AM Pier D Ave n/o Pier D Entrance n/o Pier D Entrance Southbound AM Pier D Ave s/o Ocean Blvd s/o Ocean Blvd East Bound AM Pier D Ave Ocean Blvd undercrossing Ocean Blvd undercrossing Southbound AM Pier D St w/o Pico Ave w/o Pico Ave East Bound AM Pier C St w/o Pico Ave w/o Pico Ave Westbound AM Pier C St w/o Pico Ave w/o Pico Ave Westbound AM Seaside Blvd Ocean Blvd On Ramp Pier T Westbound AM Seaside Blvd Ocean Blvd On Ramp Pier T Westbound AM Pier T Ave s/o Seaside Blvd s/o Seaside Blvd Southbound AM Ocean Blvd Henry Ford SR-47 Westbound AM Ocean Blvd SR-47 Seaside Blvd OnRamp Westbound AM Ocean Blvd WB Ramp e/o Ocean Blvd Ocean Blvd East Bound AM Ocean Blvd Seaside Off ramp Seaside On Ramp East Bound AM Ocean Blvd Ocean Blvd w/o Seaside Off Ramp East Bound AM Ocean Blvd Seaside Blvd OnRamp I-710 Offramp Westbound AM Ocean Blvd Seaside Blvd OnRamp I-710 Offramp Westbound AM Ocean Blvd Seaside Blvd OnRamp I-710 Offramp Westbound AM Pier E St On/Off Ramp Pico Ave Ocean Blvd Westbound AM Pier E St On/Off Ramp Pico Ave Ocean Blvd East Bound AM Broadway e/o Pico Ave e/o Pico Ave Westbound AM Broadway w/o Pico Ave w/o Pico Ave East Bound AM Santa Fe 9th St Anaheim St Southbound Starcrest Consulting Group, LLC page 11 of 50 March 2004
285 Table C-5 On-Road Travel Model and Emission Estimates POLB Baseline EI Period Roadway Segment TOG_E F CO_EF NOX_E F SO2_E F PM10_E F TOG_LB S CO_LB S NOX_LB S SO2_LB S PM10_LB S PM25_LB S AM Harbor Plaza AM Harbor Plaza AM Harbor Plaza AM Harbor Plaza AM Harbor Plaza AM Harbor Plaza AM Pier J Way AM Pier J Way AM Pier J Ave AM Harbor Scenic Way AM Harbor Scenic Way AM Harbor Scenic Dr AM Harbor Scenic Dr AM Harbor Scenic Dr AM Harbor Scenic Dr AM Harbor Scenic Dr AM Harbor Scenic Dr AM Harbor Scenic Dr AM Harbor Scenic Dr AM Harbor Scenic Dr AM Pier D Ave AM Pier D Ave AM Pier D Ave AM Pier D St AM Pier C St AM Pier C St AM Seaside Blvd AM Seaside Blvd AM Pier T Ave AM Ocean Blvd AM Ocean Blvd AM Ocean Blvd WB Ramp AM Ocean Blvd AM Ocean Blvd AM Ocean Blvd AM Ocean Blvd AM Ocean Blvd AM Pier E St On/Off Ramp AM Pier E St On/Off Ramp AM Broadway AM Broadway AM Santa Fe Starcrest Consulting Group, LLC page 12 of 50 March 2004
286 Table C-5 On-Road Travel Model and Emission Estimates POLB Baseline EI Period Roadway Segment From To Direction Bobtails Chassis Containers Total Trucks Distance VMT Speed Speed Bin AM Santa Fe n/o Anaheim St s/o Willow St Southbound AM Canal 9th St Anaheim St Southbound AM Caspian 9th St Anaheim St Southbound AM Harbor Ave 9th St Anaheim St Southbound MD Anaheim St Anaheim Way 9th St East Bound MD Anaheim St Anaheim Way 9th St East Bound MD Anaheim St Anaheim Way 9th St East Bound MD Anaheim St 9th St Jackson East Bound MD Anaheim St 9th St Jackson East Bound MD Anaheim St Jackson Santa Fe East Bound MD Anaheim St Santa Fe Canal East Bound MD Anaheim St Canal Caspian East Bound MD Anaheim St Canal Caspian East Bound MD Anaheim St Harbor Ave I-710 SB ramp East Bound MD Anaheim St Harbor Ave I-710 SB ramp East Bound MD New Dock St Henry Ford SR-47 Off Ramp East Bound MD New Dock St SR-47 Off Ramp SR-47 On Ramp East Bound MD SR-47 On Ramp SR-47 NB On Ramp SR-47 NB On Ramp Northbound MD SR-47 SR-47 SR-47 Off Ramp Southbound MD SR-47 SR-47 Off Ramp Ocean Blvd Southbound MD SR-47 Ocean Blvd SR-47 On Ramp Northbound MD SR-47 SR-47 NB On Ramp Henry Ford NB Off RampNorthbound MD Pier A Way Pier B St Carrack Ave East Bound MD Pier B St Anaheim Way Carrack Ave Southbound MD Pier B St Anaheim Way Edison Ave Southbound MD Pier B St Edison Ave Pier B St Southbound MD Pier B St Edison Ave Pico Southbound MD Pier B St Edison Ave Pico Southbound MD Pier B St Edison Ave Pico Southbound MD Carrack Ave Pier A Way Pier A Entrance Southbound MD Carrack Ave Pier A Way Pier A Entrance Southbound MD Equilon Enterprises Carrack Ave Equilon East Bound MD Edison Avenue National Gypsum Co Pier B St Northbound MD Edison Avenue National Gypsum Co Pier B St Northbound MD Edison Avenue National Gypsum Co Pier B St Northbound MD Edison Avenue Pier B St 9th St Northbound MD Anaheim Way Anaheim St Pier B St Southbound MD 9th Street Anaheim St Edison Ave Southbound MD 9th Street Edison Ave Jackson Southbound MD 9th Street Jackson Santa Fe Southbound MD 9th Street Santa Fe Canal Southbound MD 9th Street Canal Caspian Southbound Starcrest Consulting Group, LLC page 13 of 50 March 2004
287 Table C-5 On-Road Travel Model and Emission Estimates POLB Baseline EI Period Roadway Segment AM Santa Fe AM Canal AM Caspian AM Harbor Ave MD Anaheim St MD Anaheim St MD Anaheim St MD Anaheim St MD Anaheim St MD Anaheim St MD Anaheim St MD Anaheim St MD Anaheim St MD Anaheim St MD Anaheim St MD New Dock St MD New Dock St MD SR-47 On Ramp MD SR-47 MD SR-47 MD SR-47 MD SR-47 MD Pier A Way MD Pier B St MD Pier B St MD Pier B St MD Pier B St MD Pier B St MD Pier B St MD Carrack Ave MD Carrack Ave MD Equilon Enterprises MD Edison Avenue MD Edison Avenue MD Edison Avenue MD Edison Avenue MD Anaheim Way MD 9th Street MD 9th Street MD 9th Street MD 9th Street MD 9th Street TOG_E F CO_EF NOX_E F SO2_E F PM10_E F TOG_LB S CO_LB S NOX_LB S SO2_LB S PM10_LB S PM25_LB S Starcrest Consulting Group, LLC page 14 of 50 March 2004
288 Table C-5 On-Road Travel Model and Emission Estimates POLB Baseline EI Period Roadway Segment From To Direction Bobtails Chassis Containers Total Trucks Distance VMT Speed Speed Bin MD 9th Street Caspian Pico Southbound MD 9th Street Caspian Pico Southbound MD 9th Street Caspian Pico Southbound MD 9th Street Caspian Pico Southbound MD 9th Street Pico I-710 Southbound MD 10th Street Caspian Harbor Ave Northbound MD 10th Street Caspian Harbor Ave Northbound MD I-710 9th St Off Ramp 9th St Off Ramp Northbound MD I-710 9th St Off Ramp 9th St Off Ramp Northbound MD I-710 9th St Off Ramp 9th St Off Ramp Northbound MD I-710 9th St Off Ramp 9th St Off Ramp Northbound MD I-710 9th St Off Ramp to Pico 9th St Off Ramp to Pico Southbound MD Pico Ave 9th Street EB 9th Street EB Southbound MD Pico Ave 9th Street WB 9th Street WB Northbound MD Pico Ave 9th Street WB 9th Street WB Northbound MD I-710 Pier B St On Ramp Connector to Ocean WB Southbound MD I-710 Anaheim SB On Ramp Pico SB Ramps Southbound MD I-710 n/o Anaheim SB On Rampn/o Anaheim SB On RampSouthbound MD I-710 s/o Anaheim SB Off Ramps/o Anaheim SB Off RampSouthbound MD Pico Ave 9th St Pier B St Southbound MD Pico Ave Pier B St Pier C St Southbound MD Pico Ave Pier C St Pier D St Southbound MD Pico Ave Pier C St Pier D St Southbound MD Pico Ave Pier D St Quick Stop Lube Southbound MD Pico Ave Pier D St Broadway Southbound MD Pico Ave Broadway Ocean Blvd Off ramp Southbound MD Pico Ave Ocean Blvd Ramps n/o Pier E St Southbound MD Pico Ave n/o Pier E St Pier E St Southbound MD Pico Ave Pier E St s/o Pier E St Southbound MD Pico Ave Connector Connector Southbound MD Pico Ave Connector Harbor Plaza Southbound MD Pico Ave Connector Harbor Plaza Southbound MD Pier E St Pico Ave Pier E Terminals Southbound MD Pier E St Pico Ave Pier E Terminals Southbound MD Pier G Ave Harbor Plaza AimChor North Southbound MD Pier G Ave AimChor North Pier G Way Southbound MD Pier G Way Pier G Ave Pier G Ave East Bound MD Pier G Ave Pier G Way Sea Land North Northbound MD Pier G Ave Sea Land North Pier G Ave Northbound MD Pier F Ave LBHD Transit Shed Middle Harbor Northbound MD Pier F Ave Middle Harbor Middle Harbor Northbound MD Pier F Ave Middle Harbor Chemoil Marine Northbound Starcrest Consulting Group, LLC page 15 of 50 March 2004
289 Table C-5 On-Road Travel Model and Emission Estimates POLB Baseline EI Period Roadway Segment MD 9th Street MD 9th Street MD 9th Street MD 9th Street MD 9th Street MD 10th Street MD 10th Street MD I-710 MD I-710 MD I-710 MD I-710 MD I-710 MD Pico Ave MD Pico Ave MD Pico Ave MD I-710 MD I-710 MD I-710 MD I-710 MD Pico Ave MD Pico Ave MD Pico Ave MD Pico Ave MD Pico Ave MD Pico Ave MD Pico Ave MD Pico Ave MD Pico Ave MD Pico Ave MD Pico Ave MD Pico Ave MD Pico Ave MD Pier E St MD Pier E St MD Pier G Ave MD Pier G Ave MD Pier G Way MD Pier G Ave MD Pier G Ave MD Pier F Ave MD Pier F Ave MD Pier F Ave TOG_E F CO_EF NOX_E F SO2_E F PM10_E F TOG_LB S CO_LB S NOX_LB S SO2_LB S PM10_LB S PM25_LB S Starcrest Consulting Group, LLC page 16 of 50 March 2004
290 Table C-5 On-Road Travel Model and Emission Estimates POLB Baseline EI Period Roadway Segment From To Direction Bobtails Chassis Containers Total Trucks Distance VMT Speed Speed Bin MD Pier F Ave Middle Harbor Chemoil Marine Northbound MD Pier F Ave Middle Harbor Chemoil Marine Northbound MD Pier F Ave Chemoil Marine Harbor Plaza Northbound MD Pier F Ave Harbor Plaza End of Pier F Northbound MD Harbor Plaza Pier F Ave Pier G Ave East Bound MD Harbor Plaza Pier G Ave Queens Way Bridge East Bound MD Harbor Plaza Pier G Ave Queens Way Bridge East Bound MD Harbor Plaza Harbor Plaza Harbor Plaza Southbound MD Harbor Plaza Harbor Plaza Harbor Plaza Southbound MD Harbor Plaza Harbor Plaza Harbor Scenic Dr East Bound MD Harbor Plaza Harbor Plaza Harbor Scenic Dr East Bound MD Harbor Plaza Harbor Scenic Dr Harbor Scenic Dr Ramp Northbound MD Harbor Plaza Harbor Scenic Dr Ramp Queensway Dr Northbound MD QueensHWY Harbor Scenic Dr Ramp Connector Southbound MD QueensHWY Harbor Scenic Dr Ramp Connector Southbound MD QueensHWY Connector Harbor Plaza Northbound MD QueensHWY Harbor Plaza Harbor Scenic Dr Northbound MD Connector QueensHWY Harbor Scenic Dr Westbound MD Pier J Way Pier J Pier J Ave East Bound MD Pier J Way Pier J Ave Dr East Bound MD Pier J Ave Pier J Way Harbor Scenic Dr Northbound MD Harbor Scenic Way Pacific Container Term Harbor Scenic Dr East Bound MD Harbor Scenic Way Pacific Container Term Harbor Scenic Dr East Bound MD Harbor Scenic Dr Harbor Scenic Way Pier J Ave Northbound MD Harbor Scenic Dr Harbor Scenic Way Pier J Ave Northbound MD Harbor Scenic Dr Pier J Ave Connector Northbound MD Harbor Scenic Dr Connector Harbor Plaza Northbound MD Harbor Scenic Dr Harbor Plaza SB Ramp Harbor Plaza SB Ramp Southbound MD Harbor Scenic Dr SB n/o Harbor Plaza Ram SB n/o Harbor Plaza Ram Southbound MD Harbor Scenic Dr Ramp Queens Way Bridge Northbound MD Harbor Scenic Dr Queens Way Bridge Connector Northbound MD Harbor Scenic Dr Connector Queens Way Dr Northbound MD Harbor Scenic Dr Queens Way Dr Connector Northbound MD Harbor Scenic Dr Connector I-710 On Ramp Northbound MD Harbor Scenic Dr I-710 On Ramp Ocean Blvd Northbound MD Harbor Scenic Dr I-710 Offramp I-710 On Ramp Southbound MD Pier D Ave n/o Pier D Entrance n/o Pier D Entrance Northbound MD Pier D Ave s/o Ocean Blvd s/o Ocean Blvd Westbound MD Pier D Ave Ocean Blvd undercrossing Ocean Blvd undercrossing Northbound MD Pier D St w/o Pico Ave w/o Pico Ave Westbound MD Pier C St w/o Pico Ave w/o Pico Ave East Bound MD Pier C St w/o Pico Ave w/o Pico Ave East Bound Starcrest Consulting Group, LLC page 17 of 50 March 2004
291 Table C-5 On-Road Travel Model and Emission Estimates POLB Baseline EI Period Roadway Segment MD Pier F Ave MD Pier F Ave MD Pier F Ave MD Pier F Ave MD Harbor Plaza MD Harbor Plaza MD Harbor Plaza MD Harbor Plaza MD Harbor Plaza MD Harbor Plaza MD Harbor Plaza MD Harbor Plaza MD Harbor Plaza MD QueensHWY MD QueensHWY MD QueensHWY MD QueensHWY MD Connector MD Pier J Way MD Pier J Way MD Pier J Ave MD Harbor Scenic Way MD Harbor Scenic Way MD Harbor Scenic Dr MD Harbor Scenic Dr MD Harbor Scenic Dr MD Harbor Scenic Dr MD Harbor Scenic Dr MD Harbor Scenic Dr MD Harbor Scenic Dr MD Harbor Scenic Dr MD Harbor Scenic Dr MD Harbor Scenic Dr MD Harbor Scenic Dr MD Harbor Scenic Dr MD Harbor Scenic Dr MD Pier D Ave MD Pier D Ave MD Pier D Ave MD Pier D St MD Pier C St MD Pier C St TOG_E F CO_EF NOX_E F SO2_E F PM10_E F TOG_LB S CO_LB S NOX_LB S SO2_LB S PM10_LB S PM25_LB S Starcrest Consulting Group, LLC page 18 of 50 March 2004
292 Table C-5 On-Road Travel Model and Emission Estimates POLB Baseline EI Period Roadway Segment From To Direction Bobtails Chassis Containers Total Trucks Distance VMT Speed Speed Bin MD Queens Way Dr Harbor Plaza Queens Way Bridge Northbound MD Queens Way Dr Queens Way Bridge Harbor Scenic Way Northbound MD Seaside Blvd Ocean Blvd On Ramp Pier T East Bound MD Seaside Blvd Ocean Blvd On Ramp Pier T East Bound MD Pier T Ave s/o Seaside Blvd s/o Seaside Blvd Northbound MD Ocean Blvd Henry Ford SR-47 East Bound MD Ocean Blvd SR-47 Seaside Blvd OnRamp East Bound MD Ocean Blvd Seaside Blvd OnRamp Seaside Blvd East Bound MD Ocean Blvd WB Ocean Seaside EB Ramp East Bound MD Ocean Blvd WB Ramp e/o Ocean Blvd Ocean Blvd Westbound MD Ocean Blvd Seaside Off ramp Seaside On Ramp Westbound MD Ocean Blvd Ocean Blvd w/o Seaside Off Ramp Westbound MD Ocean Blvd Seaside Blvd OnRamp I-710 Offramp East Bound MD Ocean Blvd Seaside Blvd OnRamp I-710 Offramp East Bound MD Ocean Blvd Seaside Blvd OnRamp I-710 Offramp East Bound MD Connector to Ocean WBHarbor Scenic Drive Ocean Blvd Westbound MD EB OnRamp to I-710 Ocean Blvd Harbor Scenic Drive East Bound MD WB OnRamp to Ocean Pico Ave Ocean Blvd Westbound MD Pier E St On/Off Ramp Pico Ave Ocean Blvd East Bound MD Pier E St On/Off Ramp Pico Ave Ocean Blvd Westbound MD WB Off Ramp to Pico Ocean Blvd Pico Ave Westbound MD Broadway e/o Pico Ave e/o Pico Ave East Bound MD Broadway w/o Pico Ave w/o Pico Ave Westbound MD Santa Fe 9th St Anaheim St Northbound MD Santa Fe n/o Anaheim St s/o Willow St Northbound MD Canal 9th St Anaheim St Northbound MD Caspian 9th St Anaheim St Northbound MD Harbor Ave 9th St Anaheim St Northbound MD Anaheim St Anaheim Way 9th St Westbound MD Anaheim St Anaheim Way 9th St Westbound MD Anaheim St Anaheim Way 9th St Westbound MD Anaheim St 9th St Jackson Westbound MD Anaheim St 9th St Jackson Westbound MD Anaheim St Jackson Santa Fe Westbound MD Anaheim St Santa Fe Canal Westbound MD Anaheim St Canal Caspian Westbound MD Anaheim St Canal Caspian Westbound MD Anaheim St Harbor Ave I-710 SB ramp Westbound MD Anaheim St Harbor Ave I-710 SB ramp Westbound MD New Dock St Henry Ford SR-47 Off Ramp Westbound MD New Dock St SR-47 Off Ramp SR-47 On Ramp Westbound MD Pier A Way Pier B St Carrack Ave Westbound Starcrest Consulting Group, LLC page 19 of 50 March 2004
293 Table C-5 On-Road Travel Model and Emission Estimates POLB Baseline EI Period Roadway Segment TOG_E F CO_EF NOX_E F SO2_E F PM10_E F TOG_LB S CO_LB S NOX_LB S SO2_LB S PM10_LB S PM25_LB S MD Queens Way Dr MD Queens Way Dr MD Seaside Blvd MD Seaside Blvd MD Pier T Ave MD Ocean Blvd MD Ocean Blvd MD Ocean Blvd MD Ocean Blvd MD Ocean Blvd WB Ramp MD Ocean Blvd MD Ocean Blvd MD Ocean Blvd MD Ocean Blvd MD Ocean Blvd MD Connector to Ocean WB MD EB OnRamp to I MD WB OnRamp to Ocean MD Pier E St On/Off Ramp MD Pier E St On/Off Ramp MD WB Off Ramp to Pico MD Broadway MD Broadway MD Santa Fe MD Santa Fe MD Canal MD Caspian MD Harbor Ave MD Anaheim St MD Anaheim St MD Anaheim St MD Anaheim St MD Anaheim St MD Anaheim St MD Anaheim St MD Anaheim St MD Anaheim St MD Anaheim St MD Anaheim St MD New Dock St MD New Dock St MD Pier A Way Starcrest Consulting Group, LLC page 20 of 50 March 2004
294 Table C-5 On-Road Travel Model and Emission Estimates POLB Baseline EI Period Roadway Segment From To Direction Bobtails Chassis Containers Total Trucks Distance VMT Speed Speed Bin MD Pier B St Anaheim Way Carrack Ave Northbound MD Pier B St Anaheim Way Edison Ave Northbound MD Pier B St Edison Ave Pier B St Northbound MD Pier B St Edison Ave Pico Northbound MD Pier B St Edison Ave Pico Northbound MD Pier B St Edison Ave Pico Northbound MD Carrack Ave Pier A Way Pier A Entrance Northbound MD Carrack Ave Pier A Way Pier A Entrance Northbound MD Equilon Enterprises Carrack Ave Equilon Westbound MD Edison Avenue National Gypsum Co Pier B St Southbound MD Edison Avenue National Gypsum Co Pier B St Southbound MD Edison Avenue National Gypsum Co Pier B St Southbound MD Edison Avenue Pier B St 9th St Southbound MD Anaheim Way Anaheim St Pier B St Northbound MD 9th Street Anaheim St Edison Ave Northbound MD 9th Street Edison Ave Jackson Northbound MD 9th Street Jackson Santa Fe Northbound MD 9th Street Santa Fe Canal Northbound MD 9th Street Canal Caspian Northbound MD 9th Street Caspian Pico Northbound MD 9th Street Caspian Pico Northbound MD Pico Ave 9th St Pier B St Northbound MD Pico Ave Pier B St Pier C St Northbound MD Pico Ave Pier C St Pier D St Northbound MD Pico Ave Pier C St Pier D St Northbound MD Pico Ave Pier D St Quick Stop Lube Northbound MD Pico Ave Pier D St Broadway Northbound MD Pico Ave Broadway Ocean Blvd Off ramp Northbound MD Pico Ave Ocean Blvd Ramps n/o Pier E St Northbound MD Pico Ave n/o Pier E St Pier E St Northbound MD Pico Ave Pier E St s/o Pier E St Northbound MD Pico Ave Connector Connector Northbound MD Pico Ave Connector Harbor Plaza Northbound MD Pico Ave Connector Harbor Plaza Northbound MD Pier E St Pico Ave Pier E Terminals Northbound MD Pier G Ave Harbor Plaza AimChor North Northbound MD Pier F Ave LBHD Transit Shed Middle Harbor Southbound MD Pier F Ave Middle Harbor Middle Harbor Southbound MD Pier F Ave Middle Harbor Chemoil Marine Southbound MD Pier F Ave Middle Harbor Chemoil Marine Southbound MD Pier F Ave Middle Harbor Chemoil Marine Southbound MD Pier F Ave Chemoil Marine Harbor Plaza Southbound Starcrest Consulting Group, LLC page 21 of 50 March 2004
295 Table C-5 On-Road Travel Model and Emission Estimates POLB Baseline EI Period Roadway Segment MD Pier B St MD Pier B St MD Pier B St MD Pier B St MD Pier B St MD Pier B St MD Carrack Ave MD Carrack Ave MD Equilon Enterprises MD Edison Avenue MD Edison Avenue MD Edison Avenue MD Edison Avenue MD Anaheim Way MD 9th Street MD 9th Street MD 9th Street MD 9th Street MD 9th Street MD 9th Street MD 9th Street MD Pico Ave MD Pico Ave MD Pico Ave MD Pico Ave MD Pico Ave MD Pico Ave MD Pico Ave MD Pico Ave MD Pico Ave MD Pico Ave MD Pico Ave MD Pico Ave MD Pico Ave MD Pier E St MD Pier G Ave MD Pier F Ave MD Pier F Ave MD Pier F Ave MD Pier F Ave MD Pier F Ave MD Pier F Ave TOG_E F CO_EF NOX_E F SO2_E F PM10_E F TOG_LB S CO_LB S NOX_LB S SO2_LB S PM10_LB S PM25_LB S Starcrest Consulting Group, LLC page 22 of 50 March 2004
296 Table C-5 On-Road Travel Model and Emission Estimates POLB Baseline EI Period Roadway Segment From To Direction Bobtails Chassis Containers Total Trucks Distance VMT Speed Speed Bin MD Pier F Ave Harbor Plaza End of Pier F Southbound MD Harbor Plaza Pier F Ave Pier G Ave Westbound MD Harbor Plaza Pier G Ave Queens Way Bridge Westbound MD Harbor Plaza Pier G Ave Queens Way Bridge Westbound MD Harbor Plaza Harbor Plaza Harbor Plaza Northbound MD Harbor Plaza Harbor Plaza Harbor Plaza Northbound MD Harbor Plaza Harbor Plaza Harbor Scenic Dr Westbound MD Harbor Plaza Harbor Plaza Harbor Scenic Dr Westbound MD Harbor Plaza Harbor Scenic Dr Harbor Scenic Dr Ramp Southbound MD Harbor Plaza Harbor Scenic Dr Ramp Queensway Dr Southbound MD Pier J Way Pier J Pier J Ave Westbound MD Pier J Way Pier J Ave Dr Westbound MD Pier J Ave Pier J Way Harbor Scenic Dr Southbound MD Harbor Scenic Way Pacific Container Term Harbor Scenic Dr Westbound MD Harbor Scenic Way Pacific Container Term Harbor Scenic Dr Westbound MD Harbor Scenic Dr Harbor Scenic Way Pier J Ave Southbound MD Harbor Scenic Dr Harbor Scenic Way Pier J Ave Southbound MD Harbor Scenic Dr Pier J Ave Connector Southbound MD Harbor Scenic Dr Connector Harbor Plaza Southbound MD Harbor Scenic Dr Ramp Queens Way Bridge Westbound MD Harbor Scenic Dr Queens Way Bridge Connector Westbound MD Harbor Scenic Dr Connector Queens Way Dr Westbound MD Harbor Scenic Dr Queens Way Dr Connector Westbound MD Harbor Scenic Dr Connector I-710 On Ramp Westbound MD Pier D Ave n/o Pier D Entrance n/o Pier D Entrance Southbound MD Pier D Ave s/o Ocean Blvd s/o Ocean Blvd East Bound MD Pier D Ave Ocean Blvd undercrossing Ocean Blvd undercrossing Southbound MD Pier D St w/o Pico Ave w/o Pico Ave East Bound MD Pier C St w/o Pico Ave w/o Pico Ave Westbound MD Pier C St w/o Pico Ave w/o Pico Ave Westbound MD Seaside Blvd Ocean Blvd On Ramp Pier T Westbound MD Seaside Blvd Ocean Blvd On Ramp Pier T Westbound MD Pier T Ave s/o Seaside Blvd s/o Seaside Blvd Southbound MD Ocean Blvd Henry Ford SR-47 Westbound MD Ocean Blvd SR-47 Seaside Blvd OnRamp Westbound MD Ocean Blvd WB Ramp e/o Ocean Blvd Ocean Blvd East Bound MD Ocean Blvd Seaside Off ramp Seaside On Ramp East Bound MD Ocean Blvd Ocean Blvd w/o Seaside Off Ramp East Bound MD Ocean Blvd Seaside Blvd OnRamp I-710 Offramp Westbound MD Ocean Blvd Seaside Blvd OnRamp I-710 Offramp Westbound MD Ocean Blvd Seaside Blvd OnRamp I-710 Offramp Westbound MD Pier E St On/Off Ramp Pico Ave Ocean Blvd Westbound Starcrest Consulting Group, LLC page 23 of 50 March 2004
297 Table C-5 On-Road Travel Model and Emission Estimates POLB Baseline EI Period Roadway Segment TOG_E F CO_EF NOX_E F SO2_E F PM10_E F TOG_LB S CO_LB S NOX_LB S SO2_LB S PM10_LB S PM25_LB S MD Pier F Ave MD Harbor Plaza MD Harbor Plaza MD Harbor Plaza MD Harbor Plaza MD Harbor Plaza MD Harbor Plaza MD Harbor Plaza MD Harbor Plaza MD Harbor Plaza MD Pier J Way MD Pier J Way MD Pier J Ave MD Harbor Scenic Way MD Harbor Scenic Way MD Harbor Scenic Dr MD Harbor Scenic Dr MD Harbor Scenic Dr MD Harbor Scenic Dr MD Harbor Scenic Dr MD Harbor Scenic Dr MD Harbor Scenic Dr MD Harbor Scenic Dr MD Harbor Scenic Dr MD Pier D Ave MD Pier D Ave MD Pier D Ave MD Pier D St MD Pier C St MD Pier C St MD Seaside Blvd MD Seaside Blvd MD Pier T Ave MD Ocean Blvd MD Ocean Blvd MD Ocean Blvd WB Ramp MD Ocean Blvd MD Ocean Blvd MD Ocean Blvd MD Ocean Blvd MD Ocean Blvd MD Pier E St On/Off Ramp Starcrest Consulting Group, LLC page 24 of 50 March 2004
298 Table C-5 On-Road Travel Model and Emission Estimates POLB Baseline EI Period Roadway Segment From To Direction Bobtails Chassis Containers Total Trucks Distance VMT Speed Speed Bin MD Pier E St On/Off Ramp Pico Ave Ocean Blvd East Bound MD Broadway e/o Pico Ave e/o Pico Ave Westbound MD Broadway w/o Pico Ave w/o Pico Ave East Bound MD Santa Fe 9th St Anaheim St Southbound MD Santa Fe n/o Anaheim St s/o Willow St Southbound MD Canal 9th St Anaheim St Southbound MD Caspian 9th St Anaheim St Southbound MD Harbor Ave 9th St Anaheim St Southbound NT Anaheim St Anaheim Way 9th St East Bound NT Anaheim St Anaheim Way 9th St East Bound NT Anaheim St Anaheim Way 9th St East Bound NT Anaheim St 9th St Jackson East Bound NT Anaheim St 9th St Jackson East Bound NT Anaheim St Jackson Santa Fe East Bound NT Anaheim St Santa Fe Canal East Bound NT Anaheim St Canal Caspian East Bound NT Anaheim St Canal Caspian East Bound NT Anaheim St Harbor Ave I-710 SB ramp East Bound NT Anaheim St Harbor Ave I-710 SB ramp East Bound NT New Dock St Henry Ford SR-47 Off Ramp East Bound NT New Dock St SR-47 Off Ramp SR-47 On Ramp East Bound NT SR-47 On Ramp SR-47 NB On Ramp SR-47 NB On Ramp Northbound NT SR-47 SR-47 SR-47 Off Ramp Southbound NT SR-47 SR-47 Off Ramp Ocean Blvd Southbound NT SR-47 Ocean Blvd SR-47 On Ramp Northbound NT SR-47 SR-47 NB On Ramp Henry Ford NB Off RampNorthbound NT Pier A Way Pier B St Carrack Ave East Bound NT Pier B St Anaheim Way Carrack Ave Southbound NT Pier B St Anaheim Way Edison Ave Southbound NT Pier B St Edison Ave Pier B St Southbound NT Pier B St Edison Ave Pico Southbound NT Pier B St Edison Ave Pico Southbound NT Pier B St Edison Ave Pico Southbound NT Carrack Ave Pier A Way Pier A Entrance Southbound NT Carrack Ave Pier A Way Pier A Entrance Southbound NT Equilon Enterprises Carrack Ave Equilon East Bound NT Edison Avenue National Gypsum Co Pier B St Northbound NT Edison Avenue National Gypsum Co Pier B St Northbound NT Edison Avenue National Gypsum Co Pier B St Northbound NT Edison Avenue Pier B St 9th St Northbound NT Anaheim Way Anaheim St Pier B St Southbound NT 9th Street Anaheim St Edison Ave Southbound Starcrest Consulting Group, LLC page 25 of 50 March 2004
299 Table C-5 On-Road Travel Model and Emission Estimates POLB Baseline EI Period Roadway Segment TOG_E F CO_EF NOX_E F SO2_E F PM10_E F TOG_LB S CO_LB S NOX_LB S SO2_LB S PM10_LB S PM25_LB S MD Pier E St On/Off Ramp MD Broadway MD Broadway MD Santa Fe MD Santa Fe MD Canal MD Caspian MD Harbor Ave NT Anaheim St NT Anaheim St NT Anaheim St NT Anaheim St NT Anaheim St NT Anaheim St NT Anaheim St NT Anaheim St NT Anaheim St NT Anaheim St NT Anaheim St NT New Dock St NT New Dock St NT SR-47 On Ramp NT SR NT SR NT SR NT SR NT Pier A Way NT Pier B St NT Pier B St NT Pier B St NT Pier B St NT Pier B St NT Pier B St NT Carrack Ave NT Carrack Ave NT Equilon Enterprises NT Edison Avenue NT Edison Avenue NT Edison Avenue NT Edison Avenue NT Anaheim Way NT 9th Street Starcrest Consulting Group, LLC page 26 of 50 March 2004
300 Table C-5 On-Road Travel Model and Emission Estimates POLB Baseline EI Period Roadway Segment From To Direction Bobtails Chassis Containers Total Trucks Distance VMT Speed Speed Bin NT 9th Street Edison Ave Jackson Southbound NT 9th Street Jackson Santa Fe Southbound NT 9th Street Santa Fe Canal Southbound NT 9th Street Canal Caspian Southbound NT 9th Street Caspian Pico Southbound NT 9th Street Caspian Pico Southbound NT 9th Street Caspian Pico Southbound NT 9th Street Caspian Pico Southbound NT 9th Street Pico I-710 Southbound NT 10th Street Caspian Harbor Ave Northbound NT 10th Street Caspian Harbor Ave Northbound NT I-710 9th St Off Ramp 9th St Off Ramp Northbound NT I-710 9th St Off Ramp 9th St Off Ramp Northbound NT I-710 9th St Off Ramp 9th St Off Ramp Northbound NT I-710 9th St Off Ramp 9th St Off Ramp Northbound NT I-710 9th St Off Ramp to Pico 9th St Off Ramp to Pico Southbound NT Pico Ave 9th Street EB 9th Street EB Southbound NT Pico Ave 9th Street WB 9th Street WB Northbound NT Pico Ave 9th Street WB 9th Street WB Northbound NT I-710 Pier B St On Ramp Connector to Ocean WB Southbound NT I-710 Anaheim SB On Ramp Pico SB Ramps Southbound NT I-710 n/o Anaheim SB On Rampn/o Anaheim SB On RampSouthbound NT I-710 s/o Anaheim SB Off Ramps/o Anaheim SB Off RampSouthbound NT Pico Ave 9th St Pier B St Southbound NT Pico Ave Pier B St Pier C St Southbound NT Pico Ave Pier C St Pier D St Southbound NT Pico Ave Pier C St Pier D St Southbound NT Pico Ave Pier D St Quick Stop Lube Southbound NT Pico Ave Pier D St Broadway Southbound NT Pico Ave Broadway Ocean Blvd Off ramp Southbound NT Pico Ave Ocean Blvd Ramps n/o Pier E St Southbound NT Pico Ave n/o Pier E St Pier E St Southbound NT Pico Ave Pier E St s/o Pier E St Southbound NT Pico Ave Connector Connector Southbound NT Pico Ave Connector Harbor Plaza Southbound NT Pico Ave Connector Harbor Plaza Southbound NT Pier E St Pico Ave Pier E Terminals Southbound NT Pier E St Pico Ave Pier E Terminals Southbound NT Pier G Ave Harbor Plaza AimChor North Southbound NT Pier G Ave AimChor North Pier G Way Southbound NT Pier G Way Pier G Ave Pier G Ave East Bound NT Pier G Ave Pier G Way Sea Land North Northbound Starcrest Consulting Group, LLC page 27 of 50 March 2004
301 Table C-5 On-Road Travel Model and Emission Estimates POLB Baseline EI Period Roadway Segment NT 9th Street NT 9th Street NT 9th Street NT 9th Street NT 9th Street NT 9th Street NT 9th Street NT 9th Street NT 9th Street NT 10th Street NT 10th Street NT I-710 NT I-710 NT I-710 NT I-710 NT I-710 NT Pico Ave NT Pico Ave NT Pico Ave NT I-710 NT I-710 NT I-710 NT I-710 NT Pico Ave NT Pico Ave NT Pico Ave NT Pico Ave NT Pico Ave NT Pico Ave NT Pico Ave NT Pico Ave NT Pico Ave NT Pico Ave NT Pico Ave NT Pico Ave NT Pico Ave NT Pier E St NT Pier E St NT Pier G Ave NT Pier G Ave NT Pier G Way NT Pier G Ave TOG_E F CO_EF NOX_E F SO2_E F PM10_E F TOG_LB S CO_LB S NOX_LB S SO2_LB S PM10_LB S PM25_LB S Starcrest Consulting Group, LLC page 28 of 50 March 2004
302 Table C-5 On-Road Travel Model and Emission Estimates POLB Baseline EI Period Roadway Segment From To Direction Bobtails Chassis Containers Total Trucks Distance VMT Speed Speed Bin NT Pier G Ave Sea Land North Pier G Ave Northbound NT Pier F Ave LBHD Transit Shed Middle Harbor Northbound NT Pier F Ave Middle Harbor Middle Harbor Northbound NT Pier F Ave Middle Harbor Chemoil Marine Northbound NT Pier F Ave Middle Harbor Chemoil Marine Northbound NT Pier F Ave Middle Harbor Chemoil Marine Northbound NT Pier F Ave Chemoil Marine Harbor Plaza Northbound NT Pier F Ave Harbor Plaza End of Pier F Northbound NT Harbor Plaza Pier F Ave Pier G Ave East Bound NT Harbor Plaza Pier G Ave Queens Way Bridge East Bound NT Harbor Plaza Pier G Ave Queens Way Bridge East Bound NT Harbor Plaza Harbor Plaza Harbor Plaza Southbound NT Harbor Plaza Harbor Plaza Harbor Plaza Southbound NT Harbor Plaza Harbor Plaza Harbor Scenic Dr East Bound NT Harbor Plaza Harbor Plaza Harbor Scenic Dr East Bound NT Harbor Plaza Harbor Scenic Dr Harbor Scenic Dr Ramp Northbound NT Harbor Plaza Harbor Scenic Dr Ramp Queensway Dr Northbound NT QueensHWY Harbor Scenic Dr Ramp Connector Southbound NT QueensHWY Harbor Scenic Dr Ramp Connector Southbound NT QueensHWY Connector Harbor Plaza Northbound NT QueensHWY Harbor Plaza Harbor Scenic Dr Northbound NT Connector QueensHWY Harbor Scenic Dr Westbound NT Pier J Way Pier J Pier J Ave East Bound NT Pier J Way Pier J Ave Dr East Bound NT Pier J Ave Pier J Way Harbor Scenic Dr Northbound NT Harbor Scenic Way Pacific Container Term Harbor Scenic Dr East Bound NT Harbor Scenic Way Pacific Container Term Harbor Scenic Dr East Bound NT Harbor Scenic Dr Harbor Scenic Way Pier J Ave Northbound NT Harbor Scenic Dr Harbor Scenic Way Pier J Ave Northbound NT Harbor Scenic Dr Pier J Ave Connector Northbound NT Harbor Scenic Dr Connector Harbor Plaza Northbound NT Harbor Scenic Dr Harbor Plaza SB Ramp Harbor Plaza SB Ramp Southbound NT Harbor Scenic Dr SB n/o Harbor Plaza Ram SB n/o Harbor Plaza Ram Southbound NT Harbor Scenic Dr Ramp Queens Way Bridge Northbound NT Harbor Scenic Dr Queens Way Bridge Connector Northbound NT Harbor Scenic Dr Connector Queens Way Dr Northbound NT Harbor Scenic Dr Queens Way Dr Connector Northbound NT Harbor Scenic Dr Connector I-710 On Ramp Northbound NT Harbor Scenic Dr I-710 On Ramp Ocean Blvd Northbound NT Harbor Scenic Dr I-710 Offramp I-710 On Ramp Southbound NT Pier D Ave n/o Pier D Entrance n/o Pier D Entrance Northbound NT Pier D Ave s/o Ocean Blvd s/o Ocean Blvd Westbound Starcrest Consulting Group, LLC page 29 of 50 March 2004
303 Table C-5 On-Road Travel Model and Emission Estimates POLB Baseline EI Period Roadway Segment NT Pier G Ave NT Pier F Ave NT Pier F Ave NT Pier F Ave NT Pier F Ave NT Pier F Ave NT Pier F Ave NT Pier F Ave NT Harbor Plaza NT Harbor Plaza NT Harbor Plaza NT Harbor Plaza NT Harbor Plaza NT Harbor Plaza NT Harbor Plaza NT Harbor Plaza NT Harbor Plaza NT QueensHWY NT QueensHWY NT QueensHWY NT QueensHWY NT Connector NT Pier J Way NT Pier J Way NT Pier J Ave NT Harbor Scenic Way NT Harbor Scenic Way NT Harbor Scenic Dr NT Harbor Scenic Dr NT Harbor Scenic Dr NT Harbor Scenic Dr NT Harbor Scenic Dr NT Harbor Scenic Dr NT Harbor Scenic Dr NT Harbor Scenic Dr NT Harbor Scenic Dr NT Harbor Scenic Dr NT Harbor Scenic Dr NT Harbor Scenic Dr NT Harbor Scenic Dr NT Pier D Ave NT Pier D Ave TOG_E F CO_EF NOX_E F SO2_E F PM10_E F TOG_LB S CO_LB S NOX_LB S SO2_LB S PM10_LB S PM25_LB S Starcrest Consulting Group, LLC page 30 of 50 March 2004
304 Table C-5 On-Road Travel Model and Emission Estimates POLB Baseline EI Period Roadway Segment From To Direction Bobtails Chassis Containers Total Trucks Distance VMT Speed Speed Bin NT Pier D Ave Ocean Blvd undercrossing Ocean Blvd undercrossing Northbound NT Pier D St w/o Pico Ave w/o Pico Ave Westbound NT Pier C St w/o Pico Ave w/o Pico Ave East Bound NT Pier C St w/o Pico Ave w/o Pico Ave East Bound NT Queens Way Dr Harbor Plaza Queens Way Bridge Northbound NT Queens Way Dr Queens Way Bridge Harbor Scenic Way Northbound NT Seaside Blvd Ocean Blvd On Ramp Pier T East Bound NT Seaside Blvd Ocean Blvd On Ramp Pier T East Bound NT Pier T Ave s/o Seaside Blvd s/o Seaside Blvd Northbound NT Ocean Blvd Henry Ford SR-47 East Bound NT Ocean Blvd SR-47 Seaside Blvd OnRamp East Bound NT Ocean Blvd Seaside Blvd OnRamp Seaside Blvd East Bound NT Ocean Blvd WB Ocean Seaside EB Ramp East Bound NT Ocean Blvd WB Ramp e/o Ocean Blvd Ocean Blvd Westbound NT Ocean Blvd Seaside Off ramp Seaside On Ramp Westbound NT Ocean Blvd Ocean Blvd w/o Seaside Off Ramp Westbound NT Ocean Blvd Seaside Blvd OnRamp I-710 Offramp East Bound NT Ocean Blvd Seaside Blvd OnRamp I-710 Offramp East Bound NT Ocean Blvd Seaside Blvd OnRamp I-710 Offramp East Bound NT Connector to Ocean WBHarbor Scenic Drive Ocean Blvd Westbound NT EB OnRamp to I-710 Ocean Blvd Harbor Scenic Drive East Bound NT WB OnRamp to Ocean Pico Ave Ocean Blvd Westbound NT Pier E St On/Off Ramp Pico Ave Ocean Blvd East Bound NT Pier E St On/Off Ramp Pico Ave Ocean Blvd Westbound NT WB Off Ramp to Pico Ocean Blvd Pico Ave Westbound NT Broadway e/o Pico Ave e/o Pico Ave East Bound NT Broadway w/o Pico Ave w/o Pico Ave Westbound NT Santa Fe 9th St Anaheim St Northbound NT Santa Fe n/o Anaheim St s/o Willow St Northbound NT Canal 9th St Anaheim St Northbound NT Caspian 9th St Anaheim St Northbound NT Harbor Ave 9th St Anaheim St Northbound NT Anaheim St Anaheim Way 9th St Westbound NT Anaheim St Anaheim Way 9th St Westbound NT Anaheim St Anaheim Way 9th St Westbound NT Anaheim St 9th St Jackson Westbound NT Anaheim St 9th St Jackson Westbound NT Anaheim St Jackson Santa Fe Westbound NT Anaheim St Santa Fe Canal Westbound NT Anaheim St Canal Caspian Westbound NT Anaheim St Canal Caspian Westbound NT Anaheim St Harbor Ave I-710 SB ramp Westbound Starcrest Consulting Group, LLC page 31 of 50 March 2004
305 Table C-5 On-Road Travel Model and Emission Estimates POLB Baseline EI Period Roadway Segment TOG_E F CO_EF NOX_E F SO2_E F PM10_E F TOG_LB S CO_LB S NOX_LB S SO2_LB S PM10_LB S PM25_LB S NT Pier D Ave NT Pier D St NT Pier C St NT Pier C St NT Queens Way Dr NT Queens Way Dr NT Seaside Blvd NT Seaside Blvd NT Pier T Ave NT Ocean Blvd NT Ocean Blvd NT Ocean Blvd NT Ocean Blvd NT Ocean Blvd WB Ramp NT Ocean Blvd NT Ocean Blvd NT Ocean Blvd NT Ocean Blvd NT Ocean Blvd NT Connector to Ocean WB NT EB OnRamp to I NT WB OnRamp to Ocean NT Pier E St On/Off Ramp NT Pier E St On/Off Ramp NT WB Off Ramp to Pico NT Broadway NT Broadway NT Santa Fe NT Santa Fe NT Canal NT Caspian NT Harbor Ave NT Anaheim St NT Anaheim St NT Anaheim St NT Anaheim St NT Anaheim St NT Anaheim St NT Anaheim St NT Anaheim St NT Anaheim St NT Anaheim St Starcrest Consulting Group, LLC page 32 of 50 March 2004
306 Table C-5 On-Road Travel Model and Emission Estimates POLB Baseline EI Period Roadway Segment From To Direction Bobtails Chassis Containers Total Trucks Distance VMT Speed Speed Bin NT Anaheim St Harbor Ave I-710 SB ramp Westbound NT New Dock St Henry Ford SR-47 Off Ramp Westbound NT New Dock St SR-47 Off Ramp SR-47 On Ramp Westbound NT Pier A Way Pier B St Carrack Ave Westbound NT Pier B St Anaheim Way Carrack Ave Northbound NT Pier B St Anaheim Way Edison Ave Northbound NT Pier B St Edison Ave Pier B St Northbound NT Pier B St Edison Ave Pico Northbound NT Pier B St Edison Ave Pico Northbound NT Pier B St Edison Ave Pico Northbound NT Carrack Ave Pier A Way Pier A Entrance Northbound NT Carrack Ave Pier A Way Pier A Entrance Northbound NT Equilon Enterprises Carrack Ave Equilon Westbound NT Edison Avenue National Gypsum Co Pier B St Southbound NT Edison Avenue National Gypsum Co Pier B St Southbound NT Edison Avenue National Gypsum Co Pier B St Southbound NT Edison Avenue Pier B St 9th St Southbound NT Anaheim Way Anaheim St Pier B St Northbound NT 9th Street Anaheim St Edison Ave Northbound NT 9th Street Edison Ave Jackson Northbound NT 9th Street Jackson Santa Fe Northbound NT 9th Street Santa Fe Canal Northbound NT 9th Street Canal Caspian Northbound NT 9th Street Caspian Pico Northbound NT 9th Street Caspian Pico Northbound NT Pico Ave 9th St Pier B St Northbound NT Pico Ave Pier B St Pier C St Northbound NT Pico Ave Pier C St Pier D St Northbound NT Pico Ave Pier C St Pier D St Northbound NT Pico Ave Pier D St Quick Stop Lube Northbound NT Pico Ave Pier D St Broadway Northbound NT Pico Ave Broadway Ocean Blvd Off ramp Northbound NT Pico Ave Ocean Blvd Ramps n/o Pier E St Northbound NT Pico Ave n/o Pier E St Pier E St Northbound NT Pico Ave Pier E St s/o Pier E St Northbound NT Pico Ave Connector Connector Northbound NT Pico Ave Connector Harbor Plaza Northbound NT Pico Ave Connector Harbor Plaza Northbound NT Pier E St Pico Ave Pier E Terminals Northbound NT Pier G Ave Harbor Plaza AimChor North Northbound NT Pier F Ave LBHD Transit Shed Middle Harbor Southbound NT Pier F Ave Middle Harbor Middle Harbor Southbound Starcrest Consulting Group, LLC page 33 of 50 March 2004
307 Table C-5 On-Road Travel Model and Emission Estimates POLB Baseline EI Period Roadway Segment NT Anaheim St NT New Dock St NT New Dock St NT Pier A Way NT Pier B St NT Pier B St NT Pier B St NT Pier B St NT Pier B St NT Pier B St NT Carrack Ave NT Carrack Ave NT Equilon Enterprises NT Edison Avenue NT Edison Avenue NT Edison Avenue NT Edison Avenue NT Anaheim Way NT 9th Street NT 9th Street NT 9th Street NT 9th Street NT 9th Street NT 9th Street NT 9th Street NT Pico Ave NT Pico Ave NT Pico Ave NT Pico Ave NT Pico Ave NT Pico Ave NT Pico Ave NT Pico Ave NT Pico Ave NT Pico Ave NT Pico Ave NT Pico Ave NT Pico Ave NT Pier E St NT Pier G Ave NT Pier F Ave NT Pier F Ave TOG_E F CO_EF NOX_E F SO2_E F PM10_E F TOG_LB S CO_LB S NOX_LB S SO2_LB S PM10_LB S PM25_LB S Starcrest Consulting Group, LLC page 34 of 50 March 2004
308 Table C-5 On-Road Travel Model and Emission Estimates POLB Baseline EI Period Roadway Segment From To Direction Bobtails Chassis Containers Total Trucks Distance VMT Speed Speed Bin NT Pier F Ave Middle Harbor Chemoil Marine Southbound NT Pier F Ave Middle Harbor Chemoil Marine Southbound NT Pier F Ave Middle Harbor Chemoil Marine Southbound NT Pier F Ave Chemoil Marine Harbor Plaza Southbound NT Pier F Ave Harbor Plaza End of Pier F Southbound NT Harbor Plaza Pier F Ave Pier G Ave Westbound NT Harbor Plaza Pier G Ave Queens Way Bridge Westbound NT Harbor Plaza Pier G Ave Queens Way Bridge Westbound NT Harbor Plaza Harbor Plaza Harbor Plaza Northbound NT Harbor Plaza Harbor Plaza Harbor Plaza Northbound NT Harbor Plaza Harbor Plaza Harbor Scenic Dr Westbound NT Harbor Plaza Harbor Plaza Harbor Scenic Dr Westbound NT Harbor Plaza Harbor Scenic Dr Harbor Scenic Dr Ramp Southbound NT Harbor Plaza Harbor Scenic Dr Ramp Queensway Dr Southbound NT Pier J Way Pier J Pier J Ave Westbound NT Pier J Way Pier J Ave Dr Westbound NT Pier J Ave Pier J Way Harbor Scenic Dr Southbound NT Harbor Scenic Way Pacific Container Term Harbor Scenic Dr Westbound NT Harbor Scenic Way Pacific Container Term Harbor Scenic Dr Westbound NT Harbor Scenic Dr Harbor Scenic Way Pier J Ave Southbound NT Harbor Scenic Dr Harbor Scenic Way Pier J Ave Southbound NT Harbor Scenic Dr Pier J Ave Connector Southbound NT Harbor Scenic Dr Connector Harbor Plaza Southbound NT Harbor Scenic Dr Ramp Queens Way Bridge Westbound NT Harbor Scenic Dr Queens Way Bridge Connector Westbound NT Harbor Scenic Dr Connector Queens Way Dr Westbound NT Harbor Scenic Dr Queens Way Dr Connector Westbound NT Harbor Scenic Dr Connector I-710 On Ramp Westbound NT Pier D Ave n/o Pier D Entrance n/o Pier D Entrance Southbound NT Pier D Ave s/o Ocean Blvd s/o Ocean Blvd East Bound NT Pier D Ave Ocean Blvd undercrossing Ocean Blvd undercrossing Southbound NT Pier D St w/o Pico Ave w/o Pico Ave East Bound NT Pier C St w/o Pico Ave w/o Pico Ave Westbound NT Pier C St w/o Pico Ave w/o Pico Ave Westbound NT Seaside Blvd Ocean Blvd On Ramp Pier T Westbound NT Seaside Blvd Ocean Blvd On Ramp Pier T Westbound NT Pier T Ave s/o Seaside Blvd s/o Seaside Blvd Southbound NT Ocean Blvd Henry Ford SR-47 Westbound NT Ocean Blvd SR-47 Seaside Blvd OnRamp Westbound NT Ocean Blvd WB Ramp e/o Ocean Blvd Ocean Blvd East Bound NT Ocean Blvd Seaside Off ramp Seaside On Ramp East Bound NT Ocean Blvd Ocean Blvd w/o Seaside Off Ramp East Bound Starcrest Consulting Group, LLC page 35 of 50 March 2004
309 Table C-5 On-Road Travel Model and Emission Estimates POLB Baseline EI Period Roadway Segment NT Pier F Ave NT Pier F Ave NT Pier F Ave NT Pier F Ave NT Pier F Ave NT Harbor Plaza NT Harbor Plaza NT Harbor Plaza NT Harbor Plaza NT Harbor Plaza NT Harbor Plaza NT Harbor Plaza NT Harbor Plaza NT Harbor Plaza NT Pier J Way NT Pier J Way NT Pier J Ave NT Harbor Scenic Way NT Harbor Scenic Way NT Harbor Scenic Dr NT Harbor Scenic Dr NT Harbor Scenic Dr NT Harbor Scenic Dr NT Harbor Scenic Dr NT Harbor Scenic Dr NT Harbor Scenic Dr NT Harbor Scenic Dr NT Harbor Scenic Dr NT Pier D Ave NT Pier D Ave NT Pier D Ave NT Pier D St NT Pier C St NT Pier C St NT Seaside Blvd NT Seaside Blvd NT Pier T Ave NT Ocean Blvd NT Ocean Blvd NT Ocean Blvd WB Ramp NT Ocean Blvd NT Ocean Blvd TOG_E F CO_EF NOX_E F SO2_E F PM10_E F TOG_LB S CO_LB S NOX_LB S SO2_LB S PM10_LB S PM25_LB S Starcrest Consulting Group, LLC page 36 of 50 March 2004
310 Table C-5 On-Road Travel Model and Emission Estimates POLB Baseline EI Period Roadway Segment From To Direction Bobtails Chassis Containers Total Trucks Distance VMT Speed Speed Bin NT Ocean Blvd Seaside Blvd OnRamp I-710 Offramp Westbound NT Ocean Blvd Seaside Blvd OnRamp I-710 Offramp Westbound NT Ocean Blvd Seaside Blvd OnRamp I-710 Offramp Westbound NT Pier E St On/Off Ramp Pico Ave Ocean Blvd Westbound NT Pier E St On/Off Ramp Pico Ave Ocean Blvd East Bound NT Broadway e/o Pico Ave e/o Pico Ave Westbound NT Broadway w/o Pico Ave w/o Pico Ave East Bound NT Santa Fe 9th St Anaheim St Southbound NT Santa Fe n/o Anaheim St s/o Willow St Southbound NT Canal 9th St Anaheim St Southbound NT Caspian 9th St Anaheim St Southbound NT Harbor Ave 9th St Anaheim St Southbound PM Anaheim St Anaheim Way 9th St East Bound PM Anaheim St Anaheim Way 9th St East Bound PM Anaheim St Anaheim Way 9th St East Bound PM Anaheim St 9th St Jackson East Bound PM Anaheim St 9th St Jackson East Bound PM Anaheim St Jackson Santa Fe East Bound PM Anaheim St Santa Fe Canal East Bound PM Anaheim St Canal Caspian East Bound PM Anaheim St Canal Caspian East Bound PM Anaheim St Harbor Ave I-710 SB ramp East Bound PM Anaheim St Harbor Ave I-710 SB ramp East Bound PM New Dock St Henry Ford SR-47 Off Ramp East Bound PM New Dock St SR-47 Off Ramp SR-47 On Ramp East Bound PM SR-47 On Ramp SR-47 NB On Ramp SR-47 NB On Ramp Northbound PM SR-47 SR-47 SR-47 Off Ramp Southbound PM SR-47 SR-47 Off Ramp Ocean Blvd Southbound PM SR-47 Ocean Blvd SR-47 On Ramp Northbound PM SR-47 SR-47 NB On Ramp Henry Ford NB Off RampNorthbound PM Pier A Way Pier B St Carrack Ave East Bound PM Pier B St Anaheim Way Carrack Ave Southbound PM Pier B St Anaheim Way Edison Ave Southbound PM Pier B St Edison Ave Pier B St Southbound PM Pier B St Edison Ave Pico Southbound PM Pier B St Edison Ave Pico Southbound PM Pier B St Edison Ave Pico Southbound PM Carrack Ave Pier A Way Pier A Entrance Southbound PM Carrack Ave Pier A Way Pier A Entrance Southbound PM Equilon Enterprises Carrack Ave Equilon East Bound PM Edison Avenue National Gypsum Co Pier B St Northbound PM Edison Avenue National Gypsum Co Pier B St Northbound Starcrest Consulting Group, LLC page 37 of 50 March 2004
311 Table C-5 On-Road Travel Model and Emission Estimates POLB Baseline EI Period Roadway Segment TOG_E F CO_EF NOX_E F SO2_E F PM10_E F TOG_LB S CO_LB S NOX_LB S SO2_LB S PM10_LB S PM25_LB S NT Ocean Blvd NT Ocean Blvd NT Ocean Blvd NT Pier E St On/Off Ramp NT Pier E St On/Off Ramp NT Broadway NT Broadway NT Santa Fe NT Santa Fe NT Canal NT Caspian NT Harbor Ave PM Anaheim St PM Anaheim St PM Anaheim St PM Anaheim St PM Anaheim St PM Anaheim St PM Anaheim St PM Anaheim St PM Anaheim St PM Anaheim St PM Anaheim St PM New Dock St PM New Dock St PM SR-47 On Ramp PM SR PM SR PM SR PM SR PM Pier A Way PM Pier B St PM Pier B St PM Pier B St PM Pier B St PM Pier B St PM Pier B St PM Carrack Ave PM Carrack Ave PM Equilon Enterprises PM Edison Avenue PM Edison Avenue Starcrest Consulting Group, LLC page 38 of 50 March 2004
312 Table C-5 On-Road Travel Model and Emission Estimates POLB Baseline EI Period Roadway Segment From To Direction Bobtails Chassis Containers Total Trucks Distance VMT Speed Speed Bin PM Edison Avenue National Gypsum Co Pier B St Northbound PM Edison Avenue Pier B St 9th St Northbound PM Anaheim Way Anaheim St Pier B St Southbound PM 9th Street Anaheim St Edison Ave Southbound PM 9th Street Edison Ave Jackson Southbound PM 9th Street Jackson Santa Fe Southbound PM 9th Street Santa Fe Canal Southbound PM 9th Street Canal Caspian Southbound PM 9th Street Caspian Pico Southbound PM 9th Street Caspian Pico Southbound PM 9th Street Caspian Pico Southbound PM 9th Street Caspian Pico Southbound PM 9th Street Pico I-710 Southbound PM 10th Street Caspian Harbor Ave Northbound PM 10th Street Caspian Harbor Ave Northbound PM I-710 9th St Off Ramp 9th St Off Ramp Northbound PM I-710 9th St Off Ramp 9th St Off Ramp Northbound PM I-710 9th St Off Ramp 9th St Off Ramp Northbound PM I-710 9th St Off Ramp 9th St Off Ramp Northbound PM I-710 9th St Off Ramp to Pico 9th St Off Ramp to Pico Southbound PM Pico Ave 9th Street EB 9th Street EB Southbound PM Pico Ave 9th Street WB 9th Street WB Northbound PM Pico Ave 9th Street WB 9th Street WB Northbound PM I-710 Pier B St On Ramp Connector to Ocean WB Southbound PM I-710 Anaheim SB On Ramp Pico SB Ramps Southbound PM I-710 n/o Anaheim SB On Rampn/o Anaheim SB On RampSouthbound PM I-710 s/o Anaheim SB Off Ramps/o Anaheim SB Off RampSouthbound PM Pico Ave 9th St Pier B St Southbound PM Pico Ave Pier B St Pier C St Southbound PM Pico Ave Pier C St Pier D St Southbound PM Pico Ave Pier C St Pier D St Southbound PM Pico Ave Pier D St Quick Stop Lube Southbound PM Pico Ave Pier D St Broadway Southbound PM Pico Ave Broadway Ocean Blvd Off ramp Southbound PM Pico Ave Ocean Blvd Ramps n/o Pier E St Southbound PM Pico Ave n/o Pier E St Pier E St Southbound PM Pico Ave Pier E St s/o Pier E St Southbound PM Pico Ave Connector Connector Southbound PM Pico Ave Connector Harbor Plaza Southbound PM Pico Ave Connector Harbor Plaza Southbound PM Pier E St Pico Ave Pier E Terminals Southbound PM Pier E St Pico Ave Pier E Terminals Southbound Starcrest Consulting Group, LLC page 39 of 50 March 2004
313 Table C-5 On-Road Travel Model and Emission Estimates POLB Baseline EI Period Roadway Segment PM Edison Avenue PM Edison Avenue PM Anaheim Way PM 9th Street PM 9th Street PM 9th Street PM 9th Street PM 9th Street PM 9th Street PM 9th Street PM 9th Street PM 9th Street PM 9th Street PM 10th Street PM 10th Street PM I-710 PM I-710 PM I-710 PM I-710 PM I-710 PM Pico Ave PM Pico Ave PM Pico Ave PM I-710 PM I-710 PM I-710 PM I-710 PM Pico Ave PM Pico Ave PM Pico Ave PM Pico Ave PM Pico Ave PM Pico Ave PM Pico Ave PM Pico Ave PM Pico Ave PM Pico Ave PM Pico Ave PM Pico Ave PM Pico Ave PM Pier E St PM Pier E St TOG_E F CO_EF NOX_E F SO2_E F PM10_E F TOG_LB S CO_LB S NOX_LB S SO2_LB S PM10_LB S PM25_LB S Starcrest Consulting Group, LLC page 40 of 50 March 2004
314 Table C-5 On-Road Travel Model and Emission Estimates POLB Baseline EI Period Roadway Segment From To Direction Bobtails Chassis Containers Total Trucks Distance VMT Speed Speed Bin PM Pier G Ave Harbor Plaza AimChor North Southbound PM Pier G Ave AimChor North Pier G Way Southbound PM Pier G Way Pier G Ave Pier G Ave East Bound PM Pier G Ave Pier G Way Sea Land North Northbound PM Pier G Ave Sea Land North Pier G Ave Northbound PM Pier F Ave LBHD Transit Shed Middle Harbor Northbound PM Pier F Ave Middle Harbor Middle Harbor Northbound PM Pier F Ave Middle Harbor Chemoil Marine Northbound PM Pier F Ave Middle Harbor Chemoil Marine Northbound PM Pier F Ave Middle Harbor Chemoil Marine Northbound PM Pier F Ave Chemoil Marine Harbor Plaza Northbound PM Pier F Ave Harbor Plaza End of Pier F Northbound PM Harbor Plaza Pier F Ave Pier G Ave East Bound PM Harbor Plaza Pier G Ave Queens Way Bridge East Bound PM Harbor Plaza Pier G Ave Queens Way Bridge East Bound PM Harbor Plaza Harbor Plaza Harbor Plaza Southbound PM Harbor Plaza Harbor Plaza Harbor Plaza Southbound PM Harbor Plaza Harbor Plaza Harbor Scenic Dr East Bound PM Harbor Plaza Harbor Plaza Harbor Scenic Dr East Bound PM Harbor Plaza Harbor Scenic Dr Harbor Scenic Dr Ramp Northbound PM Harbor Plaza Harbor Scenic Dr Ramp Queensway Dr Northbound PM QueensHWY Harbor Scenic Dr Ramp Connector Southbound PM QueensHWY Harbor Scenic Dr Ramp Connector Southbound PM QueensHWY Connector Harbor Plaza Northbound PM QueensHWY Harbor Plaza Harbor Scenic Dr Northbound PM Connector QueensHWY Harbor Scenic Dr Westbound PM Pier J Way Pier J Pier J Ave East Bound PM Pier J Way Pier J Ave Dr East Bound PM Pier J Ave Pier J Way Harbor Scenic Dr Northbound PM Harbor Scenic Way Pacific Container Term Harbor Scenic Dr East Bound PM Harbor Scenic Way Pacific Container Term Harbor Scenic Dr East Bound PM Harbor Scenic Dr Harbor Scenic Way Pier J Ave Northbound PM Harbor Scenic Dr Harbor Scenic Way Pier J Ave Northbound PM Harbor Scenic Dr Pier J Ave Connector Northbound PM Harbor Scenic Dr Connector Harbor Plaza Northbound PM Harbor Scenic Dr Harbor Plaza SB Ramp Harbor Plaza SB Ramp Southbound PM Harbor Scenic Dr SB n/o Harbor Plaza Ram SB n/o Harbor Plaza Ram Southbound PM Harbor Scenic Dr Ramp Queens Way Bridge Northbound PM Harbor Scenic Dr Queens Way Bridge Connector Northbound PM Harbor Scenic Dr Connector Queens Way Dr Northbound PM Harbor Scenic Dr Queens Way Dr Connector Northbound PM Harbor Scenic Dr Connector I-710 On Ramp Northbound Starcrest Consulting Group, LLC page 41 of 50 March 2004
315 Table C-5 On-Road Travel Model and Emission Estimates POLB Baseline EI Period Roadway Segment PM Pier G Ave PM Pier G Ave PM Pier G Way PM Pier G Ave PM Pier G Ave PM Pier F Ave PM Pier F Ave PM Pier F Ave PM Pier F Ave PM Pier F Ave PM Pier F Ave PM Pier F Ave PM Harbor Plaza PM Harbor Plaza PM Harbor Plaza PM Harbor Plaza PM Harbor Plaza PM Harbor Plaza PM Harbor Plaza PM Harbor Plaza PM Harbor Plaza PM QueensHWY PM QueensHWY PM QueensHWY PM QueensHWY PM Connector PM Pier J Way PM Pier J Way PM Pier J Ave PM Harbor Scenic Way PM Harbor Scenic Way PM Harbor Scenic Dr PM Harbor Scenic Dr PM Harbor Scenic Dr PM Harbor Scenic Dr PM Harbor Scenic Dr PM Harbor Scenic Dr PM Harbor Scenic Dr PM Harbor Scenic Dr PM Harbor Scenic Dr PM Harbor Scenic Dr PM Harbor Scenic Dr TOG_E F CO_EF NOX_E F SO2_E F PM10_E F TOG_LB S CO_LB S NOX_LB S SO2_LB S PM10_LB S PM25_LB S Starcrest Consulting Group, LLC page 42 of 50 March 2004
316 Table C-5 On-Road Travel Model and Emission Estimates POLB Baseline EI Period Roadway Segment From To Direction Bobtails Chassis Containers Total Trucks Distance VMT Speed Speed Bin PM Harbor Scenic Dr I-710 On Ramp Ocean Blvd Northbound PM Harbor Scenic Dr I-710 Offramp I-710 On Ramp Southbound PM Pier D Ave n/o Pier D Entrance n/o Pier D Entrance Northbound PM Pier D Ave s/o Ocean Blvd s/o Ocean Blvd Westbound PM Pier D Ave Ocean Blvd undercrossing Ocean Blvd undercrossing Northbound PM Pier D St w/o Pico Ave w/o Pico Ave Westbound PM Pier C St w/o Pico Ave w/o Pico Ave East Bound PM Pier C St w/o Pico Ave w/o Pico Ave East Bound PM Queens Way Dr Harbor Plaza Queens Way Bridge Northbound PM Queens Way Dr Queens Way Bridge Harbor Scenic Way Northbound PM Seaside Blvd Ocean Blvd On Ramp Pier T East Bound PM Seaside Blvd Ocean Blvd On Ramp Pier T East Bound PM Pier T Ave s/o Seaside Blvd s/o Seaside Blvd Northbound PM Ocean Blvd Henry Ford SR-47 East Bound PM Ocean Blvd SR-47 Seaside Blvd OnRamp East Bound PM Ocean Blvd Seaside Blvd OnRamp Seaside Blvd East Bound PM Ocean Blvd WB Ocean Seaside EB Ramp East Bound PM Ocean Blvd WB Ramp e/o Ocean Blvd Ocean Blvd Westbound PM Ocean Blvd Seaside Off ramp Seaside On Ramp Westbound PM Ocean Blvd Ocean Blvd w/o Seaside Off Ramp Westbound PM Ocean Blvd Seaside Blvd OnRamp I-710 Offramp East Bound PM Ocean Blvd Seaside Blvd OnRamp I-710 Offramp East Bound PM Ocean Blvd Seaside Blvd OnRamp I-710 Offramp East Bound PM Connector to Ocean WBHarbor Scenic Drive Ocean Blvd Westbound PM EB OnRamp to I-710 Ocean Blvd Harbor Scenic Drive East Bound PM WB OnRamp to Ocean Pico Ave Ocean Blvd Westbound PM Pier E St On/Off Ramp Pico Ave Ocean Blvd East Bound PM Pier E St On/Off Ramp Pico Ave Ocean Blvd Westbound PM WB Off Ramp to Pico Ocean Blvd Pico Ave Westbound PM Broadway e/o Pico Ave e/o Pico Ave East Bound PM Broadway w/o Pico Ave w/o Pico Ave Westbound PM Santa Fe 9th St Anaheim St Northbound PM Santa Fe n/o Anaheim St s/o Willow St Northbound PM Canal 9th St Anaheim St Northbound PM Caspian 9th St Anaheim St Northbound PM Harbor Ave 9th St Anaheim St Northbound PM Anaheim St Anaheim Way 9th St Westbound PM Anaheim St Anaheim Way 9th St Westbound PM Anaheim St Anaheim Way 9th St Westbound PM Anaheim St 9th St Jackson Westbound PM Anaheim St 9th St Jackson Westbound PM Anaheim St Jackson Santa Fe Westbound Starcrest Consulting Group, LLC page 43 of 50 March 2004
317 Table C-5 On-Road Travel Model and Emission Estimates POLB Baseline EI Period Roadway Segment TOG_E F CO_EF NOX_E F SO2_E F PM10_E F TOG_LB S CO_LB S NOX_LB S SO2_LB S PM10_LB S PM25_LB S PM Harbor Scenic Dr PM Harbor Scenic Dr PM Pier D Ave PM Pier D Ave PM Pier D Ave PM Pier D St PM Pier C St PM Pier C St PM Queens Way Dr PM Queens Way Dr PM Seaside Blvd PM Seaside Blvd PM Pier T Ave PM Ocean Blvd PM Ocean Blvd PM Ocean Blvd PM Ocean Blvd PM Ocean Blvd WB Ramp PM Ocean Blvd PM Ocean Blvd PM Ocean Blvd PM Ocean Blvd PM Ocean Blvd PM Connector to Ocean WB PM EB OnRamp to I PM WB OnRamp to Ocean PM Pier E St On/Off Ramp PM Pier E St On/Off Ramp PM WB Off Ramp to Pico PM Broadway PM Broadway PM Santa Fe PM Santa Fe PM Canal PM Caspian PM Harbor Ave PM Anaheim St PM Anaheim St PM Anaheim St PM Anaheim St PM Anaheim St PM Anaheim St Starcrest Consulting Group, LLC page 44 of 50 March 2004
318 Table C-5 On-Road Travel Model and Emission Estimates POLB Baseline EI Period Roadway Segment From To Direction Bobtails Chassis Containers Total Trucks Distance VMT Speed Speed Bin PM Anaheim St Santa Fe Canal Westbound PM Anaheim St Canal Caspian Westbound PM Anaheim St Canal Caspian Westbound PM Anaheim St Harbor Ave I-710 SB ramp Westbound PM Anaheim St Harbor Ave I-710 SB ramp Westbound PM New Dock St Henry Ford SR-47 Off Ramp Westbound PM New Dock St SR-47 Off Ramp SR-47 On Ramp Westbound PM Pier A Way Pier B St Carrack Ave Westbound PM Pier B St Anaheim Way Carrack Ave Northbound PM Pier B St Anaheim Way Edison Ave Northbound PM Pier B St Edison Ave Pier B St Northbound PM Pier B St Edison Ave Pico Northbound PM Pier B St Edison Ave Pico Northbound PM Pier B St Edison Ave Pico Northbound PM Carrack Ave Pier A Way Pier A Entrance Northbound PM Carrack Ave Pier A Way Pier A Entrance Northbound PM Equilon Enterprises Carrack Ave Equilon Westbound PM Edison Avenue National Gypsum Co Pier B St Southbound PM Edison Avenue National Gypsum Co Pier B St Southbound PM Edison Avenue National Gypsum Co Pier B St Southbound PM Edison Avenue Pier B St 9th St Southbound PM Anaheim Way Anaheim St Pier B St Northbound PM 9th Street Anaheim St Edison Ave Northbound PM 9th Street Edison Ave Jackson Northbound PM 9th Street Jackson Santa Fe Northbound PM 9th Street Santa Fe Canal Northbound PM 9th Street Canal Caspian Northbound PM 9th Street Caspian Pico Northbound PM 9th Street Caspian Pico Northbound PM Pico Ave 9th St Pier B St Northbound PM Pico Ave Pier B St Pier C St Northbound PM Pico Ave Pier C St Pier D St Northbound PM Pico Ave Pier C St Pier D St Northbound PM Pico Ave Pier D St Quick Stop Lube Northbound PM Pico Ave Pier D St Broadway Northbound PM Pico Ave Broadway Ocean Blvd Off ramp Northbound PM Pico Ave Ocean Blvd Ramps n/o Pier E St Northbound PM Pico Ave n/o Pier E St Pier E St Northbound PM Pico Ave Pier E St s/o Pier E St Northbound PM Pico Ave Connector Connector Northbound PM Pico Ave Connector Harbor Plaza Northbound PM Pico Ave Connector Harbor Plaza Northbound Starcrest Consulting Group, LLC page 45 of 50 March 2004
319 Table C-5 On-Road Travel Model and Emission Estimates POLB Baseline EI Period Roadway Segment PM Anaheim St PM Anaheim St PM Anaheim St PM Anaheim St PM Anaheim St PM New Dock St PM New Dock St PM Pier A Way PM Pier B St PM Pier B St PM Pier B St PM Pier B St PM Pier B St PM Pier B St PM Carrack Ave PM Carrack Ave PM Equilon Enterprises PM Edison Avenue PM Edison Avenue PM Edison Avenue PM Edison Avenue PM Anaheim Way PM 9th Street PM 9th Street PM 9th Street PM 9th Street PM 9th Street PM 9th Street PM 9th Street PM Pico Ave PM Pico Ave PM Pico Ave PM Pico Ave PM Pico Ave PM Pico Ave PM Pico Ave PM Pico Ave PM Pico Ave PM Pico Ave PM Pico Ave PM Pico Ave PM Pico Ave TOG_E F CO_EF NOX_E F SO2_E F PM10_E F TOG_LB S CO_LB S NOX_LB S SO2_LB S PM10_LB S PM25_LB S Starcrest Consulting Group, LLC page 46 of 50 March 2004
320 Table C-5 On-Road Travel Model and Emission Estimates POLB Baseline EI Period Roadway Segment From To Direction Bobtails Chassis Containers Total Trucks Distance VMT Speed Speed Bin PM Pier E St Pico Ave Pier E Terminals Northbound PM Pier G Ave Harbor Plaza AimChor North Northbound PM Pier F Ave LBHD Transit Shed Middle Harbor Southbound PM Pier F Ave Middle Harbor Middle Harbor Southbound PM Pier F Ave Middle Harbor Chemoil Marine Southbound PM Pier F Ave Middle Harbor Chemoil Marine Southbound PM Pier F Ave Middle Harbor Chemoil Marine Southbound PM Pier F Ave Chemoil Marine Harbor Plaza Southbound PM Pier F Ave Harbor Plaza End of Pier F Southbound PM Harbor Plaza Pier F Ave Pier G Ave Westbound PM Harbor Plaza Pier G Ave Queens Way Bridge Westbound PM Harbor Plaza Pier G Ave Queens Way Bridge Westbound PM Harbor Plaza Harbor Plaza Harbor Plaza Northbound PM Harbor Plaza Harbor Plaza Harbor Plaza Northbound PM Harbor Plaza Harbor Plaza Harbor Scenic Dr Westbound PM Harbor Plaza Harbor Plaza Harbor Scenic Dr Westbound PM Harbor Plaza Harbor Scenic Dr Harbor Scenic Dr Ramp Southbound PM Harbor Plaza Harbor Scenic Dr Ramp Queensway Dr Southbound PM Pier J Way Pier J Pier J Ave Westbound PM Pier J Way Pier J Ave Dr Westbound PM Pier J Ave Pier J Way Harbor Scenic Dr Southbound PM Harbor Scenic Way Pacific Container Term Harbor Scenic Dr Westbound PM Harbor Scenic Way Pacific Container Term Harbor Scenic Dr Westbound PM Harbor Scenic Dr Harbor Scenic Way Pier J Ave Southbound PM Harbor Scenic Dr Harbor Scenic Way Pier J Ave Southbound PM Harbor Scenic Dr Pier J Ave Connector Southbound PM Harbor Scenic Dr Connector Harbor Plaza Southbound PM Harbor Scenic Dr Ramp Queens Way Bridge Westbound PM Harbor Scenic Dr Queens Way Bridge Connector Westbound PM Harbor Scenic Dr Connector Queens Way Dr Westbound PM Harbor Scenic Dr Queens Way Dr Connector Westbound PM Harbor Scenic Dr Connector I-710 On Ramp Westbound PM Pier D Ave n/o Pier D Entrance n/o Pier D Entrance Southbound PM Pier D Ave s/o Ocean Blvd s/o Ocean Blvd East Bound PM Pier D Ave Ocean Blvd undercrossing Ocean Blvd undercrossing Southbound PM Pier D St w/o Pico Ave w/o Pico Ave East Bound PM Pier C St w/o Pico Ave w/o Pico Ave Westbound PM Pier C St w/o Pico Ave w/o Pico Ave Westbound PM Seaside Blvd Ocean Blvd On Ramp Pier T Westbound PM Seaside Blvd Ocean Blvd On Ramp Pier T Westbound PM Pier T Ave s/o Seaside Blvd s/o Seaside Blvd Southbound PM Ocean Blvd Henry Ford SR-47 Westbound Starcrest Consulting Group, LLC page 47 of 50 March 2004
321 Table C-5 On-Road Travel Model and Emission Estimates POLB Baseline EI Period Roadway Segment PM Pier E St PM Pier G Ave PM Pier F Ave PM Pier F Ave PM Pier F Ave PM Pier F Ave PM Pier F Ave PM Pier F Ave PM Pier F Ave PM Harbor Plaza PM Harbor Plaza PM Harbor Plaza PM Harbor Plaza PM Harbor Plaza PM Harbor Plaza PM Harbor Plaza PM Harbor Plaza PM Harbor Plaza PM Pier J Way PM Pier J Way PM Pier J Ave PM Harbor Scenic Way PM Harbor Scenic Way PM Harbor Scenic Dr PM Harbor Scenic Dr PM Harbor Scenic Dr PM Harbor Scenic Dr PM Harbor Scenic Dr PM Harbor Scenic Dr PM Harbor Scenic Dr PM Harbor Scenic Dr PM Harbor Scenic Dr PM Pier D Ave PM Pier D Ave PM Pier D Ave PM Pier D St PM Pier C St PM Pier C St PM Seaside Blvd PM Seaside Blvd PM Pier T Ave PM Ocean Blvd TOG_E F CO_EF NOX_E F SO2_E F PM10_E F TOG_LB S CO_LB S NOX_LB S SO2_LB S PM10_LB S PM25_LB S Starcrest Consulting Group, LLC page 48 of 50 March 2004
322 Table C-5 On-Road Travel Model and Emission Estimates POLB Baseline EI Period Roadway Segment From To Direction Bobtails Chassis Containers Total Trucks Distance VMT Speed Speed Bin PM Ocean Blvd SR-47 Seaside Blvd OnRamp Westbound PM Ocean Blvd WB Ramp e/o Ocean Blvd Ocean Blvd East Bound PM Ocean Blvd Seaside Off ramp Seaside On Ramp East Bound PM Ocean Blvd Ocean Blvd w/o Seaside Off Ramp East Bound PM Ocean Blvd Seaside Blvd OnRamp I-710 Offramp Westbound PM Ocean Blvd Seaside Blvd OnRamp I-710 Offramp Westbound PM Ocean Blvd Seaside Blvd OnRamp I-710 Offramp Westbound PM Pier E St On/Off Ramp Pico Ave Ocean Blvd Westbound PM Pier E St On/Off Ramp Pico Ave Ocean Blvd East Bound PM Broadway e/o Pico Ave e/o Pico Ave Westbound PM Broadway w/o Pico Ave w/o Pico Ave East Bound PM Santa Fe 9th St Anaheim St Southbound PM Santa Fe n/o Anaheim St s/o Willow St Southbound PM Canal 9th St Anaheim St Southbound PM Caspian 9th St Anaheim St Southbound PM Harbor Ave 9th St Anaheim St Southbound Totals , Starcrest Consulting Group, LLC page 49 of 50 March 2004
323 Table C-5 On-Road Travel Model and Emission Estimates POLB Baseline EI Period Roadway Segment TOG_E F CO_EF NOX_E F SO2_E F PM10_E F TOG_LB S CO_LB S NOX_LB S SO2_LB S PM10_LB S PM25_LB S PM Ocean Blvd PM Ocean Blvd WB Ramp PM Ocean Blvd PM Ocean Blvd PM Ocean Blvd PM Ocean Blvd PM Ocean Blvd PM Pier E St On/Off Ramp PM Pier E St On/Off Ramp PM Broadway PM Broadway PM Santa Fe PM Santa Fe PM Canal PM Caspian PM Harbor Ave Totals , Starcrest Consulting Group, LLC page 50 of 50 March 2004
324 (This page intentionally left blank)
325 Table C.6 below summarizes the on-terminal HDV activity for each POLB facility in 2002 based on interviews with the facility operators. When data was not provided, a value based on the average for that parameter was inserted and it is highlighted on the table. Table C.7 summarizes on-terminal idling time and emissions per terminal. This table does not include time or emissions from container terminal entry gate idling, which have been estimated separately and are included in Table C.8. Table C-9 summarizes on-terminal driving emissions by terminal. A speed of 5 mph has been assumed for the on-terminal driving. Although speed limits are typically higher (e.g., 10 mph in many cases) it is thought that terminal congestion may result in lower average speeds. It should be noted that the 5 mph EMFAC emission factors are higher than the 10 mph emission factors so if the average speed has been underestimated, the emissions have been somewhat overestimated. EMFAC emission factors for the HDV fleet are presented in Table 4.2 in the EI report. Table C.10 summarizes the HDV emissions by adding the emissions from on-terminal idling (Table C.7), container terminal gate idling (Table C.8) and on-terminal running (Table C.9). Each row represents a POLB facility in Tables C.6 through C.10. Starcrest Consulting Group, LLC C-115 March 2004
326 Table C.6 POLB On-Terminal Activity Summary Idling Terminal hours Idling Avg. On-terminal On-terminal Total Total Total Annual Gate In Loading/ Gate Out Speed Distance Driving Idling Idling (hours) Idling (hours) Miles Trips (hours) Unloading (hours) (mph) (miles) (hours) (hours) (one trip) (all trips) Traveled 308, * , , , * , , , * , , , * ,623 71, , * , , , * ,154 59, , * , , , * , ,681 13, ,393 50, ,525 20,020 18, ,860 5,760 26, ,333 13,000 8, ,365 4,420 13, , ,736 3,120 5, ,380 7,800 21, ,525 4,099 40, ,152 5, ,300 27, ,664 6,843 31, ,622 3,146 6, , ,053 1,612 13, ,083 1,300 29, ,551 2,912 1, ,554,787 1,835,914 * Emissions estimated separately for the container terminals using model-derived delay factors. 1,944,139 Data not provided - average values used. All other terminal activity data provided by terminal/facility operators through interviews. Starcrest Consulting Group, LLC C-115 March 2004
327 Table C.7 POLB On-Terminal Idling Emissions Total Hours Idling NOx TOG CO PM 10 PM 2.5 DPM SO 2 (all trips) (tpy) (tpy) (tpy) (tpy) (tpy) (tpy) (tpy) 277, , , , , , , , , , , , , , , , , , , , , ,835, Emission Factors (g/hour): NOx TOG CO PM 10 PM 2.5 DPM SO Starcrest Consulting Group, LLC C-116 March 2004
328 Table C.8 POLB Container Terminal Gate Idling Average Total Emissions, tpy Annual Delay/Call Delay/Year NOx TOG CO PM 10 PM 2.5 DPM SO 2 Trips Minutes Hours 308, , , , , , , , , , , , , , , , Emissions, tpy Emissions, tpd (365 days/year basis) Emission Factors (g/hour): NOx TOG CO PM 10 PM 2.5 DPM SO Starcrest Consulting Group, LLC C-117 March 2004
329 Table C.9 POLB On-Terminal Driving Emissions Total Miles NOx TOG CO PM 10 PM 2.5 DPM SO 2 Traveled (tpy) (tpy) (tpy) (tpy) (tpy) (tpy) (tpy) 154, , , , , , , , , , , , , , , , , , , , , , , , ,944, Emission Factors (g/mile): NOx TOG CO PM 10 PM 2.5 DPM SO Starcrest Consulting Group, LLC C-118 March 2004
330 Table C.10 POLB On-Terminal Emission Summary NOx TOG CO PM 10 PM 2.5 DPM SO 2 (tpy) (tpy) (tpy) (tpy) (tpy) (tpy) (tpy) Starcrest Consulting Group, LLC C-119 March 2004
331 ATTACHMENT C-1 Excerpt from POLB/POLA Transportation Study Technical Report (Meyer, Mohaddes, Inc )
332 (This page intentionally left blank)
333 POLB/POLA Transportation Study Technical Report 3.0 MARINE TERMINAL TRIP GENERATION The assessment of future operating conditions in and near the Ports was accomplished by first estimating future trip generation for all marine terminals and other land uses in the Ports as well as throughout the region. The trip generation estimates for the years 2010 and 2020 for the region were derived from data within the SCAG regional travel demand model. Trip generation for port land uses was estimated based on a comprehensive empirical data collection effort undertaken for the POLB/POLA Transportation Study. This section describes the data collection, analysis and results of the marine terminal trip generation analysis. In developing container terminal trip generation rates, it was first necessary to accurately and comprehensively analyze intermodal logistics, as described below. 3.1 Intermodal Logistics Research and Overview The development of the container terminal trip generation model entailed extensive research and data collection related to all facets and entities of the intermodal supply chain (e.g., steamship lines, terminal operators, cargo consolidators, trucking companies, warehouse/distribution facility operators, etc.). The following key issues related to intermodal logistics were addressed in the POLB/POLA Transportation Study: container drayage (who controls the move, timing/peaking, & gate hours) intermodal mode split (on-dock, off-dock rail, & transloading) empty container logistics Container Drayage. One of the greatest challenges in developing a trip generation model for a container terminal is defining how the container movements are controlled. For those containers that are not moved via on-dock rail, there are two aspects of control: the choice of draymen (who will move the container), and the choice of timing (when the container will be picked up or delivered). Import containers moved locally or regionally by truck are usually controlled by the customer (shipper, consignee, or third party), who chooses the drayman and the timing. Import containers that are drayed to off-dock railyards are usually controlled by the ocean carriers, who choose the drayman and the timing for those moves. Export containers from local shippers are picked up by the house drayman according to the customer s preferences. Intermodal (mini-landbridge - MLB) export and westbound empty containers are picked up at the rail ramp by the ocean carrier s house drayman. Timing and Peaking. Daily, weekly, and monthly peaking of truck arrivals at marine terminal gates is traceable to customer preferences, vessel and train schedules, and the limited windows for full terminal operation. The following briefly describes some of the movements of containers throughout a typical week and day, and the factors affecting the movements: Local Imports: Customers prefer to receive goods early in the morning, early in the week, and early in the month. Customers in a hurry want their goods as soon as possible after the vessel arrives, with pre-clearance from U.S. Customs, creating a second reason for peaking. At the other extreme, some customers are not ready for their goods and use terminal time allowances for free storage. Local Exports: Customers prefer to ship goods late in the day, late in the week, and late in the month. Meyer, Mohaddes Associates, Inc. 1
334 POLB/POLA Transportation Study Technical Report Intermodal (mini-landbridge) Imports/Exports: Customer desire to receive import goods quickly, coupled with the popularity of pre-clearance by U.S. Customs, has created a demand for inbound loaded boxes as soon as possible after vessel arrival. Dedicated eastbound double-stack train departures are also keyed to vessel arrivals, and some rail-bound containers are stowed to be the first off. Outbound export boxes typically trickle in for most of the week, then peak just before vessel departure. Rail exports come in larger batches on the same double-stack cars that must later be used for eastbound imports, so the MLB export and empty boxes typically arrive before the vessel. Terminal Gate Hours. Terminal operations affect the movement of containers throughout the day. Most Long Beach and Los Angeles marine terminals open at 7 a.m. and close at 6 p.m. Terminals terminate inbound processing prior to this closure time. During peak months (May - November), some terminals are open extended hours for several days a week. These extended hours consist of a second night shift (6 p.m. 10 p.m.) and a hoot shift (3 a.m.- 8 a.m.). Extended hours are rather variable throughout the year, and are not uniform for all terminals. The primary reasons for limited extended gate hours are limited customer demand coupled with high terminal operating costs. Most (about 80%) of the shippers do not operate extended hours, and thus are not able to receive/deliver containers after normal business hours. The stringent work rules make it uneconomical for stevedores to offer full terminal functions when only a few containers are handled. Figure 2 below illustrates how terminal operations create windows of opportunity for drayage movements temporally. EARLIER 6AM 7AM 8AM 9AM 10AM 11AM NOON 1PM 2PM 3PM 4PM 5PM 6PM 7PM LATER Traffic Limitations Commute Traffic Peak Commute Traffic Peak Terminal Limitations Partial Port & Terminal Functions 15+ Min Coffee Break 1+ Hour Lunch Break 15+ Min Coffee Break Partial Port & Terminal Functions Full-Function Windows 8AM to 10AM 10:30AM to NOON 1PM to 3PM 3:30PM to 5PM Intermodal Mode Split (On-Dock Rail, Off-Dock Rail & Transloading) The intermodal mode split (intermodal defined as ship-to-rail movements rather than ship to truck for local delivery) for containerized cargo moving through the San Pedro Ports is estimated to be about 45%- 50%, based upon extensive analysis of the Journal of Commerce PIERS data. Based upon recent data collected from the terminal operators, steamship lines, and railroads, it estimated that about 35%-40% of all containers that move through the Ports are transported by rail to inland destinations via on-dock and off-dock railyards. The difference between the total intermodal cargo mode split of 50%, and the amount of containers moved via on-dock and off-dock railyards is comprised of transloaded cargo, which is described in detail below. Transloaded Intermodal Cargo. Transloading is the practice of transferring goods from marine containers to domestic intermodal containers or trucks at a distribution center or warehouse. In transloading, the goods are sometimes transferred immediately (which is referred to as cross-docking), or after the goods are handled/stored for short period of time in the warehouse to accommodate value-added services (e.g., bar codes or labels/stickers are added; hangers added to apparel; mixing of products to make loads for specific retail stores; etc.). Many of the large shippers of intermodal cargo (such as Wal-Mart and Target) transload cargo from steamship line containers to domestic containers to then be transported via rail (or long-haul truck) to inland destinations. Transloading diminishes the maximum potential amount of ondock rail use. As such, transloading was evaluated and accounted for in the on-dock rail mode split, and accordingly the trip generation methodology. Meyer, Mohaddes Associates, Inc. 2
335 POLB/POLA Transportation Study Technical Report While transloading is still apparently a small part of the total volume, it is increasing quickly at present and will likely play a significant role in port-area logistics for the foreseeable future. Transloading is increasing for the following reasons, some of which stem from customer preferences and some of which are motivated by carriers: Some large importers (e.g. major retail chains) have increased transloading to postpone logistics decisions until later in the supply pipeline. A decade ago, importers were reducing Southern California transloading in favor of consolidating mixed loads of merchandise in Asia for direct delivery to inland distribution centers. As souring has spread to more and more Asian and Southeast Asian countries, however, the feasibility of building consolidated loads in a central location has diminished at the same time Asian labor costs are rising. Perhaps more importantly, importers are now pursuing postponement strategies: by waiting longer to decide on a mix of merchandise types and volumes for each distribution center, they can use more recent demand information and reduce subsequent rework. Transloading in Southern California instead of in Asia allows importers to postpone the quantity and mix decision by at least two weeks, which can be critical for seasonal or trendy merchandise. Ocean carriers are seeking faster turns from their container fleets to satisfy eastbound capacity demands. Especially in the peak season, ocean carriers are under great pressure to supply empty containers to Asian customers. Moreover, a container earns its owner much more revenue by making another transpacific trip than by taking the same time to move across North America by rail and truck. Thus, carriers are encouraging transloading, whether openly, quietly, or through a logistics sister company. Some ocean carriers are de-emphasizing mini-landbridge operations in favor of portto-port carriage. Some of the new entrants in the transpacific trade lack inland presence or infrastructure. New entrants have added 5%-15% to transpacific vessel capacity. The new entrants are more likely to encourage transloading rather than take responsibility for inland delivery or see their containers disappear inland under customer control. $ The market share of the Non-Vessel Owning Common Carriers (NVOCCs) has increased. It is estimated that NVOCCs control roughly 37% of inbound West Coast traffic. Large portions of NVOCC intermodal volumes are less-than-container-loads (LCL), which are de-consolidated (i.e., transloaded) on the West Coast. Also, large shares of the containers moved by the new Transpacific trade steamship lines are LCLs for NVOCCs. The exact extent of transloading is difficult to estimate, since the activity is fragmented, no one collects consolidated data, and many participants regard their business volume as proprietary. It has been estimated that transloading on the West Coast may have reached 500,000 twenty-foot equivalent units (TEU) in On-Dock Rail. Several factors affect on-dock rail use, such as: shipper and steamship line logistics (e.g. transloading, transportation costs, etc.), railroad operations (equipment availability, train schedules, and steamship line contracts/arrangements), on-dock and off-dock railyard capacity, and marine terminal operations. The following briefly describes these various factors: $ Intermodal Logistics: On-dock rail operations are largely limited to dedicated trains or large blocks of traffic. Many intermodal (rail-bound) containers continue to be drayed to off-dock railyards. Each on-dock terminal has one or two major tenants who generate dedicated trains to Meyer, Mohaddes Associates, Inc. 3
336 POLB/POLA Transportation Study Technical Report Chicago or other major destinations. Intermodal containers for other tenants, even alliance partners, rarely make up sufficient volumes for dedicated trains, so these containers are almost always drayed. Containers that are bound for minor destinations, and overflow or late containers for major destinations are also drayed. However, it is expected that long-term growth in minilandbridge (MLB) volumes may bring the volumes of smaller carriers closer to trainload equivalents and encourage more on-dock use. $ Railroad Operations: Railroads incur additional operating costs to serve on-dock terminals compared to their own ramps. The elimination of intermodal lift costs offsets this added operating cost in principle, but railroad operating budgets may not reflect the savings. Moreover, serving on-dock terminals places a tangible management burden on local officials, complicating the operations for which they are responsible in an era when downsizing has left them with fewer personnel. It is also difficult for stevedores to block containers for multiple destinations according to railroad loading preferences. Accordingly, the two Class I railroads serving the San Pedro Ports, the Union Pacific (UP) Railroad and the Burlington Northern Santa Fe (BNSF) Railroad, prefer to handle only the largest trains on-dock, so that the train can move basically intact and not require further work at inland yards. $ On-Dock/Off-Dock Railyard Capacity: The on-dock terminals at Long Beach and Los Angeles vary considerably in their capacity, efficiency, and ease of operation. Moreover, the numerous on-dock terminals are not presently operated as a system; i.e., terminals do not share each other s railyards. As intermodal volumes significantly increase over the next 20 years, and as roadway congestion worsens and impacts drayage, on-dock use will also increase. To accommodate this demand, the Ports will be expanding their railyards and it is speculated that terminals might share the use of their railyards to optimize capacity throughout the entire Ports complex. The new and expanded railyards, in concert with the Alameda Corridor that will be completed in 2002, will facilitate increased on-dock rail use. Off-dock railyard capacity also affects on-dock use: insufficient capacity at off-dock railyards could result in shifts to on-dock railyards. Determining maximum potential capacity is important in estimating future on-dock rail mode use, which is a critical factor in the trip generation model discussed in the next section. The potential capacity of on-dock yards is compared to current on-dock use to then estimate future on-dock use. The capacity analysis of on-dock railyards is discussed later. Marine Terminal Operations: Many of the ocean carriers are not providing incentives for on-dock usage. The available information suggests that the handling charges incurred at on-dock facilities are roughly equal to the costs of drayage to off-dock railyards. Stevedores do not want to divert labor from vessel handing to rail car loading, and do not want to add labor to operate the on-dock terminal while a vessel is in port. Moreover, as discussed previously, some ocean carriers are de-emphasizing inland intermodal movements in favor of port-to-port carriage. Empty Container Logistics. - Empty container logistics is complex and variable, and thus poses challenges in developing a trip generation methodology. The Transpacific trade imbalance, which has significantly increased empty container volumes, compounds the difficulty in developing a methodology for modeling empty container flows and truck trips. The following discusses some of the specific issues associated with empty container flows, and the factors that were included in the modeling: Re-positioning of Intermodal Westbound Empty Containers - The logistics of re-positioning intermodal empty containers (westbound empty containers from inland destinations via rail) through the Ports of Long Beach/Los Angeles as a result of the trade imbalance has varied significantly over Meyer, Mohaddes Associates, Inc. 4
337 POLB/POLA Transportation Study Technical Report the last five years. Not all of the trade imbalance generated empty containers are returned to their originating Ports, as some of the empty containers are returned through other west coast Ports or remain inland indefinitely. The loss of empty containers is sometimes referred to as empty leakage (there is also leakage of local empty containers). Street Turns - Street turns are defined as the interchange of local (for local market use) empty containers between importers and exporters outside the marine terminals. Import local containers are taken by trucking company drivers to the consignee and, when unloaded, the same trucking company returns most of the empty containers to the terminal/steamship line. The same or different trucking company picks up empty containers from the terminal/steamship line and delivers the empty container to the exporter for loading, to then be returned to the Port. Some of the empty import containers are not returned directly to the Port, but are subsequently used by exporters (i.e., street turns), thus reducing the number of empty container trips to the Ports. The opportunities for these street turns under current institutional constraints are very limited, but was nonetheless accounted for in the trip generation methodology. The following summarizes some of the key institutional constraints and impediments for street turns: The emptied import container must be suitable for the export load (right size, right type, right condition, right ownership/control). The drayman must be able to identify the opportunity to move the empty container for reuse by an exporter (with less effort than the round trip to the port), and communicate the opportunity to the driver. The drayman s interchange agreement with the ocean carrier must allow for such reuse. The savings from the street turn must significantly exceed any additional per diem on the container. The ocean carrier must be able to track and document the interchange between parties. The container/chassis combination must be acceptable at the terminal used by the export vessel. Ocean carriers want their empty containers back as soon as possible to satisfy the needs of Asian shippers for eastbound shipments. They prefer local billing, delegate store-door moves to the customer s house draymen, and do not want to become involved in drayage issues. Current westbound export rates are so low that there is little incentive to wait for an export load or make special arrangements. Under then Ocean Shipping Reform Act (OSRA) of 1998, service contracts can specify different free time and per diem rules for different customers, complicating the task of matching up container availability and opportunity. Drayage firms have taken the lead in finding ways to street turn containers since they have the most to gain. There is no straightforward, consistent way for drayage firms to interchange containers among themselves, so the few street turns that occur are usually confined to customers served by the same drayage firm. The following summarizes some key issues associated with current practices: Meyer, Mohaddes Associates, Inc. 5
338 POLB/POLA Transportation Study Technical Report Some drayage firms hoard empty containers from selected ocean carriers at the beginning of the week since they know specific customers will likely need them for export loads at the end of the week. This strategy requires careful tracking of free time to insure that per diem costs do not exceed the advantages of the street turn (or that the exporter wants the container badly enough to absorb per diem). Meyer, Mohaddes Associates, Inc. 6
339 POLB/POLA Transportation Study Technical Report Some customers take possession of the container through a paper interchange at their dock so they can reuse the box for an export load without having the drayman return it to the port. A few drayage firms have taken advantage of alliance policies for interchanging containers among partners to widen the opportunities for street turns. There is very limited interchange of containers between drayage firms, usually limited to specific customer combinations with trusted, reputable competitors. The Gateway Cities Council of Governments (COG), with assistance from the Port, is currently conducting a study to examine the feasibility and effect of applying an Internet-based dispatching system to facilitate and manage street turns directly (i.e., a virtual empty container yard), or indirectly via an empty container depot. Such a depot could serve all terminals/steamship lines, and would enable the temporary storage and transfer of containers. It is envisioned that a depot(s) would be located at centers of warehousing, distribution, manufacturing, importing, and exporting activities within the Los Angeles Basin, with easy access to a freeway or major arterial. An Internet system, called emodal, is actually currently in operation in the Ports area. Most Port of Long Beach and Los Angeles container terminals and numerous harbor trucking companies are currently using the system. emodal provides a Web site wherein trucking companies can access information about containers at a single-source site. The system provides multiple fields of information for full and empty containers transiting through the Ports. The system provides a useful tool for the trucking companies to track information about containers to be picked-up or delivered as well as provides for more efficient operations at the terminal gates. emodal is constantly being enhanced and expanded. An appointment system for container pickup is currently being developed, which would enable trucking companies/drivers to alter their schedules to avoid terminal congestion and queues. The container terminal trip generation methodology accounts for variability in street turns and peak hour volumes, to reflect improved truck dispatching through the use of an Internet system. 3.2 Container Terminal Trip Generation Several alternative approaches to developing trip generation estimates for marine container terminals were examined in the POLB/POLA Transportation Study. These included development of single and multiple variable regression equations and trip rates for predicting truck trips. Alternatively, a modelbased approach was considered and developed. After carefully examining potential trip generation equations to predict truck trips, it was determined that the equations could not adequately explain the terminal characteristics today or into the future. Therefore, a more flexible and comprehensive spreadsheet model was developed to forecast future container terminal truck trips. The methodology used to develop the truck model, called Quicktrip is described in more detail below. Terminal Operator Interviews / Surveys Interviews with marine terminal operators were conducted both at container terminals as well as at other types of terminals. Surveys were completed via in-person interviews. This ensured that the most accurate and complete information was obtained. The blank survey forms are included in the appendix to this report. As part of the marine terminal interview/survey process, the team also obtained marine terminal gate movement historical databases. These data provided a significant amount of information to develop statistical relationships for the truck movements. Meyer, Mohaddes Associates, Inc. 7
340 POLB/POLA Transportation Study Technical Report Traffic Data Collection at Marine Terminals (24-hour Machine Counts and Manual Counts The following types of traffic data were collected as part of this effort: Terminal Gate Counts Terminal Gate traffic counts were conducted at each marine container terminal gate between the hours of 7 to 9 AM and 1 to 4 PM. The gate counts included recording each vehicle, by type that passed through the gate, in 15-minute increments of time. Inbound versus outbound movements were noted. At the Port of Long Beach, the counts were collected on Monday, Tuesday and Wednesday, August 2, 3 and 4, At the Port of Los Angeles, the counts were collected on October 3 and 4, These time periods represent typical peak flow at the marine terminal gates. The highest day data of each count period were used for the existing conditions analysis and validation of the "Quicktrip" trip generation model. Exhibit 4 illustrates the location of the terminal gate counts and other counts taken for non-container terminal trip generation estimation. Historical Terminal Gate Data Detailed container terminal historical gate data was obtained from each marine container terminal for the month that the gate counts were taken (August in Long Beach and October in Los Angeles). That data varied by terminal, but generally included gate movements inbound and outbound by day (or by hour for some terminals), and by truck type (chassis, container, loads). This data was used to validate the Quicktrip model against monthly, weekly and daily gate flows. Develop Marine Terminal Trip Generation Two separate trip generation methodologies were considered and researched as the project proceeded, They included the following: Regression Analysis The truck trip generation methodology first entailed the development of traditional trip rates and regression equations. Single and multiple variable regression equations were developed for each container terminals for the AM and PM peak hours. Regression analysis was performed for individual terminals on different days and also across all terminals. Several different independent variables were examined. The observed truck trip rates were compared to a number of independent variables including: terminal size (acres), terminal storage area (acres), percent empty boxes (ratio of empty containers across the wharf to total container movements) and percent dual truck moves. Although the regression analysis in some cases resulted in a relatively high Coefficient of Determination (r 2 ), in many cases the relationship between the dependent and independent variable proved to be weak. Sample results including some with low r 2 (weak relationships) and higher r 2 (stronger relationships) follow: truck trips per TEU compared to percent empty containers: r 2 = 0.17 truck trips per container compared to percent empty containers: r 2 = 0.57 truck trips compared to terminal area: r 2 = 0.59 for the AM peak, r 2 = 0.73 for the PM peak truck trips compared to terminal storage area: r 2 = 0.57 for the AM peak, r 2 = 0.64 for the PM Although certain independent variables were found to have a reasonable relationship to the dependent variable (e.g., container terminal size to truck trips), by themselves they could not adequately explain or predict future trip making. For example, there will be changes to terminal operations in the future, so the Meyer, Mohaddes Associates, Inc. 8
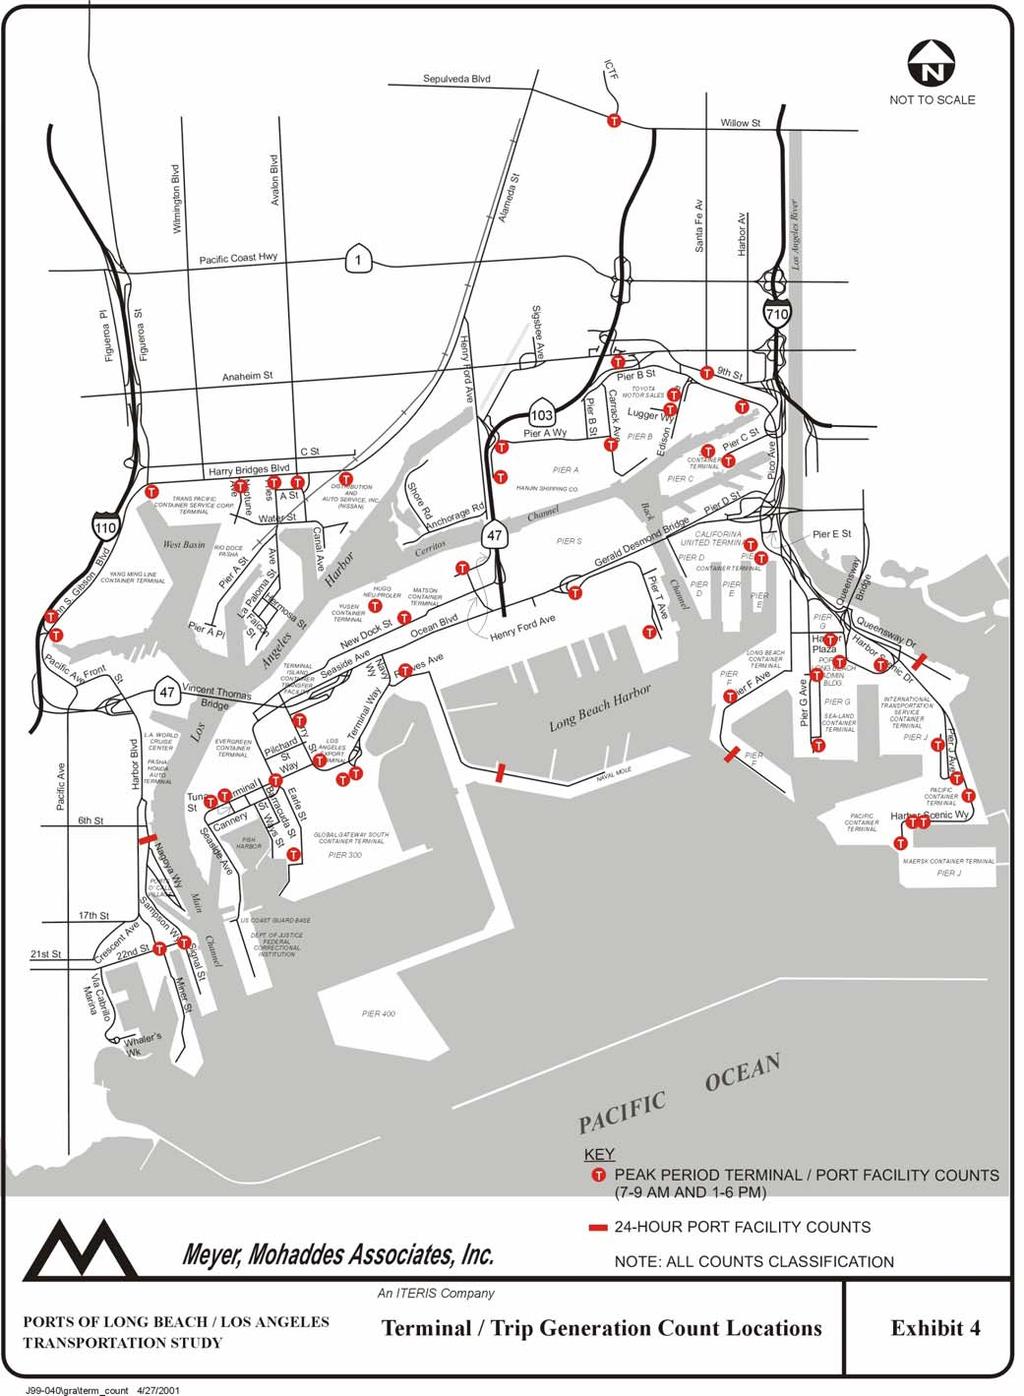
341 9
342 POLB/POLA Transportation Study Technical Report use of terminal size to predict trip generation based on a simple rate would be misleading. Standard transportation planning practice involves the use of independent variable such as building size, number of employees or land area of developments such as shopping centers or office buildings. This is not feasible in ports since terminals vary widely in terms of operational characteristics. Moreover, there is a very limited sample size from which to establish the statistical relationships. Finally, it was determined that equations, even if developed for existing conditions, could not readily be revised or adjusted to reflect future changes to terminal operating parameters that are likely to occur. For these reasons, the use of regression equations to predict future terminal trip generation was rejected as a valid methodology, and a spreadsheet model was selected as the approach. Terminal Truck Generation Throughput Model The second method pursued by the TAC was the development of a terminal trip generation model based upon an existing terminal operation/throughput model. Consultant team member Moffat & Nichol Engineers previously developed the base terminal throughput model. It was used as the basis for developing the specialized terminal trip generation model. The new model, called Quicktrip was developed and validated compared to gate transaction data and gate counts that were taken for this project. A more detailed description of the Quicktrip model is provided in the appendix to this document. Exhibit 5 illustrates the Quicktrip model process. The Quicktrip model was run and tested against the gate data (gate counts and historical gate data from the terminals). Detailed data on existing operations parameters were collected for each terminal, as summarized in Table 6. These data (TEU per container ratio, monthly TEU throughput, mode split, hours of operation, dual move percentage, worker shift splits and peaking factors) were input into Quicktrip for each terminal. The results of the validation exercise indicate that the Quicktrip model is able to estimate truck movements by day and peak hour within 2 to 10 percent of actual counts for all terminals combined (both directions combined), depending on which peak hour is modeled. For individual terminals, the validation ranges from 0 percent to 46 percent. At a majority of the terminals the model is able to predict peak hour truck trip generation within 15 percent or better for each peak hour. A few terminals could not be validated more closely due to unusual operating patterns that cannot be replicated by the model. This includes terminals which experience a high number of interterminal trips due to common ownership, and terminals which operate differently than other marine container terminals due to unique business patterns (note in the future all terminals are assumed to operate with similar patterns to one another). Table 7 displays the validation results for the Quicktrip model against driveway counts for each terminal. More detailed validation results are included in the appendix including validation by month, week and type of truck (bobtail, chassis and container). These are considered to be excellent validation results overall, considering the variability of operating conditions and the variability in gate counts on any given day. Count data can vary by ten percent or more based on the particular terminal operating conditions on the day the survey was conducted, so validation within 15 percent at most terminals and 5 to 10 percent overall is very accurate. The truck trip generation model was used to develop year 2010, and 2020 container terminal truck trip volumes for various terminal operations scenarios. These scenarios were defined by changing operating parameters as follows: increased weekend activity; expanded terminal operating hours (more second shift and hoot shift activity); increased on-dock rail use; increased street turns as a result of the use of emodal; altered arrival/departure curves as a result of more efficient truck dispatching using emodal; or altered empty leakage. Also for future conditions, trip generation for the average day within the peak month was used, which is considered more appropriate for traffic forecasting and developing roadway improvements. Meyer, Mohaddes Associates, Inc. 10
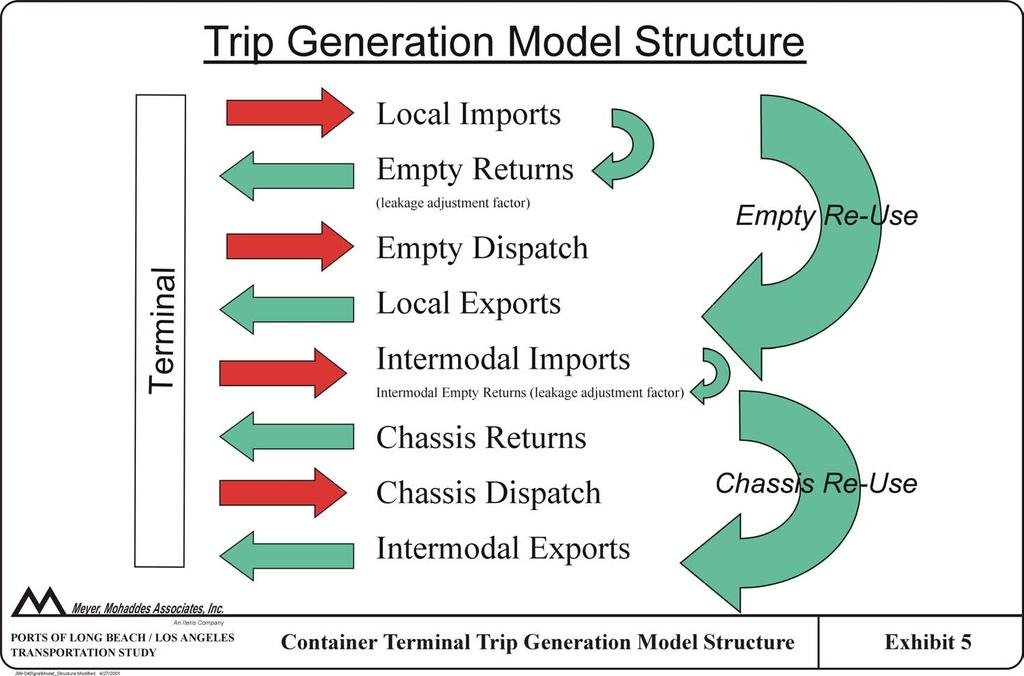
343 11
2012 Air Emissions Inventory
 SECTION 6 HEAVY-DUTY VEHICLES This section presents emissions estimates for the heavy-duty vehicles (HDV) source category, including source description (6.1), geographical delineation (6.2), data and information
Figure 4.1 presents the distribution of the 1,343 pieces of equipment inventoried at the Port for 2006.
 SECTION 4 CARGO HANDLING EQUIPMENT This section presents emissions estimates for the cargo handling equipment source category, including source description (4.1), geographical delineation (4.2), data and
Figure 4.1 presents the distribution of the 1,457 pieces of equipment inventoried at the Port for 2007.
 SECTION 4 CARGO HANDLING EQUIPMENT This section presents emissions estimates for the cargo handling equipment source category, including source description (4.1), geographical delineation (4.2), data and
SAN PEDRO BAY PORTS YARD TRACTOR LOAD FACTOR STUDY Addendum
 SAN PEDRO BAY PORTS YARD TRACTOR LOAD FACTOR STUDY Addendum December 2008 Prepared by: Starcrest Consulting Group, LLC P.O. Box 434 Poulsbo, WA 98370 TABLE OF CONTENTS 1.0 EXECUTIVE SUMMARY...2 1.1 Background...2
2013 Air Emissions Inventory
 SECTION 4 CARGO HANDLING EQUIPMENT This section presents the following information for the CHE source category: source description (4.1), geographical domain (4.2), data and information acquisition (4.3),
SECTION 6 HEAVY-DUTY VEHICLES
 SECTION 6 HEAVY-DUTY VEHICLES This section presents emissions estimates for the heavy-duty vehicles source category, including source description (6.1), geographical delineation (6.2), data and information
SECTION 5 RAILROAD LOCOMOTIVES
 SECTION 5 RAILROAD LOCOMOTIVES This section present emissions estimates for railroad locomotives source category, including source description (5.1), geographical delineation (5.2), data and information
2012 Air Emissions Inventory
 SECTION 5 RAILROAD LOCOMOTIVES This section presents emissions estimates for the railroad locomotives source category, including source description (5.1), geographical delineation (5.2), data and information
To develop emission estimates, truck activities have been evaluated as having three components:
 SECTION 6 HEAVY-DUTY DIESEL-FUELED VEHICLES This section provides estimates of the emissions from heavy-duty vehicles (HDVs) that transport Port-related cargo. The section also describes the operations
SECTION 5 RAILROAD LOCOMOTIVES
 SECTION 5 RAILROAD LOCOMOTIVES This section discusses the rail systems that operate in and around the Port, including the types of activities performed, the equipment used, and the methods of estimating
2013 Air Emissions Inventory
 SECTION 1 INTRODUCTION The Port of Long Beach (the Port or POLB) shares San Pedro Bay with the neighboring Port of Los Angeles (POLA). Together, the two ports comprise a significant regional and national
2008 Air Emissions Inventory SECTION 6 HEAVY-DUTY VEHICLES
 SECTION 6 HEAVY-DUTY VEHICLES This section presents emissions estimates for the heavy-duty vehicles source category, including source description (6.1), geographical delineation (6.2), data and information
2010 Air Emissions Inventory
 SECTION 7 SUMMARY OF 2010 EMISSION RESULTS The emission results for the Port of Long Beach 2010 Air Emissions Inventory are presented in this section. Table 7.1 summarizes the 2010 total port-related emissions
Photo Credit: Tom Paiva/Pacific Harbor Line
 In 2011, Pacific Harbor Line (PHL) repowered 16 locomotives in their fleet with new low-emission Tier 3- plus engines that emit over 80 percent less diesel particulate matter and 38 percent less nitrogen
2012 Air Emissions Inventory
 SECTION 3 HARBOR CRAFT This section presents emissions estimates for the commercial harbor craft source category, including source description (3.1), geographical domain (3.2), data and information acquisition
THE PORT OF LONG BEACH
 ADDENDUM PORT OF LONG BEACH AIR EMISSIONS INVENTORY 2007 Prepared for: THE PORT OF LONG BEACH December 2009 Prepared by: Starcrest Consulting Group, LLC P.O. Box 434 Poulsbo, WA 98370 TABLE OF CONTENTS
2011 Air Emissions Inventory
 SECTION 3 HARBOR CRAFT This section presents emissions estimates for the commercial harbor craft source category, including source description (3.1), geographical delineation (3.2), data and information
Port of Long Beach. Diesel Emission Reduction Program
 Diesel Emission Reduction Program Competition Port of Long Beach, Planning Division July 16, 2004 Contact: Thomas Jelenić, Environmental Specialist 925 Harbor Plaza, Long Beach, CA 90802 (562) 590-4160
Technology Advancement Program. Presented by: Heather Tomley, Port of Long Beach Kevin Maggay, Port of Los Angeles
 Technology Advancement Program Presented by: Heather Tomley, Port of Long Beach Kevin Maggay, Port of Los Angeles Overview Key to the ports Clean Air Action Plan Goals and structure of the Technology Advancement
DIESEL PARTICULATE MATTER MITIGATION PLAN FOR THE BNSF RAILROAD SAN DIEGO RAIL YARD
 ENVIRON International Corporation Draft Report DIESEL PARTICULATE MATTER MITIGATION PLAN FOR THE BNSF RAILROAD SAN DIEGO RAIL YARD Prepared for BNSF Railway 2650 Lou Menk Drive Fort Worth, TX 76131-2830
2008 Air Emissions Inventory SECTION 3 HARBOR CRAFT
 SECTION 3 HARBOR CRAFT This section presents emissions estimates for the commercial harbor craft source category, including source description (3.1), data and information acquisition (3.2), operational
Port of Long Beach Air Emissions Inventory
 Port of Long Beach Air Emissions Inventory - 2013 Prepared for: July 2014 Prepared by: Starcrest Consulting Group, LLC Long Beach, CA TABLE OF CONTENTS EXECUTIVE SUMMARY... ES-1 SECTION 1 INTRODUCTION...
THE PORT OF LOS ANGELES OCCUPIES 4,300 ACRES OF LAND ALONG 43 MILES OF WATERFRONT. THE PORT OF LOS ANGELES IS THE LARGEST PORT IN THE
 THE PORT OF LOS ANGELES OCCUPIES 4,300 ACRES OF LAND ALONG 43 MILES OF WATERFRONT. THE PORT OF LOS ANGELES IS THE LARGEST PORT IN THE U.S. AND 13TH LARGEST WORLDWIDE. THE PORT OF LONG BEACH IS THE SECOND
For purposes of Section 10 the following definitions shall apply: Authorized Emergency Vehicle is as defined in Vehicle Code section 165.
 Tariff No. 4, Section 10 Clean Air Action Plan Item 1000 - Drayage Trucks - Definitions For purposes of Section 10 the following definitions shall apply: ARB means the California Air Resources Board. Authorized
REALIZING THE AIR QUALITY BENEFITS OF PORT INFRASTRUCTURE PROJECTS. A Case Study of the Alameda Corridor
 REALIZING THE AIR QUALITY BENEFITS OF PORT INFRASTRUCTURE PROJECTS A Case Study of the Alameda Corridor April 29, 25 Dr. Margaret Lobnitz, Weston Solutions, Inc. 1 BACKGROUND In mid-198 s, growing concern
THE PORT OF LONG BEACH
 PORT OF LONG BEACH AIR EMISSIONS INVENTORY 2006 Prepared for: THE PORT OF LONG BEACH Prepared by: STARCREST CONSULTING GROUP, LLC P.O. Box 434 Poulsbo, WA 98370 TABLE OF CONTENTS EXECUTIVE SUMMARY...
California s Emission Reduction Plan for Ports and International Goods Movement
 California s Emission Reduction Plan for Ports and International Goods Movement Alternative Maritime Power Conference Los Angeles Harbor Hotel April 24, 2006 California Environmental Protection Agency
2013 Air Emissions Inventory
 SECTION 5 RAILROAD LOCOMOTIVES This section presents emissions estimates for the railroad locomotives source category, including source description (5.1), geographical domain (5.2), data and information
Cover Photo Credit: The Port of Long Beach
 Cover Photo Credit: The Port of Long Beach The world s most advanced fireboat Protector arrived at the Port of Long Beach in November 2015. Protector is specifically designed to fight fires aboard the
Comprehensive Regional Goods Movement Plan and Implementation Strategy Goods Movement in the 2012 RTP/SCS
 Comprehensive Regional Goods Movement Plan and Implementation Strategy Goods Movement in the 2012 RTP/SCS Annie Nam Southern California Association of Governments September 24, 2012 The Goods Movement
IAPH Tool Box for Port Clean Air Programs
 ENGINE STANDARDS Background Ports around the world depend on the efficiency of the diesel engine to power port operations in each source category ocean/sea-going vessels, harbor craft, cargo handling equipment,
Port of Seattle: Where a Sustainable World is Headed Sarah Flagg Seaport Air Quality Program Manager Port of Seattle
 Port of Seattle: Where a Sustainable World is Headed Sarah Flagg Seaport Air Quality Program Manager Port of Seattle AAPA Port Operations, Safety & Information Technology Seminar Seminar 1 June 11, 2009
RAILYARDS SUPPORT A VARIETY OF OPERATIONS INCLUDING: LOCOMOTIVES, ON-ROAD AND OFF-ROAD TRUCKS, CARGO-HANDLING EQUIPMENT, TRANSPORTATION
 RAILYARDS SUPPORT A VARIETY OF OPERATIONS INCLUDING: LOCOMOTIVES, ON-ROAD AND OFF-ROAD TRUCKS, CARGO-HANDLING EQUIPMENT, TRANSPORTATION REFRIGERATION UNITS AND MAINTENANCE SHOPS. CHAPTER FIVE railyards
Yard Hostler Duty Cycle Summary Brad Rutledge Nov. 27, Introduction
 Yard Hostler Duty Cycle Summary Brad Rutledge Nov. 27, 2009 Introduction A yard hostler duty cycle has been developed as part of the Hybrid Yard Hostler Demonstration and Commercialization Project funded
Off-Road Large Spark-Ignition (LSI) Equipment Regulation Proposed Amendments Public Workshop
 Equipment Regulation Proposed Amendments Public Workshop") Off-Road Large Spark-Ignition (LSI) Equipment Regulation Proposed Amendments Public Workshop Date and Time June 8, 2015 10:00 am 12:00 pm PDT June 10, 2015 10:00 am 12:00 pm PDT Location Air Resources
Off-Road Large Spark-Ignition (LSI) Equipment Regulation Proposed Amendments Public Workshop Date and Time June 8, 2015 10:00 am 12:00 pm PDT June 10, 2015 10:00 am 12:00 pm PDT Location Air Resources
Port of Long Beach 2017 Air Emissions Inventory
 Port of Long Beach 2017 Air Emissions Inventory Prepared for: July 2018 Prepared by: Starcrest Consulting Group, LLC Long Beach, CA ACKNOWLEDGEMENTS The following individuals and their respective companies
Methods to Find the Cost-Effectiveness of Funding Air Quality Projects
 Methods to Find the Cost-Effectiveness of Funding Air Quality Projects For Evaluating Motor Vehicle Registration Fee Projects and Congestion Mitigation and Air Quality Improvement (CMAQ) Projects Emission
San Pedro Bay Ports. Port of Los Angeles 7.9 million TEUs Port of Long Beach 6.0 million TEUs. Total 13.9 million TEUs in 2011
 Port Background San Pedro Bay Ports Port of Los Angeles 7.9 million TEUs Port of Long Beach 6.0 million TEUs Total 13.9 million TEUs in 2011 San Pedro Bay Port Complex Emissions and the Clean Air Action
Port of Long Beach 2014 Air Emissions Inventory
 Port of Long Beach 2014 Air Emissions Inventory Prepared for: September 2015 Prepared by: Starcrest Consulting Group, LLC Long Beach, CA TABLE OF CONTENTS EXECUTIVE SUMMARY... ES-1 2014 Port of Long Beach
A Port Energy and Emission Inventory Model
 A Port Energy and Emission Inventory Model Green Tech 2012, Green Marine Annual Conference Quebec City: May 29, 30 Bryan McEwen, SNC-Lavalin Inc., Environment Division Vancouver, British Columbia, Canada
What does Sustainability mean?
 Christopher Cannon, Chief Sustainability Officer June 28, 2017 What does Sustainability mean? The ability to meet today s global economic, environmental and social needs without compromising the opportunity
Preliminary Cost Estimates for Select Clean Air Action Plan Strategies
 2017 Preliminary Cost Estimates for Select Clean Air Action Plan Strategies NOVEMBER 2017 PRELIMINARY COST ESTIMATES FOR SELECT 2017 CLEAN AIR ACTION PLAN STRATEGIES PORT OF LONG BEACH 4801 AIRPORT PLAZA
Christopher Cannon, Chief Sustainability Officer Port of Los Angeles AAPA Environmental Committee Meeting November 14/15, 2017
 Christopher Cannon, Chief Sustainability Officer Port of Los Angeles AAPA Environmental Committee Meeting November 14/15, 2017 Green Port Building Blocks Environmental responsibility and economic growth
DATE: MAY 3, 2007 ENVIRONMENTAL MANAGEMENT DIVISION
 DATE: MAY 3, 2007 FROM: ENVIRONMENTAL MANAGEMENT DIVISION SUMMARY: This Board item requests that the Board of Harbor Commissioners approve the allocation and expenditure, from funds previously disbursed
Port of Long Beach 2016 Air Emissions Inventory
 Port of Long Beach 2016 Air Emissions Inventory Prepared for: July 2017 Prepared by: Starcrest Consulting Group, LLC Long Beach, CA 2016 Updates to Data and Emissions Estimation Methodologies The current
4 COSTS AND OPERATIONS
 4 COSTS AND OPERATIONS 4.1 INTRODUCTION This chapter summarizes the estimated capital and operations and maintenance (O&M) costs for the Modal and High-Speed Train (HST) Alternatives evaluated in this
DRAFT April 9, STATE IMPLEMENTATION PLAN CREDIT FOR EMISSION REDUCTIONS GENERATED THROUGH INCENTIVE PROGRAMS (Adopted [adoption date])
![DRAFT April 9, STATE IMPLEMENTATION PLAN CREDIT FOR EMISSION REDUCTIONS GENERATED THROUGH INCENTIVE PROGRAMS (Adopted [adoption date])](/thumbs/89/98256578.jpg "DRAFT April 9, STATE IMPLEMENTATION PLAN CREDIT FOR EMISSION REDUCTIONS GENERATED THROUGH INCENTIVE PROGRAMS (Adopted [adoption date])") RULE 9610 STATE IMPLEMENTATION PLAN CREDIT FOR EMISSION REDUCTIONS GENERATED THROUGH INCENTIVE PROGRAMS (Adopted [adoption date]) 1.0 Purpose The purpose of this rule is to provide an administrative mechanism
RULE 9610 STATE IMPLEMENTATION PLAN CREDIT FOR EMISSION REDUCTIONS GENERATED THROUGH INCENTIVE PROGRAMS (Adopted [adoption date]) 1.0 Purpose The purpose of this rule is to provide an administrative mechanism
Review of the SMAQMD s Construction Mitigation Program Enhanced Exhaust Control Practices February 28, 2018, DRAFT for Outreach
 ABSTRACT The California Environmental Quality Act (CEQA) review process requires projects to mitigate their significant impacts. The Sacramento Metropolitan Air Quality Management District (SMAQMD or District)
Item No.: 5B-Supp Date of Meeting: July 17, Briefing on Air Quality Grant Funding
 Item No.: 5B-Supp Date of Meeting: July 17, 2018 Briefing on Air Quality Grant Funding Briefing NWSA staff is exploring the following grant opportunities to supplement costs associated with emission reduction
Pier B On-Dock Rail Support Facility Project Rail Grade Crossings Analysis
 Pier B On-Dock Rail Support Facility Project Rail Grade Crossings Analysis Prepared for Port of Long Beach Prepared by Cambridge Systematics, Inc. July 2016 www.camsys.com Pier B On-Dock Rail Support Facility
Appendix G Traffic Study Methodology
 REVISED DRAFT ENVIRONMENTAL IMPACT REPORT/ Appendix G Traffic Forecasting Model Methodology In addition to the existing/baseline condition (year 2005), a level of service (LOS) analysis was conducted for
AMERICAN ASSOCIATION OF PORT AUTHORITIES
 AMERICAN ASSOCIATION OF PORT AUTHORITIES E N V I R O N M E N T C O M M I T T E E M E E T I N G N O V E M B E R 1 4, 2 0 1 7 WILLIAM M. GUERRY Partner Environmental 2 Volkswagen ( VW ) Settlements 3 Environmental
Why is a towboat called a towboat when it pushes the barges?
 Why is a towboat called a towboat when it pushes the barges? The word "tow" comes from the canal age when a draft animal walking along the bank of the canal pulled a barge. As rivermen gained experience
H.1 Construction Emissions
 Appendix H. Air Quality Analysis The methods used to calculate emissions of carbon monoxide (CO), volatile organic compounds (VOCs), oxides of nitrogen (NO X ), sulfur oxides (SO X ), particulate matter
Current Trends in the Development of Green Ports. APP 102 nd Annual Conference August 16-19, 2015 Kaohsiung, Taiwan
 Current Trends in the Development of Green Ports APP 102 nd Annual Conference August 16-19, 2015 Kaohsiung, Taiwan Agenda Introduction to M&N Services Current Trends in the Development of Green Ports Development
MEMORANDUM. Proposed Town of Chapel Hill Green Fleets Policy
 AGENDA #4k MEMORANDUM TO: FROM: SUBJECT: Mayor and Town Council W. Calvin Horton, Town Manager Proposed Town of Chapel Hill Green Fleets Policy DATE: June 15, 2005 The attached resolution would adopt the
Air Quality Impacts of Advance Transit s Fixed Route Bus Service
 Air Quality Impacts of Advance Transit s Fixed Route Bus Service Final Report Prepared by: Upper Valley Lake Sunapee Regional Planning Commission 10 Water Street, Suite 225 Lebanon, NH 03766 Prepared for:
Development of a Drayage Truck Chassis Dynamometer Test Cycle. Report FINAL
 Development of a Drayage Truck Chassis Dynamometer Test Cycle Report FINAL Prepared for: Port of Long Beach/ Contract HD-7188 Port of Los Angeles/ Tetra Tech September 2011 Prepared by Patrick Couch Jon
Understanding and Estimating Greenhouse Gas Emissions
 Understanding and Estimating Greenhouse Gas Emissions American Association of Port Authorities Climate Change Workshop November 12, 2008 Port of Houston Houston, TX Overview What What Are Greenhouse Gases?
Port of Richmond Clean Air Action Plan 2015 PROGRESS REPORT
 Port of Richmond Clean Air Action Plan 2015 PROGRESS REPORT 2015 CAAP Progress Report Page i Port of Richmond, CA 2015 Port of Richmond Clean Air Action Plan Progress Report Executive Summary The goal
Starcrest dedicates its work on this project to the loving memory of Kelly O'Reilly Ray
 Starcrest dedicates its work on this project to the loving memory of Kelly O'Reilly Ray ADDENDUM TO 2002 BASELINE EMISSIONS INVENTORY OCEAN-GOING VESSELS, HARBOR CRAFT, AND EXPANDED BOUNDARY FOR RAIL LOCOMOTIVES
Metro and you, building together.
 metro.net Metro and you, building together. Compliance Guide to Construction Vehicles and Equipment Off-Road off-road equipment Idling effective June 15, 2008 requirement ARB s regulation, Title 13, CCR,
Georgia Ports Authority
 Georgia Ports Authority September 3, 2014 1 Columbus Bainbridge Savannah Brunswick PORTS ACROSS GEORGIA Savannah Garden City Terminal Ocean Terminal Brunswick Mayor s Point Terminal Colonel s Island Terminal
United States Army Corps of Engineers, New York District General Conformity Determination Notice
 United States Army Corps of Engineers, New York District General Conformity Determination Notice On October 30, 2012, New York State (DR-4085) and New Jersey State (DR-4086) declared Super Storm Sandy
ATTACHMENT C.1 EXXONMOBIL INTERIM TRUCKING FOR SYU PHASED RESTART AIR QUALITY ANALYSIS
 ATTACHMENT C.1 EXXONMOBIL INTERIM TRUCKING FOR SYU PHASED RESTART AIR QUALITY ANALYSIS Revision 2 Page 1 of 7 January 2018 ExxonMobil Production Company, a division of Exxon Mobil Corporation (ExxonMobil
Dallas Intermodal Terminal 2006 Baseline and Projected 2009 and 2012 Emissions Inventory DRAFT FINAL REPORT
 Dallas Intermodal Terminal 2006 Baseline and Projected 2009 and 2012 Emissions Inventory DRAFT FINAL REPORT Prepared for: City of Dallas And The Texas Commission on Environmental Quality Prepared by: Eastern
EPA Tier 4 and the Electric Power Industry
 EPA Tier 4 and the Electric Power Industry The initiative to lower diesel engine emissions started with on-highway engines in 1973 and now extends to non-road mobile equipment, marine and locomotive engines,
AMBER M. KLESGES BOARD SECRETARY. No.\w-Tm
 \C. 9! J RECOMMENDATION APPROVED; RESOLUTION NO. 16-7999 AND TEMPORARY ORDER 16-7209 & PERMANENT ORDER 16-7210 ADOPTED; BY THE BOARD OF HARBOR COMMISSIONERS \b 1 September 15, 2016 1A THE PORT OF LOS ANGELES
ADVANTAGES OF USING SMARTWAY TECHNOLOGIES
 ADVANTAGES OF USING SMARTWAY TECHNOLOGIES Energy Center Workshop Tarrant County Community College April 28, 2016 Jasper Alve, Air Quality Planner North Central Texas Council of Governments 1 Structure
Middle Harbor Project: Draft EIS/EIR LA Chamber of Commerce June 26, 2008, APM Maersk HQ Pier 400
 Middle Harbor Project: Draft EIS/EIR LA Chamber of Commerce June 26, 2008, APM Maersk HQ Pier 400 Richard D. Cameron Director of Environmental Planning, Port of Long Beach CEQA/NEPA Process Summary The
Green Terminal Operations
 Green Terminal Operations Marine Terminal Management Training Program Session VII Long Beach, CA October 16, 2007 T.L. Garrett Pacific Merchant Shipping Association The Air is Getting Cleaner! 2007 Cleanest
STATE IMPLEMENTATION PLAN CREDIT FOR EMISSION REDUCTIONS GENERATED THROUGH INCENTIVE PROGRAMS (Adopted June 20, 2013)
") RULE 9610 STATE IMPLEMENTATION PLAN CREDIT FOR EMISSION REDUCTIONS GENERATED THROUGH INCENTIVE PROGRAMS (Adopted June 20, 2013) 1.0 Purpose The purpose of this rule is to provide an administrative mechanism
RULE 9610 STATE IMPLEMENTATION PLAN CREDIT FOR EMISSION REDUCTIONS GENERATED THROUGH INCENTIVE PROGRAMS (Adopted June 20, 2013) 1.0 Purpose The purpose of this rule is to provide an administrative mechanism
ON-ROAD HEAVY-DUTY TRUCK APPLICATION
 CARL MOYER MEMORIAL AIR QUALITY STANDARDS ATTAINMENT PROGRAM ON-ROAD HEAVY-DUTY TRUCK APPLICATION Revised 08/2016 1 of 11 CARL MOYER RURAL ASSISTANCE PROGRAM Instruction Sheet The California Air Pollution
Transportation Electrification: Reducing Emissions, Driving Innovation. August 2017
 Transportation Electrification: Reducing Emissions, Driving Innovation August 2017 CA raising the bar in environmental policy and action Senate Bill 350 (DeLeon, 2015) established broad and ambitious clean
On-Road Emissions Reductions and the Regional Comprehensive Goods Movement Plan Background and Policy Questions
 On-Road Emissions Reductions and the Regional Comprehensive Goods Movement Plan Background and Policy Questions Presented to SCAG Regional Goods Movement Study Steering Committee Tom Kear Cambridge Systematics
EPA TIER 4 AND THE ELECTRIC POWER INDUSTRY. Tim Cresswell Tier 4 Product Definition Manager Electric Power Division
 EPA TIER 4 AND THE ELECTRIC POWER INDUSTRY Tim Cresswell Tier 4 Product Definition Manager Electric Power Division March 2014 INTRODUCTION The initiative to lower diesel engine emissions started with on-highway
Alpine Highway to North County Boulevard Connector Study
 Alpine Highway to North County Boulevard Connector Study prepared by Avenue Consultants March 16, 2017 North County Boulevard Connector Study March 16, 2017 Table of Contents 1 Summary of Findings... 1
DRAFT MEMORANDUM. Introduction. January 9, 2018
 January 9, 2018 DRAFT MEMORANDUM To: Environmental Defense Fund and Diesel Technology Forum From: Ramboll Subject: Emission reductions and cost effectiveness for marine and locomotive projects - Update
EPA s National Clean Diesel Campaign and the North American ECA
 EPA s National Clean Diesel Campaign and the North American ECA AAPA-ESPO Meeting March 23, 2011 Office of Transportation & Air Quality Jim Blubaugh U.S. Environmental Protection Agency Overview Reducing
IMPLEMENTATION STAKEHOLDER ADVISORY MEETING March 29, 2018
 IMPLEMENTATION STAKEHOLDER ADVISORY MEETING March 29, 2018 Role of the CAAP Implementation Stakeholder Advisory Meeting NEAR-TERM PRIORITIES FOR CAAP IMPLEMENTATION Heather Tomley Director of Environmental
CHAPTER 7: EMISSION FACTORS/MOVES MODEL
 CHAPTER 7: EMISSION FACTORS/MOVES MODEL 7.1 Overview This chapter discusses development of the regional motor vehicle emissions analysis for the North Central Texas nonattainment area, including all key
European Inventory Calculations for Agricultural (Ag) and Construction Equipment (CE) Applications of Diesel-Powered Non-Road Mobile Machinery (NRMM)
 and Construction Equipment (CE) Applications of Diesel-Powered Non-Road Mobile Machinery (NRMM)") European Inventory Calculations for Agricultural (Ag) and Equipment (CE) Applications of Diesel-Powered Non-Road Mobile Machinery (NRMM) The information in this document is primarily derived from material
European Inventory Calculations for Agricultural (Ag) and Equipment (CE) Applications of Diesel-Powered Non-Road Mobile Machinery (NRMM) The information in this document is primarily derived from material
STH 60 Northern Reliever Route Feasibility Study Report
 #233087 v3 STH 60 Northern Reliever Route Feasibility Study Report Washington County Public Works Committee Meeting September 28, 2016 1 STH 60 Northern Reliever Route Feasibility Study Hartford Area Development
Port of Oakland 2015 SEAPORT AIR EMISSIONS INVENTORY Final Report
 Port of Oakland 2015 SEAPORT AIR EMISSIONS INVENTORY Prepared for: Port of Oakland 530 Water Street Oakland, CA 94607 Prepared by: Chris Lindhjem, Till Stoeckenius, John Grant, Lit Chan, James King, Rajashi
Transportation Electrification: Reducing Emissions, Driving Innovation. July 2017
 Transportation Electrification: Reducing Emissions, Driving Innovation July 2017 California is Raising the Bar in Environmental Policy and Action Senate Bill 32 requires California to reduce emissions
The Village at Playa Vista. Appendix E-6. Alternative Analysis
 The Village at Playa Vista Appendix E-6 Alternative Analysis E-6a Remaining Existing Specific Plan Operations Summary Electricity and Natural Gas Usage URBEMIS2002 Output Files Miscellaneous Sources Emissions
ALAMEDA CORRIDOR. A A Project of National Significance. TRB Summer Conference MTS as a Component of the Nation s Transportation System June 25, 2002
 ALAMEDA CORRIDOR A A Project of National Significance TRB Summer Conference MTS as a Component of the Nation s Transportation System June 25, 2002 Top U.S. Container Ports (2001) LOS ANGELES 5.18 LONG
2011 Puget Sound Maritime Air Emission Inventory
 Overview and Progress Update West Coast Collaborative Port Sector Call 27 October 2011 Steering Committee Members American Lung Association of the Mountain Pacific BNSF Railway, Northwest Clean Air Agency,
Chapter 6. Greenhouse Gas Emissions
 Chapter 6 Greenhouse Gas Emissions Chapter 6:Greenhouse Gas Emissions Table of Contents 6. Greenhouse Gas Emissions... 6-1 6.1 Introduction... 6-1 6.2 Scope of Review... 6-1 6.2.1 Geographical Study Scope...
San Pedro Bay Ports Technology Advancement Program
 San Pedro Bay Ports Clean Air Action Plan Technology Advancement Program Moving towards zero emissions Table of Contents Executive Summary. 1 1.0 Introduction.. 5 1.1 Background & Program Objectives 5
Calstart Ontario Diesel Vehicle Regulation Overview
 Calstart Ontario 2011 Diesel Vehicle Regulation Overview Eloy Florez, Air Pollution Specialist In Use Control Measures California Air Resources Board 1 Why Have Air Pollution Control Regulations? Clear
SHORE POWER ALTERNATIVES AAPA ENVIRONMENT COMMITTEE SEPTEMBER 17, 2015 JOSEPH HOWER, PE, DEE
 SHORE POWER ALTERNATIVES AAPA ENVIRONMENT COMMITTEE SEPTEMBER 17, 2015 JOSEPH HOWER, PE, DEE CARB SHORE POWER RULE REGULATORY DEVELOPMENTS 3 International Maritime Organization designated waters within
Construction Emissions Estimates ICTF Modernization Project Long Beach, California
 Construction Emissions Estimates ICTF Modernization Project Long Beach, California prepared for: Union Pacific Railroad Company October 2007 prepared by: Sierra Research, Inc. 1801 J Street Sacramento,
SECTION 4: CLEAN AIR ACTION PLAN INITATIVES - OVERVIEW
 SECTION 4: CLEAN AIR ACTION PLAN INITATIVES - OVERVIEW This section presents an overview of the Clean Air Action Plan, which consists of six primary elements: 1. Source category control measures for existing
REMOTE SENSING DEVICE HIGH EMITTER IDENTIFICATION WITH CONFIRMATORY ROADSIDE INSPECTION
 Final Report 2001-06 August 30, 2001 REMOTE SENSING DEVICE HIGH EMITTER IDENTIFICATION WITH CONFIRMATORY ROADSIDE INSPECTION Bureau of Automotive Repair Engineering and Research Branch INTRODUCTION Several
January 2012 (Revised July 2012) US Army Corps of Engineers Savannah District South Atlantic Division
 US Army Corps of Engineers Savannah District South Atlantic Division") ENVIRONMENTAL IMPACT STATEMENT APPENDIX K: Air Emission Inventory and Assessment SAVANNAH HARBOR EXPANSION PROJECT Chatham County, Georgia and Jasper County, South Carolina January 2012 (Revised July 2012)
ENVIRONMENTAL IMPACT STATEMENT APPENDIX K: Air Emission Inventory and Assessment SAVANNAH HARBOR EXPANSION PROJECT Chatham County, Georgia and Jasper County, South Carolina January 2012 (Revised July 2012)
Cargo Handling Equipment Heavy-Duty Vehicles/Trucks Ocean-Going Vessels
 As also specified under the Project Specific Standards, the emissions from an individual project will be analyzed based upon its contribution to cumulative effects. The project contribution will be evaluated
February 28, Definition of Engines Covered Under the Rule
 WRITTEN STATEMENT OF THE MANUFACTURERS OF EMISSION CONTROLS ASSOCIATION TO THE OZONE TRANSPORT COMMISSION S SECOND DRAFT MODEL RULE TO CONTROL NOX FROM NATURAL GAS COMPRESSOR FUEL-FIRED PRIME MOVERS February
Highway 18 BNSF Railroad Overpass Feasibility Study Craighead County. Executive Summary
 Highway 18 BNSF Railroad Overpass Feasibility Study Craighead County Executive Summary October 2014 Highway 18 BNSF Railroad Overpass Feasibility Study Craighead County Executive Summary October 2014 Prepared
MEMORANDUM January 5, 2015
 MEMORANDUM January 5, 2015 To: FROM: SUBJECT: Diane Bailey Rich Kassel and Patrick Couch National Freight Pathways Modeling Approach and Results Introduction In 2013, GNA prepared a report for NRDC and