APPENDIX D HEALTH RISK ASSESSMENT TECHNICAL REPORT
|
|
|
- Christina York
- 5 years ago
- Views:
Transcription
1 APPENDIX D HEALTH RISK ASSESSMENT TECHNICAL REPORT PREPARED FOR: SOUTHERN CALIFORNIA ASSOCIATION OF GOVERNMENTS 818 WEST 7TH STREET, 12TH FLOOR LOS ANGELES, CA PREPARED BY: KLEINFELDER 2 ADA, SUITE 250 IRVINE, CALIFORNIA ON BEHALF OF: SAPPHOS ENVIRONMENTAL, INC. 430 NORTH HALSTEAD STREET PASADENA, CALIFORNIA Funding: The preparation of this report was financed in part through grants from the United States Department of Transportation (DOT). The preparation of this report has been financed in part through grant[s] from the Federal Highway Administration and Federal Transit Administration, U. S. Department of Transportation. The contents of this report do not necessarily reflect the official views or policy of the U. S. Department of Transportation. The contents of this report reflect the views of the author who is responsible for the facts and accuracy of the data presented herein. The contents do not necessarily reflect the official views or policies of SCAG or DOT. This report does not constitute a standard, specification or regulation.

2 DIESEL EXHAUST HEALTH RISK ASSESSMENT FOR THE SOUTHERN CALIFORNIA ASSOCIATION OF GOVERNMENTS REGIONAL TRANSPORTATION PLAN/ SUSTAINABLE COMMUNITIES STRATEGY KLEINFELDER PROJECT NO A NOVEMBER 18, 2015 Copyright 2015 Kleinfelder All Rights Reserved ONLY THE CLIENT OR ITS DESIGNATED REPRESENTATIVES MAY USE THIS DOCUMENT AND ONLY FOR THE SPECIFIC PROJECT FOR WHICH THIS REPORT WAS PREPARED A /IRV15R28781.docx November 18, 2015 Copyright 2015 Kleinfelder
3 A Report Prepared for: Sapphos Environmental, Inc. 433 N. Halstead Street Pasadena, California On behalf of: Southern California Association of Governments 818 W. 7 th Street, 12 th Floor Los Angeles, California DIESEL EXHAUST HEALTH RISK ASSESSMENT FOR THE SOUTHERN CALIFORNIA ASSOCIATION OF GOVERNMENTS 2016 REGIONAL TRANSPORTATION PLAN/ SUSTAINABLE COMMUNITIES STRATEGY PROJECT NO A Prepared by: Russell E. Erbes, CCM Senior Principal Air Quality Scientist Reviewed by: James Dill, PE Senior Principal Engineer KLEINFELDER 2 Ada, Suite 250 Irvine, California Phone: Fax: November 18, A /IRV15R28781 Page i of viii November 18, 2015 Copyright 2015 Kleinfelder
4 EXECUTIVE SUMMARY The Southern California Association of Governments (SCAG) developed the 2016 Regional Transportation Plan/Sustainable Communities Strategy (2016 RTP/SCS) for the SCAG region with a calendar year 2040 planning horizon. The RTP/SCS is a long-range plan that serves as a blueprint to help strategize for and achieve a coordinated regional transportation system. The SCAG region includes the counties of Imperial, Los Angeles, Orange, Riverside, San Bernardino, and Ventura. The RTP is used to guide the development of the Federal Transportation Improvement Programs as well as other transportation programming documents and plans. The RTP outlines the region's goals and policies for meeting current and future mobility needs, providing a foundation for transportation decisions by local, regional and state officials that are ultimately aimed at achieving a coordinated and balanced transportation system. Pursuant to Senate Bill (SB) 32 (2008), the SCS is developed as part of the RTP and outlines land use growth strategies that provide for more integrated land use and transportation planning, and maximize transportation investments. As such, like the 2012 RTP/SCS, the 2016 RTP/SCS contains regional transportation investments and integrated land use strategies over a 20-year period. Built upon the progress made since the 2012 RTP/SCS while recognizing the current conditions of land use and transportation throughout the region, the 2016 RTP/SCS is prepared to respond to a changing region by meeting the challenges and creating conditions and infrastructure that motivate increased mobility and accessibility; expanded transportation options; broader economic growth; equitably distributed benefits; and sustainability In support of the 2016 RTP/SCS, a Program Environmental Impact Report (PEIR) is being prepared. As part of the PEIR, this health risk assessment (HRA) was prepared to assess the potential carcinogenic health risks from emissions of diesel particulate matter (DPM) and other air toxics from motor vehicles on major freeways and transportation corridors. The HRA quantitatively analyzes only the potential carcinogenic impacts from motor vehicles traveling on major freeways. Non-cancer health risk were not addressed because the risks from air toxics emitted by motor vehicles are dominated by potential cancer risk, and non cancer health risks from motor vehicles have been shown in other studies to not be of concern. Only motor vehicle emissions on freeways were quantitatively evaluated because emissions from other transportation modes and on other transportation corridors are much less than emissions on major freeways. Thus, this HRA yields a reasonable worst-case impact analysis. The HRA evaluates 16 freeway segments, including eight freeway segments that were evaluated in the RTP/SCS PEIR and eight additional segments selected for evaluation. The overview of freeway segments that were evaluated is shown in Figure ES-1 (Overview Freeway A /IRV15R28781.docx Page ii of viii November 18, 2015 Copyright 2015 Kleinfelder
5 Segments to be Evaluated). Emissions of DPM from each segment were calculated using the SCAG Transportation Demand Model VMT data for 2012 base year and projections for SCAG VMT data are provided for heavy duty vehicles and light/medium duty vehicles. The 2012 base year transportation network included the most recently adopted 2015 Federal Transportation Improvement Plan (FTIP) projects, which was adopted in September 2014 and obtained a federal approval in December So, the 2012 base year transportation network does capture the recent progress on the transportation projects side per the 2015 FTIP. The most current version of the California Air Resources Board (CARB) mobile source emissions model (EMFAC2014) was used to obtain emission factors of particulate matter less than 10 microns diameter in dieselfueled vehicles, which were assumed equal to DPM emission factors. The potential impacts of emissions from a representative 1-mile long portion of the freeway segment were evaluated with the CARB-approved AERMOD dispersion model (Version 15181) and meteorological data obtained from South Coast, Imperial, and Ventura Air Districts monitoring sites. The calculated DPM concentration was then used to calculate the potential carcinogenic risk using the most current HRA guidelines published by the California Office of Environmental Health Hazard Assessment 1 (2015). The potential cancer risk calculated for DPM was increased by 5 percent to account for the additional organic gases of acetaldehyde, benzene, 1,3-butadiene, and formaldehyde based on observations of past data. The potential cancer risk for residences was evaluated for a 30-year exposure, 9-year exposure and 70-year exposure. The potential cancer risk at worker receptors and sensitive receptors was also calculated. The sensitive receptors evaluated include senior centers, day care centers and schools, but the risk at those receptors was less than the maximum residential risk due to two primary reasons: (1) the duration of exposure at sensitive receptors is much less than assumed for residential exposure and (2) many of the sensitive receptors are further away from the freeway than the residential receptors (see Appendix C). The 30-year maximum exposed individual residential (MEIR) cancer risk for each transportation segment evaluated for each of the Simulations 2 through 5, is reduced from the baseline conditions represented by Simulation 1 (Existing Conditions) as shown in Table ES-1 (Summary Maximum Exposed Individual Residential 30-year Exposure Cancer Risk [cancer risk per million exposed persons]). The MEIR cancer risk is on the order of 50 to 90 percent less than baseline conditions. This is due to the dramatic reduction in emissions that are expected due to the federal and state regulations that require reduced emissions from on-road heavy-duty diesel trucks 1 California Office of Environmental Health Hazard Assessment A /IRV15R28781.docx Page iii of viii November 18, 2015 Copyright 2015 Kleinfelder
6 (HDDT). By 2040, emissions per mile from HDDT will be on the order of only 5 percent of the emissions per mile in Three simulations (Simulation 3, Simulation 4, and Simulation 5) have comparable reductions in exposure to cancer risk, with Simulation 5 (the Intensified Land Use Alternative) achieving the greatest reduction. This is because there is very little difference in HDDT vehicle miles traveled on the transportation segments in 2040 under any of the simulations (differences in HDDT mileage range from less than 1 to about 5 percent among the simulations).the MEIR cancer risk for Simulations 2 through 5 ranges from 93 in a million to 9 in a million cancer risk for 30-year exposure, 66 in a million to 6 in a million cancer risk for 9-year exposure, and 106 in a million to 10 in a million cancer risk for 70-year exposure. The exposed worker risk for Simulations 2 through 5 ranges from 7 in a million to 1 in a million cancer risk. The 70-year MEIR cancer risk for the No Project Alternative from the eight original freeway segments has decreased from the RTP/SCS PEIR for the following reasons: 1) the emission factors for HDDT projected by the current version of the EMFAC model for 2040 are much less (on the order of 95 percent less) than the emission factors used in the RTP/SCS PEIR for 2035; and 2) the vehicle mileage projected by the current SCAG transportation demand model is different than what was projected in the RTP/SCS PEIR because a more updated 2012 Base Year transportation network is being used for this 2016 RTP/SCS. The combined result of these differences show a decrease in the overall risk to residential, worker and sensitive receptors in the current predictions when compared with the previous analyses A /IRV15R28781.docx Page iv of viii November 18, 2015 Copyright 2015 Kleinfelder
7 Table ES-1 Summary Maximum Exposed Individual Residential 30-year Exposure Cancer Risk (cancer risk per million exposed persons) SEG. NO. TRANSPORTATION SEGMENT COUNTY/ REGION SIMULATION 1 (EXISTING CONDITIONS) SIMULATION 2 (NO PROJECT ALTERNATIVE) SIMULATION 3 (PROPOSED PROJECT) SIMULATION 4 (2012 RTP/SCS WITH LOCAL INPUT ALTERNATIVE) SIMULATION 5 (INTENSIFIED LAND USE ALTERNATIVE) 1 IMP I-8 Imperial / El Centro IMP SR-78 Imperial / Westmoreland LA I-110 Los Angeles / Carson LA I-710 Los Angeles / Compton LA SR-60 DB Los Angeles / Diamond Bar 1, LA SR-60 SEM Los Angeles / South El Monte ORA I-5 Orange / Orange ORA I-405 Orange / Seal Beach 1, RIV I-10 Riverside / Banning RIV I-15 Riverside / Temecula RIV SR-91 Riverside / Corona SB I-15 ONT San Bernardino / Ontario SB I-15 VIC San Bernardino / Victorville SB SR-60 San Bernardino / Ontario VEN US-101 SB Ventura / San Buenaventura VEN US-101 TO Ventura / Thousand Oaks A/IRV15R28781.docx Page v of viii November 18, 2015 Copyright 2015 Kleinfelder

8 FIGURE 2-1 SB I-15 Victorville FIGURE 2-2 VEN US-101 San Buenaventura LA SR-60 South El Monte LA I-110 RIV I-10 ORA I-5 RIV I-15 FIGURE 2-3 IMP SR Miles Locations are Approximate LEGEND 2016 PEIR Additional Segment Original Segment County Boundary Basemap: National Geographic World Map via ESRI Map Service The information included on this graphic representation has been compiled from a variety of sources and is subject to change without notice. Kleinfelder makes no representations or warranties, express or implied, as to accuracy, completeness, timeliness, or rights to the use of such information. This document is not intended for use as a land survey product nor is it designed or intended as a construction design document. The use or misuse of the information contained on this graphic representation is at the sole risk of the party using or misusing the information. PROJECT NO.: DRAWN: DRAWN BY: CHECKED BY: FILE NAME: Overview.mxd NOV 2015 K.HAGAN R.ERBES OVERVIEW FREEWAY SEGMENTS TO BE EVALUATED Diesel Exhaust Health Risk Assessment Southern California Association of Governments 2016 RTP/SCS PEIR FIGURE ES-1
9 TABLE OF CONTENTS Section Page ES EXECUTIVE SUMMARY...ii 1 INTRODUCTION HEALTH RISK ASSESSMENT METHODOLOGY SCENARIOS TO BE EVALUATED SELECTION OF REPRESENTATIVE TRANSPORTATION SEGMENTS POTENTIAL EMISSIONS FROM EACH TRANSPORTATION SEGMENT RECEPTORS OF INTEREST ATMOSPHERIC DISPERSION MODELING AND IMPACT ASSESSMENT HEALTH RISK ASSESSMENT Residential Cancer Risk Worker Cancer Riskp Day Care Center Children Cancer Risk School Children Cancer Risk Senior Center Cancer Risk Hot Spots Analysis and Reporting Program (HARP) HEALTH RISK ASSESSMENT RESULTS MAXIMUM RESIDENTIAL AND WORKER RISKS MAXIMUM SENSITIVE RECEPTOR RISKS HARP 2 MODEL RESULTS MAXIMUM HYPOTHETICAL RECEPTOR RISKS HEALTH RISK COMPARISON TO THE RTP/SCS PEIR ADDITIONAL HEALTH RISKS FROM VEHICLE EMISSIONS OTHER RISK ASSESSMENTS IN THE SOUTH COAST BASIN A/IRV15R28781.docx Page vii of viii November 18, 2015 Copyright 2015 Kleinfelder
10 TABLE OF CONTENTS (continued) TABLES ES-1 Summary Maximum Exposed Individual Residential 30-year Exposure Cancer Risk 2-1 Average Daily VMT for Selected Transportation Segments and Evaluation Simulations 2-2 DPM Emission Estimates for Simulation 1: Existing Conditions 2-3 DPM Emission Estimates for Simulation 2: No Project Alternative 2-4 DPM Emission Estimates for Simulation 3: Proposed Project (2016 RTP/SCS) 2-5 DPM Emission Estimates for Simulation 4: 2012/RTP SCS Update with Local Inputs Alternative 2-6 DPM Emission Estimates for Simulation 5: Intensified Land Use Alternative 2-7 Meteorological Data Used for Dispersion Modeling 3-1 Maximum Exposed Individual Residential 30-year Exposure Cancer Risk 3-2 Maximum Exposed Individual Residential 9-year Exposure Cancer Risk 3-3 Maximum Exposed Individual Residential 70-year Exposure Cancer Risk 3-4 Maximum Exposed Individual Worker Cancer Risk 3-5 Maximum Exposed Day Care Center Children Risk 3-6 Maximum Exposed School Children Cancer Risk 3-7 Maximum Exposed Senior Center Cancer Risk 3-8 Comparison of HARP 2 and Spreadsheet Calculation Results 3-9 Hypothetical Maximum Impact for Any Receptor Type 3-10 Hypothetical Maximum Impact for Residential Receptors as a Function of Distance for 2012 BY and LA I Health Risk Comparison to the PEIR FIGURES ES-1 Overview of Freeway Segments to be Evaluated 2-1 Detailed Overview Northwest SCAG Region 2-2 Detailed Overview Northeast SCAG Region 2-3 Detailed Overview Southeast SCAG Region APPENDICES A Location of Selected Transportation Segments B for Each Transportation Segment and Evaluation Simulation C Location of Modeled Receptors for Each Transportation Segment D Health Risk Calculations for Each Transportation Segment and Evaluation Simulation E Potential Cancer Risk Summary from MOVES2014 F Electronic Copies of Dispersion Model and HARP 2 Input and Results Files A/IRV15R28781.docx Page viii of viii November 18, 2015 Copyright 2015 Kleinfelder
11 1 INTRODUCTION The Southern California Association of Governments (SCAG) Regional Transportation Plan/Sustainable Communities Strategy (2016 RTP/SCS, Plan or Project ) is a long-range transportation plan that provides a vision for regional transportation investments that are integrated with land use strategies for a more than 20-year period. SCAG serves as a Metropolitan Planning Organization (MPO), a Council of Governments (COG) and a Multi-County Designated Transportation Planning Agency representing the approximately 18.7 million residents living within approximately 38,000 square miles represented by multiple jurisdictions: six-county area comprised of Imperial, Los Angeles, Orange, Riverside, San Bernardino, and Ventura Counties and 191 cities, 16 Federally recognized Tribal Sovereign Nations; and 15 Subregional entities that have been recognized by the Regional Council, SCAG s governing body, as partners in the regional policy planning process. SCAG is the lead agency under the California Environmental Quality Act (CEQA) with the responsibility for consideration of the 2016 RTP/SCS for approval. As the lead agency, SCAG has determined to prepare a Program Environmental Impact Report (PEIR) for the 2016 RTP/SCS. The PEIR is a programmatic document that provides a region-wide assessment of the potential significant environmental effects of the 2016 RTP/SCS. The PEIR provides a regional consideration of direct and indirect effects, growth-inducing impacts, and cumulative effects of the 2016 RTP/SCS at a programmatic level. The PEIR includes a range of reasonable alternatives to the 2016 RTP/SCS, including the No Project alternative and alternatives that are capable of achieving most of the basic objectives of the 2016 RTP/SCS and that may be capable of avoiding or substantially lessening any of the significant environmental effects of the 2016 RTP/SCS. The PEIR includes performance standard-based mitigation measures that are capable of avoiding and reducing the significant effects of the 2016 RTP/SCS to the maximum extent practicable. In support of the 2016 RTP/SCS, a PEIR is being prepared. As part of the PEIR, this HRA was prepared to assess the potential cancer risks from emissions of diesel particulate matter (DPM) and other air toxics from motor vehicles on major freeways and transportation corridors. Major freeways have the highest potential for DPM risk due to the density of HDT traffic, emission rates from HDT traffic, and proximity/number of residential and sensitive receptors near freeways. The HRA quantitatively analyzes only the potential carcinogenic impacts from motor vehicles traveling on major freeways. Non-cancer health risks were not addressed because the risks from air toxics A/IRV15R28781.docx Page 1 of 52 November 18, 2015 Copyright 2015 Kleinfelder
12 emitted by motor vehicles are dominated by potential cancer risk and non-cancer health risks from motor vehicles have been shown in other studies to not be of concern A/IRV15R28781.docx Page 2 of 52 November 18, 2015 Copyright 2015 Kleinfelder
13 2 HEALTH RISK ASSESSMENT METHODOLOGY The diesel-exhaust health risk assessment was conducted in seven steps: 1) Determine which land use development pattern and transportation investment scenarios will be evaluated in the health risk assessment simulations; 2) Identify major freeway and transportation corridors of interest within the simulations; 3) Select representative transportation segments from the major freeways or transportation corridors that will be used in the detailed analysis to yield a reasonable worst-case assessment of the potential cancer risk associated with the simulations under evaluation; 4) For each of the simulations, determine emissions of diesel exhaust from all of the selected representative transportation segments; 5) Determine receptors of interest (including hypothetical worst-case receptors) near the selected representative transportation segments at which the potential impact of diesel exhaust will be evaluated; 6) Model atmospheric dispersion of the emissions in order to determine the potential impact from emissions at receptors of interest and hypothetical receptors; and 7) Evaluate the potential cancer risk at the receptors of interest and hypothetical receptors. 2.1 SCENARIOS TO BE EVALUATED The scenarios to be evaluated in this HRA were based on those recommended pursuant to the State California Environmental Quality Act (CEQA) Guidelines (California Code of Regulations, Chapter 3. Guidelines for the Implementation of CEQA). The PEIR includes evaluation of the proposed Project (2016 RTP/SCS) and three alternatives. This HRA includes these four scenarios in addition to the existing conditions scenario (baseline scenario), thereby resulting in five HRA simulations: Simulation 1: Represents Existing Conditions (or baseline simulation); Simulation 2: Represents future (2040) conditions under the No Project Alternative; Simulation 3: Represents future (2040) conditions under the 2016 RTP/SCS or the Proposed Project; Simulation 4: Represents future (2040) conditions under the 2012 RTP/SCS with Local Input Alternative; A/IRV15R28781.docx Page 3 of 52 November 18, 2015 Copyright 2015 Kleinfelder
14 Simulation 5: Represents future (2040) conditions under the Intensified Land Use Alternative. 2.2 SELECTION OF REPRESENTATIVE TRANSPORTATION SEGMENTS The SCAG regional transportation system includes approximately 70,904 existing lane miles 2. Clearly, one cannot assess potential health risks at all of those locations. Thus, a reasonable worst-case representative subset of highways and arterials was selected for analysis. The analysis focused on major freeways and transportation corridors. Passenger rail impacts were not quantitatively assessed because emissions from passenger rail are much less than emissions from major freeways and transportation corridors. For this analysis, 16 representative transportation segments were chosen from major freeway and transportation corridors in the sixcounty SCAG Region to yield a reasonable worst-case assessment of the potential impact of the five Evaluation Simulations throughout the SCAG Region. The logic for selection of the 16 representative transportation segments is as follows: Evaluate the eight transportation segments as used in SCAG s RTP/SCS PEIR 3 for comparison purposes. Select an additional eight transportation segments from major freeways and transportation corridors based on 2012 base year 4 vehicle miles traveled (VMT) data and sensitive receptor locations. Qualifying freeway segments identified as having at least one sensitive receptor within 500 meters were then ranked based on heavy duty (HD) vehicles (primarily trucks) VMT, considering the amount of truck traffic in both directions. Segments were not considered that were considered distant from populated areas with minimal (i.e., less than two) sensitive receptors (e.g., near the base of the Grapevine on I-5) or where the additional segment was an extension of the one of the original 8 segments. In these cases, the next most appropriate segment was chosen following the criteria above. Selection of the additional eight transportation segments involved consideration of a combination of quantitative and qualitative information. First, VMT data from 2012 base year transportation network, representing the most updated transportation network at the time of the preparation for 2 SCAG Transportation Modeling, October Program Environmental Impact Report, Southern California Association of Governments Regional Transportation Plan/Sustainable Communities Strategy, December 2011, State Clearinghouse # Notice of Determination published April 9, The 2012 base year transportation network that is being used for the 2016 RTP/SCS includes the most updated 2015 Federal Transportation Improvement Program (FTIP) projects as well as the projects included in the 2012 RTP/SCS as last amended in September A/IRV15R28781.docx Page 4 of 52 November 18, 2015 Copyright 2015 Kleinfelder
15 the 2016 RTP/SCS, were obtained from SCAG. These data provide 2012 base year VMT for both HD (both diesel and other fuel) and light/medium duty (LM, both diesel and other fuel) vehicles for all of the major freeways and transportation corridors in the SCAG Region. The VMT data are reported by SCAG from the Transportation Demand Model by geographic locations called links. For the purposes of this HRA, a freeway segment may consist of one or more links as defined later in this section. The lengths of the links vary, but are generally on the order of a mile long. The links were then ranked from highest to lowest average daily HD VMT. Average daily VMT was used instead of AM or PM peak VMT because the potential health risks from diesel exhaust are based on long-term (annual average) exposures for many years. The ranking was based on HD VMT rather than LM alone or HD plus LM VMT because nearly all of the HD vehicles are on-road heavy-duty diesel trucks (HDDT), while most of the LM vehicles are not diesel-fueled. Thus, HD VMT yields the highest potential diesel emissions. The ranking was based on 2012 base year VMT data because those data were the most recent available at the time of the ranking. The 2012 base year VMT data incorporated the most recent 2015 Federal Transportation Improvement Program (FTIP) projects and the 2012 RTP/SCS projects as amended in September The 2015 FTIP was adopted in September 2014 and obtained federal approval in December Since the 2012 base year VMT data includes the 2015 FTIP projects and the 2012 RTP/SCS projects as last amended in September 2014, it is not expected that 2015 VMT data (even if it were available) would change the ranking obtained with the 2012 base year VMT data. Hence, the 2012 base year VMT data used in this HRA represented the most updated transportation network information existing at the time that the Notice of Preparation for this PEIR was issued (March 2015). Second, the locations of sensitive receptors in the region were obtained from TomTom and TeleAtlas databases. The sensitive receptor locations were then plotted and the HD VMT data evaluated to select links that had the greatest combination of the density of nearby (within 500 meters) sensitive receptors and maximum HD VMT. A distance of 500 meters from the freeway links was used to capture the nearest and most dense areas of sensitive receptors and because previous studies by CARB have demonstrated that the potential health risk decreases dramatically with distance and the maximum impact is within 500 meters. Links that were geographically adjacent were connected as necessary to create a segment of length of from 2 to 6 miles such that a meaningful number of nearby sensitive receptors and nearby residents were present for that segment. Then one of the maximum HD VMT segments in each county was selected considering not only the quantitative information (HD VMT and numbers of sensitive receptors) but also the qualitative information such as evaluation of aerial photos showing A/IRV15R28781.docx Page 5 of 52 November 18, 2015 Copyright 2015 Kleinfelder
16 residential and commercial building density. After one worst-case segment was chosen in each of the six SCAG Region counties, additional two segments that had relatively high HD VMT were added (one in Los Angeles County and one in Riverside County). The magnitude of the length of a segment to be evaluated is not critical because the maximum impact of diesel exhaust emissions occurs very near (less than 500 meters) and perpendicular to the segment. As long as the length of the segment is relatively longer than the distance to the impacted receptor, the potential impact at a receptor will be the same regardless of the length of the segment. A segment at least 1500 meters long (approximately 1 mile) is long enough to represent the impact at a receptor 500 meters away. Note that most of the maximally-affected residences, worker, and sensitive receptors are located less than 500 meters away. It is recognized that VMT is a function not only of the number of vehicles but also the distance traveled by a vehicle. Therefore, if the number of vehicles is constant, a longer link will have a greater VMT than a shorter link. However, most of the links are of a similar length (on the order of 1 mile), and thus comparing VMT for a link is approximately the same as comparing vehicle counts. VMT is the parameter needed to perform emission and health risk assessment modeling, and thus VMT was used to rank the links. A brief analysis was conducted to confirm that ranking a segment by VMT versus vehicle counts does not change selection of the worst-case segment. It is also recognized that total emissions for a segment are a function of VMT because, as discussed in Section 2.3, the emissions model yields emission factors in terms of grams per mile. Therefore, a longer segment will have greater emissions (grams per day) than a shorter segment, even if the vehicle counts are the same (because the longer segment will have greater VMT). However, the emissions for the longer segment are spread out over a longer distance, so the potential impact is the same. Thus, the ultimate length of a segment is not critical provided that it is long enough to adequately represent maximum impact at a meaningful number of sensitive receptors. Initially, it was expected that major freeways would have greater HD VMT than major transportation corridors (e.g., bus and light rail), and it was expected that there would be sufficient nearby sensitive receptors to the major freeways such that the major freeways would represent worst-case conditions. This logic was confirmed by evaluating HD VMT for major transportation corridors in the SCAG Region compared to the freeways, and it was found that the HD VMT on the major freeway segments was much greater than for the transportation corridors. It was also found that there were numerous residential, worker, and sensitive receptors nearby the major freeways. Likewise, public transit corridors and airport diesel exhaust emissions are much less A/IRV15R28781.docx Page 6 of 52 November 18, 2015 Copyright 2015 Kleinfelder
17 than for the major freeways. Therefore, use of the major freeways for segment selection does represent a reasonable worst-case health impact analysis. The HRA evaluated a total of 16 segments, including the eight segments evaluated in the 2012 RTP/SCS PEIR and eight additional segments selected for evaluation. These segments are shown in ES-1 (Overview Freeway Segments to be Evaluated) and Figures 2-1 through 2-3 (Detailed Overview of SCAG Regions), and individual details are located in Appendix A: 1. IMP I-8: Interstate 8 just east of El Centro (Imperial County); a PEIR Segment. (Figure A-1, IMP I-8 Segment Detail Map) 2. IMP SR-78: State Road 78 Freeway in Westmorland (Imperial County); an additional segment. (Figure A-2, IMP SR-78 Segment Detail Map) 3. LA I-110: Interstate 110 in Carson (Los Angeles County); an additional segment. (Figure A-3, LA I-110 Segment Detail Map) 4. LA I-710: Interstate 710 in Compton, north of the intersection with SR 91 (Los Angeles County); a PEIR Segment. (Figure A-4, LA I-710 Segment Detail Map) 5. LA SR-60 DB: State Road 60 Freeway near Diamond Bar (Los Angeles County); a PEIR Segment. (Figure A-5, LA SR-60 DB Segment Detail Map) 6. LA SR-60 SEM: State Road 60 Freeway near South El Monte at Peck Rd (Los Angeles); an additional segment. (Figure A-6, LA SR-60 SEM Segment Detail Map) 7. ORA I-5: Interstate 5 in Orange near intersection of SR 57 and SR 22 (Orange County); an additional segment. (Figure A-7, ORA I-5 Segment Detail Map) 8. ORA I-405: Interstate 405 in Seal Beach, east of the I-605 interchange (Orange County); a PEIR Segment. (Figure A-8, ORA I-405 Segment Detail Map) 9. RIV I-10: Interstate 10 in the Banning area (Riverside County); an additional segment. (Figure A-9, RIV I-10 Segment Detail Map) 10. RIV I-15: Interstate 15 near Temecula (Riverside County); an additional segment. (Figure A-10, RIV I-15 Segment Detail Map) 11. RIV SR-91: State Road 91 Freeway in Corona, east of the intersection with SR 71 (Riverside County); a PEIR Segment. (Figure A-11, SR-91 Segment Detail Map) 12. SB I-15 ONT: in Ontario (San Bernardino County); a PEIR Segment. (Figure A-12, SB I-15 ONT Segment Detail Map) A/IRV15R28781.docx Page 7 of 52 November 18, 2015 Copyright 2015 Kleinfelder
18 13. SB I-15 VIC: Interstate 15 in the Victorville area (San Bernardino County); an additional segment. (Figure A-13, SB I-15 VIC Segment Detail Map) 14. SB SR-60: State Road 60 Freeway in Ontario, west of the I-15 interchange (San Bernardino County); a PEIR Segment. (Figure A-14, SB SR-60 Segment Detail Map) 15. VEN US-101 SB: US 101 Freeway in San Buenaventura near the Ventura Harbor (Ventura County); an additional segment. (Figure A-15, VEN US-101 SB Segment Detail Map) 16. VEN US-101 TO: US 101 Freeway in Thousand Oaks, east of SR 23 (Ventura County); a PEIR Segment.(Figure A-16, VEN US-101 TO Segment Detail Map) A/IRV15R28781.docx Page 8 of 52 November 18, 2015 Copyright 2015 Kleinfelder
19 I-15 in Victorville V e n t u r a C o u n t y L o s A n g e l e s C o u n t y US 101 near Ventura Harbor S a n B e r n a r d i n o C o u n t y US-101 in Thousand Oaks SR-60 near Diamond Bar I-15 in Ontario SR 60 in El Monte at Peck Road SR-60 in Ontario I-710 in Compton I-110 in Carson O r a n g e C o u n t y R i v e r s i d e C o u n t y SR-91 in Corona I-405 in Seal Beach I-5 near intersection of SR 57 and SR Miles Locations are Approximate LEGEND 2016 PEIR Additional Segment Original Segment County Boundary Basemap: National Geographic World Map via ESRI Map Service The information included on this graphic representation has been compiled from a variety of sources and is subject to change without notice. Kleinfelder makes no representations or warranties, express or implied, as to accuracy, completeness, timeliness, or rights to the use of such information. This document is not intended for use as a land survey product nor is it designed or intended as a construction design document. The use or misuse of the information contained on this graphic representation is at the sole risk of the party using or misusing the information. PROJECT NO.: DRAWN: DRAWN BY: CHECKED BY: NOV 2015 K.HAGAN R.ERBES FILE NAME: Overview_Detail.mxd DETAILED OVERVIEW NORTHWEST SCAG REGION Diesel Exhaust Health Risk Assessment Southern California Association of Governments 2016 RTP/SCS PEIR FIGURE 2-1
20 S a n B e r n a r d i n o C o u n t y I-10 in Banning R i v e r s i d e C o u n t y Miles Locations are Approximate LEGEND 2016 PEIR Additional Segment Original Segment County Boundary Basemap: National Geographic World Map via ESRI Map Service The information included on this graphic representation has been compiled from a variety of sources and is subject to change without notice. Kleinfelder makes no representations or warranties, express or implied, as to accuracy, completeness, timeliness, or rights to the use of such information. This document is not intended for use as a land survey product nor is it designed or intended as a construction design document. The use or misuse of the information contained on this graphic representation is at the sole risk of the party using or misusing the information. PROJECT NO.: DRAWN: DRAWN BY: CHECKED BY: NOV 2015 K.HAGAN R.ERBES FILE NAME: Overview_Detail.mxd DETAILED OVERVIEW NORTHEAST SCAG REGION Diesel Exhaust Health Risk Assessment Southern California Association of Governments 2016 RTP/SCS PEIR FIGURE 2-2
21 R i v e r s i d e C o u n t y I-15 near Temecula I m p e r i a l C o u n t y S a n D i e g o C o u n t y SR 78 in Westmorland I-8 east of El Centro Miles Locations are Approximate LEGEND 2016 PEIR Additional Segment Original Segment County Boundary Basemap: National Geographic World Map via ESRI Map Service The information included on this graphic representation has been compiled from a variety of sources and is subject to change without notice. Kleinfelder makes no representations or warranties, express or implied, as to accuracy, completeness, timeliness, or rights to the use of such information. This document is not intended for use as a land survey product nor is it designed or intended as a construction design document. The use or misuse of the information contained on this graphic representation is at the sole risk of the party using or misusing the information. PROJECT NO.: DRAWN: DRAWN BY: CHECKED BY: NOV 2015 K.HAGAN R.ERBES FILE NAME: Overview_Detail.mxd DETAILED OVERVIEW SOUTHEAST SCAG REGION Diesel Exhaust Health Risk Assessment Southern California Association of Governments 2016 RTP/SCS PEIR FIGURE 2-3
22 2.3 POTENTIAL EMISSIONS FROM EACH TRANSPORTATION SEGMENT Emissions were estimated for each transportation segment and Evaluation Simulations with the latest EMFAC2014 California mobile source emissions model. This emissions model is published by the California Air Resources Board (CARB) for use in California to estimate emissions from mobile sources. The EMFAC2014 model is currently being reviewed by USEPA. The model includes County-specific mobile source profiles, including fleet mix and other parameters that affect emissions. Therefore, EMFAC2014 was run to obtain emission factors (grams per mile) for each of the six counties and for calendar years 2015 and 2040 to account for the Evaluation Simulations and transportation segment locations. Calendar year 2015 was used to calculate the emission factors for Evaluation Simulation 1, Existing Conditions, as the Notice of Preparation was issued in spring of The 2015 emission factors were coupled with the 2012 VMT (which reflects the 2015 FTIP and is the best VMT data available for existing conditions) to obtain total emissions per segment. For Evaluation Simulations 2 through 5, calendar year 2040 emission factors were coupled with 2040 VMT estimates. The 2040 emission factors represent the best estimate by CARB as to the future fleet mix composition and emission parameters. The EMFAC emissions model yields emissions of the criteria pollutants (e.g., nitrogen oxides, particulate matter, etc.), not air toxics (e.g., diesel exhaust, acetaldehyde, etc.). However, diesel exhaust consists of particulate matter of less than 10 micron mean aerodynamic diameter (PM 10), and PM 10 is one of the criteria pollutants. PM 10 from diesel-fueled vehicle exhaust was used to represent diesel exhaust emissions. EMFAC estimates PM 10 emissions from other sources as well (e.g., brake/tire wear, gasoline vehicle exhaust, etc.), but those sources within EMFAC were not counted as diesel exhaust. EMFAC does not yield emissions of other air toxics associated with vehicle travel, specifically benzene, acetaldehyde, 1,3-butadiene, and formaldehyde. A methodology to account for the risk contribution of these additional air toxics was developed and is discussed in Section 2.6. EMFAC provides emission factors individually for each vehicle class and model year, and EMFAC2014 can be run for 13 or 34 different vehicle classes (times 2 for diesel versus gasoline). For this analysis, 13 vehicle classes (times 2 for diesel versus gasoline) were used, as the SCAG VMT data are already lumped into only 2 groups (HD and LM), thus running 34 vehicle classes (times 2 for diesel versus gasoline) causes unnecessary complexity and does not improve accuracy. Furthermore, most of the potential health risk is from HDDT; thus no additional health risk information is gleaned by using 34 vehicle classes. For each county, the HD and LM VMT A/IRV15R28781.docx Page 12 of 52 November 18, 2015 Copyright 2015 Kleinfelder
23 was assigned proportionally to each of the vehicle classes and fuel types according to the countyspecific fleet mix in EMFAC for calendar year 2015 or Fleet aggregate emission factors by vehicle class were used based on the county-specific fleet mix of model years for that vehicle class. The EMFAC fleet mix and proportional distribution of 2015 and 2040 VMT are shown in Appendix B by county and calendar year. Appendix B also shows the PM 10 emission factors from EMFAC2014 by vehicle class. The PM 10 emission factors from EMFAC by vehicle class for diesel-fueled vehicles (grams per mile) were then multiplied by the average daily VMT for the transportation segment to obtain total emissions (grams per day) of DPM. The VMT data for Simulation 1, Existing Conditions, was prepared by using the 2012 base year, but includes projects in the 2015 FTIP adopted in September 2014, as well as projects in the RTP/SCS as last amended in September The VMT data for Simulations 2 through 5 were prepared for calendar year 2040 and were developed with their travel demand modeling system. Table 2-1 (Average Daily VMT for Selected Transportation Segments and Evaluation Simulations) shows the average daily VMT by transportation segment, direction, and Evaluation Simulation. The VMT was then multiplied by the EMFAC2014 emission factors to yield the emissions (grams per day) shown in Tables 2-2 through 2-6 (DPM Emission Estimates for Simulations 1 through 5). Emissions for each direction of the transportation segment were estimated separately because VMT differs by direction. Additional calculation detail is presented in Appendix B. The emissions calculated for calendar year 2040 are an over-estimate of what will actually occur, because EMFAC2014 only incorporates on the books regulations and emission reduction practices. Emissions from vehicles consistently decrease in the future as new technologies become available and new emission limits are required through regulations not yet enacted. Therefore, emissions in 2040 will be less than calculated herein even if the VMT forecasts are the same as currently estimated A/IRV15R28781.docx Page 13 of 52 November 18, 2015 Copyright 2015 Kleinfelder
24 Table 2-1 Average Daily VMT for Selected Transportation Segments and Evaluation Simulations SEG. NO. TRANSPORT. SEGMENT COUNTY/ REGION DIRECTION SIMULATION 1 (EXISTING CONDITIONS) SIMULATION 2 (NO PROJECT ALTERNATIVE) SIMULATION 3 (PROPOSED PROJECT) SIMULATION 4 (2012 RTP/SCS WITH LOCAL INPUT ALTERNATIVE) SIMULATION 5 (INTENSIFIED LAND USE ALTERNATIVE) LM HD LM HD LM HD LM HD LM HD 1 IMP I-8 Imperial/ El Centro East 18,222 3, ,039 30,683 25,337 11,402 25,684 11,364 25,734 11,339 1 IMP I-8 Imperial/ El Centro West 21,350 3, ,930 14,854 26,101 11,565 26,567 11,519 26,612 11,487 2 IMP SR-78 Imperial/ Westmoreland East 6,534 1,280 83,147 17,539 13,739 2,337 13,729 2,263 13,731 2,287 2 IMP SR-78 Imperial/ Westmoreland 3 LA I-110 Los Angeles/ Carson West 6,425 1,316 83,147 17,539 8,242 2,492 8,221 2,418 8,225 2,427 North 164,091 16, ,613 41, ,588 24, ,972 23, ,279 23,686 3 LA I-110 Los Angeles/ Carson South 159,370 14, ,830 27, ,655 21, ,737 20, ,658 21,046 4 LA I-710 Los Angeles/ Compton North 178,750 23, ,963 28, ,817 24, ,574 24, ,305 24,030 4 LA I-710 Los Angeles/ Compton South 133,387 21, ,043 23, ,915 21, ,749 21, ,316 21,136 5 LA SR-60 DB Los Angeles/ Diamond Bar East 382,009 40, ,407 63, ,880 38, ,875 39, ,534 39, A/IRV15R28781.docx Page 14 of 52 November 18, 2015 Copyright 2015 Kleinfelder
25 Table 2-1 (continued) Average Daily VMT for Selected Transportation Segments and Evaluation Simulations SEG. NO. TRANSPORT. SEGMENT COUNTY/ REGION DIRECTION SIMULATION 1 (EXISTING CONDITIONS) SIMULATION 2 (NO PROJECT ALTERNATIVE) SIMULATION 3 (PROPOSED PROJECT) SIMULATION 4 (2012 RTP/SCS WITH LOCAL INPUT ALTERNATIVE) SIMULATION 5 (INTENSIFIED LAND USE ALTERNATIVE) LM HD LM HD LM HD LM HD LM HD 5 LA SR-60 DB Los Angeles/ Diamond Bar West 382,164 40, ,273 76, ,183 35, ,180 36, ,669 36,647 6 LA SR-60 SEM Los Angeles/ South El Monte East 199,784 14, ,331 20, ,513 14, ,089 14, ,977 14,103 6 LA SR-60 SEM Los Angeles/ South El Monte West 209,315 15, ,494 24, ,120 16, ,074 16, ,128 15,975 7 ORA I-5 Orange/ Orange 7 ORA I-5 Orange/ Orange North 214,774 10, ,257 21, ,793 19, ,857 19, ,497 19,319 South 151,474 6, ,059 20, ,747 12, ,743 12, ,133 12,062 8 ORA I-405 Orange/ Seal Beach North 235,828 20, ,720 32, ,577 33, ,162 33, ,036 33,923 8 ORA I-405 Orange/ Seal Beach South 217,558 18, ,150 35, ,061 31, ,359 31, ,867 31,326 9 RIV I-10 Riverside/ Banning East 320,238 71, , , , , , , , ,302 9 RIV I-10 Riverside/ Banning West 315,658 70, , , , , , , , , A/IRV15R28781.docx Page 15 of 52 November 18, 2015 Copyright 2015 Kleinfelder
26 Table 2-1 (continued) Average Daily VMT for Selected Transportation Segments and Evaluation Simulations SEG. NO. TRANSPORT. SEGMENT COUNTY/ REGION DIRECTION SIMULATION 1 (EXISTING CONDITIONS) SIMULATION 2 (NO PROJECT ALTERNATIVE) SIMULATION 3 (PROPOSED PROJECT) SIMULATION 4 (2012 RTP/SCS WITH LOCAL INPUT ALTERNATIVE) SIMULATION 5 (INTENSIFIED LAND USE ALTERNATIVE) LM HD LM HD LM HD LM HD LM HD 10 RIV I-15 Riverside/ Temecula North 291,514 31, ,646 52, ,031 75, ,052 75, ,016 75, RIV I-15 Riverside/ Temecula South 347,213 37, ,680 62, ,310 91, ,597 90, ,334 90, RIV SR-91 Riverside/ Corona East 280, ,975 30, ,241 42, ,032 43, ,171 43, RIV SR-91 Riverside/ Corona 12 SB I-15 ONT San Bernardino/ Ontario West 262,746 35, ,865 72, ,128 45, ,691 45, ,551 45,549 North 241,942 26, ,190 76, ,700 56, ,855 56, ,047 55, SB I-15 ONT San Bernardino/ Ontario South 249,613 26, , , ,670 58, ,754 58, ,210 57, SB I-15 VIC San Bernardino/ Victorville North 170,736 42, ,704 46, ,852 85, ,880 85, ,288 83, SB I-15 VIC San Bernardino/ Victorville South 163,348 42, ,931 74, ,052 88, ,731 88, ,351 86, A/IRV15R28781.docx Page 16 of 52 November 18, 2015 Copyright 2015 Kleinfelder
27 Table 2-1 (continued) Average Daily VMT for Selected Transportation Segments and Evaluation Simulations SEG. NO. TRANSPORT. SEGMENT COUNTY/ REGION DIRECTION SIMULATION 1 (EXISTING CONDITIONS) SIMULATION 2 (NO PROJECT ALTERNATIVE) SIMULATION 3 (PROPOSED PROJECT) SIMULATION 4 (2012 RTP/SCS WITH LOCAL INPUT ALTERNATIVE) SIMULATION 5 (INTENSIFIED LAND USE ALTERNATIVE) LM HD LM HD LM HD LM HD LM HD 14 SB SR-60 San Bernardino/ Ontario East 257,591 44, ,731 43, ,107 33, ,792 34, ,240 38, SB SR-60 San Bernardino/ Ontario West 248,515 42, ,404 34, ,083 30, ,920 30, ,384 31, VEN US-101 SB Ventura/ San Buenaventura North 173,653 14, ,353 45, ,426 29, ,992 28, ,132 28, VEN US-101 SB Ventura/ San Buenaventura South 168,566 15, ,970 16, ,698 30, ,327 30, ,667 30, VEN US-101 TO Ventura/ Thousand Oaks North 73,667 6,251 59,994 10,385 67,736 10,476 66,450 10,473 66,525 10, VEN US-101 TO Ventura/ Thousand Oaks South 87,449 7, ,575 16,092 81,120 12,661 79,638 12,646 79,292 12, A/IRV15R28781.docx Page 17 of 52 November 18, 2015 Copyright 2015 Kleinfelder
28 Table 2-2 DPM Emission Estimates for Simulation 1: Existing Conditions SEG. NO. TRANSPORTATION SEGMENT COUNTY / REGION SEGMENT LENGTH (miles) DIRECTION PM10 EMISSIONS (lbs/day) 1 IMP I-8 Imperial / El Centro 1.51 East IMP I-8 Imperial / El Centro 1.51 West IMP SR-78 Imperial / Westmoreland 0.88 East IMP SR-78 Imperial / Westmoreland 0.88 East LA I-110 Los Angeles / Carson 1.98 North LA I-110 Los Angeles / Carson 1.92 South LA I-710 Los Angeles / Compton 1.34 North LA I-710 Los Angeles / Compton 1.34 South LA SR-60 DB Los Angeles / Diamond Bar 3.14 East LA SR-60 DB Los Angeles / Diamond Bar 2.98 West LA SR-60 SEM Los Angeles / South El Monte 1.52 East LA SR-60 SEM Los Angeles / South El Monte 1.50 West ORA I-5 Orange / Orange 1.32 North ORA I-5 Orange / Orange 1.32 South ORA I-405 Orange / Seal Beach 1.09 North ORA I-405 Orange / Seal Beach 1.02 South RIV I-10 Riverside / Banning 5.01 East RIV I-10 Riverside / Banning 4.98 West RIV I-15 Riverside / Temecula 4.80 North RIV I-15 Riverside / Temecula 5.84 South RIV SR-91 Riverside / Corona 2.01 East RIV SR-91 Riverside / Corona 1.76 West SB I-15 ONT San Bernardino / Ontario 2.95 North A/IRV15R28781.docx Page 18 of 52 November 18, 2015 Copyright 2015 Kleinfelder
29 Table 2-2 (continued) DPM Emission Estimates for Simulation 1: Existing Conditions SEG. NO. TRANSPORTATION SEGMENT COUNTY / REGION SEGMENT LENGTH (miles) DIRECTION PM10 EMISSIONS (lbs/day) 12 SB I-15 ONT San Bernardino / Ontario 2.97 South SB I-15 VIC San Bernardino / Victorville 4.32 North SB I-15 VIC San Bernardino / Victorville 4.39 South SB SR-60 San Bernardino / Ontario 2.35 East SB SR-60 San Bernardino / Ontario 2.22 West VEN US-101 SB Ventura / San Buenaventura 0.79 North VEN US-101 SB Ventura / San Buenaventura 0.94 South VEN US-101 TO Ventura / Thousand Oaks 3.21 North VEN US-101 TO Ventura / Thousand Oaks 3.26 South A/IRV15R28781.docx Page 19 of 52 November 18, 2015 Copyright 2015 Kleinfelder
30 Table 2-3 DPM Emission Estimates for Simulation 2: No Project Alternative SEG. NO. TRANSPORTATION SEGMENT COUNTY / REGION SEGMENT LENGTH (miles) DIRECTION PM10 EMISSIONS (lbs/day) 1 IMP I-8 Imperial / El Centro 1.51 East IMP I-8 Imperial / El Centro 1.51 West IMP SR-78 Imperial / Westmoreland 0.88 East IMP SR-78 Imperial / Westmoreland 0.88 East LA I-110 Los Angeles / Carson 1.98 North LA I-110 Los Angeles / Carson 1.92 South LA I-710 Los Angeles / Compton 1.34 North LA I-710 Los Angeles / Compton 1.34 South LA SR-60 DB Los Angeles / Diamond Bar 3.14 East LA SR-60 DB Los Angeles / Diamond Bar 3.12 West LA SR-60 SEM Los Angeles / South El Monte 1.52 East LA SR-60 SEM Los Angeles / South El Monte 1.50 West ORA I-5 Orange / Orange 1.32 North ORA I-5 Orange / Orange 0.81 South ORA I-405 Orange / Seal Beach 1.09 North ORA I-405 Orange / Seal Beach 1.02 South RIV I-10 Riverside / Banning 5.01 East RIV I-10 Riverside / Banning 4.98 West RIV I-15 Riverside / Temecula 4.81 North RIV I-15 Riverside / Temecula 5.83 South RIV SR-91 Riverside / Corona 2.01 East RIV SR-91 Riverside / Corona 1.76 West A/IRV15R28781.docx Page 20 of 52 November 18, 2015 Copyright 2015 Kleinfelder
31 Table 2-3 (continued) DPM Emission Estimates for Simulation 2: No Project Alternative SEG. NO. TRANSPORTATION SEGMENT COUNTY / REGION SEGMENT LENGTH (miles) DIRECTION PM10 EMISSIONS (lbs/day) 12 SB I-15 ONT San Bernardino / Ontario 2.95 North SB I-15 ONT San Bernardino / Ontario 2.97 South SB I-15 VIC San Bernardino / Victorville 4.32 North SB I-15 VIC San Bernardino / Victorville 4.39 South SB SR-60 San Bernardino / Ontario 2.35 East SB SR-60 San Bernardino / Ontario 2.22 West VEN US-101 SB Ventura / San Buenaventura 3.21 North VEN US-101 SB Ventura / San Buenaventura 3.26 South VEN US-101 TO Ventura / Thousand Oaks 0.79 North VEN US-101 TO Ventura / Thousand Oaks 0.94 South A/IRV15R28781.docx Page 21 of 52 November 18, 2015 Copyright 2015 Kleinfelder
32 Table 2-4 DPM Emission Estimates for Simulation 3: Proposed Project (2016 RTP/SCS) SEG. NO. TRANSPORTATION SEGMENT COUNTY / REGION SEGMENT LENGTH (miles) DIRECTION PM10 EMISSIONS (lbs/day) 1 IMP I-8 Imperial / El Centro 1.51 East IMP I-8 Imperial / El Centro 1.51 West IMP SR-78 Imperial / Westmoreland 0.88 East IMP SR-78 Imperial / Westmoreland 0.88 East LA I-110 Los Angeles / Carson 1.98 North LA I-110 Los Angeles / Carson 1.92 South LA I-710 Los Angeles / Compton 1.34 North LA I-710 Los Angeles / Compton 1.34 South LA SR-60 DB Los Angeles / Diamond Bar 3.14 East LA SR-60 DB Los Angeles / Diamond Bar 3.12 West LA SR-60 SEM Los Angeles / South El Monte 1.52 East LA SR-60 SEM Los Angeles / South El Monte 1.50 West ORA I-5 Orange / Orange 1.32 North ORA I-5 Orange / Orange 0.81 South ORA I-405 Orange / Seal Beach 1.09 North ORA I-405 Orange / Seal Beach 1.02 South RIV I-10 Riverside / Banning 5.01 East RIV I-10 Riverside / Banning 4.98 West RIV I-15 Riverside / Temecula 4.81 North RIV I-15 Riverside / Temecula 5.83 South RIV SR-91 Riverside / Corona 2.01 East RIV SR-91 Riverside / Corona 1.76 West SB I-15 ONT San Bernardino / Ontario 2.95 North A/IRV15R28781.docx Page 22 of 52 November 18, 2015 Copyright 2015 Kleinfelder
33 Table 2-4 (continued) DPM Emission Estimates for Simulation 3: Proposed Project (2016 RTP/SCS) SEG. NO. TRANSPORTATION SEGMENT COUNTY / REGION SEGMENT LENGTH (miles) DIRECTION PM10 EMISSIONS (lbs/day) 12 SB I-15 ONT San Bernardino / Ontario 2.97 South SB I-15 VIC San Bernardino / Victorville 4.32 North SB I-15 VIC San Bernardino / Victorville 4.39 South SB SR-60 San Bernardino / Ontario 2.35 East SB SR-60 San Bernardino / Ontario 2.22 West VEN US-101 SB Ventura / San Buenaventura 3.21 North VEN US-101 SB Ventura / San Buenaventura 3.26 South VEN US-101 TO Ventura / Thousand Oaks 0.79 North VEN US-101 TO Ventura / Thousand Oaks 0.94 South A/IRV15R28781.docx Page 23 of 52 November 18, 2015 Copyright 2015 Kleinfelder
34 Table 2-5 DPM Emission Estimates for Simulation 4: 2012 RTP/SCS with Local Inputs Alternative SEG. NO. TRANSPORTATION SEGMENT COUNTY / REGION SEGMENT LENGTH (miles) DIRECTION PM10 EMISSIONS (lbs/day) 1 IMP I-8 Imperial / El Centro 1.51 East IMP I-8 Imperial / El Centro 1.51 West IMP SR-78 Imperial / Westmoreland 0.88 East IMP SR-78 Imperial / Westmoreland 0.88 East LA I-110 Los Angeles / Carson 1.98 North LA I-110 Los Angeles / Carson 1.92 South LA I-710 Los Angeles / Compton 1.34 North LA I-710 Los Angeles / Compton 1.34 South LA SR-60 DB Los Angeles / Diamond Bar 3.14 East LA SR-60 DB Los Angeles / Diamond Bar 3.12 West LA SR-60 SEM Los Angeles / South El Monte 1.52 East LA SR-60 SEM Los Angeles / South El Monte 1.50 West ORA I-5 Orange / Orange 1.32 North ORA I-5 Orange / Orange 0.81 South ORA I-405 Orange / Seal Beach 1.09 North ORA I-405 Orange / Seal Beach 1.02 South RIV I-10 Riverside / Banning 5.01 East RIV I-10 Riverside / Banning 4.98 West RIV I-15 Riverside / Temecula 4.81 North RIV I-15 Riverside / Temecula 5.83 South RIV SR-91 Riverside / Corona 2.01 East RIV SR-91 Riverside / Corona 1.74 West SB I-15 ONT San Bernardino / Ontario 2.95 North A/IRV15R28781.docx Page 24 of 52 November 18, 2015 Copyright 2015 Kleinfelder
35 Table 2-5 (continued) DPM Emission Estimates for Simulation 4: 2012 RTP/SCS with Local Inputs Alternative SEG. NO. TRANSPORTATION SEGMENT COUNTY / REGION SEGMENT LENGTH (miles) DIRECTION PM10 EMISSIONS (lbs/day) 12 SB I-15 ONT San Bernardino / Ontario 2.97 South SB I-15 VIC San Bernardino / Victorville 4.32 North SB I-15 VIC San Bernardino / Victorville 4.39 South SB SR-60 San Bernardino / Ontario 2.35 East SB SR-60 San Bernardino / Ontario 2.22 West VEN US-101 SB Ventura / San Buenaventura 3.21 North VEN US-101 SB Ventura / San Buenaventura 3.26 South VEN US-101 TO Ventura / Thousand Oaks 0.79 North VEN US-101 TO Ventura / Thousand Oaks 0.94 South A/IRV15R28781.docx Page 25 of 52 November 18, 2015 Copyright 2015 Kleinfelder
36 Table 2-6 DPM Emission Estimates for Simulation 5: Intensified Land Use Alternative SEG. NO. TRANSPORTATION SEGMENT COUNTY / REGION SEGMENT LENGTH (miles) DIRECTION PM10 EMISSIONS (lbs/day) 1 IMP I-8 Imperial / El Centro 1.51 East IMP I-8 Imperial / El Centro 1.51 West IMP SR-78 Imperial / Westmoreland 0.88 East IMP SR-78 Imperial / Westmoreland 0.88 East LA I-110 Los Angeles / Carson 1.98 North LA I-110 Los Angeles / Carson 1.92 South LA I-710 Los Angeles / Compton 1.34 North LA I-710 Los Angeles / Compton 1.34 South LA SR-60 DB Los Angeles / Diamond Bar 3.14 East LA SR-60 DB Los Angeles / Diamond Bar 3.12 West LA SR-60 SEM Los Angeles / South El Monte 1.52 East LA SR-60 SEM Los Angeles / South El Monte 1.50 West ORA I-5 Orange / Orange 1.32 North ORA I-5 Orange / Orange 0.81 South ORA I-405 Orange / Seal Beach 0.45 North ORA I-405 Orange / Seal Beach 0.41 South RIV I-10 Riverside / Banning 5.01 East RIV I-10 Riverside / Banning 4.98 West RIV I-15 Riverside / Temecula 4.81 North RIV I-15 Riverside / Temecula 5.83 South RIV SR-91 Riverside / Corona 2.01 East RIV SR-91 Riverside / Corona 1.76 West SB I-15 ONT San Bernardino / Ontario 2.95 North A/IRV15R28781.docx Page 26 of 52 November 18, 2015 Copyright 2015 Kleinfelder
37 Table 2-6 (continued) DPM Emission Estimates for Simulation 5: Intensified Land Use Alternative SEG. NO. TRANSPORTATION SEGMENT COUNTY / REGION SEGMENT LENGTH (miles) DIRECTION PM10 EMISSIONS (lbs/day) 12 SB I-15 ONT San Bernardino / Ontario 2.97 South SB I-15 VIC San Bernardino / Victorville 4.32 North SB I-15 VIC San Bernardino / Victorville 4.39 South SB SR-60 San Bernardino / Ontario 2.35 East SB SR-60 San Bernardino / Ontario 2.22 West VEN US-101 SB Ventura / San Buenaventura 3.21 North VEN US-101 SB Ventura / San Buenaventura 3.26 South VEN US-101 TO Ventura / Thousand Oaks 0.79 North VEN US-101 TO Ventura / Thousand Oaks 0.94 South A/IRV15R28781.docx Page 27 of 52 November 18, 2015 Copyright 2015 Kleinfelder
38 2.4 RECEPTORS OF INTEREST Health risk is assessed at locations where persons can be exposed to the emissions. These locations are termed receptors. Receptors are classified according to what persons may be doing at the location. The receptor types are residential, work, or sensitive. Sensitive receptors include day care centers, schools, and senior centers. Residential and worker receptors within 1000 meters of each transportation segment, starting about 100 meters away from the outer edge of the freeway, were determined based on aerial photos of the transportation segment. The 1000 meter criterion was used to sufficiently capture where the health impacts may be expected to occur. Sensitive receptors were identified from the TomTom and TeleAtlas databases, and there are over 100 sensitive receptors in the vicinity of the 16 study segments. All of the receptors are shown on Figures C-1 through C-16 (Modeled Receptors Segments 1 through 16) in Appendix C. In areas where there were multiple residences and possible worker locations, receptors were placed in a grid pattern with 100-meter spacing out to 500 meters from the transportation segment and 250-meter spacing out to 1000 meters. The receptors were placed at UTM coordinates at even-100 meter locations (e.g., UTM , ) so that the model results could be input into the HARP 2 risk assessment model if needed (see Section 3.3). Actual physical mean sea level elevation of the receptors was used in the dispersion model, with the elevation data obtained from U.S. Geological Survey (USGS) Digital Elevation Model/Geographic Information System (DEM/GIS) data. In addition to individual actual receptors, two additional sets of hypothetical receptors were evaluated. Risk calculations were conducted for the maximum impact point based on an assumption that any of the various receptor types (e.g., resident, worker, school, day care center, senior center) could be located at the maximum impact point using Segment 8, ORA I-405 (Interstate 405 in the Seal Beach area). A set of hypothetical receptors was used to show how the potential health risk decreases rapidly with distance away from the transportation segment using Segment 4, LA I-710 in the Compton area and Simulation 1 Existing Conditions (see Section 3.4). The hypothetical receptor analysis also accounts for the possibility that in some cases there may be actual receptors closer to the freeway than 100 meters. 2.5 ATMOSPHERIC DISPERSION MODELING AND IMPACT ASSESSMENT The CARB-approved AERMOD dispersion model (Version 15181, as provided by BEE-Line Software, Version 11.01) was used and run with regulatory defaults as required by the Air Districts. The three primary inputs to the AERMOD model are the emissions, receptors, and meteorological data. Worst-case meteorological data provided by the relevant Air Districts (South A/IRV15R28781.docx Page 28 of 52 November 18, 2015 Copyright 2015 Kleinfelder
39 Coast, Ventura, Imperial) were used as shown in Table 2-7 (Meteorological Data Used for Dispersion Modeling). The meteorological data are selected and provided by the Air Districts to be used in the AERMOD model for all dispersion modeling. The calendar years of meteorological data provided by the Air Districts is not intended to match the calendar years in which a source is or will be emitting, as the Districts select a worst-case set of data to be used for all modeling in the District. The nearest representative meteorological station to each of the transportation segments was used. Table 2-7 Meteorological Data Used for Dispersion Modeling SEG. NO. TRANSPORTATION SEGMENT COUNTY / REGION METEOROLOGICAL DATA SITE YEARS OF METEOROLOGICAL DATA 1 IMP I-8 Imperial / El Centro Indio 2007, 08, 09, 10, 12 2 IMP SR-78 Imperial / Westmoreland Indio 2007, 08, 09, 10, 12 3 LA I-110 Los Angeles / Carson Long Beach 2007, 08, 09, 11, 12 4 LA I-710 Los Angeles / Compton Lynnwood 2006, 07, 09 5 LA SR-60 DB Los Angeles / Diamond Bar Pomona 2008, 09, 10, 11, 12 6 LA SR-60 SEM Los Angeles / South El Monte Pico Rivera 2008, 09, 10, 11, 12 7 ORA I-5 Orange / Orange Anaheim 2006, 07, 08, 09, 12 8 ORA I-405 Orange / Seal Beach Long Beach 2007, 08, 09, 11, 12 9 RIV I-10 Riverside / Banning Banning Airport 2008, 09, 10, 11, RIV I-15 Riverside / Temecula Lake Elsinore 2008, 09, 10, 11, RIV SR-91 Riverside / Corona La Habra 2008, 09, 10, 11, SB I-15 ONT San Bernardino / Ontario Fontana 2008, 09, 10, 11, SB I-15 VIC San Bernardino / Victorville San Bernardino 2007, 08, 09, 10, SB SR-60 San Bernardino / Ontario Upland 2008, 09, 10, 11, VEN US-101 SB Ventura / San Buenaventura Reseda 2008, 09, 10, 11, VEN US-101 TO Ventura / Thousand Oaks Reseda 2008, 09, 10, 11, 12 The transportation segments were modeled as a series of volume sources for each direction of the freeway. The volume sources are square in plan view (i.e., looking from above) with the width equal to the physical transportation segment width for each direction plus 3 meters to account for initial mechanical turbulence. Adding 3 meters to the volume source is standard practice per Caltrans and CARB modeling guidance for roadway dispersion modeling. To be conservative, A/IRV15R28781.docx Page 29 of 52 November 18, 2015 Copyright 2015 Kleinfelder
40 only one 3-meter addition was made (i.e., to the outside of the roadway) because in many cases the inside edge of the volume sources are adjacent (i.e., there is no median, only a concrete barrier separating the different directions). The release height for the emissions was also conservatively chosen as 2 meters to represent the average height of HDDT and other dieselfueled vehicle exhausts. No elevated transportation segments were modeled (i.e., no overpasses or elevated or depressed on or off-ramps). Actual physical mean sea level elevation of the transportation segment volume sources was used, obtained from USGS DEM/GIS data. In order to reduce computation time, a one-mile portion of the transportation segment was modeled. The modeled mile was chosen to encompass the most sensitive receptors. As discussed previously, a one-mile modeled portion of the transportation segment will yield the same maximum impact concentrations as a longer portion. For purposes of the dispersion model, unit emission rates (i.e., 1 gram per second [g/sec]) for each direction were entered into the model. Thus, the dispersion model yields relative impact concentrations in terms of concentration per unit emission rate (micrograms per cubic meter / gram per second, or ug/m 3 / g/sec). The relative concentration (ug/m 3 / g/sec) can then be multiplied by the emission rate (g/sec) for the transportation segment to obtain the impact concentration (ug/m 3 ). The maximum impact dispersion model results for each of the segments are shown in Appendix D and electronic copies of the model input. 2.6 HEALTH RISK ASSESSMENT The DPM concentrations determined by the dispersion model at the receptors of interest were used to evaluate the potential carcinogenic risk of the five simulations. Cancer risk was used as a surrogate for all associated health risks since it is known that near major freeways and transportation corridors the greatest potential health effect is from DPM emissions and long term carcinogenesis (see Section 3.5). As stated previously, only DPM emissions are estimated with the EMFAC emissions model, and there are an additional four major carcinogenic air toxics (i.e., acetaldehyde, benzene, 1,3-butadiene, and formaldehyde) that are emitted by vehicles. Other air toxics can be estimated using a US Environmental Protection Agency (USEPA) emissions model, MOVES2014. The MOVES2014 model replaces the previous USEPA emissions model for mobile sources called A/IRV15R28781.docx Page 30 of 52 November 18, 2015 Copyright 2015 Kleinfelder
41 MOBILE6.2a. The PEIR 5 demonstrated that 96.3 percent of the total cancer risk was due to DPM, with the additional four air toxics contributing only 3.7 percent. However, the PEIR used the MOBILE6.2a emissions model. Therefore, an analysis was conducted to determine if the same ratio would result if the current MOVES2014 emissions model were used. The analysis showed that when the MOVES2014 emissions model is used, DPM was responsible for nearly 99 percent of the total risk from heavy duty diesel trucks and from 96.1 to 96.3 percent of the total risk for all vehicle classes 6. Accordingly for purposes of the health risk assessment, the potential health risk calculated by using only DPM was conservatively increased by 5 percent to account for the additional air toxics of acetaldehyde, benzene, 1,3-butadiene, and formaldehyde (see Appendix E for further details) Residential Cancer Risk For a given ambient concentration of DPM, the potential cancer risk is a function of the types of persons exposed (adults, children, pregnant women, etc.) and the duration of exposure. The California Office of Environmental Health and Hazard Assessment (OEHHA) has published guidelines for calculating potential cancer risk. The most recent version of the guidelines, Air Toxic Hot Spots Program Guidance Manual for Preparation of Health Risk Assessments dated February (Guidance), was used to calculate the DPM cancer risk for each of the segments using the Guidance (see Appendix D). Consistent with the Guidance, potential cancer risk is calculated by first determining the dose of DPM and then multiplying the dose times the exposure duration and cancer potency factor, as shown in the following equation: 5 Program Environmental Impact Report, op cit. Appendix F. 6 Letter from James Dill and Russell Erbes to Mr. Eric Charlton dated February 3, Available from Mr. Eric Charlton, Sapphos Environmental, Inc. 7 Air Toxic Hot Spots Program Guidance Manual for Preparation of Health Risk Assessments, February California Office of Environmental Health Hazard Assessment. Available at last accessed September A/IRV15R28781.docx Page 31 of 52 November 18, 2015 Copyright 2015 Kleinfelder
42 Residential Dose (Guidance Equation 5.4.1): Dose-air = C air x {BR/BW} x A x EF x 10-6 Where, Dose-air = dose through inhalation, mg/kg/d (only the inhalation pathway is applicable to DPM) C air = annual average concentration of DPM at the receptor of interest, ug/m 3 {BR/BW} = Daily breathing rate normalized to body weight, L/kg body weight-day A = Inhalation absorption factor, unitless, assumed equal to 1 EF = Exposure frequency, unitless, calculated from days exposure per 365 days 10-6 = conversion factor micrograms to milligrams and liters to cubic meters The Guidance recommends that for residential exposure the EF is 350/365 and for {BR/BW} that the 95 th percentile daily breathing rates should be used (Guidance Table 5.6). The 95 th percentile breathing rates are as follows: Third Trimester = 361 L/kg-day 0 to <2 years = 1090 L/kg-day 2 to <9 years = 861 L/kg-day 2 to <16 years = 745 L/kg-day 16 to <30 years = 335 L/kg-day 16 to <70 years = 290 L/kg-d Residential Cancer Risk (Guidance Equation 8.2.4A) RISK inh-res = Dose-air x CPF x ASF X ED/AT x FAH Where, CPF = cancer potency factor, which for DPM is 1.1 (mg/kg/day) -1 ASF = Age sensitivity factor, unitless ED = Exposure Duration, years, for the specified age group AT = Averaging Time for lifetime cancer risk, which is 70 years FAH = Fraction of Time at Home, unitless A/IRV15R28781.docx Page 32 of 52 November 18, 2015 Copyright 2015 Kleinfelder
43 The Guidance recommends the following Age Sensitivity Factors (Guidance Table 8.3): 3rd Trimester 10 0 to <2 years 10 2 to <9 years 3 9 to <16 years 3 16 to <30 years 1 30 to <70 years 1 The Guidance recommends the following Fraction of Time at Home when there is a school within the 1 in a million cancer risk isopleth of the source, which is nearly always the case for freeways (Guidance Table 8.4): 3rd Trimester to <2 years to <9 years to <16 years to <30 years to <70 years 0.73 When one combines the equation for Dose-air and for RISK inh-res, the 30-year residential cancer risk is calculated as follows: Residential 30-Year Exposure DPM Cancer Risk = [(C air x 361 x 350/365 x 10-6 x 1.1 x 10) x (0.25 yrs / 70 yrs) x 1.0] third trimester + [(C air x 1090 x 350/365 x 10-6 x 1.1 x 10) x (2 yrs / 70 yrs) x 1.0] 0 to <2 yrs + [(C air x 745 x 350/365 x 10-6 x 1.1 x 3) x (14 yrs / 70 yrs) x 1.0] 2 to <16 yrs + [(C air x 335 x 350/365 x 10-6 x 1.1 x 1) x (14 yrs/ 70 yrs) x 0.73] 16 to <30 yrs The Guidance recommends that cancer risk be reported assuming 30-year exposure for residential receptors. The 30-year duration is the national 95 th percentile of the duration that persons reside at one location. However, as a point of reference, the Guidance suggests that both 9-year exposure duration and 70-year exposure duration should be noted. A 70-year exposure assumes that a person never moves from the location he or she was born. The 9-year exposure represents the national median duration that a person resides in the same location. The 9-year and 70-year cancer risk is calculated as follows: A/IRV15R28781.docx Page 33 of 52 November 18, 2015 Copyright 2015 Kleinfelder
44 Residential 9-Year Exposure DPM Cancer Risk = [(C air x 361 x 350/365 x 10-6 x 1.1 x 10) x (0.25 yrs / 70 yrs) x 1.0] third trimester + [(C air x 1090 x 350/365 x 10-6 x 1.1 x 10) x (2 yrs / 70 yrs) x 1.0] 0 to <2 yrs + [(C air x 861 x 350/365 x 10-6 x 1.1 x 3) x (7 yrs / 70 yrs) x 1.0] 2 to <9 yrs Residential 70-Year Exposure DPM Cancer Risk = [(C air x 361 x 350/365 x 10-6 x 1.1 x 10) x (0.25 yrs / 70 yrs) x 1.0] third trimester + [(C air x 1090 x 350/365 x 10-6 x 1.1 x 10) x (2 yrs / 70 yrs) x 1.0] 0 to <2 yrs + [(C air x 745 x 350/365 x 10-6 x 1.1 x 3) x (14 yrs / 70 yrs) x 1.0] 2 to <16 yrs + [(C air x 290 x 350/365 x 10-6 x 1.1 x 1) x (54 yrs/ 70 yrs) x 0.73] 16 to <70 yrs To account for the additional air toxics, the DPM cancer risk was multiplied by a factor of 1.05 to arrive at the total risk Worker Cancer Risk The same equations that are used for calculating residential cancer risk are used for calculating worker risk, however some of the parameters change to reflect worker versus residential exposure. For workers, it is assumed that a person works at the same place for 25 years, starting at age 16. It is also assumed the worker could be pregnant while working, so the third trimester exposure is included in the risk calculation. The 95 th percentile breathing rates for residents are different than for workers, which for workers are 240 L/kg-day for the third trimester and 230 L/kg-day for age 16 to 70 (Guidance Section ). No "Fraction of Time at Home factor is used for workers; but the EF is assumed to be 5 days per week, 50 weeks per year, or 250 days out of 365. Accordingly, the worker cancer risk is calculated as follows: Worker 25-Year Exposure DPM Cancer Risk = [(C air x 240 x 250/365 x 10-6 x 1.1 x 10) x (0.25 yrs / 70 yrs)] third trimester + [(C air x 230 x 250/365 x 10-6 x 1.1 x 1) x (25 yrs / 70 yrs)] 16 to <70 yrs The worker cancer risk formula applies to all types of workers, including workers who may be working at sensitive receptors such as day care centers. To account for the additional air toxics, the DPM cancer risk was multiplied by a factor of 1.05 to arrive at the total risk A/IRV15R28781.docx Page 34 of 52 November 18, 2015 Copyright 2015 Kleinfelder
45 2.6.3 Day Care Center Children Cancer Risk For children who attend a day care center, cancer risk is calculated similarly to residential with factors in the equations changed to reflect children and day care exposure. The Guidance recommends a breathing rate of 1200 L/kg-day for age 0 to <2 years and 640 L/kg-day for 2 to <9 years (Guidance Section ) for children at day care centers. The duration is assumed to be 250 days per year for 6 years. The formula for day care center children cancer risk is as follows: Day Care Center Children 6-year DPM Cancer Risk = [(C air x 1200 x 250/365 x 10-6 x 1.1 x 10) x (2 yrs / 70 yrs)] 0 to <2 years + [(C air x 640 x 250/365 x 10-6 x 1.1 x 3) x (4 yrs / 70 yrs)] 2 to <6 yrs To account for the additional air toxics, the DPM cancer risk was multiplied by a factor of 1.05 to arrive at the total risk School Children Cancer Risk For children who attend elementary, middle or high school, cancer risk is calculated similarly to the day care center children. Elementary school duration is 7 years (kindergarten through sixth grade), middle school is 2 or 3 years (seventh through eighth or ninth grade) and high school is 3 or 4 years (ninth or tenth grade through twelfth grade). The longest duration and the largest Age Sensitivity Factors occur for elementary school, and thus elementary school exposure was used as the worst-case. It was assumed that children attend school 5 days per week for 36 weeks less 3 weeks of vacation, or 165 days per year. The Guidance recommends a school children breathing rate of 520 L/kg-day (Guidance Section ). A worst case calculation was used for all school children as follows: School Children 7-year DPM Cancer Risk = [(C air x 520 x 165/365 x 10-6 x 1.1 x 3) x (7 yrs / 70 yrs)] 2 to <16 years To account for the additional air toxics, the DPM cancer risk was multiplied by a factor of 1.05 to arrive at the total risk A/IRV15R28781.docx Page 35 of 52 November 18, 2015 Copyright 2015 Kleinfelder
46 2.6.5 Senior Center Cancer Risk The cancer risk for senior center residents was calculated similarly to the residential cancer risk, although it was assumed that a senior center resident did not arrive at the center full time until the person was over the age of 30 and that a person would not reside at the same senior center for more than 30 years. It was also conservatively assumed that the person never left the senior center, so the Exposure Frequency was continuous over 365 days and there is no Fraction of Time at Home factor. The risk was calculated as follows: Senior Center 30-Year Exposure DPM Cancer Risk = [(C air x 290 x 365/365 x 10-6 x 1.1 x 1) x (30 yrs/ 70 yrs)] 30 to <70 yrs To account for the additional air toxics, the DPM cancer risk was multiplied by a factor of 1.05 to arrive at the total risk Hot Spots Analysis and Reporting Program (HARP) CARB has published a computer model that can automatically calculate the cancer risk for residential and worker exposures. This program is called the Hot Spots Analysis and Reporting Program Version 2 (HARP 2). The above equations were for the inhalation pathway only, but it is easy to see that calculating cancer risk for chemicals that have multi-pathway exposures can become quite complex. Therefore, HARP 2 automates the calculations using the above equations and additional equations for all chemicals and pathways. Some regulatory agencies require air toxic health risk assessments be conducted with HARP 2. For DPM, HARP 2 will yield the same results (accounting for round-off differences) as the above equations. To confirm that the spreadsheet calculations performed in this health risk assessment match the results that would be obtained with HARP 2, the HARP 2 model was run for one of the transportation segments and the results compared to the spreadsheet calculations as discussed in Section A/IRV15R28781.docx Page 36 of 52 November 18, 2015 Copyright 2015 Kleinfelder
47 3 HEALTH RISK ASSESSMENT RESULTS 3.1 MAXIMUM RESIDENTIAL AND WORKER RISKS The maximum exposed individual resident (MEIR) and the maximum exposed individual worker risk results for each of the segments for each of the evaluated simulations are summarized in Tables 3-1 through 3-4 (Maximum Exposed Individual Residential Cancer Risk for 30-year, 9-year, and 70-year Exposure, respectively). The calculated results include the 5 percent increase to DPM-only risk to account for additional air toxics, which include acetaldehyde, benzene, 1,3-butadiene, and formaldehyde. The results are expressed as the incremental cancer risk per million exposed persons. The residential risk for Simulations 2 through 5 ranges from 93 in a million to 9 in a million cancer risk for 30-year exposure (Table 3-1), 66 in a million to 6 in a million cancer risk for 9-year exposure (Table 3-2), and 106 in a million to 10 in a million cancer risk for 70-year exposure (Table 3-3). The exposed worker risk for Simulations 2 through 5 ranges from 7 in a million to 1 in a million cancer risk (Table 3-4). Risk calculation details are provided in Appendix D, and output files showing all of the receptor concentrations are contained in Appendix F A/IRV15R28781.docx Page 37 of 52 November 18, 2015 Copyright 2015 Kleinfelder
48 Table 3-1 Maximum Exposed Individual Residential 30-year Exposure Cancer Risk (cancer risk per million exposed persons) SEG. NO. TRANSPORTATION SEGMENT COUNTY/ REGION SIMULATION 1 (EXISTING CONDITIONS) SIMULATION 2 (NO PROJECT ALTERNATIVE) SIMULATION 3 (PROPOSED PROJECT) SIMULATION 4 (2012 RTP/SCS WITH LOCAL INPUT ALTERNATIVE) SIMULATION 5 (INTENSIFIED LAND USE ALTERNATIVE) 1 IMP I-8 Imperial / El Centro IMP SR-78 Imperial / Westmoreland LA I-110 Los Angeles / Carson LA I-710 Los Angeles / Compton LA SR-60 DB Los Angeles / Diamond Bar 1, LA SR-60 SEM Los Angeles / South El Monte ORA I-5 Orange / Orange ORA I-405 Orange / Seal Beach 1, RIV I-10 Riverside / Banning RIV I-15 Riverside / Temecula RIV SR-91 Riverside / Corona SB I-15 ONT San Bernardino / Ontario SB I-15 VIC San Bernardino / Victorville SB SR-60 San Bernardino / Ontario VEN US-101 SB Ventura / San Buenaventura VEN US-101 TO Ventura / Thousand Oaks A/IRV15R28781.docx Page 38 of 52 November 18, 2015 Copyright 2015 Kleinfelder
49 Table 3-2 Maximum Exposed Individual Residential 9-year Exposure Cancer Risk (cancer risk per million exposed persons) SEG. NO. TRANSPORTATION SEGMENT COUNTY/ REGION SIMULATION 1 (EXISTING CONDITIONS) SIMULATION 2 (NO PROJECT ALTERNATIVE) SIMULATION 3 (PROPOSED PROJECT) SIMULATION 4 (2012 RTP/SCS WITH LOCAL INPUT ALTERNATIVE) SIMULATION 5 (INTENSIFIED LAND USE ALTERNATIVE) 1 IMP I-8 Imperial / El Centro IMP SR-78 Imperial / Westmoreland LA I-110 Los Angeles / Carson LA I-710 Los Angeles / Compton LA SR-60 DB Los Angeles / Diamond Bar LA SR-60 SEM Los Angeles / South El Monte ORA I-5 Orange / Orange ORA I-405 Orange / Seal Beach RIV I-10 Riverside / Banning RIV I-15 Riverside / Temecula RIV SR-91 Riverside / Corona SB I-15 ONT San Bernardino / Ontario SB I-15 VIC San Bernardino / Victorville SB SR-60 San Bernardino / Ontario VEN US-101 SB Ventura / San Buenaventura VEN US-101 TO Ventura / Thousand Oaks A/IRV15R28781.docx Page 39 of 52 November 18, 2015 Copyright 2015 Kleinfelder
50 Table 3-3 Maximum Exposed Individual Residential 70-year Exposure Cancer Risk (cancer risk per million exposed persons) SEG. NO. TRANSPORTATION SEGMENT COUNTY/ REGION SIMULATION 1 (EXISTING CONDITIONS) SIMULATION 2 (NO PROJECT ALTERNATIVE) SIMULATION 3 (PROPOSED PROJECT) SIMULATION 4 (2012 RTP/SCS WITH LOCAL INPUT ALTERNATIVE) SIMULATION 5 (INTENSIFIED LAND USE ALTERNATIVE) 1 IMP I-8 Imperial / El Centro IMP SR-78 Imperial / Westmoreland LA I-110 Los Angeles / Carson LA I-710 Los Angeles / Compton LA SR-60 DB Los Angeles / Diamond Bar 1, LA SR-60 SEM Los Angeles / South El Monte ORA I-5 Orange / Orange ORA I-405 Orange / Seal Beach 1, RIV I-10 Riverside / Banning RIV I-15 Riverside / Temecula RIV SR-91 Riverside / Corona SB I-15 ONT San Bernardino / Ontario SB I-15 VIC San Bernardino / Victorville SB SR-60 San Bernardino / Ontario VEN US-101 SB Ventura / San Buenaventura VEN US-101 TO Ventura / Thousand Oaks A/IRV15R28781.docx Page 40 of 52 November 18, 2015 Copyright 2015 Kleinfelder
51 Table 3-4 Maximum Exposed Individual Worker Cancer Risk (cancer risk per million exposed persons) SEG. NO. TRANSPORTATION SEGMENT COUNTY/ REGION SIMULATION 1 (EXISTING CONDITIONS) SIMULATION 2 (NO PROJECT ALTERNATIVE) SIMULATION 3 (PROPOSED PROJECT) SIMULATION 4 (2012 RTP/SCS WITH LOCAL INPUT ALTERNATIVE) SIMULATION 5 (INTENSIFIED LAND USE ALTERNATIVE) 1 IMP I-8 Imperial / El Centro IMP SR-78 Imperial / Westmoreland LA I-110 Los Angeles / Carson LA I-710 Los Angeles / Compton LA SR-60 DB Los Angeles / Diamond Bar LA SR-60 SEM Los Angeles / South El Monte ORA I-5 Orange / Orange ORA I-405 Orange / Seal Beach RIV I-10 Riverside / Banning RIV I-15 Riverside / Temecula RIV SR-91 Riverside / Corona SB I-15 ONT San Bernardino / Ontario SB I-15 VIC San Bernardino / Victorville SB SR-60 San Bernardino / Ontario VEN US-101 SB Ventura / San Buenaventura VEN US-101 TO Ventura / Thousand Oaks A/IRV15R28781.docx Page 41 of 52 November 18, 2015 Copyright 2015 Kleinfelder
52 The 30-year exposure residential cancer risk is greater than the worker cancer risk in all segments and evaluation simulations (Tables 3-2 and 3-4). The largest MEIR cancer risk occurs for Segment 8, ORA I-405. For this transportation segment, Simulation 1 (Existing Conditions) causes the greatest cancer risk, and Simulation 4 (2012 RTP/SCS Update with Local Input Alternative) causes the least cancer risk. For 30-year maximum residential exposure at the ORA I-405 transportation segment, Simulation 4 is about 8 percent of the Simulation 1. The 9-year exposure cancer risk is about 30 percent less than the 30-year exposure cancer risk (Tables 3-1 and 3-2). The 70-year exposure cancer risk is about 14 percent greater than the 30-year exposure cancer risk (Tables 3-1 and 3-3). 3.2 MAXIMUM SENSITIVE RECEPTOR RISKS Three types of sensitive receptors were evaluated where the calculation of risk differs from a residential or a worker receptor: day care centers, schools, and senior centers. Other sensitive receptors such as churches and hospitals were represented either by a worker receptor (e.g., the risk to hospital workers or church workers are the same as other workers) or the duration of exposure is much less than at a senior center (e.g., patients at a hospital do not stay in the hospital for 30 years as it was assumed for senior centers and persons attending church spend much less time at church than at home). The risks associated with these receptors is shown in Tables 3-5 through 3-7 (Maximum Exposed Cancer Risk [cancer risk per million exposed persons] for Day Care Center Children, School Children, and Senior Center, respectively) The risk at all other sensitive receptors are the same or less than those shown in the tables. It is important to note that not all segments had all three types of sensitive receptors present within 1000 meters of the transportation segment. In that case, an entry of NR (no receptor) was made in the tables A/IRV15R28781.docx Page 42 of 52 November 18, 2015 Copyright 2015 Kleinfelder
53 SEG. NO. TRANSPORTATION SEGMENT Table 3-5 Maximum Exposed Day Care Center Children Risk (cancer risk per million exposed persons) COUNTY/ REGION SIMULATION 1 (EXISTING CONDITIONS) SIMULATION 2 (NO PROJECT ALTERNATIVE) SIMULATION 3 (PROPOSED PROJECT) SIMULATION 4 (2012 RTP/SCS WITH LOCAL INPUT ALTERNATIVE) SIMULATION 5 (INTENSIFIED LAND USE ALTERNATIVE) 1 IMP I-8 Imperial / El Centro IMP SR-78 Imperial / Westmoreland LA I-110 Los Angeles / Carson LA I-710 Los Angeles / Compton LA SR-60 DB Los Angeles / Diamond Bar LA SR-60 SEM Los Angeles / South El Monte ORA I-5 Orange / Orange ORA I-405 Orange / Seal Beach NR NR NR NR NR 9 RIV I-10 Riverside / Banning RIV I-15 Riverside / Temecula RIV SR-91 Riverside / Corona NR NR NR NR NR 12 SB I-15 ONT San Bernardino / Ontario NR NR NR NR NR 13 SB I-15 VIC San Bernardino / Victorville SB SR-60 San Bernardino / Ontario VEN US-101 SB Ventura / San Buenaventura VEN US-101 TO Ventura / Thousand Oaks NR = No sensitive receptor of this type located within 1000 meters of the transportation segment A/IRV15R28781.docx Page 43 of 52 November 18, 2015 Copyright 2015 Kleinfelder
54 Table 3-6 Maximum Exposed School Children Cancer Risk (cancer risk per million exposed persons) SEG. NO. TRANSPORTATION SEGMENT COUNTY/ REGION SIMULATION 1 (EXISTING CONDITIONS) SIMULATION 2 (NO PROJECT ALTERNATIVE) SIMULATION 3 (PROPOSED PROJECT) SIMULATION 4 (2012 RTP/SCS WITH LOCAL INPUT ALTERNATIVE) SIMULATION 5 (INTENSIFIED LAND USE ALTERNATIVE) 1 IMP I-8 Imperial / El Centro IMP SR-78 Imperial / Westmoreland LA I-110 Los Angeles / Carson LA I-710 Los Angeles / Compton LA SR-60 DB Los Angeles / Diamond Bar LA SR-60 SEM Los Angeles / South El Monte ORA I-5 Orange / Orange ORA I-405 Orange / Seal Beach NR NR NR NR NR 9 RIV I-10 Riverside / Banning RIV I-15 Riverside / Temecula RIV SR-91 Riverside / Corona NR NR NR NR NR 12 SB I-15 ONT San Bernardino / Ontario NR NR NR NR NR 13 SB I-15 VIC San Bernardino / Victorville SB SR-60 San Bernardino / Ontario VEN US-101 SB Ventura / San Buenaventura VEN US-101 TO Ventura / Thousand Oaks NR = No sensitive receptor of this type located within 1000 meters of the transportation segment A/IRV15R28781.docx Page 44 of 52 November 18, 2015 Copyright 2015 Kleinfelder
55 Table 3-7 Maximum Exposed Senior Center Cancer Risk (cancer risk per million exposed persons) SEG. NO. TRANSPORTATION SEGMENT COUNTY/ REGION SIMULATION 1 (EXISTING CONDITIONS) SIMULATION 2 (NO PROJECT ALTERNATIVE) SIMULATION 3 (PROPOSED PROJECT) SIMULATION 4 (2012 RTP/SCS WITH LOCAL INPUT ALTERNATIVE) SIMULATION 5 (INTENSIFIED LAND USE ALTERNATIVE) 1 IMP I-8 Imperial / El Centro NR NR NR NR NR 2 IMP SR-78 Imperial / Westmoreland LA I-110 Los Angeles / Carson LA I-710 Los Angeles / Compton LA SR-60 DB Los Angeles / Diamond Bar NR NR NR NR NR 6 LA SR-60 SEM Los Angeles / South El Monte ORA I-5 Orange / Orange ORA I-405 Orange / Seal Beach NR NR NR NR NR 9 RIV I-10 Riverside / Banning RIV I-15 Riverside / Temecula NR NR NR NR NR 11 RIV SR-91 Riverside / Corona NR NR NR NR NR 12 SB I-15 ONT San Bernardino / Ontario NR NR NR NR NR 13 SB I-15 VIC San Bernardino / Victorville NR NR NR NR NR 14 SB SR-60 San Bernardino / Ontario NR NR NR NR NR 15 VEN US-101 SB Ventura / San Buenaventura VEN US-101 TO Ventura / Thousand Oaks NR = No sensitive receptor of this type located within 1000 meters of the transportation segment A/IRV15R28781.docx Page 45 of 52 November 18, 2015 Copyright 2015 Kleinfelder
56 Tables 3-5 through 3-7 show that sensitive receptor cancer risk is always less than the MEIR cancer risk shown in Table 3-1 for all segments and evaluation simulations. The largest sensitive receptor cancer risk value occurs for Segment 5, LA SR-60 DB for the day care center type of sensitive receptor. For this receptor, Simulation 1 Existing Conditions causes the greatest cancer risk and Simulation RTP/SCS with Local Input Alternatives, the least risk. The maximum sensitive receptor risk for existing conditions is at a day care center near the LA SR-60 DB, where the risk for Simulation 4 is about 1.3 percent of the risk for Simulation HARP 2 MODEL RESULTS The HARP 2 risk assessment model was used to verify the workbook risk calculations prepared using one segment and simulation for comparison; Segment 8, Interstate 405 in the Seal Beach area (ORA I-405) and Evaluation Simulation 1 Existing Conditions was randomly chosen. The results for the MEIR compared to the spreadsheet calculation results are shown in Table 3-8 (Comparison of HARP 2 and Spreadsheet Calculation Results). The spreadsheet calculation results come from Tables 3-1, 3-2, and 3-3 and the HARP 2 electronic copies of the HARP 2 model results are contained in Appendix F. Table 3-8 demonstrates that the calculation procedures used herein match the HARP 2 model results within round-off differences and the spreadsheet calculations are slightly greater than the HARP 2 results. Both the HARP 2 and spreadsheet calculation risk for DPM shown in Table 3-8 were increased by 5 percent to account for the additional air toxics of acetaldehyde, benzene, 1,3-butadiene, and formaldehyde. Table 3-8 Comparison of HARP 2 and Spreadsheet Calculation Results RESIDENTIAL EXPOSURE DURATION HARP 2 CANCER RISK (per million) CALCULATION USED HEREIN CANCER RISK (per million) PERCENT DIFFERENCE OVER HARP 2 30-Year % 9-year % 70-year 1,060 1, % A/IRV15R28781.docx Page 46 of 52 November 18, 2015 Copyright 2015 Kleinfelder
57 3.4 MAXIMUM HYPOTHETICAL RECEPTOR RISKS Two sets of hypothetical receptors were evaluated for two of the Transportation Segments. The first set of hypothetical receptors was to assume that any receptor type could be located at the maximum impact point for Segment 8, ORA I-405 (Interstate 405 in the Seal Beach area). This maximum impact point was chosen as it was the highest risk receptor from any of the transportation segments. The maximum impact point was actually a residence, but hypothetically, there could be a worker receptor, a day care center, a school, or a senior center at such a receptor. In order to evaluate the range of possible risk, the risk for each of those receptor types was calculated assuming that the concentration was the maximum of any of the modeled receptors. The results are shown in Table 3-9 (Hypothetical Maximum Impact for Any Receptor Type [cancer risk per million exposed persons]). RECEPTOR TYPE 30-year Residential Table 3-9 Hypothetical Maximum Impact for Any Receptor Type (cancer risk per million exposed persons) SIMULATION 1 (EXISTING CONDITIONS) SIMULATION 2 (NO PROJECT ALTERNATIVE) SIMULATION 3 (PROPOSED PROJECT) SIMULATION 4 (2012 RTP/SCS WITH LOCAL INPUT ALTERNATIVE) SIMULATION 5 (INTENSIFIED LAND USE ALTERNATIVE) 1, Worker Day Care Center Children School Children Senior Center The results in Table 3-9 indicate 1) that the maximum risk for any receptor in the SCAG Region for any of the Simulations 2 through 5, is on the order of less than 10 percent when compared to Simulation 1- Existing Conditions and 2) that residential risk is always greater than the other risk types. The second set of hypothetical receptors evaluated was to assume that there is a residential receptor every 100 meters away from a transportation segment out to a distance of 1300 meters. The purpose of this analysis is to show how quickly the potential cancer risk decreases with A/IRV15R28781.docx Page 47 of 52 November 18, 2015 Copyright 2015 Kleinfelder
58 distance away from the transportation segment. For this analysis, Segment 4, LA I-710 in the Compton area, and Simulation 1 Existing Conditions, was evaluated assuming that there were residential receptors starting at 25 meters from the freeway edge, 50 meters, 100 meters, and then every 100 meters out to 1300 meters away from the freeway. The results of the analysis are shown in Table 3-10 (Hypothetical Maximum Impact for 30-year Residential Receptors as a Function of Distance for Existing Conditions and LA I-710 [cancer risk per million exposed persons]). This analysis assumed residential receptors because for a given impact concentration residential cancer risk is the largest of any receptor type A/IRV15R28781.docx Page 48 of 52 November 18, 2015 Copyright 2015 Kleinfelder
59 Table 3-10 Hypothetical Maximum Impact for 30-year Residential Receptors as a Function of Distance for Existing Conditions and LA I-710 (cancer risk per million exposed persons) DISTANCE FROM FREEWAY (meters) MAXIMUM IMPACT CONCENTRATION (ug/m 3 ) ASSUMED MEIR CANCER RISK HRA SIMULATION 1 (DPM + 5% for other chemicals) RATIO OF ASSUMED MEIR CANCER RISK TO RISK MODELED AT 100 METERS 25* , * , *Note that the AERMOD model was run only for 100-meter spacing, so the 25 and 50-meter results were interpolated using the exponential form of dispersion. The interpolation is based on Figure 1-1 of the CARB Air Quality and Land Use Handbook. 8 Table 3-10 shows that potential cancer risk rapidly decreases with distance away from the freeway. The potential cancer risk to a resident 500 meters away from the freeway is only 21 percent of the risk at 100 meters and less than a tenth the risk at 25 meters. The ratios shown in Table 3-10 can be used to evaluate potential hypothetical receptors for other freeways as well. 8 Air Quality and Land Use Handbook, April California Air Resources Board A/IRV15R28781.docx Page 49 of 52 November 18, 2015 Copyright 2015 Kleinfelder
60 This is because dispersion very near (i.e., a few hundred meters or less) an emission source (i.e., the freeway) is nearly independent of meteorological conditions. 3.5 HEALTH RISK COMPARISON TO THE RTP/SCS PEIR As stated, eight of the transportation segments evaluated were the same segments that were evaluated in the RTP/SCS PEIR. Table 3-11 shows the residential health risks presented in the RTP/SCS PEIR for the 2035 Preferred Plan compared to the No Project Alternative. The cancer risk shown in Table 3-11 (Health Risk Comparison to the RTP/SCS PEIR) is a 70-year residential risk because the RTP/SCS PEIR risk assessment methodology was based on 70-year exposure. The residential cancer risk for the No Project Alternative has decreased from the RTP/SCS PEIR. Table 3-11 Health Risk Comparison to the RTP/SCS PEIR SEG NO. TRANSPORTATION SEGMENT COUNTY / REGION RTP/SCS PEIR RESIDENTIAL 70- YEAR CANCER RISK (per million) NO PROJECT ALTERNATIVE RESIDENTIAL 70- YEAR CANCER RISK (per million) 1 IMP I-8 Imperial / El Centro LA I-710 Los Angeles / Compton LA SR-60 DB Los Angeles / Diamond Bar ORA I-405 Orange / Seal Beach RIV SR-91 Riverside / Corona SB I-15 ONT San Bernardino / Ontario SB SR-60 San Bernardino / Ontario VEN US-101 TO Ventura / Thousand Oaks The differences shown in Table 3-11 are due to two primary reasons. First, the emission factors for HDDT projected by the current version of the EMFAC model for 2040 are much less (on the order of 95 percent less) than the emission factors used in the RTP/SCS PEIR for The emission factors from the previous version of EMFAC used for the PEIR did not account for the dramatic decrease in diesel emissions as a result of the CARB diesel exhaust reduction program and the effectiveness of the new DPM control technologies. Secondly, the vehicle mileage projected by the current SCAG transportation demand model is different than A/IRV15R28781.docx Page 50 of 52 November 18, 2015 Copyright 2015 Kleinfelder
61 what was projected in the RTP/SCS PEIR because a more updated 2012 Base Year transportation network is being used for this 2016 RTP/SCS. As noted above, this 2012 Base Year transportation network includes the transportation projects included in the 2015 FTIP, adopted in September 2014, and transportation projects in the RTP/SCS as amended in September For example, the HD VMT for Segment 8, ORA I-405 was projected in the RTP/SCS PEIR to be about 50,000 miles per day in 2035, while the current model for the No Project Alternative predicts about 68,000 miles per day in 2040 for heavy duty diesel truck traffic. The combined result of these differences show a decrease in the overall risk to residential, worker and sensitive receptors in the current predictions when compared with the previous analysis. 3.6 ADDITIONAL HEALTH RISKS FROM VEHICLE EMISSIONS For this analysis, cancer risk was used as a surrogate for all of the potential health effects related to vehicle emissions. Vehicles emit many additional pollutants in addition to DPM, including criteria pollutants, the aforementioned key air toxics (i.e., acetaldehyde, benzene, 1,3-butadiene, formaldehyde), and other minor air toxic emissions. These compounds cause not only potential carcinogenic health effects but also non-carcinogenic acute (short-term) and chronic (long-term) health effects to the respiratory system, central nervous system, eyes, and immune system, and others. The non-carcinogenic effects are assessed by comparing the impact concentration to published Reference Exposure Levels (RELs). If the impact concentration is less than the REL, then potential non-carcinogenic health effects are not likely to occur. For vehicle emissions, the potential for carcinogenic effects is much greater than for non-cancer effects. This is most easily illustrated through examination of the REL for diesel exhaust. The REL for diesel exhaust published by CARB 9 is 5 ug/m 3. This is a chronic REL. If a person were exposed to diesel exhaust particulate at a chronic concentration of 5 ug/m 3, the residential cancer risk would be 4,000 in a million; a value much greater than the modeled cancer risk due to vehicle traffic on the worstcase transportation segments. Therefore, potential cancer risk is an adequate surrogate for all of the potential health effects due to vehicle emissions. 3.7 OTHER RISK ASSESSMENTS IN THE SOUTH COAST BASIN The cancer risk calculated for the 16 transportation segments can be compared to other regional estimates of cancer risk. One of the most comprehensive such studies is the Multiple Air Toxics 9 OEHHA Toxicity Criteria Database, Diesel Exhaust Particulate as of September 11, Available at A/IRV15R28781.docx Page 51 of 52 November 18, 2015 Copyright 2015 Kleinfelder
62 Exposure Study in the South Coast Air Basin, May 2015 (MATES-IV) 10 The MATES-IV study estimated basin-wide average cancer risk with actual monitored data at 10 sites in calendar year The basin-wide cancer risk calculated from the 2012 monitoring data and using the current (2015) risk assessment methodology (the same methodology used herein) for 30-year residential exposure was 1,023 in a million 11 caused mostly by DPM. The MATES-IV study also showed that cancer risk was greatest near major freeways and transportation corridors 12. Note that the MATES-IV study did not estimate future (2040) risk, but due to the dramatic reduction in DPM emissions from HDDT, the basin-wide cancer risk should be much less than found in Final Report, Multiple Air Toxics Exposure Study in the South Coast Air Basin, MATES-IV, May South Coast Air Quality Management District, available at last accessed September Ibid., Page Ibid., Page A/IRV15R28781.docx Page 52 of 52 November 18, 2015 Copyright 2015 Kleinfelder
63 APPENDIX A Location of Selected Transportation Segments
![LZ_T]^_S_T F W`^_ TS^_ [U JX HTZ_][ BLY\T]VSX H[`Z_aC C H K E L F D G B J N I M O!](/docs-images/95/123502802/images/64-0.jpg "CJEDNGJIM D FBDDD HBDDD Qggu DLF BKKLJOGHDNF MJKJOI FDHD ]NFB ]NGB ]NGM FDHD MW FDEF Ma MctgocrK `qsnf ]usggu Xcr wkc P]\T Xcr ]gswkeg Nqvpuz Mqvpfcsz ^jg kphqsocukqp kpenvfgf qp")


64 LZ_T]^_S_T F W`^_ TS^_ [U JX HTZ_][ BLY\T]VSX H[`Z_aC C H K E L F D G B J N I M O! CJEDNGJIM D FBDDD HBDDD Qggu DLF BKKLJOGHDNF MJKJOI FDHD ]NFB ]NGB ]NGM FDHD MW FDEF Ma MctgocrK `qsnf ]usggu Xcr wkc P]\T Xcr ]gswkeg Nqvpuz Mqvpfcsz ^jg kphqsocukqp kpenvfgf qp ujkt iscrjke sgrsgtgpucukqp jct dggp eqorkngf hsqo c wcskguz qh tqvsegt cpf kt tvdlgeu uq ejcpig xkujqvu pqukegc Vngkphgnfgs ocmgt pq sgrsgtgpucukqpt qs xcsscpukgtb gyrsgtt qs kornkgfb ct uq ceevscezb eqorngugpgttb ukognkpgttb qs skijut uq ujg vtg qh tvej kphqsocukqpc ^jkt fqevogpu kt pqu kpugpfgf hqs vtg ct c ncpf tvswgz rsqfveu pqs kt ku fgtkipgf qs kpugpfgf ct c eqptusveukqp fgtkip fqevogpuc ^jg vtg qs oktvtg qh ujg kphqsocukqp eqpuckpgf qp ujkt iscrjke sgrsgtgpucukqp kt cu ujg tqng sktm qh ujg rcsuz vtkpi qs oktvtkpi ujg kphqsocukqpc xxxcmngkphgnfgsceqo [\ZUPN^ YZCK FDEIHGJD O\L`YK O\L`Y MaK NSPNVPO MaK ZN^ FDEI VCSLRLY \CP\MP] QTWP YLXPK OgucknbZskikpcnCoyf QJKNJOR IJRGLM NGP LNP LDF Okgtgn Pyjcvtu Sgcnuj \ktm Lttgttogpu ]qvujgsp Ncnkhqspkc Lttqekcukqp qh Rqwgspogput \gikqpcn ^scptrqsucukqp [ncp QTR_\P GDE
![C H K E L F D G B J N I M O UdYd[ T`YZ FG Lb[[fYg \_ W[cd^`b]Y_Z BN^a[b\Y] I`e_dgC!](/docs-images/95/123502802/images/65-0.jpg "CJEDNGJIM E GBEEE IBEEE Siiw DLF BKKLJOGHDNF OKMKQJ GEIE _PGB _PHB _PHO GEIE OY GEFG Oc OeviqetM bsuph _wuiiw Zet yme R_^V Zet _iuymgi Psxrw Osxrheu `li mrjsuqewmsr mrgpxhih sr wlmv")


65 C H K E L F D G B J N I M O UdYd[ T`YZ FG Lb[[fYg \_ W[cd^`b]Y_Z BN^a[b\Y] I`e_dgC! CJEDNGJIM E GBEEE IBEEE Siiw DLF BKKLJOGHDNF OKMKQJ GEIE _PGB _PHB _PHO GEIE OY GEFG Oc OeviqetM bsuph _wuiiw Zet yme R_^V Zet _iuymgi Psxrw Osxrheu `li mrjsuqewmsr mrgpxhih sr wlmv kuetlmg uituivirwewmsr lev fiir gsqtmpih jusq e yeumiw sj vsxugiv erh mv vxfnigw ws glerki zmwlsxw rswmgic Xpimrjiphiu qeoiv rs uituivirwewmsrv su zeuuerwmivb i{tuivv su mqtpmihb ev ws eggxueg B gsqtpiwirivvb wmqipmrivvb su umklwv ws wli xvi sj vxgl mrjsuqewmsrc `lmv hsgxqirw mv rsw mrwirhih jsu xvi ev e perh vxuyi tushxgw rsu mv mw hivmkrih su mrwirhih ev e gsrvwuxgwmsr hivmkr hsgxqirwc `li xvi su qmvxvi sj wli mrjsuqewmsr gsrwemrih sr wlmv kuetlmg uituivirwewmsr mv ew wli vspi umvo sj wli teuw xvmrk su qmvxvmrk wli mrjsuqewmsrc zzzcopimrjiphiucgsq ]^\WRP` [\CM GEFJIHLE Q^Nb[M Q^Nb[ OcM PURPXRQ OcM \P` GEFJ XCUNTN[ ^CR^OR_ SVYR [NZRM QiwempdNhhmwmsrepCq{h HJJNVNRQHO LTKKWHX UKMPKQV JKVHNO NPS UTDFG Qmivip R{lexvw Uiepwl ^mvo Nvvivvqirw _sxwliur Pepmjsurme Nvvsgmewmsr sj Tsyiurqirwv GEFK ^`]D_P_ ]RV^ SVTa^R HDE
![N]aY_`aXaY FFE [] IX_`^] BO^` H]ZY\Y` I^b]acC D I J B H F E G E J C I L H K M!](/docs-images/95/123502802/images/66-0.jpg "CJEDNGJIM E GBEEE IBEEE Siiw DLF BKKLJOGHDNF OKMKQJ GEIE _PGB _PHB _PHO GEIE OY GEFG Oc OeviqetM bsuph _wuiiw Zet yme R_^V Zet _iuymgi Psxrw Osxrheu `li mrjsuqewmsr mrgpxhih sr")


66 N]aY_`aXaY FFE [] IX_`^] BO^` H]ZY\Y` I^b]acC D I J B H F E G E J C I L H K M! CJEDNGJIM E GBEEE IBEEE Siiw DLF BKKLJOGHDNF OKMKQJ GEIE _PGB _PHB _PHO GEIE OY GEFG Oc OeviqetM bsuph _wuiiw Zet yme R_^V Zet _iuymgi Psxrw Osxrheu `li mrjsuqewmsr mrgpxhih sr wlmv kuetlmg uituivirwewmsr lev fiir gsqtmpih jusq e yeumiw sj vsxugiv erh mv vxfnigw ws glerki zmwlsxw rswmgic Xpimrjiphiu qeoiv rs uituivirwewmsrv su zeuuerwmivb i{tuivv su mqtpmihb ev ws eggxueg B gsqtpiwirivvb wmqipmrivvb su umklwv ws wli xvi sj vxgl mrjsuqewmsrc `lmv hsgxqirw mv rsw mrwirhih jsu xvi ev e perh vxuyi tushxgw rsu mv mw hivmkrih su mrwirhih ev e gsrvwuxgwmsr hivmkr hsgxqirwc `li xvi su qmvxvi sj wli mrjsuqewmsr gsrwemrih sr wlmv kuetlmg uituivirwewmsr mv ew wli vspi umvo sj wli teuw xvmrk su qmvxvmrk wli mrjsuqewmsrc zzzcopimrjiphiucgsq ]^\WRP` [\CM GEFJIHLE Q^Nb[M Q^Nb[ OcM PURPXRQ OcM \P` GEFJ XCUNTN[ ^CR^OR_ SVYR [NZRM QiwempdNhhmwmsrepCq{h HJJNUNRQHO LSKKVHW TKMPKQU JKUHNO OH NDFFE Qmivip R{lexvw Uiepwl ^mvo Nvvivvqirw _sxwliur Pepmjsurme Nvvsgmewmsr sj Tsyiurqirwv GEFK ^`]D_P_ ]RV^ SVTa^R HDG
![D I J B H F E G E J C I L H K M PafZdefXfZ IGF ^a Lb`cfbaD abdf] b[ f]z ^afzdezyf^ba h^f] VU JG BQbe Ka\Z_Ze LbgafiC!](/docs-images/95/123502802/images/67-0.jpg "CJEDNGJIM D FBDDD HBDDD Qggu DLF BKKLJOGHDNF QNONSM FDHD ]NFB ]NGB ]NGM FDHD MW FDEF Ma MctgocrK `qsnf ]usggu Xcr wkc P]\T Xcr ]gswkeg Nqvpuz Mqvpfcsz ^jg kphqsocukqp kpenvfgf qp ujkt")


67 D I J B H F E G E J C I L H K M PafZdefXfZ IGF ^a Lb`cfbaD abdf] b[ f]z ^afzdezyf^ba h^f] VU JG BQbe Ka\Z_Ze LbgafiC! CJEDNGJIM D FBDDD HBDDD Qggu DLF BKKLJOGHDNF QNONSM FDHD ]NFB ]NGB ]NGM FDHD MW FDEF Ma MctgocrK `qsnf ]usggu Xcr wkc P]\T Xcr ]gswkeg Nqvpuz Mqvpfcsz ^jg kphqsocukqp kpenvfgf qp ujkt iscrjke sgrsgtgpucukqp jct dggp eqorkngf hsqo c wcskguz qh tqvsegt cpf kt tvdlgeu uq ejcpig xkujqvu pqukegc Vngkphgnfgs ocmgt pq sgrsgtgpucukqpt qs xcsscpukgtb gyrsgtt qs kornkgfb ct uq ceevscezb eqorngugpgttb ukognkpgttb qs skijut uq ujg vtg qh tvej kphqsocukqpc ^jkt fqevogpu kt pqu kpugpfgf hqs vtg ct c ncpf tvswgz rsqfveu pqs kt ku fgtkipgf qs kpugpfgf ct c eqptusveukqp fgtkip fqevogpuc ^jg vtg qs oktvtg qh ujg kphqsocukqp eqpuckpgf qp ujkt iscrjke sgrsgtgpucukqp kt cu ujg tqng sktm qh ujg rcsuz vtkpi qs oktvtkpi ujg kphqsocukqpc xxxcmngkphgnfgsceqo [\ZUPN^ YZCK FDEIHGJD O\L`YK O\L`Y MaK NSPNVPO MaK ZN^ FDEI VCSLRLY \CP\MP] QTWP YLXPK OgucknbZskikpcnCoyf VNORNSW MNWKPQ RKT QK PEIGF Okgtgn Pyjcvtu Sgcnuj \ktm Lttgttogpu ]qvujgsp Ncnkhqspkc Lttqekcukqp qh Rqwgspogput \gikqpcn ^scptrqsucukqp [ncp QTR_\P KEH
![UbWbY T_WX GE M`YYdWe ^YW` K[W]_^X IW` BP_a H^ZY\Ya J_c^beC E N P B M J I L I P D N R M Q S F G M C I O M G O H K M N D N R M Q S!](/docs-images/95/123502802/images/68-0.jpg "CJEDNGJIM D FBDDD HBDDD Qggu DLF BKKLJOGHDNF PLNLRK FDHD ]NFB ]NGB ]NGM FDHD MW FDEF Ma MctgocrK `qsnf ]usggu Xcr wkc P]\T Xcr ]gswkeg Nqvpuz Mqvpfcsz ^jg kphqsocukqp kpenvfgf qp ujkt")


68 UbWbY T_WX GE M`YYdWe ^YW` K[W]_^X IW` BP_a H^ZY\Ya J_c^beC E N P B M J I L I P D N R M Q S F G M C I O M G O H K M N D N R M Q S! CJEDNGJIM D FBDDD HBDDD Qggu DLF BKKLJOGHDNF PLNLRK FDHD ]NFB ]NGB ]NGM FDHD MW FDEF Ma MctgocrK `qsnf ]usggu Xcr wkc P]\T Xcr ]gswkeg Nqvpuz Mqvpfcsz ^jg kphqsocukqp kpenvfgf qp ujkt iscrjke sgrsgtgpucukqp jct dggp eqorkngf hsqo c wcskguz qh tqvsegt cpf kt tvdlgeu uq ejcpig xkujqvu pqukegc Vngkphgnfgs ocmgt pq sgrsgtgpucukqpt qs xcsscpukgtb gyrsgtt qs kornkgfb ct uq ceevscezb eqorngugpgttb ukognkpgttb qs skijut uq ujg vtg qh tvej kphqsocukqpc ^jkt fqevogpu kt pqu kpugpfgf hqs vtg ct c ncpf tvswgz rsqfveu pqs kt ku fgtkipgf qs kpugpfgf ct c eqptusveukqp fgtkip fqevogpuc ^jg vtg qs oktvtg qh ujg kphqsocukqp eqpuckpgf qp ujkt iscrjke sgrsgtgpucukqp kt cu ujg tqng sktm qh ujg rcsuz vtkpi qs oktvtkpi ujg kphqsocukqpc xxxcmngkphgnfgsceqo [\ZUPN^ YZCK FDEIHGJD O\L`YK O\L`Y MaK NSPNVPO MaK ZN^ FDEI VCSLRLY \CP\MP] QTWP YLXPK OgucknbZskikpcnCoyf ULNQLRV KLVHOP QHS PH UTDGE KI Okgtgn Pyjcvtu Sgcnuj \ktm Lttgttogpu ]qvujgsp Ncnkhqspkc Lttqekcukqp qh Rqwgspogput \gikqpcn ^scptrqsucukqp [ncp QTR_\P HDF
![TeYe\ SbY[ FE Jc\\gYh a\yc dbfe^ I` Obae\ Ye R\Z_ S[ BNbd Ga]\`\dC D I J B H F E G E J C I L H K M!](/docs-images/95/123502802/images/69-0.jpg "CJEDNGJIM E GBEEE IBEEE Siiw DLF BKKLJOGHDNF NIKIPH GEIE _PGB _PHB _PHO GEIE OY GEFG Oc OeviqetM bsuph _wuiiw Zet yme R_^V Zet _iuymgi Psxrw Osxrheu `li mrjsuqewmsr mrgpxhih sr wlmv")


69 TeYe\ SbY[ FE Jc\\gYh a\yc dbfe^ I` Obae\ Ye R\Z_ S[ BNbd Ga]\`\dC D I J B H F E G E J C I L H K M! CJEDNGJIM E GBEEE IBEEE Siiw DLF BKKLJOGHDNF NIKIPH GEIE _PGB _PHB _PHO GEIE OY GEFG Oc OeviqetM bsuph _wuiiw Zet yme R_^V Zet _iuymgi Psxrw Osxrheu `li mrjsuqewmsr mrgpxhih sr wlmv kuetlmg uituivirwewmsr lev fiir gsqtmpih jusq e yeumiw sj vsxugiv erh mv vxfnigw ws glerki zmwlsxw rswmgic Xpimrjiphiu qeoiv rs uituivirwewmsrv su zeuuerwmivb i{tuivv su mqtpmihb ev ws eggxueg B gsqtpiwirivvb wmqipmrivvb su umklwv ws wli xvi sj vxgl mrjsuqewmsrc `lmv hsgxqirw mv rsw mrwirhih jsu xvi ev e perh vxuyi tushxgw rsu mv mw hivmkrih su mrwirhih ev e gsrvwuxgwmsr hivmkr hsgxqirwc `li xvi su qmvxvi sj wli mrjsuqewmsr gsrwemrih sr wlmv kuetlmg uituivirwewmsr mv ew wli vspi umvo sj wli teuw xvmrk su qmvxvmrk wli mrjsuqewmsrc zzzcopimrjiphiucgsq ]^\WRP` [\CM GEFJIHLE Q^Nb[M Q^Nb[ OcM PURPXRQ OcM \P` GEFJ XCUNTN[ ^CR^OR_ SVYR [NZRM QiwempdNhhmwmsrepCq{h GHHMUMQPGN JSIIWGX TIKOIPU HIUGMN NG TSDFE TQVUL IN OQPUI Qmivip R{lexvw Uiepwl ^mvo Nvvivvqirw _sxwliur Pepmjsurme Nvvsgmewmsr sj Tsyiurqirwv GEFK ^`]D_P_ ]RV^ SVTa^R GDF
![N_c[abcXc[ F ^_ RaX_][ _[Xa ^_c[ab[yc^`_ `\ TS FG X_Z TS EE BRaX_][ I`d_ceC C I D G F E B H K G J L!](/docs-images/95/123502802/images/70-0.jpg "CJEDNGJIM E GBEEE IBEEE Siiw DLF BKKLJOGHDNF OKMKQJ GEIE _PGB _PHB _PHO GEIE OY GEFG Oc OeviqetM bsuph _wuiiw Zet yme R_^V Zet _iuymgi Psxrw Osxrheu `li mrjsuqewmsr mrgpxhih sr wlmv")


70 N_c[abcXc[ F ^_ RaX_][ _[Xa ^_c[ab[yc^`_ `\ TS FG X_Z TS EE BRaX_][ I`d_ceC C I D G F E B H K G J L! CJEDNGJIM E GBEEE IBEEE Siiw DLF BKKLJOGHDNF OKMKQJ GEIE _PGB _PHB _PHO GEIE OY GEFG Oc OeviqetM bsuph _wuiiw Zet yme R_^V Zet _iuymgi Psxrw Osxrheu `li mrjsuqewmsr mrgpxhih sr wlmv kuetlmg uituivirwewmsr lev fiir gsqtmpih jusq e yeumiw sj vsxugiv erh mv vxfnigw ws glerki zmwlsxw rswmgic Xpimrjiphiu qeoiv rs uituivirwewmsrv su zeuuerwmivb i{tuivv su mqtpmihb ev ws eggxueg B gsqtpiwirivvb wmqipmrivvb su umklwv ws wli xvi sj vxgl mrjsuqewmsrc `lmv hsgxqirw mv rsw mrwirhih jsu xvi ev e perh vxuyi tushxgw rsu mv mw hivmkrih su mrwirhih ev e gsrvwuxgwmsr hivmkr hsgxqirwc `li xvi su qmvxvi sj wli mrjsuqewmsr gsrwemrih sr wlmv kuetlmg uituivirwewmsr mv ew wli vspi umvo sj wli teuw xvmrk su qmvxvmrk wli mrjsuqewmsrc zzzcopimrjiphiucgsq ]^\WRP` [\CM GEFJIHLE Q^Nb[M Q^Nb[ OcM PURPXRQ OcM \P` GEFJ XCUNTN[ ^CR^OR_ SVYR [NZRM QiwempdNhhmwmsrepCq{h HJJNUNRQHO LSKKVHW TKMPKQU JKUHNO RSH NDF Qmivip R{lexvw Uiepwl ^mvo Nvvivvqirw _sxwliur Pepmjsurme Nvvsgmewmsr sj Tsyiurqirwv GEFK ^`]D_P_ ]RV^ SVTa^R HDG
![D K M B J H G I G M C K O J N P E L F J H G C K O J N P Qbf\defZf\ GFH `b X\Za L\Z[_D \Zef c] f_\ QEIFH `bf\d[_zb^\ BUdZb^\ McgbfhC!](/docs-images/95/123502802/images/71-0.jpg "CJEDNGJIM D FBDDD HBDDD Qggu DLF BKKLJOGHDNF ROPOTN FDHD ]NFB ]NGB ]NGM FDHD MW FDEF Ma MctgocrK `qsnf ]usggu Xcr wkc P]\T Xcr ]gswkeg Nqvpuz Mqvpfcsz ^jg kphqsocukqp kpenvfgf qp ujkt")


71 D K M B J H G I G M C K O J N P E L F J H G C K O J N P Qbf\defZf\ GFH `b X\Za L\Z[_D \Zef c] f_\ QEIFH `bf\d[_zb^\ BUdZb^\ McgbfhC! CJEDNGJIM D FBDDD HBDDD Qggu DLF BKKLJOGHDNF ROPOTN FDHD ]NFB ]NGB ]NGM FDHD MW FDEF Ma MctgocrK `qsnf ]usggu Xcr wkc P]\T Xcr ]gswkeg Nqvpuz Mqvpfcsz ^jg kphqsocukqp kpenvfgf qp ujkt iscrjke sgrsgtgpucukqp jct dggp eqorkngf hsqo c wcskguz qh tqvsegt cpf kt tvdlgeu uq ejcpig xkujqvu pqukegc Vngkphgnfgs ocmgt pq sgrsgtgpucukqpt qs xcsscpukgtb gyrsgtt qs kornkgfb ct uq ceevscezb eqorngugpgttb ukognkpgttb qs skijut uq ujg vtg qh tvej kphqsocukqpc ^jkt fqevogpu kt pqu kpugpfgf hqs vtg ct c ncpf tvswgz rsqfveu pqs kt ku fgtkipgf qs kpugpfgf ct c eqptusveukqp fgtkip fqevogpuc ^jg vtg qs oktvtg qh ujg kphqsocukqp eqpuckpgf qp ujkt iscrjke sgrsgtgpucukqp kt cu ujg tqng sktm qh ujg rcsuz vtkpi qs oktvtkpi ujg kphqsocukqpc xxxcmngkphgnfgsceqo [\ZUPN^ YZCK FDEIHGJD O\L`YK O\L`Y MaK NSPNVPO MaK ZN^ FDEI VCSLRLY \CP\MP] QTWP YLXPK OgucknbZskikpcnCoyf XOPSOTY NOYKQR SKV UWK QEGFH Okgtgn Pyjcvtu Sgcnuj \ktm Lttgttogpu ]qvujgsp Ncnkhqspkc Lttqekcukqp qh Rqwgspogput \gikqpcn ^scptrqsucukqp [ncp QTR_\P KEJ
![O`d\bcdZd\ FE _` d^\ IZ``_`] Zb\Z BT_f\bc_[\ Jae`dgC C F M E I J F D E B H L G K N!](/docs-images/95/123502802/images/72-0.jpg "CJEDNGJIM E GBEEE IBEEE Siiw DLF BKKLJOGHDNF PLNLRK GEIE _PGB _PHB _PHO GEIE OY GEFG Oc OeviqetM bsuph _wuiiw Zet yme R_^V Zet _iuymgi Psxrw Osxrheu `li mrjsuqewmsr mrgpxhih sr wlmv")


72 O`d\bcdZd\ FE _` d^\ IZ``_`] Zb\Z BT_f\bc_[\ Jae`dgC C F M E I J F D E B H L G K N! CJEDNGJIM E GBEEE IBEEE Siiw DLF BKKLJOGHDNF PLNLRK GEIE _PGB _PHB _PHO GEIE OY GEFG Oc OeviqetM bsuph _wuiiw Zet yme R_^V Zet _iuymgi Psxrw Osxrheu `li mrjsuqewmsr mrgpxhih sr wlmv kuetlmg uituivirwewmsr lev fiir gsqtmpih jusq e yeumiw sj vsxugiv erh mv vxfnigw ws glerki zmwlsxw rswmgic Xpimrjiphiu qeoiv rs uituivirwewmsrv su zeuuerwmivb i{tuivv su mqtpmihb ev ws eggxueg B gsqtpiwirivvb wmqipmrivvb su umklwv ws wli xvi sj vxgl mrjsuqewmsrc `lmv hsgxqirw mv rsw mrwirhih jsu xvi ev e perh vxuyi tushxgw rsu mv mw hivmkrih su mrwirhih ev e gsrvwuxgwmsr hivmkr hsgxqirwc `li xvi su qmvxvi sj wli mrjsuqewmsr gsrwemrih sr wlmv kuetlmg uituivirwewmsr mv ew wli vspi umvo sj wli teuw xvmrk su qmvxvmrk wli mrjsuqewmsrc zzzcopimrjiphiucgsq ]^\WRP` [\CM GEFJIHLE Q^Nb[M Q^Nb[ OcM PURPXRQ OcM \P` GEFJ XCUNTN[ ^CR^OR_ SVYR [NZRM QiwempdNhhmwmsrepCq{h HKKOVOSRHP MTLLXHY ULNQLRV KLVHOP TOW ODFE Qmivip R{lexvw Uiepwl ^mvo Nvvivvqirw _sxwliur Pepmjsurme Nvvsgmewmsr sj Tsyiurqirwv GEFK ^`]D_P_ ]RV^ SVTa^R HDG
![N`d\bcdYd\ FG `\Yb U\_\Ze^Y BS]f\bc][\ Iae`dgC D J Q H M N J G H B L P K O R E F K C J H I L B L P K O R!](/docs-images/95/123502802/images/73-0.jpg "CJEDNGJIM E GBEEE IBEEE Siiw DLF BKKLJOGHDNF OKMKQJ GEIE _PGB _PHB _PHO GEIE OY GEFG Oc OeviqetM bsuph _wuiiw Zet yme R_^V Zet _iuymgi Psxrw Osxrheu `li mrjsuqewmsr mrgpxhih sr wlmv")


73 N`d\bcdYd\ FG `\Yb U\_\Ze^Y BS]f\bc][\ Iae`dgC D J Q H M N J G H B L P K O R E F K C J H I L B L P K O R! CJEDNGJIM E GBEEE IBEEE Siiw DLF BKKLJOGHDNF OKMKQJ GEIE _PGB _PHB _PHO GEIE OY GEFG Oc OeviqetM bsuph _wuiiw Zet yme R_^V Zet _iuymgi Psxrw Osxrheu `li mrjsuqewmsr mrgpxhih sr wlmv kuetlmg uituivirwewmsr lev fiir gsqtmpih jusq e yeumiw sj vsxugiv erh mv vxfnigw ws glerki zmwlsxw rswmgic Xpimrjiphiu qeoiv rs uituivirwewmsrv su zeuuerwmivb i{tuivv su mqtpmihb ev ws eggxueg B gsqtpiwirivvb wmqipmrivvb su umklwv ws wli xvi sj vxgl mrjsuqewmsrc `lmv hsgxqirw mv rsw mrwirhih jsu xvi ev e perh vxuyi tushxgw rsu mv mw hivmkrih su mrwirhih ev e gsrvwuxgwmsr hivmkr hsgxqirwc `li xvi su qmvxvi sj wli mrjsuqewmsr gsrwemrih sr wlmv kuetlmg uituivirwewmsr mv ew wli vspi umvo sj wli teuw xvmrk su qmvxvmrk wli mrjsuqewmsrc zzzcopimrjiphiucgsq ]^\WRP` [\CM GEFJIHLE Q^Nb[M Q^Nb[ OcM PURPXRQ OcM \P` GEFJ XCUNTN[ ^CR^OR_ SVYR [NZRM QiwempdNhhmwmsrepCq{h HJJNUNRQHO LSKKWHX TKMPKQU JKUHNO SNV NDFG Qmivip R{lexvw Uiepwl ^mvo Nvvivvqirw _sxwliur Pepmjsurme Nvvsgmewmsr sj Tsyiurqirwv GEFK ^`]D_P_ ]RV^ SVTa^R HDFE
![F G L B I N L G N H K L M C M Q L P S E K R I N O K H I C M Q L P S D N G L J I C M Q L P S UcXc[ T`XZ HF Ma[[fXg ^_ J`a`_XD [Xbc `\ c][ ^_c[ab[yc^`_ f^c] UT GF BT^e[ab^Z[ J`d_cgC!](/docs-images/95/123502802/images/74-0.jpg "CJEDNGJIM D FBDDD HBDDD Qggu DLF BKKLJOGHDNF PLNLRK FDHD ]NFB ]NGB ]NGM FDHD MW FDEF Ma MctgocrK `qsnf ]usggu Xcr wkc P]\T Xcr ]gswkeg Nqvpuz Mqvpfcsz ^jg kphqsocukqp kpenvfgf qp ujkt iscrjke")


74 F G L B I N L G N H K L M C M Q L P S E K R I N O K H I C M Q L P S D N G L J I C M Q L P S UcXc[ T`XZ HF Ma[[fXg ^_ J`a`_XD [Xbc `\ c][ ^_c[ab[yc^`_ f^c] UT GF BT^e[ab^Z[ J`d_cgC! CJEDNGJIM D FBDDD HBDDD Qggu DLF BKKLJOGHDNF PLNLRK FDHD ]NFB ]NGB ]NGM FDHD MW FDEF Ma MctgocrK `qsnf ]usggu Xcr wkc P]\T Xcr ]gswkeg Nqvpuz Mqvpfcsz ^jg kphqsocukqp kpenvfgf qp ujkt iscrjke sgrsgtgpucukqp jct dggp eqorkngf hsqo c wcskguz qh tqvsegt cpf kt tvdlgeu uq ejcpig xkujqvu pqukegc Vngkphgnfgs ocmgt pq sgrsgtgpucukqpt qs xcsscpukgtb gyrsgtt qs kornkgfb ct uq ceevscezb eqorngugpgttb ukognkpgttb qs skijut uq ujg vtg qh tvej kphqsocukqpc ^jkt fqevogpu kt pqu kpugpfgf hqs vtg ct c ncpf tvswgz rsqfveu pqs kt ku fgtkipgf qs kpugpfgf ct c eqptusveukqp fgtkip fqevogpuc ^jg vtg qs oktvtg qh ujg kphqsocukqp eqpuckpgf qp ujkt iscrjke sgrsgtgpucukqp kt cu ujg tqng sktm qh ujg rcsuz vtkpi qs oktvtkpi ujg kphqsocukqpc xxxcmngkphgnfgsceqo [\ZUPN^ YZCK FDEIHGJD O\L`YK O\L`Y MaK NSPNVPO MaK ZN^ FDEI VCSLRLY \CP\MP] QTWP YLXPK OgucknbZskikpcnCoyf ULNQLRV KLVIOP QIS TOW UTEHF Okgtgn Pyjcvtu Sgcnuj \ktm Lttgttogpu ]qvujgsp Ncnkhqspkc Lttqekcukqp qh Rqwgspogput \gikqpcn ^scptrqsucukqp [ncp QTR_\P IEFF
![D E I B G K I E K F H I J C J M I L N N[_Y]^_W_Y EG Z[ R[_W]Z\ BUW[ IY][W]XZ[\ J\`[_aC!](/docs-images/95/123502802/images/75-0.jpg "CJEDNGJIM D FBDDD HBDDD Qggu DLF BKKLJOGHDNF OLMLQK FDHD ]NFB ]NGB ]NGM FDHD MW FDEF Ma MctgocrK `qsnf ]usggu Xcr wkc P]\T Xcr ]gswkeg Nqvpuz Mqvpfcsz ^jg kphqsocukqp kpenvfgf qp")


75 D E I B G K I E K F H I J C J M I L N N[_Y]^_W_Y EG Z[ R[_W]Z\ BUW[ IY][W]XZ[\ J\`[_aC! CJEDNGJIM D FBDDD HBDDD Qggu DLF BKKLJOGHDNF OLMLQK FDHD ]NFB ]NGB ]NGM FDHD MW FDEF Ma MctgocrK `qsnf ]usggu Xcr wkc P]\T Xcr ]gswkeg Nqvpuz Mqvpfcsz ^jg kphqsocukqp kpenvfgf qp ujkt iscrjke sgrsgtgpucukqp jct dggp eqorkngf hsqo c wcskguz qh tqvsegt cpf kt tvdlgeu uq ejcpig xkujqvu pqukegc Vngkphgnfgs ocmgt pq sgrsgtgpucukqpt qs xcsscpukgtb gyrsgtt qs kornkgfb ct uq ceevscezb eqorngugpgttb ukognkpgttb qs skijut uq ujg vtg qh tvej kphqsocukqpc ^jkt fqevogpu kt pqu kpugpfgf hqs vtg ct c ncpf tvswgz rsqfveu pqs kt ku fgtkipgf qs kpugpfgf ct c eqptusveukqp fgtkip fqevogpuc ^jg vtg qs oktvtg qh ujg kphqsocukqp eqpuckpgf qp ujkt iscrjke sgrsgtgpucukqp kt cu ujg tqng sktm qh ujg rcsuz vtkpi qs oktvtkpi ujg kphqsocukqpc xxxcmngkphgnfgsceqo [\ZUPN^ YZCK FDEIHGJD O\L`YK O\L`Y MaK NSPNVPO MaK ZN^ FDEI VCSLRLY \CP\MP] QTWP YLXPK OgucknbZskikpcnCoyf ULMPLQV KLVHNO PHS UI NDEG RQVHTNR Okgtgn Pyjcvtu Sgcnuj \ktm Lttgttogpu ]qvujgsp Ncnkhqspkc Lttqekcukqp qh Rqwgspogput \gikqpcn ^scptrqsucukqp [ncp QTR_\P HDEF
![Oae]cdeZe] EG _a e^] W_[ebcg_``] Zc]Z BUZa I]caZc\_ab JbfaehC D E I B G K I E K F H I J C J M I L N!](/docs-images/95/123502802/images/76-0.jpg "CJEDNGJIM E GBEEE IBEEE Siiw DLF BKKLJOGHDNF PLNLRK GEIE _PGB _PHB _PHO GEIE OY GEFG Oc OeviqetM bsuph _wuiiw Zet yme R_^V Zet _iuymgi Psxrw Osxrheu `li mrjsuqewmsr mrgpxhih sr wlmv")


76 Oae]cdeZe] EG _a e^] W_[ebcg_``] Zc]Z BUZa I]caZc\_ab JbfaehC D E I B G K I E K F H I J C J M I L N! CJEDNGJIM E GBEEE IBEEE Siiw DLF BKKLJOGHDNF PLNLRK GEIE _PGB _PHB _PHO GEIE OY GEFG Oc OeviqetM bsuph _wuiiw Zet yme R_^V Zet _iuymgi Psxrw Osxrheu `li mrjsuqewmsr mrgpxhih sr wlmv kuetlmg uituivirwewmsr lev fiir gsqtmpih jusq e yeumiw sj vsxugiv erh mv vxfnigw ws glerki zmwlsxw rswmgic Xpimrjiphiu qeoiv rs uituivirwewmsrv su zeuuerwmivb i{tuivv su mqtpmihb ev ws eggxueg B gsqtpiwirivvb wmqipmrivvb su umklwv ws wli xvi sj vxgl mrjsuqewmsrc `lmv hsgxqirw mv rsw mrwirhih jsu xvi ev e perh vxuyi tushxgw rsu mv mw hivmkrih su mrwirhih ev e gsrvwuxgwmsr hivmkr hsgxqirwc `li xvi su qmvxvi sj wli mrjsuqewmsr gsrwemrih sr wlmv kuetlmg uituivirwewmsr mv ew wli vspi umvo sj wli teuw xvmrk su qmvxvmrk wli mrjsuqewmsrc zzzcopimrjiphiucgsq ]^\WRP` [\CM GEFJIHLE Q^Nb[M Q^Nb[ OcM PURPXRQ OcM \P` GEFJ XCUNTN[ ^CR^OR_ SVYR [NZRM QiwempdNhhmwmsrepCq{h HKKOVOSRHP MTLLXHY ULNQLRV KLVHOP UI ODEG WOJVSTWOPPL Qmivip R{lexvw Uiepwl ^mvo Nvvivvqirw _sxwliur Pepmjsurme Nvvsgmewmsr sj Tsyiurqirwv GEFK ^`]D_P_ ]RV^ SVTa^R HDEF
![Yg[g^ Xd[] JF Pe^^i[j bc Vcg[ebdD i^fg d_ ga^ REGI bcg^e\a[c`^ BY[c L^ec[e]bcd MdhcgjC E F J B H L J F L G I J K C K O J N Q D I P H L M I G H C K O J N Q!](/docs-images/95/123502802/images/77-0.jpg "CJEDNGJIM D FBDDD HBDDD Qggu DLF BKKLJOGHDNF SOQOUN FDHD ]NFB ]NGB ]NGM FDHD MW FDEF Ma MctgocrK `qsnf ]usggu Xcr wkc P]\T Xcr ]gswkeg Nqvpuz Mqvpfcsz ^jg kphqsocukqp kpenvfgf qp ujkt iscrjke")


77 Yg[g^ Xd[] JF Pe^^i[j bc Vcg[ebdD i^fg d_ ga^ REGI bcg^e\a[c`^ BY[c L^ec[e]bcd MdhcgjC E F J B H L J F L G I J K C K O J N Q D I P H L M I G H C K O J N Q! CJEDNGJIM D FBDDD HBDDD Qggu DLF BKKLJOGHDNF SOQOUN FDHD ]NFB ]NGB ]NGM FDHD MW FDEF Ma MctgocrK `qsnf ]usggu Xcr wkc P]\T Xcr ]gswkeg Nqvpuz Mqvpfcsz ^jg kphqsocukqp kpenvfgf qp ujkt iscrjke sgrsgtgpucukqp jct dggp eqorkngf hsqo c wcskguz qh tqvsegt cpf kt tvdlgeu uq ejcpig xkujqvu pqukegc Vngkphgnfgs ocmgt pq sgrsgtgpucukqpt qs xcsscpukgtb gyrsgtt qs kornkgfb ct uq ceevscezb eqorngugpgttb ukognkpgttb qs skijut uq ujg vtg qh tvej kphqsocukqpc ^jkt fqevogpu kt pqu kpugpfgf hqs vtg ct c ncpf tvswgz rsqfveu pqs kt ku fgtkipgf qs kpugpfgf ct c eqptusveukqp fgtkip fqevogpuc ^jg vtg qs oktvtg qh ujg kphqsocukqp eqpuckpgf qp ujkt iscrjke sgrsgtgpucukqp kt cu ujg tqng sktm qh ujg rcsuz vtkpi qs oktvtkpi ujg kphqsocukqpc xxxcmngkphgnfgsceqo [\ZUPN^ YZCK FDEIHGJD O\L`YK O\L`Y MaK NSPNVPO MaK ZN^ FDEI VCSLRLY \CP\MP] QTWP YLXPK OgucknbZskikpcnCoyf YOQTOUZ NOZKRS TKW YL YXEJF Okgtgn Pyjcvtu Sgcnuj \ktm Lttgttogpu ]qvujgsp Ncnkhqspkc Lttqekcukqp qh Rqwgspogput \gikqpcn ^scptrqsucukqp [ncp QTR_\P KEGH
![C E F I J H D B G J F I K XV FEF Mc^^g\h `a V\a Ie^a\f^adec\ a^\c d_^ Y^adec\ O\c]bc BY^adec\ JbeadhC!](/docs-images/95/123502802/images/78-0.jpg "CJEDNGJIM E GBEEE IBEEE Siiw DLF BKKLJOGHDNF QLNLSK GEIE _PGB _PHB _PHO GEIE OY GEFG Oc OeviqetM bsuph _wuiiw Zet yme R_^V Zet _iuymgi Psxrw Osxrheu `li mrjsuqewmsr mrgpxhih sr wlmv")


78 C E F I J H D B G J F I K XV FEF Mc^^g\h `a V\a Ie^a\f^adec\ a^\c d_^ Y^adec\ O\c]bc BY^adec\ JbeadhC! CJEDNGJIM E GBEEE IBEEE Siiw DLF BKKLJOGHDNF QLNLSK GEIE _PGB _PHB _PHO GEIE OY GEFG Oc OeviqetM bsuph _wuiiw Zet yme R_^V Zet _iuymgi Psxrw Osxrheu `li mrjsuqewmsr mrgpxhih sr wlmv kuetlmg uituivirwewmsr lev fiir gsqtmpih jusq e yeumiw sj vsxugiv erh mv vxfnigw ws glerki zmwlsxw rswmgic Xpimrjiphiu qeoiv rs uituivirwewmsrv su zeuuerwmivb i{tuivv su mqtpmihb ev ws eggxueg B gsqtpiwirivvb wmqipmrivvb su umklwv ws wli xvi sj vxgl mrjsuqewmsrc `lmv hsgxqirw mv rsw mrwirhih jsu xvi ev e perh vxuyi tushxgw rsu mv mw hivmkrih su mrwirhih ev e gsrvwuxgwmsr hivmkr hsgxqirwc `li xvi su qmvxvi sj wli mrjsuqewmsr gsrwemrih sr wlmv kuetlmg uituivirwewmsr mv ew wli vspi umvo sj wli teuw xvmrk su qmvxvmrk wli mrjsuqewmsrc zzzcopimrjiphiucgsq ]^\WRP` [\CM GEFJIHLE Q^Nb[M Q^Nb[ OcM PURPXRQ OcM \P` GEFJ XCUNTN[ ^CR^OR_ SVYR [NZRM QiwempdNhhmwmsrepCq{h HKKPWPTSHQ MULLZH[ VLNRLSW KLWHPQ YLS XVDFEF VHS IXLSHYLSWXUH Qmivip R{lexvw Uiepwl ^mvo Nvvivvqirw _sxwliur Pepmjsurme Nvvsgmewmsr sj Tsyiurqirwv GEFK ^`]D_P_ ]RV^ SVTa^R HDFG
![\Z GFG Og``k^l ce [bfjh^e_ W^dhD `^hi fa ZY HI B]`eijg^ LfjeilC E G J N O L F C K O J N P D K M B J H G I G M C K O J N P!](/docs-images/95/123502802/images/79-0.jpg "CJEDNGJIM D FBDDD HBDDD Qggu DLF BKKLJOGHDNF TNPNVM FDHD ]NFB ]NGB ]NGM FDHD MW FDEF Ma MctgocrK `qsnf ]usggu Xcr wkc P]\T Xcr ]gswkeg Nqvpuz Mqvpfcsz ^jg kphqsocukqp kpenvfgf qp ujkt")


79 \Z GFG Og``k^l ce [bfjh^e_ W^dhD `^hi fa ZY HI B]`eijg^ LfjeilC E G J N O L F C K O J N P D K M B J H G I G M C K O J N P! CJEDNGJIM D FBDDD HBDDD Qggu DLF BKKLJOGHDNF TNPNVM FDHD ]NFB ]NGB ]NGM FDHD MW FDEF Ma MctgocrK `qsnf ]usggu Xcr wkc P]\T Xcr ]gswkeg Nqvpuz Mqvpfcsz ^jg kphqsocukqp kpenvfgf qp ujkt iscrjke sgrsgtgpucukqp jct dggp eqorkngf hsqo c wcskguz qh tqvsegt cpf kt tvdlgeu uq ejcpig xkujqvu pqukegc Vngkphgnfgs ocmgt pq sgrsgtgpucukqpt qs xcsscpukgtb gyrsgtt qs kornkgfb ct uq ceevscezb eqorngugpgttb ukognkpgttb qs skijut uq ujg vtg qh tvej kphqsocukqpc ^jkt fqevogpu kt pqu kpugpfgf hqs vtg ct c ncpf tvswgz rsqfveu pqs kt ku fgtkipgf qs kpugpfgf ct c eqptusveukqp fgtkip fqevogpuc ^jg vtg qs oktvtg qh ujg kphqsocukqp eqpuckpgf qp ujkt iscrjke sgrsgtgpucukqp kt cu ujg tqng sktm qh ujg rcsuz vtkpi qs oktvtkpi ujg kphqsocukqpc xxxcmngkphgnfgsceqo [\ZUPN^ YZCK FDEIHGJD O\L`YK O\L`Y MaK NSPNVPO MaK ZN^ FDEI VCSLRLY \CP\MP] QTWP YLXPK OgucknbZskikpcnCoyf ZNPUNV[ MN[KRT UKX ]NV \ZEGFG [QW\ZKVM WKSZ Okgtgn Pyjcvtu Sgcnuj \ktm Lttgttogpu ]qvujgsp Ncnkhqspkc Lttqekcukqp qh Rqwgspogput \gikqpcn ^scptrqsucukqp [ncp QTR_\P KEGJ
80 APPENDIX B for Each Transportation Segment and Evaluation Simulation
81 Client: SOUTHERN CALIFORNIA ASSOCIATION OF GOVERNMENTS Project: Regional Transportation Plan Risk Assessment Emissions EMFAC2014 (v1.0.7) Emissions Inventory Original Segment LM VMT/day HD VMT/day Region Type: County IMP I-8 just east of El Centro Eastbound 18,222 3,592 Region: Imperial IMP I-8 just east of El Centro Westbound 21,350 3,740 Calendar Year: 2015 *IMP I-8 just east of El Centro Season: Annual Total Segment Length Eastbound 1.51 miles Vehicle Classification: EMFAC2007 Categories Total Segment Length Westbound 1.51 miles Units: miles/day for VMT,lb/day for Emissions, 1000 gallons/day for Fuel Consumption Emissions per Volume Source for 1-mile segment Model Eastbound Westbound Emission Factor Eastbound Westbound Eastbound Westbound Eastbound Westbound Region CalYr VehClass MdlYr Speed Fuel VMT Diesel VMT/day Diesel VMT/day PM10_RUNEX No. of Vol Sources No. of Vol Sources g/sec g/sec Imperial 2015 HHDT Aggregated 55 GAS Imperial 2015 HHDT Aggregated 55 DSL E E-05 HHDT Total Imperial 2015 LDA Aggregated 65 GAS Imperial 2015 LDA Aggregated 65 DSL Imperial 2015 LDT1 Aggregated 65 GAS Imperial 2015 LDT1 Aggregated 65 DSL Imperial 2015 LDT2 Aggregated 65 GAS Imperial 2015 LDT2 Aggregated 65 DSL Imperial 2015 LHDT1 Aggregated 65 GAS Imperial 2015 LHDT1 Aggregated 65 DSL Imperial 2015 LHDT2 Aggregated 65 GAS Imperial 2015 LHDT2 Aggregated 65 DSL Imperial 2015 MDV Aggregated 65 GAS Imperial 2015 MDV Aggregated 65 DSL Imperial 2015 MH Aggregated 65 GAS Imperial 2015 MH Aggregated 65 DSL Imperial 2015 MHDT Aggregated 65 GAS Imperial 2015 MHDT Aggregated 65 DSL Imperial 2015 OBUS Aggregated 65 GAS Imperial 2015 OBUS Aggregated 65 DSL Imperial 2015 SBUS Aggregated 55 GAS Imperial 2015 SBUS Aggregated 55 DSL Imperial 2015 UBUS Aggregated 65 GAS Imperial 2015 UBUS Aggregated 65 DSL LM Total Total LM Diesel Emissions E E-05 Total Diesel Emissions Total Emissions per Volume Source for Modeling 3.97E E-05 Scenario BY Copyright 2015 Kleinfelder Page 1 of 16 Imperial County I8 El Centro 11/18/2015
82 Client: SOUTHERN CALIFORNIA ASSOCIATION OF GOVERNMENTS Project: Regional Transportation Plan Risk Assessment Emissions EMFAC2014 (v1.0.7) Emissions Inventory Original Segment LM VMT/day HD VMT/day Region Type: County IMP SR-78 Eastbound 6,534 1,280 Region: Imperial IMP SR-78 Westbound 6,425 1,316 Calendar Year: 2015 *IMP SR-78: State Road 78 Freeway in Westmorland Season: Annual Total segment length Vehicle Classification: EMFAC2007 Categories Total Segment Length Eastbound 0.88 miles Units: miles/day for VMT,lb/day for Emissions, 1000 gallons/day for Fuel Consumption Total Segment Length Westbound 0.88 miles Emissions per Volume Source for 1- mile segment Model Eastbound Westbound Emission Factor Eastbound Westbound Eastbound Westbound Eastbound Westbound Region CalYr VehClass MdlYr Speed Fuel VMT Diesel VMT/day Diesel VMT/day PM10_RUNEX No. of Vol Sources No. of Vol Sources g/sec g/sec Imperial 2015 HHDT Aggregated 55 GAS Imperial 2015 HHDT Aggregated 55 DSL E E-05 HHDT Total Imperial 2015 LDA Aggregated 65 GAS Imperial 2015 LDA Aggregated 65 DSL Imperial 2015 LDT1 Aggregated 65 GAS Imperial 2015 LDT1 Aggregated 65 DSL Imperial 2015 LDT2 Aggregated 65 GAS Imperial 2015 LDT2 Aggregated 65 DSL Imperial 2015 LHDT1 Aggregated 65 GAS Imperial 2015 LHDT1 Aggregated 65 DSL Imperial 2015 LHDT2 Aggregated 65 GAS Imperial 2015 LHDT2 Aggregated 65 DSL Imperial 2015 MDV Aggregated 65 GAS Imperial 2015 MDV Aggregated 65 DSL Imperial 2015 MH Aggregated 65 GAS Imperial 2015 MH Aggregated 65 DSL Imperial 2015 MHDT Aggregated 65 GAS Imperial 2015 MHDT Aggregated 65 DSL Imperial 2015 OBUS Aggregated 65 GAS Imperial 2015 OBUS Aggregated 65 DSL Imperial 2015 SBUS Aggregated 55 GAS Imperial 2015 SBUS Aggregated 55 DSL Imperial 2015 UBUS Aggregated 65 GAS Imperial 2015 UBUS Aggregated 65 DSL LM Total Total LM Diesel Emissions E E-06 Total Diesel Emissions Total Emissions per Volume Source for Modeling 1.96E E-05 Scenario BY Copyright 2015 Kleinfelder Page 2 of 16 Imperial County SR-78 11/18/2015
83 Client: SOUTHERN CALIFORNIA ASSOCIATION OF GOVERNMENTS Project: Regional Transportation Plan Risk Assessment Emissions EMFAC2014 (v1.0.7) Emissions Inventory Additional Segment LM VMT/day HD VMT/day Region Type: County LA I-110 Northbound 164,091 16,205 Region: Los Angeles LA I-110 Southbound 159,370 14,486 Calendar Year: 2015 *LA I-110 in the LA County area, Carson Season: Annual Total segment length Vehicle Classification: EMFAC2007 Categories Total Segment Length Northbound 1.98 miles Units: miles/day for VMT,lb/day for Emissions, 1000 gallons/day for Fuel Consumption Total Segment Length Southbound 1.92 miles Emissions per Volume Source for 1- mile segment Model Northbound Southbound Emission Factor Northbound Southbound Northbound Southbound Northbound Southbound Region CalYr VehClass MdlYr Speed Fuel VMT Diesel VMT/day Diesel VMT/day PM10_RUNEX No. of Vol Sources No. of Vol Sources g/sec g/sec Los Angele 2015 HHDT Aggregated 55 GAS Los Angele 2015 HHDT Aggregated 55 DSL E E-04 HHDT Total Los Angele 2015 LDA Aggregated 65 GAS Los Angele 2015 LDA Aggregated 65 DSL Los Angele 2015 LDT1 Aggregated 65 GAS Los Angele 2015 LDT1 Aggregated 65 DSL Los Angele 2015 LDT2 Aggregated 65 GAS Los Angele 2015 LDT2 Aggregated 65 DSL Los Angele 2015 LHDT1 Aggregated 65 GAS Los Angele 2015 LHDT1 Aggregated 65 DSL Los Angele 2015 LHDT2 Aggregated 65 GAS Los Angele 2015 LHDT2 Aggregated 65 DSL Los Angele 2015 MDV Aggregated 65 GAS Los Angele 2015 MDV Aggregated 65 DSL Los Angele 2015 MH Aggregated 65 GAS Los Angele 2015 MH Aggregated 65 DSL Los Angele 2015 MHDT Aggregated 65 GAS Los Angele 2015 MHDT Aggregated 65 DSL Los Angele 2015 OBUS Aggregated 65 GAS Los Angele 2015 OBUS Aggregated 65 DSL Los Angele 2015 SBUS Aggregated 55 GAS Los Angele 2015 SBUS Aggregated 55 DSL Los Angele 2015 UBUS Aggregated 65 GAS Los Angele 2015 UBUS Aggregated 65 DSL LM Total Total LM Diesel Emissions E E-04 Total Diesel Emissions Total Emissions per Volume Source for Modeling 3.40E E-04 Scenario BY Copyright 2015 Kleinfelder Page 3 of 16 Los Angeles County I /18/2015
84 Client: SOUTHERN CALIFORNIA ASSOCIATION OF GOVERNMENTS Project: Regional Transportation Plan Risk Assessment Emissions EMFAC2014 (v1.0.7) Emissions Inventory Original Segment LM VMT/day HD VMT/day Region Type: County LA I-710 in Compton Northbound 178,750 23,385 Region: Los Angeles LA I-710 in Compton Southbound 133,387 21,271 Calendar Year: 2015 *LA I-710 in Compton, north of the intersection with SR 91 Season: Annual Total Segment Length Northbound 1.34 miles Vehicle Classification: EMFAC2007 Categories Total Segment Length Southbound 1.34 miles Units: miles/day for VMT,lb/day for Emissions, 1000 gallons/day for Fuel Consumption Emissions per Volume Source for 1-mile segment Model Northbound Southbound Emission Factor Northbound Southbound Northbound Southbound Northbound Southbound Region CalYr VehClass MdlYr Speed Fuel VMT Diesel VMT/day Diesel VMT/day PM10_RUNEX No. of Vol Sources No. of Vol Sources g/sec g/sec Los Angele 2015 HHDT Aggregated 55 GAS Los Angele 2015 HHDT Aggregated 55 DSL E E-04 HHDT Total Los Angele 2015 LDA Aggregated 65 GAS Los Angele 2015 LDA Aggregated 65 DSL Los Angele 2015 LDT1 Aggregated 65 GAS Los Angele 2015 LDT1 Aggregated 65 DSL Los Angele 2015 LDT2 Aggregated 65 GAS Los Angele 2015 LDT2 Aggregated 65 DSL Los Angele 2015 LHDT1 Aggregated 65 GAS Los Angele 2015 LHDT1 Aggregated 65 DSL Los Angele 2015 LHDT2 Aggregated 65 GAS Los Angele 2015 LHDT2 Aggregated 65 DSL Los Angele 2015 MDV Aggregated 65 GAS Los Angele 2015 MDV Aggregated 65 DSL Los Angele 2015 MH Aggregated 65 GAS Los Angele 2015 MH Aggregated 65 DSL Los Angele 2015 MHDT Aggregated 65 GAS Los Angele 2015 MHDT Aggregated 65 DSL Los Angele 2015 OBUS Aggregated 65 GAS Los Angele 2015 OBUS Aggregated 65 DSL Los Angele 2015 SBUS Aggregated 55 GAS Los Angele 2015 SBUS Aggregated 55 DSL Los Angele 2015 UBUS Aggregated 65 GAS Los Angele 2015 UBUS Aggregated 65 DSL LM Total Total LM Diesel Emissions E E-04 Total Diesel Emissions Total Emissions per Volume Source for Modeling 8.18E E-04 Scenario BY Copyright 2015 Kleinfelder Page 4 of 16 Los Angeles County I710 Compton 11/18/2015
85 Client: SOUTHERN CALIFORNIA ASSOCIATION OF GOVERNMENTS Project: Regional Transportation Plan Risk Assessment Emissions EMFAC2014 (v1.0.7) Emissions Inventory Original Segment LM VMT/day HD VMT/day Region Type: County LA SR-60 DB Eastbound 382,009 40,737 Region: Los Angeles LA SR-60 DB Westbound 382,164 40,328 Calendar Year: 2015 *LA SR-60 near Diamond Bar Season: Annual Total Segment Length Eastbound 3.14 miles Vehicle Classification: EMFAC2007 Categories Total Segment Length Westbound 2.98 miles Units: miles/day for VMT,lb/day for Emissions, 1000 gallons/day for Fuel Consumption Emissions per Volume Source for 1- mile segment Model Eastbound Westbound Emission Factor Eastbound Westbound Eastbound Westbound Eastbound Westbound Region CalYr VehClass MdlYr Speed Fuel VMT Diesel VMT/day Diesel VMT/day PM10_RUNEX No. of Vol Sources No. of Vol Sources g/sec g/sec Los Angele 2015 HHDT Aggregated 55 GAS Los Angele 2015 HHDT Aggregated 55 DSL E E-04 HHDT Total Los Angele 2015 LDA Aggregated 65 GAS Los Angele 2015 LDA Aggregated 65 DSL Los Angele 2015 LDT1 Aggregated 65 GAS Los Angele 2015 LDT1 Aggregated 65 DSL Los Angele 2015 LDT2 Aggregated 65 GAS Los Angele 2015 LDT2 Aggregated 65 DSL Los Angele 2015 LHDT1 Aggregated 65 GAS Los Angele 2015 LHDT1 Aggregated 65 DSL Los Angele 2015 LHDT2 Aggregated 65 GAS Los Angele 2015 LHDT2 Aggregated 65 DSL Los Angele 2015 MDV Aggregated 65 GAS Los Angele 2015 MDV Aggregated 65 DSL Los Angele 2015 MH Aggregated 65 GAS Los Angele 2015 MH Aggregated 65 DSL Los Angele 2015 MHDT Aggregated 65 GAS Los Angele 2015 MHDT Aggregated 65 DSL Los Angele 2015 OBUS Aggregated 65 GAS Los Angele 2015 OBUS Aggregated 65 DSL Los Angele 2015 SBUS Aggregated 55 GAS Los Angele 2015 SBUS Aggregated 55 DSL Los Angele 2015 UBUS Aggregated 65 GAS Los Angele 2015 UBUS Aggregated 65 DSL LM Total Total LM Diesel Emissions E E-04 Total Diesel Emissions Total Emissions per Volume Source for Modeling 5.04E E-04 Scenario BY Copyright 2015 Kleinfelder Page 5 of 16 Los Angeles County SR60 DB 11/18/2015
86 Client: SOUTHERN CALIFORNIA ASSOCIATION OF GOVERNMENTS Project: Regional Transportation Plan Risk Assessment Emissions EMFAC2014 (v1.0.7) Emissions Inventory Additional Segment LM VMT/day HD VMT/day Region Type: County LA SR-60 SEM, El Monte Eastbound 199,784 14,054 Region: Los Angeles LA SR-60 SEM, El Monte Westbound 209,315 15,714 Calendar Year: 2015 *LA SR-60 in the El Monte / Peck Rd area Season: Annual Total segment length Vehicle Classification: EMFAC2007 Categories Total Segment Length Eastbound 1.52 miles Units: miles/day for VMT,lb/day for Emissions, 1000 gallons/day for Fuel Consumption Total Segment Length Westbound 1.50 miles Emissions per Volume Source for 1- mile segment Model Eastbound Westbound Emission Factor Eastbound Westbound Eastbound Westbound Eastbound Westbound No. of Vol No. of Vol Region CalYr VehClass MdlYr Speed Fuel VMT Diesel VMT/day Diesel VMT/day PM10_RUNEX Sources Sources g/sec g/sec Los Angele 2015 HHDT Aggregated 55 GAS Los Angele 2015 HHDT Aggregated 55 DSL E E-04 HHDT Total Los Angele 2015 LDA Aggregated 65 GAS Los Angele 2015 LDA Aggregated 65 DSL Los Angele 2015 LDT1 Aggregated 65 GAS Los Angele 2015 LDT1 Aggregated 65 DSL Los Angele 2015 LDT2 Aggregated 65 GAS Los Angele 2015 LDT2 Aggregated 65 DSL Los Angele 2015 LHDT1 Aggregated 65 GAS Los Angele 2015 LHDT1 Aggregated 65 DSL Los Angele 2015 LHDT2 Aggregated 65 GAS Los Angele 2015 LHDT2 Aggregated 65 DSL Los Angele 2015 MDV Aggregated 65 GAS Los Angele 2015 MDV Aggregated 65 DSL Los Angele 2015 MH Aggregated 65 GAS Los Angele 2015 MH Aggregated 65 DSL Los Angele 2015 MHDT Aggregated 65 GAS Los Angele 2015 MHDT Aggregated 65 DSL Los Angele 2015 OBUS Aggregated 65 GAS Los Angele 2015 OBUS Aggregated 65 DSL Los Angele 2015 SBUS Aggregated 55 GAS Los Angele 2015 SBUS Aggregated 55 DSL Los Angele 2015 UBUS Aggregated 65 GAS Los Angele 2015 UBUS Aggregated 65 DSL LM Total Total LM Diesel Emissions E E-04 Total Diesel Emissions Total Emissions per Volume Source for Modeling 5.50E E-04 Scenario BY Copyright 2015 Kleinfelder Page 6 of 16 Los Angeles County SR-60 11/18/2015
87 Client: SOUTHERN CALIFORNIA ASSOCIATION OF GOVERNMENTS Project: Regional Transportation Plan Risk Assessment Emissions EMFAC2014 (v1.0.7) Emission Rates Original Segment LM VMT/day HD VMT/day Region Type: County ORA I-5 Northbound 214,774 10,227 Region: Orange ORA I-5 Southbound 151,474 6,449 Calendar Year: 2015 *ORA I-5 in Orange County, near intersection of SR 57 and SR 22 Season: Annual Total segment length Vehicle Classification: EMFAC2007 Categories Total Segment Length Northbound 1.32 miles Units: miles/day for VMT,lb/day for Emissions, 1000 gallons/day for Fuel Consumption Total Segment Length Eastbound 1.32 miles Emissions per Volume Source for 1- mile segment Model Northbound Southbound Emission Factor Northbound Southbound Northbound Southbound Northbound Southbound Region CalYr VehClass MdlYr Speed Fuel VMT Diesel VMT/day Diesel VMT/day PM10_RUNEX No. of Vol Sources No. of Vol Sources g/sec g/sec Orange 2015 HHDT Aggregated 55 GAS Orange 2015 HHDT Aggregated 55 DSL E E-04 HHDT Total Orange 2015 LDA Aggregated 65 GAS Orange 2015 LDA Aggregated 65 DSL Orange 2015 LDT1 Aggregated 65 GAS Orange 2015 LDT1 Aggregated 65 DSL Orange 2015 LDT2 Aggregated 65 GAS Orange 2015 LDT2 Aggregated 65 DSL Orange 2015 LHDT1 Aggregated 65 GAS Orange 2015 LHDT1 Aggregated 65 DSL Orange 2015 LHDT2 Aggregated 65 GAS Orange 2015 LHDT2 Aggregated 65 DSL Orange 2015 MDV Aggregated 65 GAS Orange 2015 MDV Aggregated 65 DSL Orange 2015 MH Aggregated 65 GAS Orange 2015 MH Aggregated 65 DSL Orange 2015 MHDT Aggregated 65 GAS Orange 2015 MHDT Aggregated 65 DSL Orange 2015 OBUS Aggregated 65 GAS Orange 2015 OBUS Aggregated 65 DSL Orange 2015 SBUS Aggregated 55 GAS Orange 2015 SBUS Aggregated 55 DSL Orange 2015 UBUS Aggregated 65 GAS Orange 2015 UBUS Aggregated 65 DSL LM Total Total LM Diesel Emissions E E-04 Total Diesel Emissions Total Emissions per Volume Source for Modeling 6.85E E-04 Scenario BY Copyright 2015 Kleinfelder Page 7 of 16 Orange County I-5 11/18/2015
88 Client: SOUTHERN CALIFORNIA ASSOCIATION OF GOVERNMENTS Project: Regional Transportation Plan Risk Assessment Emissions EMFAC2014 (v1.0.7) Emission Rates Original Segment LM VMT/day HD VMT/day Region Type: County ORA I-405 Seal Beach, Corona Northbound 235,828 20,205 Region: Orange ORA I-405 Seal Beach, Corona Southbound 217,558 18,590 Calendar Year: 2015 *I-405 in Seal Beach, east of the I-605 interchange Season: Annual Total Segment Length Northbound 1.09 miles Vehicle Classification: EMFAC2007 Categories Total Segment Length Southbound 1.02 miles Units: miles/day for VMT,lb/day for Emissions, 1000 gallons/day for Fuel Consumption Emissions per Volume Source for 1- mile segment Model Northbound Southbound Emission Factor Eastbound Westbound Eastbound Westbound Eastbound Westbound Region CalYr VehClass MdlYr Speed Fuel VMT Diesel VMT/day Diesel VMT/day PM10_RUNEX No. of Vol Sources No. of Vol Sources g/sec g/sec Orange 2015 HHDT Aggregated 55 GAS Orange 2015 HHDT Aggregated 55 DSL E E-04 HHDT Total Orange 2015 LDA Aggregated 65 GAS Orange 2015 LDA Aggregated 65 DSL Orange 2015 LDT1 Aggregated 65 GAS Orange 2015 LDT1 Aggregated 65 DSL Orange 2015 LDT2 Aggregated 65 GAS Orange 2015 LDT2 Aggregated 65 DSL Orange 2015 LHDT1 Aggregated 65 GAS Orange 2015 LHDT1 Aggregated 65 DSL Orange 2015 LHDT2 Aggregated 65 GAS Orange 2015 LHDT2 Aggregated 65 DSL Orange 2015 MDV Aggregated 65 GAS Orange 2015 MDV Aggregated 65 DSL Orange 2015 MH Aggregated 65 GAS Orange 2015 MH Aggregated 65 DSL Orange 2015 MHDT Aggregated 65 GAS Orange 2015 MHDT Aggregated 65 DSL Orange 2015 OBUS Aggregated 65 GAS Orange 2015 OBUS Aggregated 65 DSL Orange 2015 SBUS Aggregated 55 GAS Orange 2015 SBUS Aggregated 55 DSL Orange 2015 UBUS Aggregated 65 GAS Orange 2015 UBUS Aggregated 65 DSL LM Total Total LM Diesel Emissions E E-04 Total Diesel Emissions Total Emissions per Volume Source for Modeling 1.13E E-03 Scenario BY Copyright 2015 Kleinfelder Page 8 of 16 Orange County I405 Seal Beach 11/18/2015
89 Client: SOUTHERN CALIFORNIA ASSOCIATION OF GOVERNMENTS Project: Regional Transportation Plan Risk Assessment Emissions EMFAC2014 (v1.0.7) Emissions Inventory Additional Segment LM VMT/day HD VMT/day Region Type: County RIV I-10 in the Banning area Eastbound 320,238 71,178 Region: Riverside RIV I-10 in the Banning area Westbound 315,658 70,605 Calendar Year: 2015 *RIV I-10 in the Banning area Season: Annual Total segment length Vehicle Classification: EMFAC2007 Categories Total Segment Length Eastbound 5.01 miles Units: miles/day for VMT,lb/day for Emissions, 1000 gallons/day for Fuel Consumption Total Segment Length Westbound 4.98 miles Emissions per Volume Source for 1- mile segment Model Eastbound Westbound Emission Factor Eastbound Westbound Eastbound Westbound Eastbound Westbound Region CalYr VehClass MdlYr Speed Fuel VMT Diesel VMT/day Diesel VMT/day PM10_RUNEX No. of Vol Sources No. of Vol Sources g/sec g/sec Riverside 2015 HHDT Aggregated 55 GAS Riverside 2015 HHDT Aggregated 55 DSL E E-04 HHDT Total Riverside 2015 LDA Aggregated 65 GAS Riverside 2015 LDA Aggregated 65 DSL Riverside 2015 LDT1 Aggregated 65 GAS Riverside 2015 LDT1 Aggregated 65 DSL Riverside 2015 LDT2 Aggregated 65 GAS Riverside 2015 LDT2 Aggregated 65 DSL Riverside 2015 LHDT1 Aggregated 65 GAS Riverside 2015 LHDT1 Aggregated 65 DSL Riverside 2015 LHDT2 Aggregated 65 GAS Riverside 2015 LHDT2 Aggregated 65 DSL Riverside 2015 MDV Aggregated 65 GAS Riverside 2015 MDV Aggregated 65 DSL Riverside 2015 MH Aggregated 65 GAS Riverside 2015 MH Aggregated 65 DSL Riverside 2015 MHDT Aggregated 65 GAS Riverside 2015 MHDT Aggregated 65 DSL Riverside 2015 OBUS Aggregated 65 GAS Riverside 2015 OBUS Aggregated 65 DSL Riverside 2015 SBUS Aggregated 55 GAS Riverside 2015 SBUS Aggregated 55 DSL Riverside 2015 UBUS Aggregated 65 GAS Riverside 2015 UBUS Aggregated 65 DSL LM Total Total LM Diesel Emissions E E-04 Total Diesel Emissions Total Emissions per Volume Source for Modeling 3.89E E-04 Scenario BY Copyright 2015 Kleinfelder Page 9 of 16 Riverside County I10 Banning 11/18/2015
90 Client: SOUTHERN CALIFORNIA ASSOCIATION OF GOVERNMENTS Project: Regional Transportation Plan Risk Assessment Emissions EMFAC2014 (v1.0.7) Emissions Inventory Additional Segment LM VMT/day HD VMT/day Region Type: County RIV 1-15, Riverside Northbound 291,514 31,564 Region: Riverside RIV 1-15, Riverside Southbound 347,213 37,377 Calendar Year: 2015 *RIV 1-15, Riverside County, near Temecula Season: Annual Total segment length Vehicle Classification: EMFAC2007 Categories Total Segment Length Northbound 4.80 miles Units: miles/day for VMT,lb/day for Emissions, 1000 gallons/day for Fuel Consumption Total Segment Length Southbound 5.84 miles Emissions per Volume Source for 1- mile segment Model Northbound Southbound Emission Factor Northbound Southbound Northbound Southbound Northbound Southbound Region CalYr VehClass MdlYr Speed Fuel VMT Diesel VMT/day Diesel VMT/day PM10_RUNEX No. of Vol Sources No. of Vol Sources g/sec g/sec Riverside 2015 HHDT Aggregated 55 GAS Riverside 2015 HHDT Aggregated 55 DSL E E-04 HHDT Total Riverside 2015 LDA Aggregated 65 GAS Riverside 2015 LDA Aggregated 65 DSL Riverside 2015 LDT1 Aggregated 65 GAS Riverside 2015 LDT1 Aggregated 65 DSL Riverside 2015 LDT2 Aggregated 65 GAS Riverside 2015 LDT2 Aggregated 65 DSL Riverside 2015 LHDT1 Aggregated 65 GAS Riverside 2015 LHDT1 Aggregated 65 DSL Riverside 2015 LHDT2 Aggregated 65 GAS Riverside 2015 LHDT2 Aggregated 65 DSL Riverside 2015 MDV Aggregated 65 GAS Riverside 2015 MDV Aggregated 65 DSL Riverside 2015 MH Aggregated 65 GAS Riverside 2015 MH Aggregated 65 DSL Riverside 2015 MHDT Aggregated 65 GAS Riverside 2015 MHDT Aggregated 65 DSL Riverside 2015 OBUS Aggregated 65 GAS Riverside 2015 OBUS Aggregated 65 DSL Riverside 2015 SBUS Aggregated 55 GAS Riverside 2015 SBUS Aggregated 55 DSL Riverside 2015 UBUS Aggregated 65 GAS Riverside 2015 UBUS Aggregated 65 DSL LM Total Total LM Diesel Emissions E E-04 Total Diesel Emissions Total Emissions per Volume Source for Modeling 2.40E E-04 Scenario BY Copyright 2015 Kleinfelder Page 10 of 16 Riverside County I15 11/18/2015
91 Client: SOUTHERN CALIFORNIA ASSOCIATION OF GOVERNMENTS Project: Regional Transportation Plan Risk Assessment Emissions EMFAC2014 (v1.0.7) Emissions Inventory Original Segment LM VMT/day HD VMT/day Region Type: County RIV SR-91 in Corona Eastbound 280,666 34,243 Region: Riverside RIV SR-91 in Corona Westbound 262,746 35,070 Calendar Year: 2015 *SR 91 in Corona, east of the intersection with SR 71 Season: Annual Total Segment Length Eastbound 2.01 miles Vehicle Classification: EMFAC2007 Categories Total Segment Length Westbound 1.76 miles Units: miles/day for VMT,lb/day for Emissions, 1000 gallons/day for Fuel Consumption Emissions per Volume Source for 1- mile segment Model Eastbound Westbound Emission Factor Eastbound Westbound Eastbound Westbound Eastbound Westbound Region CalYr VehClass MdlYr Speed Fuel VMT Diesel VMT/day Diesel VMT/day PM10_RUNEX No. of Vol Sources No. of Vol Sources g/sec g/sec Riverside 2015 HHDT Aggregated 55 GAS Riverside 2015 HHDT Aggregated 55 DSL E E-04 HHDT Total Riverside 2015 LDA Aggregated 65 GAS Riverside 2015 LDA Aggregated 65 DSL Riverside 2015 LDT1 Aggregated 65 GAS Riverside 2015 LDT1 Aggregated 65 DSL Riverside 2015 LDT2 Aggregated 65 GAS Riverside 2015 LDT2 Aggregated 65 DSL Riverside 2015 LHDT1 Aggregated 65 GAS Riverside 2015 LHDT1 Aggregated 65 DSL Riverside 2015 LHDT2 Aggregated 65 GAS Riverside 2015 LHDT2 Aggregated 65 DSL Riverside 2015 MDV Aggregated 65 GAS Riverside 2015 MDV Aggregated 65 DSL Riverside 2015 MH Aggregated 65 GAS Riverside 2015 MH Aggregated 65 DSL Riverside 2015 MHDT Aggregated 65 GAS Riverside 2015 MHDT Aggregated 65 DSL Riverside 2015 OBUS Aggregated 65 GAS Riverside 2015 OBUS Aggregated 65 DSL Riverside 2015 SBUS Aggregated 55 GAS Riverside 2015 SBUS Aggregated 55 DSL Riverside 2015 UBUS Aggregated 65 GAS Riverside 2015 UBUS Aggregated 65 DSL LM Total Total LM Diesel Emissions E E-04 Total Diesel Emissions Total Emissions per Volume Source for Modeling 7.55E E-04 Scenario BY Copyright 2015 Kleinfelder Page 11 of 16 Riverside County SR91 Corona 11/18/2015
92 Client: SOUTHERN CALIFORNIA ASSOCIATION OF GOVERNMENTS Project: Regional Transportation Plan Risk Assessment Emissions EMFAC2014 (v1.0.7) Emissions Inventory Original Segment LM VMT/day HD VMT/day Region Type: County SB I-15 in Ontario Northbound 241,942 26,458 Region: San Bernardino SB I-15 in Ontario Southbound 249,613 26,679 Calendar Year: 2015 *SB I-15 in Ontario Season: Annual Total Segment Length Northbound 2.95 miles Vehicle Classification: EMFAC2007 Categories Total Segment Length Southbound 2.97 miles Units: miles/day for VMT,lb/day for Emissions, 1000 gallons/day for Fuel Consumption Emissions per Volume Source for 1- mile segment Model Northbound Southbound Emission Factor Northbound Southbound Northbound Southbound Northbound Southbound Region CalYr VehClass MdlYr Speed Fuel VMT Diesel VMT/day Diesel VMT/day PM10_RUNEX No. of Vol Sources No. of Vol Sources g/sec g/sec San Bernar 2015 HHDT Aggregated 55 GAS San Bernar 2015 HHDT Aggregated 55 DSL E E-04 HHDT Total San Bernar 2015 LDA Aggregated 65 GAS San Bernar 2015 LDA Aggregated 65 DSL San Bernar 2015 LDT1 Aggregated 65 GAS San Bernar 2015 LDT1 Aggregated 65 DSL San Bernar 2015 LDT2 Aggregated 65 GAS San Bernar 2015 LDT2 Aggregated 65 DSL San Bernar 2015 LHDT1 Aggregated 65 GAS San Bernar 2015 LHDT1 Aggregated 65 DSL San Bernar 2015 LHDT2 Aggregated 65 GAS San Bernar 2015 LHDT2 Aggregated 65 DSL San Bernar 2015 MDV Aggregated 65 GAS San Bernar 2015 MDV Aggregated 65 DSL San Bernar 2015 MH Aggregated 65 GAS San Bernar 2015 MH Aggregated 65 DSL San Bernar 2015 MHDT Aggregated 65 GAS San Bernar 2015 MHDT Aggregated 65 DSL San Bernar 2015 OBUS Aggregated 65 GAS San Bernar 2015 OBUS Aggregated 65 DSL San Bernar 2015 SBUS Aggregated 55 GAS San Bernar 2015 SBUS Aggregated 55 DSL San Bernar 2015 UBUS Aggregated 65 GAS San Bernar 2015 UBUS Aggregated 65 DSL LM Total Total LM Diesel Emissions E E-04 Total Diesel Emissions Total Emissions per Volume Source for Modeling 2.95E E-04 Scenario BY Copyright 2015 Kleinfelder Page 12 of 16 San Bern County I15 Ontario 11/18/2015
93 Client: SOUTHERN CALIFORNIA ASSOCIATION OF GOVERNMENTS Project: Regional Transportation Plan Risk Assessment Emissions EMFAC2014 (v1.0.7) Emissions Inventory Additional Segment LM VMT/day HD VMT/day Region Type: County SB I-15 in the Victorville area Northbound 170,736 42,857 Region: San Bernardino SB I-15 in the Victorville area Southbound 163,348 42,614 Calendar Year: 2015 *I-15 in the Victorville area Season: Annual Total segment length Vehicle Classification: EMFAC2007 Categories Total Segment Length Northbound 4.32 miles Units: miles/day for VMT,lb/day for Emissions, 1000 gallons/day for Fuel Consumption Total Segment Length Southbound 4.39 miles Emissions per Volume Source for 1- mile segment Model Northbound Southbound Emission Factor Northbound Southbound Northbound Southbound Northbound Southbound No. of Vol Sources No. of Vol Sources g/sec g/sec Region CalYr VehClass MdlYr Speed Fuel VMT Diesel VMT/day Diesel VMT/day PM10_RUNEX San Bernar 2015 HHDT Aggregated 55 GAS San Bernar 2015 HHDT Aggregated 55 DSL E E-04 HHDT Total San Bernar 2015 LDA Aggregated 65 GAS San Bernar 2015 LDA Aggregated 65 DSL San Bernar 2015 LDT1 Aggregated 65 GAS San Bernar 2015 LDT1 Aggregated 65 DSL San Bernar 2015 LDT2 Aggregated 65 GAS San Bernar 2015 LDT2 Aggregated 65 DSL San Bernar 2015 LHDT1 Aggregated 65 GAS San Bernar 2015 LHDT1 Aggregated 65 DSL San Bernar 2015 LHDT2 Aggregated 65 GAS San Bernar 2015 LHDT2 Aggregated 65 DSL San Bernar 2015 MDV Aggregated 65 GAS San Bernar 2015 MDV Aggregated 65 DSL San Bernar 2015 MH Aggregated 65 GAS San Bernar 2015 MH Aggregated 65 DSL San Bernar 2015 MHDT Aggregated 65 GAS San Bernar 2015 MHDT Aggregated 65 DSL San Bernar 2015 OBUS Aggregated 65 GAS San Bernar 2015 OBUS Aggregated 65 DSL San Bernar 2015 SBUS Aggregated 55 GAS San Bernar 2015 SBUS Aggregated 55 DSL San Bernar 2015 UBUS Aggregated 65 GAS San Bernar 2015 UBUS Aggregated 65 DSL LM Total Total LM Diesel Emissions E E-05 Total Diesel Emissions Total Emissions per Volume Source for 1.65E E-04 Modeling Scenario BY Copyright 2015 Kleinfelder Page 13 of 16 San Bern County I15 Victorvill 11/18/2015
94 Client: SOUTHERN CALIFORNIA ASSOCIATION OF GOVERNMENTS Project: Regional Transportation Plan Risk Assessment Emissions EMFAC2014 (v1.0.7) Emissions Inventory Original Segment LM VMT/day HD VMT/day Region Type: County SB SR-60 in Ontario Eastbound 257,591 44,530 Region: San Bernardino SB SR-60 in Ontario Westbound 248,515 42,065 Calendar Year: 2015 *SR 60 in Ontario, west of the I-15 interchange Season: Annual Total Segment Length Eastbound 2.35 miles Vehicle Classification: EMFAC2007 Categories Total Segment Length Westbound 2.22 miles Units: miles/day for VMT,lb/day for Emissions, 1000 gallons/day for Fuel Consumption Emissions per Volume Source for 1-mile segment Model Eastbound Westbound Emission Factor Eastbound Westbound Eastbound Westbound Eastbound Westbound No. of Vol Sources No. of Vol Sources g/sec g/sec Region CalYr VehClass MdlYr Speed Fuel VMT Diesel VMT/day Diesel VMT/day PM10_RUNEX San Bernar 2015 HHDT Aggregated 55 GAS San Bernar 2015 HHDT Aggregated 55 DSL E E-04 HHDT Total San Bernar 2015 LDA Aggregated 65 GAS San Bernar 2015 LDA Aggregated 65 DSL San Bernar 2015 LDT1 Aggregated 65 GAS San Bernar 2015 LDT1 Aggregated 65 DSL San Bernar 2015 LDT2 Aggregated 65 GAS San Bernar 2015 LDT2 Aggregated 65 DSL San Bernar 2015 LHDT1 Aggregated 65 GAS San Bernar 2015 LHDT1 Aggregated 65 DSL San Bernar 2015 LHDT2 Aggregated 65 GAS San Bernar 2015 LHDT2 Aggregated 65 DSL San Bernar 2015 MDV Aggregated 65 GAS San Bernar 2015 MDV Aggregated 65 DSL San Bernar 2015 MH Aggregated 65 GAS San Bernar 2015 MH Aggregated 65 DSL San Bernar 2015 MHDT Aggregated 65 GAS San Bernar 2015 MHDT Aggregated 65 DSL San Bernar 2015 OBUS Aggregated 65 GAS San Bernar 2015 OBUS Aggregated 65 DSL San Bernar 2015 SBUS Aggregated 55 GAS San Bernar 2015 SBUS Aggregated 55 DSL San Bernar 2015 UBUS Aggregated 65 GAS San Bernar 2015 UBUS Aggregated 65 DSL LM Total Total LM Diesel Emissions E E-04 Total Diesel Emissions Total Emissions per Volume Source for 5.30E E-04 Modeling Scenario BY Copyright 2015 Kleinfelder Page 14 of 16 San Bern County SR60 Ontario 11/18/2015
95 Client: SOUTHERN CALIFORNIA ASSOCIATION OF GOVERNMENTS Project: Regional Transportation Plan Risk Assessment Emissions EMFAC2014 (v1.0.7) Emissions Inventory Original Segment LM VMT/day HD VMT/day Region Type: County VEN US-101 SB Ventura Freeway Northbound 173,653 14,154 Region: Ventura VEN US-101 SB Ventura Freeway Southbound 168,566 15,027 Calendar Year: 2015 *US-101 Freeway in San Buenaventura near the Ventura Harbor Season: Annual Total segment length Vehicle Classification: EMFAC2007 Categories Total Segment Length Northbound 3.21 miles Units: miles/day for VMT, lb/day for Emissions, 1000 gallons/day for Fuel Consumption Total Segment Length Southbound 3.26 miles Emissions per Volume Source for Northbound Southbound Emission Factor Northbound Southbound Northbound Southbound Northbound Southbound Region CalYr VehClass MdlYr Speed Fuel VMT Diesel VMT/day Diesel VMT/day PM10_RUNEX No. of Vol Sources No. of Vol Sources g/sec g/sec Ventura 2015 HHDT Aggregated 55 GAS Ventura 2015 HHDT Aggregated 55 DSL E E-05 HHDT Total Ventura 2015 LDA Aggregated 65 GAS Ventura 2015 LDA Aggregated 65 DSL Ventura 2015 LDT1 Aggregated 65 GAS Ventura 2015 LDT1 Aggregated 65 DSL Ventura 2015 LDT2 Aggregated 65 GAS Ventura 2015 LDT2 Aggregated 65 DSL Ventura 2015 LHDT1 Aggregated 65 GAS Ventura 2015 LHDT1 Aggregated 65 DSL Ventura 2015 LHDT2 Aggregated 65 GAS Ventura 2015 LHDT2 Aggregated 65 DSL Ventura 2015 MDV Aggregated 65 GAS Ventura 2015 MDV Aggregated 65 DSL Ventura 2015 MH Aggregated 65 GAS Ventura 2015 MH Aggregated 65 DSL Ventura 2015 MHDT Aggregated 65 GAS Ventura 2015 MHDT Aggregated 65 DSL Ventura 2015 OBUS Aggregated 65 GAS Ventura 2015 OBUS Aggregated 65 DSL Ventura 2015 SBUS Aggregated 55 GAS Ventura 2015 SBUS Aggregated 55 DSL Ventura 2015 UBUS Aggregated 65 GAS Ventura 2015 UBUS Aggregated 65 DSL LM Total Total LM Diesel Emissions E E-05 Total Diesel Emissions Total Emissions per Volume Source for Modeling 1.28E E-04 Scenario BY Copyright 2015 Kleinfelder Page 15 of 16 Ventura County US101 Vent Fwy 11/18/2015
96 Client: SOUTHERN CALIFORNIA ASSOCIATION OF GOVERNMENTS Project: Regional Transportation Plan Risk Assessment Emissions EMFAC2014 (v1.0.7) Emissions Inventory Original Segment LM VMT/day HD VMT/day Region Type: County VEN US-101 in Thousand Oaks Northbound 73,667 6,251 Region: Ventura VEN US-101 in Thousand Oaks Southbound 87,499 7,614 Calendar Year: 2015 *US 101 in Thousand Oaks, east of SR 23 Season: Annual Total segment length Vehicle Classification: EMFAC2007 Categories Total Segment Length Northbound 0.79 miles Units: miles/day for VMT,lb/day for Emissions, 1000 gallons/day for Fuel Consumption Total Segment Length Southbound 0.94 miles Emissions per Volume Source for 1- mile segment Model Northbound Southbound Emission Factor Northbound Southbound Northbound Southbound Northbound Southbound Region CalYr VehClass MdlYr Speed Fuel VMT Diesel VMT/day Diesel VMT/day PM10_RUNEX No. of Vol Sources No. of Vol Sources g/sec g/sec Ventura 2015 HHDT Aggregated 55 GAS Ventura 2015 HHDT Aggregated 55 DSL E E-04 HHDT Total Ventura 2015 LDA Aggregated 65 GAS Ventura 2015 LDA Aggregated 65 DSL Ventura 2015 LDT1 Aggregated 65 GAS Ventura 2015 LDT1 Aggregated 65 DSL Ventura 2015 LDT2 Aggregated 65 GAS Ventura 2015 LDT2 Aggregated 65 DSL Ventura 2015 LHDT1 Aggregated 65 GAS Ventura 2015 LHDT1 Aggregated 65 DSL Ventura 2015 LHDT2 Aggregated 65 GAS Ventura 2015 LHDT2 Aggregated 65 DSL Ventura 2015 MDV Aggregated 65 GAS Ventura 2015 MDV Aggregated 65 DSL Ventura 2015 MH Aggregated 65 GAS Ventura 2015 MH Aggregated 65 DSL Ventura 2015 MHDT Aggregated 65 GAS Ventura 2015 MHDT Aggregated 65 DSL Ventura 2015 OBUS Aggregated 65 GAS Ventura 2015 OBUS Aggregated 65 DSL Ventura 2015 SBUS Aggregated 55 GAS Ventura 2015 SBUS Aggregated 55 DSL Ventura 2015 UBUS Aggregated 65 GAS Ventura 2015 UBUS Aggregated 65 DSL LM Total Total LM Diesel Emissions E E-04 Total Diesel Emissions Total Emissions per Volume Source for Modeling 3.66E E-04 Scenario BY Copyright 2015 Kleinfelder Page 16 of 16 Ventura County US101 Thous Oaks 11/18/2015
97 EMFAC2014 (v1.0.7) Emission Rates Region Type: County Region: Imperial Original Segment LM VMT/day HD VMT/day Calendar Year: 2040 IMP I-8 just east of El Centro Eastbound 191,039 30,683 Season: Annual IMP I-8 just east of El Centro Westbound 115,930 14,854 Vehicle Classification: EMFAC2007 Categories *IMP I-8 just east of El Centro Units: miles/day for VMT, g/mile for RUNEX, PMBW and PMTW Total Segment Length Eastbound 1.51 miles Total Segment Length Westbound 1.51 miles Emissions per Volume Source for 1-mile segment Model Eastbound Westbound Emission Factor Eastbound Westbound Eastbound Westbound Eastbound Westbound Region CalYr VehClass MdlYr Speed Fuel VMT Diesel VMT/day Diesel VMT/day PM10_RUNEX No. of Vol Sources No. of Vol Sources g/sec g/sec Imperial 2040 HHDT Aggregated 55 GAS Imperial 2040 HHDT Aggregated 55 DSL E E-06 HHDT Total Imperial 2040 SBUS Aggregated 55 GAS Imperial 2040 SBUS Aggregated 55 DSL Imperial 2040 LDA Aggregated 65 GAS Imperial 2040 LDA Aggregated 65 DSL Imperial 2040 LDT1 Aggregated 65 GAS Imperial 2040 LDT1 Aggregated 65 DSL Imperial 2040 LDT2 Aggregated 65 GAS Imperial 2040 LDT2 Aggregated 65 DSL Imperial 2040 LHDT1 Aggregated 65 GAS Imperial 2040 LHDT1 Aggregated 65 DSL Imperial 2040 LHDT2 Aggregated 65 GAS Imperial 2040 LHDT2 Aggregated 65 DSL Imperial 2040 MDV Aggregated 65 GAS Imperial 2040 MDV Aggregated 65 DSL Imperial 2040 MH Aggregated 65 GAS Imperial 2040 MH Aggregated 65 DSL Imperial 2040 MHDT Aggregated 65 GAS Imperial 2040 MHDT Aggregated 65 DSL Imperial 2040 OBUS Aggregated 65 GAS Imperial 2040 OBUS Aggregated 65 DSL Imperial 2040 UBUS Aggregated 65 GAS Imperial 2040 UBUS Aggregated 65 DSL LM Total Total LM Diesel Emissions E E-06 Total Diesel Emissions Total Emissions per Volume Source for Modeling 2.09E E-05 Scenario BL Copyright 2015 Kleinfelder Page 1 of 16 IMP I-8 El Centro 10/22/2015
98 EMFAC2014 (v1.0.7) Emission Rates Region Type: County Region: Imperial Original Segment LM VMT/day HD VMT/day Calendar Year: 2040 IMP SR-78 Eastbound 83,147 17,539 Season: Annual IMP SR-78 Westbound 83,147 17,539 Vehicle Classification: EMFAC2007 Categories *IMP SR-78: State Road 78 Freeway in Westmorland Units: miles/day for VMT, g/mile for RUNEX, PMBW and PMTW Total segment length Total Segment Length Eastbound 0.88 miles Total Segment Length Westbound 0.88 miles Emissions per Volume Source for 1-mile segment Model Eastbound Westbound Emission Factor Eastbound Westbound Eastbound Westbound Eastbound Westbound No. of Vol Sources No. of Vol Sources g/sec g/sec Region CalYr VehClass MdlYr Speed Fuel VMT Diesel VMT/day Diesel VMT/day PM10_RUNEX Imperial 2040 HHDT Aggregated 55 GAS Imperial 2040 HHDT Aggregated 55 DSL E E-05 HHDT Total Imperial 2040 SBUS Aggregated 55 GAS Imperial 2040 SBUS Aggregated 55 DSL Imperial 2040 LDA Aggregated 65 GAS Imperial 2040 LDA Aggregated 65 DSL Imperial 2040 LDT1 Aggregated 65 GAS Imperial 2040 LDT1 Aggregated 65 DSL Imperial 2040 LDT2 Aggregated 65 GAS Imperial 2040 LDT2 Aggregated 65 DSL Imperial 2040 LHDT1 Aggregated 65 GAS Imperial 2040 LHDT1 Aggregated 65 DSL Imperial 2040 LHDT2 Aggregated 65 GAS Imperial 2040 LHDT2 Aggregated 65 DSL Imperial 2040 MDV Aggregated 65 GAS Imperial 2040 MDV Aggregated 65 DSL Imperial 2040 MH Aggregated 65 GAS Imperial 2040 MH Aggregated 65 DSL Imperial 2040 MHDT Aggregated 65 GAS Imperial 2040 MHDT Aggregated 65 DSL Imperial 2040 OBUS Aggregated 65 GAS Imperial 2040 OBUS Aggregated 65 DSL Imperial 2040 UBUS Aggregated 65 GAS Imperial 2040 UBUS Aggregated 65 DSL LM Total Total LM Diesel Emissions E E-06 Total Diesel Emissions Total Emissions per Volume 1.52E E-05 Source for Modeling Scenario BL Copyright 2015 Kleinfelder Page 2 of 16 IMP SR-78 10/22/2015
99 EMFAC2014 (v1.0.7) Emission Rates Region Type: County Region: Los Angeles Additional Segment LM VMT/day HD VMT/day Calendar Year: 2040 LA I-110 Northbound 185,613 41,203 Season: Annual LA I-110 Southbound 143,830 27,204 Vehicle Classification: EMFAC2007 Categories *LA I-110 in the LA County area, Carson Units: miles/day for VMT, g/mile for RUNEX, PMBW and PMTW Total segment length Total Segment Length Northbound 1.98 miles Total Segment Length Southbound 1.92 miles Emissions per Volume Source for 1-mile segment Model Northbound Southbound Emission Factor Northbound Southbound Northbound Southbound Northbound Southbound No. of Vol Sources No. of Vol Sources g/sec g/sec Region CalYr VehClass MdlYr Speed Fuel VMT Diesel VMT/day Diesel VMT/day PM10_RUNEX Los Angele 2040 HHDT Aggregated 55 GAS Los Angele 2040 HHDT Aggregated 55 DSL E E-05 HHDT Total Los Angele 2040 SBUS Aggregated 55 GAS Los Angele 2040 SBUS Aggregated 55 DSL Los Angele 2040 LDA Aggregated 65 GAS Los Angele 2040 LDA Aggregated 65 DSL Los Angele 2040 LDT1 Aggregated 65 GAS Los Angele 2040 LDT1 Aggregated 65 DSL Los Angele 2040 LDT2 Aggregated 65 GAS Los Angele 2040 LDT2 Aggregated 65 DSL Los Angele 2040 LHDT1 Aggregated 65 GAS Los Angele 2040 LHDT1 Aggregated 65 DSL Los Angele 2040 LHDT2 Aggregated 65 GAS Los Angele 2040 LHDT2 Aggregated 65 DSL Los Angele 2040 MDV Aggregated 65 GAS Los Angele 2040 MDV Aggregated 65 DSL Los Angele 2040 MH Aggregated 65 GAS Los Angele 2040 MH Aggregated 65 DSL Los Angele 2040 MHDT Aggregated 65 GAS Los Angele 2040 MHDT Aggregated 65 DSL Los Angele 2040 OBUS Aggregated 65 GAS Los Angele 2040 OBUS Aggregated 65 DSL Los Angele 2040 UBUS Aggregated 65 GAS Los Angele 2040 UBUS Aggregated 65 DSL LM Total Total LM Diesel Emissions E E-06 Total Diesel Emissions Total Emissions per Volume 3.71E E-05 Source for Modeling Scenario BL Copyright 2015 Kleinfelder Page 3 of 16 LA County I /22/2015
100 EMFAC2014 (v1.0.7) Emission Rates Region Type: County Region: Los Angeles Original Segment LM VMT/day HD VMT/day Calendar Year: 2040 LA I-710 in Compton Northbound 172,963 28,986 Season: Annual LA I-710 in Compton Southbound 143,043 23,015 Vehicle Classification: EMFAC2007 Categories *LA I-710 in Compton, north of the intersection with SR 91 Units: miles/day for VMT, g/mile for RUNEX, PMBW and PMTW Total Segment Length Northbound 1.34 miles Total Segment Length Southbound 1.34 miles Emissions per Volume Source for 1- mile segment Model Northbound Southbound Emission Factor Northbound Southbound Northbound Southbound Northbound Southbound No. of Vol Sources No. of Vol Sources g/sec g/sec Region CalYr VehClass MdlYr Speed Fuel VMT Diesel VMT/day Diesel VMT/day PM10_RUNEX Los Angeles 2040 HHDT Aggregated 55 GAS Los Angeles 2040 HHDT Aggregated 55 DSL E E-05 HHDT Total Los Angeles 2040 SBUS Aggregated 55 GAS Los Angeles 2040 SBUS Aggregated 55 DSL Los Angeles 2040 LDA Aggregated 65 GAS Los Angeles 2040 LDA Aggregated 65 DSL Los Angeles 2040 LDT1 Aggregated 65 GAS Los Angeles 2040 LDT1 Aggregated 65 DSL Los Angeles 2040 LDT2 Aggregated 65 GAS Los Angeles 2040 LDT2 Aggregated 65 DSL Los Angeles 2040 LHDT1 Aggregated 65 GAS Los Angeles 2040 LHDT1 Aggregated 65 DSL Los Angeles 2040 LHDT2 Aggregated 65 GAS Los Angeles 2040 LHDT2 Aggregated 65 DSL Los Angeles 2040 MDV Aggregated 65 GAS Los Angeles 2040 MDV Aggregated 65 DSL Los Angeles 2040 MH Aggregated 65 GAS Los Angeles 2040 MH Aggregated 65 DSL Los Angeles 2040 MHDT Aggregated 65 GAS Los Angeles 2040 MHDT Aggregated 65 DSL Los Angeles 2040 OBUS Aggregated 65 GAS Los Angeles 2040 OBUS Aggregated 65 DSL Los Angeles 2040 UBUS Aggregated 65 GAS Los Angeles 2040 UBUS Aggregated 65 DSL LM Total Total LM Diesel Emissions E E-05 Total Diesel Emissions Total Emissions per Volume Source 5.64E E-05 for Modeling Scenario BL Copyright 2015 Kleinfelder Page 4 of 16 LA County I /22/2015
101 EMFAC2014 (v1.0.7) Emission Rates Region Type: County Region: Los Angeles Original Segment LM VMT/day HD VMT/day Calendar Year: 2040 LA SR-60 DB Eastbound 433,407 63,590 Season: Annual LA SR-60 DB Westbound 441,273 76,771 Vehicle Classification: EMFAC2007 Categories *LA SR-60 near Diamond Bar Units: miles/day for VMT, g/mile for RUNEX, PMBW and PMTW Total Segment Length Eastbound 3.14 miles Total Segment Length Westbound 3.12 miles Emissions per Volume Source for 1-mile segment Model Eastbound Westbound Emission Factor Eastbound Westbound Eastbound Westbound Eastbound Westbound No. of Vol Sources No. of Vol Sources g/sec g/sec Region CalYr VehClass MdlYr Speed Fuel VMT Diesel VMT/day Diesel VMT/day PM10_RUNEX Los Angele 2040 HHDT Aggregated 55 GAS Los Angele 2040 HHDT Aggregated 55 DSL E E-05 HHDT Total Los Angele 2040 SBUS Aggregated 55 GAS Los Angele 2040 SBUS Aggregated 55 DSL Los Angele 2040 LDA Aggregated 65 GAS Los Angele 2040 LDA Aggregated 65 DSL Los Angele 2040 LDT1 Aggregated 65 GAS Los Angele 2040 LDT1 Aggregated 65 DSL Los Angele 2040 LDT2 Aggregated 65 GAS Los Angele 2040 LDT2 Aggregated 65 DSL Los Angele 2040 LHDT1 Aggregated 65 GAS Los Angele 2040 LHDT1 Aggregated 65 DSL Los Angele 2040 LHDT2 Aggregated 65 GAS Los Angele 2040 LHDT2 Aggregated 65 DSL Los Angele 2040 MDV Aggregated 65 GAS Los Angele 2040 MDV Aggregated 65 DSL Los Angele 2040 MH Aggregated 65 GAS Los Angele 2040 MH Aggregated 65 DSL Los Angele 2040 MHDT Aggregated 65 GAS Los Angele 2040 MHDT Aggregated 65 DSL Los Angele 2040 OBUS Aggregated 65 GAS Los Angele 2040 OBUS Aggregated 65 DSL Los Angele 2040 UBUS Aggregated 65 GAS Los Angele 2040 UBUS Aggregated 65 DSL LM Total Total LM Diesel Emissions E E-05 Total Diesel Emissions Total Emissions per Volume 4.12E E-05 Source for Modeling Scenario BL Copyright 2015 Kleinfelder Page 5 of 16 LA County SR60 DB 10/22/2015
102 EMFAC2014 (v1.0.7) Emission Rates Region Type: County Region: Los Angeles Additional Segment LM VMT/day HD VMT/day Calendar Year: 2040 LA SR-60 SEM, El Monte Eastbound 212,331 20,564 Season: Annual LA SR-60 SEM, El Monte Westbound 205,494 24,648 Vehicle Classification: EMFAC2007 Categories *LA SR-60 in the El Monte / Peck Rd area Units: miles/day for VMT, g/mile for RUNEX, PMBW and PMTW Total segment length Total Segment Length Eastbound 1.52 miles Total Segment Length Westbound 1.50 miles Emissions per Volume Source for 1-mile segment Model Eastbound Westbound Emission Factor Eastbound Westbound Eastbound Westbound Eastbound Westbound No. of Vol Sources No. of Vol Sources g/sec g/sec Region CalYr VehClass MdlYr Speed Fuel VMT Diesel VMT/day Diesel VMT/day PM10_RUNEX Los Angeles 2040 HHDT Aggregated 55 GAS Los Angeles 2040 HHDT Aggregated 55 DSL E E-05 HHDT Total Los Angeles 2040 SBUS Aggregated 55 GAS Los Angeles 2040 SBUS Aggregated 55 DSL Los Angeles 2040 LDA Aggregated 65 GAS Los Angeles 2040 LDA Aggregated 65 DSL Los Angeles 2040 LDT1 Aggregated 65 GAS Los Angeles 2040 LDT1 Aggregated 65 DSL Los Angeles 2040 LDT2 Aggregated 65 GAS Los Angeles 2040 LDT2 Aggregated 65 DSL Los Angeles 2040 LHDT1 Aggregated 65 GAS Los Angeles 2040 LHDT1 Aggregated 65 DSL Los Angeles 2040 LHDT2 Aggregated 65 GAS Los Angeles 2040 LHDT2 Aggregated 65 DSL Los Angeles 2040 MDV Aggregated 65 GAS Los Angeles 2040 MDV Aggregated 65 DSL Los Angeles 2040 MH Aggregated 65 GAS Los Angeles 2040 MH Aggregated 65 DSL Los Angeles 2040 MHDT Aggregated 65 GAS Los Angeles 2040 MHDT Aggregated 65 DSL Los Angeles 2040 OBUS Aggregated 65 GAS Los Angeles 2040 OBUS Aggregated 65 DSL Los Angeles 2040 UBUS Aggregated 65 GAS Los Angeles 2040 UBUS Aggregated 65 DSL LM Total Total LM Diesel Emissions E E-05 Total Diesel Emissions Total Emissions per Volume 3.95E E-05 Source for Modeling Scenario BL Copyright 2015 Kleinfelder Page 6 of 16 LA County SR-60 10/22/2015
103 EMFAC2014 (v1.0.7) Emission Rates Region Type: County Region: Orange Original Segment LM VMT/day HD VMT/day Calendar Year: 2040 ORA I-5 Northbound 134,257 21,222 Season: Annual ORA I-5 Southbound 147,059 20,241 Vehicle Classification: EMFAC2007 Categories *ORA I-5 in Orange County, near intersection of SR 57 and SR 22 Units: miles/day for VMT, g/mile for RUNEX, PMBW and PMTW Total segment length Total Segment Length Northbound 1.32 miles Total Segment Length Southbound 0.81 miles Emissions per Volume Source for 1- mile segment Model Northbound Southbound Emission Factor Northbound Southbound Northbound Southbound Northbound Southbound No. of Vol Sources No. of Vol Sources g/sec g/sec Region CalYr VehClass MdlYr Speed Fuel VMT Diesel VMT/day Diesel VMT/day PM10_RUNEX Orange 2040 HHDT Aggregated 55 GAS Orange 2040 HHDT Aggregated 55 DSL E E-05 HHDT Total Orange 2040 SBUS Aggregated 55 GAS Orange 2040 SBUS Aggregated 55 DSL Orange 2040 LDA Aggregated 65 GAS Orange 2040 LDA Aggregated 65 DSL Orange 2040 LDT1 Aggregated 65 GAS Orange 2040 LDT1 Aggregated 65 DSL Orange 2040 LDT2 Aggregated 65 GAS Orange 2040 LDT2 Aggregated 65 DSL Orange 2040 LHDT1 Aggregated 65 GAS Orange 2040 LHDT1 Aggregated 65 DSL Orange 2040 LHDT2 Aggregated 65 GAS Orange 2040 LHDT2 Aggregated 65 DSL Orange 2040 MDV Aggregated 65 GAS Orange 2040 MDV Aggregated 65 DSL Orange 2040 MH Aggregated 65 GAS Orange 2040 MH Aggregated 65 DSL Orange 2040 MHDT Aggregated 65 GAS Orange 2040 MHDT Aggregated 65 DSL Orange 2040 OBUS Aggregated 65 GAS Orange 2040 OBUS Aggregated 65 DSL Orange 2040 UBUS Aggregated 65 GAS Orange 2040 UBUS Aggregated 65 DSL LM Total Total LM Diesel Emissions E E-05 Total Diesel Emissions Total Emissions per Volume Source for 4.27E E-05 Modeling Scenario BL Copyright 2015 Kleinfelder Page 7 of 16 Orange County I-5 10/22/2015
104 EMFAC2014 (v1.0.7) Emission Rates Region Type: County Region: Orange Original Segment LM VMT/day HD VMT/day Calendar Year: 2040 ORA I-405 Seal Beach, Corona Northbound 211,720 32,533 Season: Annual ORA I-405 Seal Beach, Corona Southbound 204,150 35,706 Vehicle Classification: EMFAC2007 Categories *I-405 in Seal Beach, east of the I-605 interchange Units: miles/day for VMT, g/mile for RUNEX, PMBW and PMTW Total Segment Length Northbound 1.09 miles Total Segment Length Southbound 1.02 miles Emissions per Volume Source for 1- mile segment Model Northbound Southbound Emission Factor Northbound Southbound Northbound Southbound Northbound Southbound No. of Vol Sources No. of Vol Sources g/sec g/sec Region CalYr VehClass MdlYr Speed Fuel VMT Diesel VMT/day Diesel VMT/day PM10_RUNEX Orange 2040 HHDT Aggregated 55 GAS Orange 2040 HHDT Aggregated 55 DSL E E-05 HHDT Total Orange 2040 SBUS Aggregated 55 GAS Orange 2040 SBUS Aggregated 55 DSL Orange 2040 LDA Aggregated 65 GAS Orange 2040 LDA Aggregated 65 DSL Orange 2040 LDT1 Aggregated 65 GAS Orange 2040 LDT1 Aggregated 65 DSL Orange 2040 LDT2 Aggregated 65 GAS Orange 2040 LDT2 Aggregated 65 DSL Orange 2040 LHDT1 Aggregated 65 GAS Orange 2040 LHDT1 Aggregated 65 DSL Orange 2040 LHDT2 Aggregated 65 GAS Orange 2040 LHDT2 Aggregated 65 DSL Orange 2040 MDV Aggregated 65 GAS Orange 2040 MDV Aggregated 65 DSL Orange 2040 MH Aggregated 65 GAS Orange 2040 MH Aggregated 65 DSL Orange 2040 MHDT Aggregated 65 GAS Orange 2040 MHDT Aggregated 65 DSL Orange 2040 OBUS Aggregated 65 GAS Orange 2040 OBUS Aggregated 65 DSL Orange 2040 UBUS Aggregated 65 GAS Orange 2040 UBUS Aggregated 65 DSL LM Total Total LM Diesel Emissions E E-05 Total Diesel Emissions Total Emissions per Volume Source 7.41E E-05 for Modeling Scenario BL Copyright 2015 Kleinfelder Page 8 of 16 Orange County I /22/2015
105 EMFAC2014 (v1.0.7) Emission Rates Region Type: County Region: Riverside Additional Segment LM VMT/day HD VMT/day Calendar Year: 2040 RIV I-10 in the Banning area Eastbound 345, ,725 Season: Annual RIV I-10 in the Banning area Westbound 439, ,301 Vehicle Classification: EMFAC2007 Categories *RIV I-10 in the Banning area Units: miles/day for VMT, g/mile for RUNEX, PMBW and PMTW Total segment length Total Segment Length Eastbound 5.01 miles Total Segment Length Westbound 4.98 miles Emissions per Volume Source for 1- mile segment Model Eastbound Westbound Emission Factor Eastbound Westbound Eastbound Westbound Eastbound Westbound No. of Vol Sources No. of Vol Sources g/sec g/sec Region CalYr VehClass MdlYr Speed Fuel VMT Diesel VMT/day Diesel VMT/day PM10_RUNEX Riverside 2040 HHDT Aggregated 55 GAS Riverside 2040 HHDT Aggregated 55 DSL E E-05 HHDT Total Riverside 2040 SBUS Aggregated 55 GAS Riverside 2040 SBUS Aggregated 55 DSL Riverside 2040 LDA Aggregated 65 GAS Riverside 2040 LDA Aggregated 65 DSL Riverside 2040 LDT1 Aggregated 65 GAS Riverside 2040 LDT1 Aggregated 65 DSL Riverside 2040 LDT2 Aggregated 65 GAS Riverside 2040 LDT2 Aggregated 65 DSL Riverside 2040 LHDT1 Aggregated 65 GAS Riverside 2040 LHDT1 Aggregated 65 DSL Riverside 2040 LHDT2 Aggregated 65 GAS Riverside 2040 LHDT2 Aggregated 65 DSL Riverside 2040 MDV Aggregated 65 GAS Riverside 2040 MDV Aggregated 65 DSL Riverside 2040 MH Aggregated 65 GAS Riverside 2040 MH Aggregated 65 DSL Riverside 2040 MHDT Aggregated 65 GAS Riverside 2040 MHDT Aggregated 65 DSL Riverside 2040 OBUS Aggregated 65 GAS Riverside 2040 OBUS Aggregated 65 DSL Riverside 2040 UBUS Aggregated 65 GAS Riverside 2040 UBUS Aggregated 65 DSL LM Total Total LM Diesel Emissions E E-06 Total Diesel Emissions Total Emissions per Volume Source for 3.74E E-05 Modeling Scenario BL Copyright 2015 Kleinfelder Page 9 of 16 RIV I-10 10/22/2015
106 EMFAC2014 (v1.0.7) Emission Rates Region Type: County Region: Riverside Additional Segment LM VMT/day HD VMT/day Calendar Year: 2040 RIV I-15, Riverside Northbound 357,646 52,487 Season: Annual RIV I-15, Riverside Southbound 393,680 62,533 Vehicle Classification: EMFAC2007 Categories *RIV I-15, Riverside County, near Temecula Units: miles/day for VMT, g/mile for RUNEX, PMBW and PMTW Total segment length Total Segment Length Northbound 4.81 miles Total Segment Length Southbound 5.83 miles Emissions per Volume Source for 1- mile segment Model Eastbound Westbound Emission Factor Eastbound Westbound Eastbound Westbound Eastbound Westbound No. of Vol Sources No. of Vol Sources g/sec g/sec Region CalYr VehClass MdlYr Speed Fuel VMT Diesel VMT/day Diesel VMT/day PM10_RUNEX Riverside 2040 HHDT Aggregated 55 GAS Riverside 2040 HHDT Aggregated 55 DSL E E-05 HHDT Total Riverside 2040 SBUS Aggregated 55 GAS Riverside 2040 SBUS Aggregated 55 DSL Riverside 2040 LDA Aggregated 65 GAS Riverside 2040 LDA Aggregated 65 DSL Riverside 2040 LDT1 Aggregated 65 GAS Riverside 2040 LDT1 Aggregated 65 DSL Riverside 2040 LDT2 Aggregated 65 GAS Riverside 2040 LDT2 Aggregated 65 DSL Riverside 2040 LHDT1 Aggregated 65 GAS Riverside 2040 LHDT1 Aggregated 65 DSL Riverside 2040 LHDT2 Aggregated 65 GAS Riverside 2040 LHDT2 Aggregated 65 DSL Riverside 2040 MDV Aggregated 65 GAS Riverside 2040 MDV Aggregated 65 DSL Riverside 2040 MH Aggregated 65 GAS Riverside 2040 MH Aggregated 65 DSL Riverside 2040 MHDT Aggregated 65 GAS Riverside 2040 MHDT Aggregated 65 DSL Riverside 2040 OBUS Aggregated 65 GAS Riverside 2040 OBUS Aggregated 65 DSL Riverside 2040 UBUS Aggregated 65 GAS Riverside 2040 UBUS Aggregated 65 DSL LM Total Total LM Diesel Emissions E E-06 Total Diesel Emissions Total Emissions per Volume Source 1.76E E-05 for Modeling Scenario BL Copyright 2015 Kleinfelder Page 10 of 16 RIV I-15 10/22/2015
107 EMFAC2014 (v1.0.7) Emission Rates Region Type: County Region: Riverside Original Segment LM VMT/day HD VMT/day Calendar Year: 2040 RIV SR-91 in Corona Eastbound 166,975 30,609 Season: Annual RIV SR-91 in Corona Westbound 332,865 72,033 Vehicle Classification: EMFAC2007 Categories *SR 91 in Corona, east of the intersection with SR 71 Units: miles/day for VMT, g/mile for RUNEX, PMBW and PMTW Total Segment Length Eastbound 2.01 miles Total Segment Length Westbound 1.76 miles Emissions per Volume Source for 1- mile segment Model Eastbound Westbound Emission Factor Eastbound Westbound Eastbound Westbound Eastbound Westbound No. of Vol Sources No. of Vol Sources g/sec g/sec Region CalYr VehClass MdlYr Speed Fuel VMT Diesel VMT/day Diesel VMT/day PM10_RUNEX Riverside 2040 HHDT Aggregated 55 GAS Riverside 2040 HHDT Aggregated 55 DSL E E-05 HHDT Total Riverside 2040 SBUS Aggregated 55 GAS Riverside 2040 SBUS Aggregated 55 DSL Riverside 2040 LDA Aggregated 65 GAS Riverside 2040 LDA Aggregated 65 DSL Riverside 2040 LDT1 Aggregated 65 GAS Riverside 2040 LDT1 Aggregated 65 DSL Riverside 2040 LDT2 Aggregated 65 GAS Riverside 2040 LDT2 Aggregated 65 DSL Riverside 2040 LHDT1 Aggregated 65 GAS Riverside 2040 LHDT1 Aggregated 65 DSL Riverside 2040 LHDT2 Aggregated 65 GAS Riverside 2040 LHDT2 Aggregated 65 DSL Riverside 2040 MDV Aggregated 65 GAS Riverside 2040 MDV Aggregated 65 DSL Riverside 2040 MH Aggregated 65 GAS Riverside 2040 MH Aggregated 65 DSL Riverside 2040 MHDT Aggregated 65 GAS Riverside 2040 MHDT Aggregated 65 DSL Riverside 2040 OBUS Aggregated 65 GAS Riverside 2040 OBUS Aggregated 65 DSL Riverside 2040 UBUS Aggregated 65 GAS Riverside 2040 UBUS Aggregated 65 DSL LM Total Total LM Diesel Emissions E E-05 Total Diesel Emissions Total Emissions per Volume Source 2.97E E-05 for Modeling Scenario BL Copyright 2015 Kleinfelder Page 11 of 16 RIV SR-91 Corona 10/22/2015
108 EMFAC2014 (v1.0.7) Emission Rates Region Type: County Region: San Bernardino Original Segment LM VMT/day HD VMT/day Calendar Year: 2040 SB I-15 in Ontario Northbound 233,190 76,099 Season: Annual SB I-15 in Ontario Southbound 602, ,917 Vehicle Classification: EMFAC2007 Categories *SB I-15 in Ontario Units: miles/day for VMT, g/mile for RUNEX, PMBW and PMTW Total Segment Length Northbound 2.95 miles Total Segment Length Southbound 2.97 miles Emissions per Volume Source for 1- mile segment Model Northbound Southbound Emission Factor Northbound Southbound Northbound Southbound Northbound Southbound No. of Vol Sources No. of Vol Sources g/sec g/sec Region CalYr VehClass MdlYr Speed Fuel VMT Diesel VMT/day Diesel VMT/day PM10_RUNEX San Bernar 2040 HHDT Aggregated 55 GAS San Bernar 2040 HHDT Aggregated 55 DSL E E-05 HHDT Total San Bernar 2040 SBUS Aggregated 55 GAS San Bernar 2040 SBUS Aggregated 55 DSL San Bernar 2040 LDA Aggregated 65 GAS San Bernar 2040 LDA Aggregated 65 DSL San Bernar 2040 LDT1 Aggregated 65 GAS San Bernar 2040 LDT1 Aggregated 65 DSL San Bernar 2040 LDT2 Aggregated 65 GAS San Bernar 2040 LDT2 Aggregated 65 DSL San Bernar 2040 LHDT1 Aggregated 65 GAS San Bernar 2040 LHDT1 Aggregated 65 DSL San Bernar 2040 LHDT2 Aggregated 65 GAS San Bernar 2040 LHDT2 Aggregated 65 DSL San Bernar 2040 MDV Aggregated 65 GAS San Bernar 2040 MDV Aggregated 65 DSL San Bernar 2040 MH Aggregated 65 GAS San Bernar 2040 MH Aggregated 65 DSL San Bernar 2040 MHDT Aggregated 65 GAS San Bernar 2040 MHDT Aggregated 65 DSL San Bernar 2040 OBUS Aggregated 65 GAS San Bernar 2040 OBUS Aggregated 65 DSL San Bernar 2040 UBUS Aggregated 65 GAS San Bernar 2040 UBUS Aggregated 65 DSL LM Total Total LM Diesel Emissions E E-05 Total Diesel Emissions Total Emissions per Volume Source 4.03E E-05 for Modeling Scenario BL Copyright 2015 Kleinfelder Page 12 of 16 SB County I-15 Ont 10/22/2015
109 EMFAC2014 (v1.0.7) Emission Rates Region Type: County Region: San Bernardino Additional Segment LM VMT/day HD VMT/day Calendar Year: 2040 SB I-15 in the Victorville area Northbound 127,704 46,847 Season: Annual SB I-15 in the Victorville area Southbound 250,931 74,054 Vehicle Classification: EMFAC2007 Categories *I-15 in the Victorville area Units: miles/day for VMT, g/mile for RUNEX, PMBW and PMTW Total segment length Total Segment Length Northbound 4.32 miles Total Segment Length Southbound 4.39 miles Emissions per Volume Source for 1- mile segment Model Northbound Southbound Emission Factor Northbound Southbound Northbound Southbound Northbound Southbound No. of Vol Sources No. of Vol Sources g/sec g/sec Region CalYr VehClass MdlYr Speed Fuel VMT Diesel VMT/day Diesel VMT/day PM10_RUNEX San Bernar 2040 HHDT Aggregated 55 GAS San Bernar 2040 HHDT Aggregated 55 DSL E E-05 HHDT Total San Bernar 2040 SBUS Aggregated 55 GAS San Bernar 2040 SBUS Aggregated 55 DSL San Bernar 2040 LDA Aggregated 65 GAS San Bernar 2040 LDA Aggregated 65 DSL San Bernar 2040 LDT1 Aggregated 65 GAS San Bernar 2040 LDT1 Aggregated 65 DSL San Bernar 2040 LDT2 Aggregated 65 GAS San Bernar 2040 LDT2 Aggregated 65 DSL San Bernar 2040 LHDT1 Aggregated 65 GAS San Bernar 2040 LHDT1 Aggregated 65 DSL San Bernar 2040 LHDT2 Aggregated 65 GAS San Bernar 2040 LHDT2 Aggregated 65 DSL San Bernar 2040 MDV Aggregated 65 GAS San Bernar 2040 MDV Aggregated 65 DSL San Bernar 2040 MH Aggregated 65 GAS San Bernar 2040 MH Aggregated 65 DSL San Bernar 2040 MHDT Aggregated 65 GAS San Bernar 2040 MHDT Aggregated 65 DSL San Bernar 2040 OBUS Aggregated 65 GAS San Bernar 2040 OBUS Aggregated 65 DSL San Bernar 2040 UBUS Aggregated 65 GAS San Bernar 2040 UBUS Aggregated 65 DSL LM Total Total LM Diesel Emissions E E-06 Total Diesel Emissions Total Emissions per Volume Source 1.09E E-05 for Modeling Scenario BL Copyright 2015 Kleinfelder Page 13 of 16 SB I-15 10/22/2015
110 EMFAC2014 (v1.0.7) Emission Rates Region Type: County Region: San Bernardino Original Segment LM VMT/day HD VMT/day Calendar Year: 2040 SB SR-60 in Ontario Eastbound 226,731 43,641 Season: Annual SB SR-60 in Ontario Westbound 156,404 34,971 Vehicle Classification: EMFAC2007 Categories *SR 60 in Ontario, west of the I-15 interchange Units: miles/day for VMT, g/mile for RUNEX, PMBW and PMTW Total Segment Length Eastbound 2.35 miles Total Segment Length Westboun 2.22 miles Emissions per Volume Source for 1-mile segment Model Eastbound Westbound Emission Factor Eastbound Westbound Eastbound Westbound Eastbound Westbound No. of Vol Sources No. of Vol Sources g/sec g/sec Region CalYr VehClass MdlYr Speed Fuel VMT Diesel VMT/day Diesel VMT/day PM10_RUNEX San Bernar 2040 HHDT Aggregated 55 GAS San Bernar 2040 HHDT Aggregated 55 DSL E E-05 HHDT Total San Bernar 2040 SBUS Aggregated 55 GAS San Bernar 2040 SBUS Aggregated 55 DSL San Bernar 2040 LDA Aggregated 65 GAS San Bernar 2040 LDA Aggregated 65 DSL San Bernar 2040 LDT1 Aggregated 65 GAS San Bernar 2040 LDT1 Aggregated 65 DSL San Bernar 2040 LDT2 Aggregated 65 GAS San Bernar 2040 LDT2 Aggregated 65 DSL San Bernar 2040 LHDT1 Aggregated 65 GAS San Bernar 2040 LHDT1 Aggregated 65 DSL San Bernar 2040 LHDT2 Aggregated 65 GAS San Bernar 2040 LHDT2 Aggregated 65 DSL San Bernar 2040 MDV Aggregated 65 GAS San Bernar 2040 MDV Aggregated 65 DSL San Bernar 2040 MH Aggregated 65 GAS San Bernar 2040 MH Aggregated 65 DSL San Bernar 2040 MHDT Aggregated 65 GAS San Bernar 2040 MHDT Aggregated 65 DSL San Bernar 2040 OBUS Aggregated 65 GAS San Bernar 2040 OBUS Aggregated 65 DSL San Bernar 2040 UBUS Aggregated 65 GAS San Bernar 2040 UBUS Aggregated 65 DSL LM Total Total LM Diesel Emissions E E-06 Total Diesel Emissions Total Emissions per Volume 3.13E E-05 Source for Modeling Scenario BL Copyright 2015 Kleinfelder Page 14 of 16 SB SR-60 Ont 10/22/2015
111 EMFAC2014 (v1.0.7) Emission Rates Region Type: County Region: Ventura Original Segment LM VMT/day HD VMT/day Calendar Year: 2040 VEN US-101 SB Ventura Freeway Northbound 278,353 45,072 Season: Annual VEN US-101 SB Ventura Freeway Southbound 105,970 16,030 Vehicle Classification: EMFAC2007 Categories *US-101 Freeway in San Buenaventura near the Ventura Harbor Units: miles/day for VMT, g/mile for RUNEX, PMBW and PMTW Total segment length Total Segment Length Northbound 3.21 miles Total Segment Length Southbound 3.26 miles Emissions per Volume Source for 1- mile segment Model Northbound Southbound Emission Factor Northbound Southbound Northbound Southbound Northbound Southbound No. of Vol Sources No. of Vol Sources g/sec g/sec Region CalYr VehClass MdlYr Speed Fuel VMT Diesel VMT/day Diesel VMT/day PM10_RUNEX Ventura 2040 HHDT Aggregated 55 GAS Ventura 2040 HHDT Aggregated 55 DSL E E-06 HHDT Total Ventura 2040 SBUS Aggregated 55 GAS Ventura 2040 SBUS Aggregated 55 DSL Ventura 2040 LDA Aggregated 65 GAS Ventura 2040 LDA Aggregated 65 DSL Ventura 2040 LDT1 Aggregated 65 GAS Ventura 2040 LDT1 Aggregated 65 DSL Ventura 2040 LDT2 Aggregated 65 GAS Ventura 2040 LDT2 Aggregated 65 DSL Ventura 2040 LHDT1 Aggregated 65 GAS Ventura 2040 LHDT1 Aggregated 65 DSL Ventura 2040 LHDT2 Aggregated 65 GAS Ventura 2040 LHDT2 Aggregated 65 DSL Ventura 2040 MDV Aggregated 65 GAS Ventura 2040 MDV Aggregated 65 DSL Ventura 2040 MH Aggregated 65 GAS Ventura 2040 MH Aggregated 65 DSL Ventura 2040 MHDT Aggregated 65 GAS Ventura 2040 MHDT Aggregated 65 DSL Ventura 2040 OBUS Aggregated 65 GAS Ventura 2040 OBUS Aggregated 65 DSL Ventura 2040 UBUS Aggregated 65 GAS Ventura 2040 UBUS Aggregated 65 DSL LM Total Total LM Diesel Emissions E E-06 Total Diesel Emissions Total Emissions per Volume Source 1.36E E-06 for Modeling Scenario BL Copyright 2015 Kleinfelder Page 15 of 16 VEN US-101 SB 10/22/2015
112 EMFAC2014 (v1.0.7) Emission Rates Region Type: County Region: Ventura Original Segment LM VMT/day HD VMT/day Calendar Year: 2040 VEN US-101 in Thousand Oaks Northbound 59,994 10,385 Season: Annual VEN US-101 in Thousand Oaks Southbound 121,575 16,092 Vehicle Classification: EMFAC2007 Categories *US 101 in Thousand Oaks, east of SR 23 Units: miles/day for VMT, g/mile for RUNEX, PMBW and PMTW Total segment length Total Segment Length Northbound 0.79 miles Total Segment Length Southbound 0.94 miles Emissions per Volume Source for 1- mile segment Model Northbound Southbound Emission Factor Northbound Southbound Northbound Southbound Northbound Southbound No. of Vol Sources No. of Vol Sources g/sec g/sec Region CalYr VehClass MdlYr Speed Fuel VMT Diesel VMT/day Diesel VMT/day PM10_RUNEX Ventura 2040 HHDT Aggregated 55 GAS Ventura 2040 HHDT Aggregated 55 DSL E E-05 HHDT Total Ventura 2040 SBUS Aggregated 55 GAS Ventura 2040 SBUS Aggregated 55 DSL Ventura 2040 LDA Aggregated 65 GAS Ventura 2040 LDA Aggregated 65 DSL Ventura 2040 LDT1 Aggregated 65 GAS Ventura 2040 LDT1 Aggregated 65 DSL Ventura 2040 LDT2 Aggregated 65 GAS Ventura 2040 LDT2 Aggregated 65 DSL Ventura 2040 LHDT1 Aggregated 65 GAS Ventura 2040 LHDT1 Aggregated 65 DSL Ventura 2040 LHDT2 Aggregated 65 GAS Ventura 2040 LHDT2 Aggregated 65 DSL Ventura 2040 MDV Aggregated 65 GAS Ventura 2040 MDV Aggregated 65 DSL Ventura 2040 MH Aggregated 65 GAS Ventura 2040 MH Aggregated 65 DSL Ventura 2040 MHDT Aggregated 65 GAS Ventura 2040 MHDT Aggregated 65 DSL Ventura 2040 OBUS Aggregated 65 GAS Ventura 2040 OBUS Aggregated 65 DSL Ventura 2040 UBUS Aggregated 65 GAS Ventura 2040 UBUS Aggregated 65 DSL LM Total Total LM Diesel Emissions E E-05 Total Diesel Emissions Total Emissions per Volume Source 2.02E E-05 for Modeling Scenario BL Copyright 2015 Kleinfelder Page 16 of 16 VEN US /22/2015
113 EMFAC2014 (v1.0.7) Emission Rates Region Type: County Region: Imperial Original Segment LM VMT/day HD VMT/day Calendar Year: 2040 IMP I-8 just east of El Centro Eastbound 25,337 11,402 Season: Annual IMP I-8 just east of El Centro Westbound 26,101 11,565 Vehicle Classification: EMFAC2007 Categories *IMP I-8 just east of El Centro Units: miles/day for VMT, g/mile for RUNEX, PMBW and PMTW Total Segment Length Eastbound 1.51 miles Total Segment Length Westbound 1.51 miles Emissions per Volume Source for 1- mile segment Model Eastbound Westbound Emission Factor Eastbound Westbound Eastbound Westbound Eastbound Westbound No. of Vol Sources No. of Vol Sources g/sec g/sec Region CalYr VehClass MdlYr Speed Fuel VMT Diesel VMT/day Diesel VMT/day PM10_RUNEX Imperial 2040 HHDT Aggregated 55 GAS Imperial 2040 HHDT Aggregated 55 DSL E E-06 HHDT Total Imperial 2040 SBUS Aggregated 55 GAS Imperial 2040 SBUS Aggregated 55 DSL Imperial 2040 LDA Aggregated 65 GAS Imperial 2040 LDA Aggregated 65 DSL Imperial 2040 LDT1 Aggregated 65 GAS Imperial 2040 LDT1 Aggregated 65 DSL Imperial 2040 LDT2 Aggregated 65 GAS Imperial 2040 LDT2 Aggregated 65 DSL Imperial 2040 LHDT1 Aggregated 65 GAS Imperial 2040 LHDT1 Aggregated 65 DSL Imperial 2040 LHDT2 Aggregated 65 GAS Imperial 2040 LHDT2 Aggregated 65 DSL Imperial 2040 MDV Aggregated 65 GAS Imperial 2040 MDV Aggregated 65 DSL Imperial 2040 MH Aggregated 65 GAS Imperial 2040 MH Aggregated 65 DSL Imperial 2040 MHDT Aggregated 65 GAS Imperial 2040 MHDT Aggregated 65 DSL Imperial 2040 OBUS Aggregated 65 GAS Imperial 2040 OBUS Aggregated 65 DSL Imperial 2040 UBUS Aggregated 65 GAS Imperial 2040 UBUS Aggregated 65 DSL LM Total Total LM Diesel Emissions E E-07 Total Diesel Emissions Total Emissions per Volume Source 6.14E E-06 for Modeling Scenario PLS2 Copyright 2015 Kleinfelder Page 1 of 16 IMP I-8 El Centro 10/22/2015
114 EMFAC2014 (v1.0.7) Emission Rates Region Type: County Region: Imperial Original Segment LM VMT/day HD VMT/day Calendar Year: 2040 IMP SR-78 Eastbound 13,739 2,337 Season: Annual IMP SR-78 Westbound 8,242 2,492 Vehicle Classification: EMFAC2007 Categories *IMP SR-78: State Road 78 Freeway in Westmorland Units: miles/day for VMT, g/mile for RUNEX, PMBW and PMTW Total segment length Total Segment Length Eastbound 0.88 miles Total Segment Length Westbound 0.88 miles Emissions per Volume Source for 1- mile segment Model Eastbound Westbound Emission Factor Eastbound Westbound Eastbound Westbound Eastbound Westbound No. of Vol Sources No. of Vol Sources g/sec g/sec Region CalYr VehClass MdlYr Speed Fuel VMT Diesel VMT/day Diesel VMT/day PM10_RUNEX Imperial 2040 HHDT Aggregated 55 GAS Imperial 2040 HHDT Aggregated 55 DSL E E-06 HHDT Total Imperial 2040 SBUS Aggregated 55 GAS Imperial 2040 SBUS Aggregated 55 DSL Imperial 2040 LDA Aggregated 65 GAS Imperial 2040 LDA Aggregated 65 DSL Imperial 2040 LDT1 Aggregated 65 GAS Imperial 2040 LDT1 Aggregated 65 DSL Imperial 2040 LDT2 Aggregated 65 GAS Imperial 2040 LDT2 Aggregated 65 DSL Imperial 2040 LHDT1 Aggregated 65 GAS Imperial 2040 LHDT1 Aggregated 65 DSL Imperial 2040 LHDT2 Aggregated 65 GAS Imperial 2040 LHDT2 Aggregated 65 DSL Imperial 2040 MDV Aggregated 65 GAS Imperial 2040 MDV Aggregated 65 DSL Imperial 2040 MH Aggregated 65 GAS Imperial 2040 MH Aggregated 65 DSL Imperial 2040 MHDT Aggregated 65 GAS Imperial 2040 MHDT Aggregated 65 DSL Imperial 2040 OBUS Aggregated 65 GAS Imperial 2040 OBUS Aggregated 65 DSL Imperial 2040 UBUS Aggregated 65 GAS Imperial 2040 UBUS Aggregated 65 DSL LM Total Total LM Diesel Emissions E E-07 Total Diesel Emissions Total Emissions per Volume Source 2.15E E-06 for Modeling Scenario PLS2 Copyright 2015 Kleinfelder Page 2 of 16 IMP SR-78 10/22/2015
115 EMFAC2014 (v1.0.7) Emission Rates Region Type: County Region: Los Angeles Additional Segment LM VMT/day HD VMT/day Calendar Year: 2040 LA I-110 Northbound 146,588 24,157 Season: Annual LA I-110 Southbound 144,655 21,464 Vehicle Classification: EMFAC2007 Categories *LA I-110 in the LA County area, Carson Units: miles/day for VMT, g/mile for RUNEX, PMBW and PMTW Total segment length Total Segment Length Northbound 1.98 miles Total Segment Length Southbound 1.92 miles Emissions per Volume Source for 1- Northbound Southbound Emission Factor Northbound Southbound Northbound Southbound Northbound Southbound No. of Vol Sources No. of Vol Sources g/sec g/sec Region CalYr VehClass MdlYr Speed Fuel VMT Diesel VMT/day Diesel VMT/day PM10_RUNEX Los Angele 2040 HHDT Aggregated 55 GAS Los Angele 2040 HHDT Aggregated 55 DSL E E-05 HHDT Total Los Angele 2040 SBUS Aggregated 55 GAS Los Angele 2040 SBUS Aggregated 55 DSL Los Angele 2040 LDA Aggregated 65 GAS Los Angele 2040 LDA Aggregated 65 DSL Los Angele 2040 LDT1 Aggregated 65 GAS Los Angele 2040 LDT1 Aggregated 65 DSL Los Angele 2040 LDT2 Aggregated 65 GAS Los Angele 2040 LDT2 Aggregated 65 DSL Los Angele 2040 LHDT1 Aggregated 65 GAS Los Angele 2040 LHDT1 Aggregated 65 DSL Los Angele 2040 LHDT2 Aggregated 65 GAS Los Angele 2040 LHDT2 Aggregated 65 DSL Los Angele 2040 MDV Aggregated 65 GAS Los Angele 2040 MDV Aggregated 65 DSL Los Angele 2040 MH Aggregated 65 GAS Los Angele 2040 MH Aggregated 65 DSL Los Angele 2040 MHDT Aggregated 65 GAS Los Angele 2040 MHDT Aggregated 65 DSL Los Angele 2040 OBUS Aggregated 65 GAS Los Angele 2040 OBUS Aggregated 65 DSL Los Angele 2040 UBUS Aggregated 65 GAS Los Angele 2040 UBUS Aggregated 65 DSL LM Total Total LM Diesel Emissions E E-06 Total Diesel Emissions Total Emissions per Volume Source 2.42E E-05 for Modeling Scenario PLS2 Copyright 2015 Kleinfelder Page 3 of 16 LA County I /22/2015
116 EMFAC2014 (v1.0.7) Emission Rates Region Type: County Region: Los Angeles Original Segment LM VMT/day HD VMT/day Calendar Year: 2040 LA I-710 in Compton Northbound 168,817 24,245 Season: Annual LA I-710 in Compton Southbound 162,915 21,235 Vehicle Classification: EMFAC2007 Categories *LA I-710 in Compton, north of the intersection with SR 91 Units: miles/day for VMT, g/mile for RUNEX, PMBW and PMTW Total Segment Length Northbound 1.34 miles Total Segment Length Southbound 1.34 miles Emissions per Volume Source for 1- mile segment Model Northbound Southbound Emission Factor Northbound Southbound Northbound Southbound Northbound Southbound No. of Vol Sources No. of Vol Sources g/sec g/sec Region CalYr VehClass MdlYr Speed Fuel VMT Diesel VMT/day Diesel VMT/day PM10_RUNEX Los Angele 2040 HHDT Aggregated 55 GAS Los Angele 2040 HHDT Aggregated 55 DSL E E-05 HHDT Total Los Angele 2040 SBUS Aggregated 55 GAS Los Angele 2040 SBUS Aggregated 55 DSL Los Angele 2040 LDA Aggregated 65 GAS Los Angele 2040 LDA Aggregated 65 DSL Los Angele 2040 LDT1 Aggregated 65 GAS Los Angele 2040 LDT1 Aggregated 65 DSL Los Angele 2040 LDT2 Aggregated 65 GAS Los Angele 2040 LDT2 Aggregated 65 DSL Los Angele 2040 LHDT1 Aggregated 65 GAS Los Angele 2040 LHDT1 Aggregated 65 DSL Los Angele 2040 LHDT2 Aggregated 65 GAS Los Angele 2040 LHDT2 Aggregated 65 DSL Los Angele 2040 MDV Aggregated 65 GAS Los Angele 2040 MDV Aggregated 65 DSL Los Angele 2040 MH Aggregated 65 GAS Los Angele 2040 MH Aggregated 65 DSL Los Angele 2040 MHDT Aggregated 65 GAS Los Angele 2040 MHDT Aggregated 65 DSL Los Angele 2040 OBUS Aggregated 65 GAS Los Angele 2040 OBUS Aggregated 65 DSL Los Angele 2040 UBUS Aggregated 65 GAS Los Angele 2040 UBUS Aggregated 65 DSL LM Total Total LM Diesel Emissions E E-05 Total Diesel Emissions Total Emissions per Volume Source 5.02E E-05 for Modeling Scenario PLS2 Copyright 2015 Kleinfelder Page 4 of 16 LA County I /22/2015
117 EMFAC2014 (v1.0.7) Emission Rates Region Type: County Region: Los Angeles Original Segment LM VMT/day HD VMT/day Calendar Year: 2040 LA SR-60 DB Eastbound 324,880 38,900 Season: Annual LA SR-60 DB Westbound 365,183 35,510 Vehicle Classification: EMFAC2007 Categories *LA SR-60 near Diamond Bar Units: miles/day for VMT, g/mile for RUNEX, PMBW and PMTW Total Segment Length Eastbound 3.14 miles Total Segment Length Westbound 3.12 miles Emissions per Volume Source for 1- mile segment Model Eastbound Westbound Emission Factor Eastbound Westbound Eastbound Westbound Eastbound Westbound No. of Vol Sources No. of Vol Sources g/sec g/sec Region CalYr VehClass MdlYr Speed Fuel VMT Diesel VMT/day Diesel VMT/day PM10_RUNEX Los Angele 2040 HHDT Aggregated 55 GAS Los Angele 2040 HHDT Aggregated 55 DSL E E-05 HHDT Total Los Angele 2040 SBUS Aggregated 55 GAS Los Angele 2040 SBUS Aggregated 55 DSL Los Angele 2040 LDA Aggregated 65 GAS Los Angele 2040 LDA Aggregated 65 DSL Los Angele 2040 LDT1 Aggregated 65 GAS Los Angele 2040 LDT1 Aggregated 65 DSL Los Angele 2040 LDT2 Aggregated 65 GAS Los Angele 2040 LDT2 Aggregated 65 DSL Los Angele 2040 LHDT1 Aggregated 65 GAS Los Angele 2040 LHDT1 Aggregated 65 DSL Los Angele 2040 LHDT2 Aggregated 65 GAS Los Angele 2040 LHDT2 Aggregated 65 DSL Los Angele 2040 MDV Aggregated 65 GAS Los Angele 2040 MDV Aggregated 65 DSL Los Angele 2040 MH Aggregated 65 GAS Los Angele 2040 MH Aggregated 65 DSL Los Angele 2040 MHDT Aggregated 65 GAS Los Angele 2040 MHDT Aggregated 65 DSL Los Angele 2040 OBUS Aggregated 65 GAS Los Angele 2040 OBUS Aggregated 65 DSL Los Angele 2040 UBUS Aggregated 65 GAS Los Angele 2040 UBUS Aggregated 65 DSL LM Total Total LM Diesel Emissions E E-05 Total Diesel Emissions Total Emissions per Volume Source 2.76E E-05 for Modeling Scenario PLS2 Copyright 2015 Kleinfelder Page 5 of 16 LA County SR60 DB 10/22/2015
118 EMFAC2014 (v1.0.7) Emission Rates Region Type: County Region: Los Angeles Additional Segment LM VMT/day HD VMT/day Calendar Year: 2040 LA SR-60 SEM, El Monte Eastbound 184,513 14,118 Season: Annual LA SR-60 SEM, El Monte Westbound 198,120 16,318 Vehicle Classification: EMFAC2007 Categories *LA SR-60 in the El Monte / Peck Rd area Units: miles/day for VMT, g/mile for RUNEX, PMBW and PMTW Total segment length Total Segment Length Eastbound 1.52 miles Total Segment Length Westbound 1.50 miles Emissions per Volume Source for 1- mile segment Model Northbound Southbound Emission Factor Northbound Southbound Northbound Southbound Northbound Southbound No. of Vol Sources No. of Vol Sources g/sec g/sec Region CalYr VehClass MdlYr Speed Fuel VMT Diesel VMT/day Diesel VMT/day PM10_RUNEX Los Angeles 2040 HHDT Aggregated 55 GAS Los Angeles 2040 HHDT Aggregated 55 DSL E E-05 HHDT Total Los Angeles 2040 SBUS Aggregated 55 GAS Los Angeles 2040 SBUS Aggregated 55 DSL Los Angeles 2040 LDA Aggregated 65 GAS Los Angeles 2040 LDA Aggregated 65 DSL Los Angeles 2040 LDT1 Aggregated 65 GAS Los Angeles 2040 LDT1 Aggregated 65 DSL Los Angeles 2040 LDT2 Aggregated 65 GAS Los Angeles 2040 LDT2 Aggregated 65 DSL Los Angeles 2040 LHDT1 Aggregated 65 GAS Los Angeles 2040 LHDT1 Aggregated 65 DSL Los Angeles 2040 LHDT2 Aggregated 65 GAS Los Angeles 2040 LHDT2 Aggregated 65 DSL Los Angeles 2040 MDV Aggregated 65 GAS Los Angeles 2040 MDV Aggregated 65 DSL Los Angeles 2040 MH Aggregated 65 GAS Los Angeles 2040 MH Aggregated 65 DSL Los Angeles 2040 MHDT Aggregated 65 GAS Los Angeles 2040 MHDT Aggregated 65 DSL Los Angeles 2040 OBUS Aggregated 65 GAS Los Angeles 2040 OBUS Aggregated 65 DSL Los Angeles 2040 UBUS Aggregated 65 GAS Los Angeles 2040 UBUS Aggregated 65 DSL LM Total Total LM Diesel Emissions E E-05 Total Diesel Emissions Total Emissions per Volume Source 3.09E E-05 for Modeling Scenario PLS2 Copyright 2015 Kleinfelder Page 6 of 16 LA County SR-60 10/22/2015
119 EMFAC2014 (v1.0.7) Emission Rates Region Type: County Region: Orange Original Segment LM VMT/day HD VMT/day Calendar Year: 2040 ORA I-5 Northbound 197,793 19,225 Season: Annual ORA I-5 Southbound 120,747 12,079 Vehicle Classification: EMFAC2007 Categories *ORA I-5 in Orange County, near intersection of SR 57 and SR 22 Units: miles/day for VMT, g/mile for RUNEX, PMBW and PMTW Total segment length Total Segment Length Northbound 1.32 miles Total Segment Length Southbound 0.81 miles Emissions per Volume Source for 1- mile segment Model Northbound Southbound Emission Factor Northbound Southbound Northbound Southbound Northbound Southbound Region CalYr VehClass MdlYr Speed Fuel VMT Diesel VMT/day Diesel VMT/day PM10_RUNEX No. of Vol Sources No. of Vol Sources g/sec g/sec Orange 2040 HHDT Aggregated 55 GAS Orange 2040 HHDT Aggregated 55 DSL E E-05 HHDT Total Orange 2040 SBUS Aggregated 55 GAS Orange 2040 SBUS Aggregated 55 DSL Orange 2040 LDA Aggregated 65 GAS Orange 2040 LDA Aggregated 65 DSL Orange 2040 LDT1 Aggregated 65 GAS Orange 2040 LDT1 Aggregated 65 DSL Orange 2040 LDT2 Aggregated 65 GAS Orange 2040 LDT2 Aggregated 65 DSL Orange 2040 LHDT1 Aggregated 65 GAS Orange 2040 LHDT1 Aggregated 65 DSL Orange 2040 LHDT2 Aggregated 65 GAS Orange 2040 LHDT2 Aggregated 65 DSL Orange 2040 MDV Aggregated 65 GAS Orange 2040 MDV Aggregated 65 DSL Orange 2040 MH Aggregated 65 GAS Orange 2040 MH Aggregated 65 DSL Orange 2040 MHDT Aggregated 65 GAS Orange 2040 MHDT Aggregated 65 DSL Orange 2040 OBUS Aggregated 65 GAS Orange 2040 OBUS Aggregated 65 DSL Orange 2040 UBUS Aggregated 65 GAS Orange 2040 UBUS Aggregated 65 DSL LM Total Total LM Diesel Emissions E E-05 Total Diesel Emissions Total Emissions per Volume Source for Modeling 4.48E E-05 Scenario PLS2 Copyright 2015 Kleinfelder Page 7 of 16 Orange County I-5 10/22/2015
120 EMFAC2014 (v1.0.7) Emission Rates Region Type: County Region: Orange Original Segment LM VMT/day HD VMT/day Calendar Year: 2040 ORA I-405 Seal Beach, Corona Northbound 221,577 33,797 Season: Annual ORA I-405 Seal Beach, Corona Southbound 203,061 31,231 Vehicle Classification: EMFAC2007 Categories *I-405 in Seal Beach, east of the I-605 interchange Units: miles/day for VMT, g/mile for RUNEX, PMBW and PMTW Total Segment Length Northbound 1.09 miles Total Segment Length Southbound 1.02 miles Emissions per Volume Source for 1- mile segment Model Northbound Southbound Emission Factor Northbound Southbound Northbound Southbound Northbound Southbound No. of Vol Sources No. of Vol Sources g/sec g/sec Region CalYr VehClass MdlYr Speed Fuel VMT Diesel VMT/day Diesel VMT/day PM10_RUNEX Orange 2040 HHDT Aggregated 55 GAS Orange 2040 HHDT Aggregated 55 DSL E E-05 HHDT Total Orange 2040 SBUS Aggregated 55 GAS Orange 2040 SBUS Aggregated 55 DSL Orange 2040 LDA Aggregated 65 GAS Orange 2040 LDA Aggregated 65 DSL Orange 2040 LDT1 Aggregated 65 GAS Orange 2040 LDT1 Aggregated 65 DSL Orange 2040 LDT2 Aggregated 65 GAS Orange 2040 LDT2 Aggregated 65 DSL Orange 2040 LHDT1 Aggregated 65 GAS Orange 2040 LHDT1 Aggregated 65 DSL Orange 2040 LHDT2 Aggregated 65 GAS Orange 2040 LHDT2 Aggregated 65 DSL Orange 2040 MDV Aggregated 65 GAS Orange 2040 MDV Aggregated 65 DSL Orange 2040 MH Aggregated 65 GAS Orange 2040 MH Aggregated 65 DSL Orange 2040 MHDT Aggregated 65 GAS Orange 2040 MHDT Aggregated 65 DSL Orange 2040 OBUS Aggregated 65 GAS Orange 2040 OBUS Aggregated 65 DSL Orange 2040 UBUS Aggregated 65 GAS Orange 2040 UBUS Aggregated 65 DSL LM Total Total LM Diesel Emissions E E-05 Total Diesel Emissions Total Emissions per Volume Source for 7.71E E-05 Modeling Scenario PLS2 Copyright 2015 Kleinfelder Page 8 of 16 Orange County I /22/2015
121 EMFAC2014 (v1.0.7) Emission Rates Region Type: County Region: Riverside Additional Segment LM VMT/day HD VMT/day Calendar Year: 2040 RIV I-10 in the Banning area Eastbound 317, ,829 Season: Annual RIV I-10 in the Banning area Westbound 372, ,184 Vehicle Classification: EMFAC2007 Categories *RIV I-10 in the Banning area Units: miles/day for VMT, g/mile for RUNEX, PMBW and PMTW Total segment length Total Segment Length Eastbound 5.01 miles Total Segment Length Westbound 4.98 miles Emissions per Volume Source for 1- mile segment Model Eastbound Westbound Emission Factor Eastbound Westbound Eastbound Westbound Eastbound Westbound No. of Vol Sources No. of Vol Sources g/sec g/sec Region CalYr VehClass MdlYr Speed Fuel VMT Diesel VMT/day Diesel VMT/day PM10_RUNEX Riverside 2040 HHDT Aggregated 55 GAS Riverside 2040 HHDT Aggregated 55 DSL E E-05 HHDT Total Riverside 2040 SBUS Aggregated 55 GAS Riverside 2040 SBUS Aggregated 55 DSL Riverside 2040 LDA Aggregated 65 GAS Riverside 2040 LDA Aggregated 65 DSL Riverside 2040 LDT1 Aggregated 65 GAS Riverside 2040 LDT1 Aggregated 65 DSL Riverside 2040 LDT2 Aggregated 65 GAS Riverside 2040 LDT2 Aggregated 65 DSL Riverside 2040 LHDT1 Aggregated 65 GAS Riverside 2040 LHDT1 Aggregated 65 DSL Riverside 2040 LHDT2 Aggregated 65 GAS Riverside 2040 LHDT2 Aggregated 65 DSL Riverside 2040 MDV Aggregated 65 GAS Riverside 2040 MDV Aggregated 65 DSL Riverside 2040 MH Aggregated 65 GAS Riverside 2040 MH Aggregated 65 DSL Riverside 2040 MHDT Aggregated 65 GAS Riverside 2040 MHDT Aggregated 65 DSL Riverside 2040 OBUS Aggregated 65 GAS Riverside 2040 OBUS Aggregated 65 DSL Riverside 2040 UBUS Aggregated 65 GAS Riverside 2040 UBUS Aggregated 65 DSL LM Total Total LM Diesel Emissions E E-06 Total Diesel Emissions Total Emissions per Volume Source 3.75E E-05 for Modeling Scenario PLS2 Copyright 2015 Kleinfelder Page 9 of 16 RIV I-10 10/22/2015
122 EMFAC2014 (v1.0.7) Emission Rates Region Type: County Region: Riverside Additional Segment LM VMT/day HD VMT/day Calendar Year: 2040 RIV I-15, Riverside Northbound 469,031 75,978 Season: Annual RIV I-15, Riverside Southbound 555,310 91,002 Vehicle Classification: EMFAC2007 Categories *RIV I-15, Riverside County, near Temecula Units: miles/day for VMT, g/mile for RUNEX, PMBW and PMTW Total segment length Total Segment Length Northbound 4.81 miles Total Segment Length Southbound 5.83 miles Emissions per Volume Source for 1- mile segment Model Eastbound Westbound Emission Factor Eastbound Westbound Eastbound Westbound Eastbound Westbound No. of Vol Sources No. of Vol Sources g/sec g/sec Region CalYr VehClass MdlYr Speed Fuel VMT Diesel VMT/day Diesel VMT/day PM10_RUNEX Riverside 2040 HHDT Aggregated 55 GAS Riverside 2040 HHDT Aggregated 55 DSL E E-05 HHDT Total Riverside 2040 SBUS Aggregated 55 GAS Riverside 2040 SBUS Aggregated 55 DSL Riverside 2040 LDA Aggregated 65 GAS Riverside 2040 LDA Aggregated 65 DSL Riverside 2040 LDT1 Aggregated 65 GAS Riverside 2040 LDT1 Aggregated 65 DSL Riverside 2040 LDT2 Aggregated 65 GAS Riverside 2040 LDT2 Aggregated 65 DSL Riverside 2040 LHDT1 Aggregated 65 GAS Riverside 2040 LHDT1 Aggregated 65 DSL Riverside 2040 LHDT2 Aggregated 65 GAS Riverside 2040 LHDT2 Aggregated 65 DSL Riverside 2040 MDV Aggregated 65 GAS Riverside 2040 MDV Aggregated 65 DSL Riverside 2040 MH Aggregated 65 GAS Riverside 2040 MH Aggregated 65 DSL Riverside 2040 MHDT Aggregated 65 GAS Riverside 2040 MHDT Aggregated 65 DSL Riverside 2040 OBUS Aggregated 65 GAS Riverside 2040 OBUS Aggregated 65 DSL Riverside 2040 UBUS Aggregated 65 GAS Riverside 2040 UBUS Aggregated 65 DSL LM Total Total LM Diesel Emissions E E-06 Total Diesel Emissions Total Emissions per Volume Source 2.48E E-05 for Modeling Scenario PLS2 Copyright 2015 Kleinfelder Page 10 of 16 RIV I-15 10/22/2015
123 EMFAC2014 (v1.0.7) Emission Rates Region Type: County Region: Riverside Original Segment LM VMT/day HD VMT/day Calendar Year: 2040 RIV SR-91 in Corona Eastbound 279,241 42,928 Season: Annual RIV SR-91 in Corona Westbound 261,128 45,127 Vehicle Classification: EMFAC2007 Categories *SR 91 in Corona, east of the intersection with SR 71 Units: miles/day for VMT, g/mile for RUNEX, PMBW and PMTW Total Segment Length Eastbound 2.01 miles Total Segment Length Westbound 1.76 miles Emissions per Volume Source for 1- mile segment Model Eastbound Westbound Emission Factor Eastbound Westbound Eastbound Westbound Eastbound Westbound No. of Vol Sources No. of Vol Sources g/sec g/sec Region CalYr VehClass MdlYr Speed Fuel VMT Diesel VMT/day Diesel VMT/day PM10_RUNEX Riverside 2040 HHDT Aggregated 55 GAS Riverside 2040 HHDT Aggregated 55 DSL E E-05 HHDT Total Riverside 2040 SBUS Aggregated 55 GAS Riverside 2040 SBUS Aggregated 55 DSL Riverside 2040 LDA Aggregated 65 GAS Riverside 2040 LDA Aggregated 65 DSL Riverside 2040 LDT1 Aggregated 65 GAS Riverside 2040 LDT1 Aggregated 65 DSL Riverside 2040 LDT2 Aggregated 65 GAS Riverside 2040 LDT2 Aggregated 65 DSL Riverside 2040 LHDT1 Aggregated 65 GAS Riverside 2040 LHDT1 Aggregated 65 DSL Riverside 2040 LHDT2 Aggregated 65 GAS Riverside 2040 LHDT2 Aggregated 65 DSL Riverside 2040 MDV Aggregated 65 GAS Riverside 2040 MDV Aggregated 65 DSL Riverside 2040 MH Aggregated 65 GAS Riverside 2040 MH Aggregated 65 DSL Riverside 2040 MHDT Aggregated 65 GAS Riverside 2040 MHDT Aggregated 65 DSL Riverside 2040 OBUS Aggregated 65 GAS Riverside 2040 OBUS Aggregated 65 DSL Riverside 2040 UBUS Aggregated 65 GAS Riverside 2040 UBUS Aggregated 65 DSL LM Total Total LM Diesel Emissions E E-05 Total Diesel Emissions Total Emissions per Volume Source 4.37E E-05 for Modeling Scenario PLS2 Copyright 2015 Kleinfelder Page 11 of 16 RIV SR-91 Corona 10/22/2015
124 EMFAC2014 (v1.0.7) Emission Rates Region Type: County Region: San Bernardino Original Segment LM VMT/day HD VMT/day Calendar Year: 2040 SB I-15 in Ontario Northbound 244,700 56,894 Season: Annual SB I-15 in Ontario Southbound 227,670 58,753 Vehicle Classification: EMFAC2007 Categories *SB I-15 in Ontario Units: miles/day for VMT, g/mile for RUNEX, PMBW and PMTW Total Segment Length Northbound 2.95 miles Total Segment Length Southbound 2.97 miles Emissions per Volume Source for 1- mile segment Model Northbound Southbound Emission Factor Northbound Southbound Northbound Southbound Northbound Southbound No. of Vol Sources No. of Vol Sources g/sec g/sec Region CalYr VehClass MdlYr Speed Fuel VMT Diesel VMT/day Diesel VMT/day PM10_RUNEX San Bernar 2040 HHDT Aggregated 55 GAS San Bernar 2040 HHDT Aggregated 55 DSL E E-05 HHDT Total San Bernar 2040 SBUS Aggregated 55 GAS San Bernar 2040 SBUS Aggregated 55 DSL San Bernar 2040 LDA Aggregated 65 GAS San Bernar 2040 LDA Aggregated 65 DSL San Bernar 2040 LDT1 Aggregated 65 GAS San Bernar 2040 LDT1 Aggregated 65 DSL San Bernar 2040 LDT2 Aggregated 65 GAS San Bernar 2040 LDT2 Aggregated 65 DSL San Bernar 2040 LHDT1 Aggregated 65 GAS San Bernar 2040 LHDT1 Aggregated 65 DSL San Bernar 2040 LHDT2 Aggregated 65 GAS San Bernar 2040 LHDT2 Aggregated 65 DSL San Bernar 2040 MDV Aggregated 65 GAS San Bernar 2040 MDV Aggregated 65 DSL San Bernar 2040 MH Aggregated 65 GAS San Bernar 2040 MH Aggregated 65 DSL San Bernar 2040 MHDT Aggregated 65 GAS San Bernar 2040 MHDT Aggregated 65 DSL San Bernar 2040 OBUS Aggregated 65 GAS San Bernar 2040 OBUS Aggregated 65 DSL San Bernar 2040 UBUS Aggregated 65 GAS San Bernar 2040 UBUS Aggregated 65 DSL LM Total Total LM Diesel Emissions E E-06 Total Diesel Emissions Total Emissions per Volume Source 3.15E E-05 for Modeling Scenario PLS2 Copyright 2015 Kleinfelder Page 12 of 16 SB County I-15 Ont 10/22/2015
125 EMFAC2014 (v1.0.7) Emission Rates Region Type: County Region: San Bernardino Additional Segment LM VMT/day HD VMT/day Calendar Year: 2040 SB I-15 in the Victorville area Northbound 191,852 85,830 Season: Annual SB I-15 in the Victorville area Southbound 178,052 88,524 Vehicle Classification: EMFAC2007 Categories *I-15 in the Victorville area Units: miles/day for VMT, g/mile for RUNEX, PMBW and PMTW Total segment length Total Segment Length Northbound 4.32 miles Total Segment Length Southbound 4.39 miles Emissions per Volume Source for 1- mile segment Model Eastbound Westbound Emission Factor Eastbound Westbound Eastbound Westbound Eastbound Westbound No. of Vol Sources No. of Vol Sources g/sec g/sec Region CalYr VehClass MdlYr Speed Fuel VMT Diesel VMT/day Diesel VMT/day PM10_RUNEX San Bernar 2040 HHDT Aggregated 55 GAS San Bernar 2040 HHDT Aggregated 55 DSL E E-05 HHDT Total San Bernar 2040 SBUS Aggregated 55 GAS San Bernar 2040 SBUS Aggregated 55 DSL San Bernar 2040 LDA Aggregated 65 GAS San Bernar 2040 LDA Aggregated 65 DSL San Bernar 2040 LDT1 Aggregated 65 GAS San Bernar 2040 LDT1 Aggregated 65 DSL San Bernar 2040 LDT2 Aggregated 65 GAS San Bernar 2040 LDT2 Aggregated 65 DSL San Bernar 2040 LHDT1 Aggregated 65 GAS San Bernar 2040 LHDT1 Aggregated 65 DSL San Bernar 2040 LHDT2 Aggregated 65 GAS San Bernar 2040 LHDT2 Aggregated 65 DSL San Bernar 2040 MDV Aggregated 65 GAS San Bernar 2040 MDV Aggregated 65 DSL San Bernar 2040 MH Aggregated 65 GAS San Bernar 2040 MH Aggregated 65 DSL San Bernar 2040 MHDT Aggregated 65 GAS San Bernar 2040 MHDT Aggregated 65 DSL San Bernar 2040 OBUS Aggregated 65 GAS San Bernar 2040 OBUS Aggregated 65 DSL San Bernar 2040 UBUS Aggregated 65 GAS San Bernar 2040 UBUS Aggregated 65 DSL LM Total Total LM Diesel Emissions E E-06 Total Diesel Emissions Total Emissions per Volume Source 1.97E E-05 for Modeling Scenario PLS2 Copyright 2015 Kleinfelder Page 13 of 16 SB I-15 10/22/2015
126 EMFAC2014 (v1.0.7) Emission Rates Region Type: County Region: San Bernardino Original Segment LM VMT/day HD VMT/day Calendar Year: 2040 SB SR-60 in Ontario Eastbound 243,107 33,829 Season: Annual SB SR-60 in Ontario Westbound 236,083 30,221 Vehicle Classification: EMFAC2007 Categories *SR 60 in Ontario, west of the I-15 interchange Units: miles/day for VMT, g/mile for RUNEX, PMBW and PMTW Total Segment Length Eastbound 2.35 miles Total Segment Length Westbound 2.22 miles Emissions per Volume Source for 1- mile segment Model Eastbound Westbound Emission Factor Eastbound Westbound Eastbound Westbound Eastbound Westbound No. of Vol Sources No. of Vol Sources g/sec g/sec Region CalYr VehClass MdlYr Speed Fuel VMT Diesel VMT/day Diesel VMT/day PM10_RUNEX San Bernar 2040 HHDT Aggregated 55 GAS San Bernar 2040 HHDT Aggregated 55 DSL E E-05 HHDT Total San Bernar 2040 SBUS Aggregated 55 GAS San Bernar 2040 SBUS Aggregated 55 DSL San Bernar 2040 LDA Aggregated 65 GAS San Bernar 2040 LDA Aggregated 65 DSL San Bernar 2040 LDT1 Aggregated 65 GAS San Bernar 2040 LDT1 Aggregated 65 DSL San Bernar 2040 LDT2 Aggregated 65 GAS San Bernar 2040 LDT2 Aggregated 65 DSL San Bernar 2040 LHDT1 Aggregated 65 GAS San Bernar 2040 LHDT1 Aggregated 65 DSL San Bernar 2040 LHDT2 Aggregated 65 GAS San Bernar 2040 LHDT2 Aggregated 65 DSL San Bernar 2040 MDV Aggregated 65 GAS San Bernar 2040 MDV Aggregated 65 DSL San Bernar 2040 MH Aggregated 65 GAS San Bernar 2040 MH Aggregated 65 DSL San Bernar 2040 MHDT Aggregated 65 GAS San Bernar 2040 MHDT Aggregated 65 DSL San Bernar 2040 OBUS Aggregated 65 GAS San Bernar 2040 OBUS Aggregated 65 DSL San Bernar 2040 UBUS Aggregated 65 GAS San Bernar 2040 UBUS Aggregated 65 DSL LM Total Total LM Diesel Emissions E E-06 Total Diesel Emissions Total Emissions per Volume Source 2.59E E-05 for Modeling Scenario PLS2 Copyright 2015 Kleinfelder Page 14 of 16 SB SR-60 Ont 10/22/2015
127 EMFAC2014 (v1.0.7) Emission Rates Region Type: County Region: Ventura Original Segment LM VMT/day HD VMT/day Calendar Year: 2040 VEN US-101 SB Ventura Freeway Northbound 163,426 29,060 Season: Annual VEN US-101 SB Ventura Freeway Southbound 163,698 30,050 Vehicle Classification: EMFAC2007 Categories *US-101 Freeway in San Buenaventura near the Ventura Harbor Units: miles/day for VMT, g/mile for RUNEX, PMBW and PMTW Total segment length Total Segment Length Northbound 3.21 miles Total Segment Length Southbound 3.26 miles Emissions per Volume Source for 1- mile segment Model Northbound Southbound Emission Factor Northbound Southbound Northbound Southbound Northbound Southbound No. of Vol Sources No. of Vol Sources g/sec g/sec Region CalYr VehClass MdlYr Speed Fuel VMT Diesel VMT/day Diesel VMT/day PM10_RUNEX Ventura 2040 HHDT Aggregated 55 GAS Ventura 2040 HHDT Aggregated 55 DSL E E-06 HHDT Total Ventura 2040 SBUS Aggregated 55 GAS Ventura 2040 SBUS Aggregated 55 DSL Ventura 2040 LDA Aggregated 65 GAS Ventura 2040 LDA Aggregated 65 DSL Ventura 2040 LDT1 Aggregated 65 GAS Ventura 2040 LDT1 Aggregated 65 DSL Ventura 2040 LDT2 Aggregated 65 GAS Ventura 2040 LDT2 Aggregated 65 DSL Ventura 2040 LHDT1 Aggregated 65 GAS Ventura 2040 LHDT1 Aggregated 65 DSL Ventura 2040 LHDT2 Aggregated 65 GAS Ventura 2040 LHDT2 Aggregated 65 DSL Ventura 2040 MDV Aggregated 65 GAS Ventura 2040 MDV Aggregated 65 DSL Ventura 2040 MH Aggregated 65 GAS Ventura 2040 MH Aggregated 65 DSL Ventura 2040 MHDT Aggregated 65 GAS Ventura 2040 MHDT Aggregated 65 DSL Ventura 2040 OBUS Aggregated 65 GAS Ventura 2040 OBUS Aggregated 65 DSL Ventura 2040 UBUS Aggregated 65 GAS Ventura 2040 UBUS Aggregated 65 DSL LM Total Total LM Diesel Emissions E E-06 Total Diesel Emissions Total Emissions per Volume Source 8.51E E-06 for Modeling Scenario PLS2 Copyright 2015 Kleinfelder Page 15 of 16 VEN US-101 SB 10/22/2015
128 EMFAC2014 (v1.0.7) Emission Rates Region Type: County Region: Ventura Original Segment LM VMT/day HD VMT/day Calendar Year: 2040 VEN US-101 in Thousand Oaks Northbound 67,736 10,476 Season: Annual VEN US-101 in Thousand Oaks Southbound 81,120 12,661 Vehicle Classification: EMFAC2007 Categories *US 101 in Thousand Oaks, east of SR 23 Units: miles/day for VMT, g/mile for RUNEX, PMBW and PMTW Total segment length Total Segment Length Northbound 0.79 miles Total Segment Length Southbound 0.94 miles Emissions per Volume Source for 1-mile segment Model Northbound Southbound Emission Factor Northbound Southbound Northbound Southbound Northbound Southbound No. of Vol Sources No. of Vol Sources g/sec g/sec Region CalYr VehClass MdlYr Speed Fuel VMT Diesel VMT/day Diesel VMT/day PM10_RUNEX Ventura 2040 HHDT Aggregated 55 GAS Ventura 2040 HHDT Aggregated 55 DSL E E-05 HHDT Total Ventura 2040 SBUS Aggregated 55 GAS Ventura 2040 SBUS Aggregated 55 DSL Ventura 2040 LDA Aggregated 65 GAS Ventura 2040 LDA Aggregated 65 DSL Ventura 2040 LDT1 Aggregated 65 GAS Ventura 2040 LDT1 Aggregated 65 DSL Ventura 2040 LDT2 Aggregated 65 GAS Ventura 2040 LDT2 Aggregated 65 DSL Ventura 2040 LHDT1 Aggregated 65 GAS Ventura 2040 LHDT1 Aggregated 65 DSL Ventura 2040 LHDT2 Aggregated 65 GAS Ventura 2040 LHDT2 Aggregated 65 DSL Ventura 2040 MDV Aggregated 65 GAS Ventura 2040 MDV Aggregated 65 DSL Ventura 2040 MH Aggregated 65 GAS Ventura 2040 MH Aggregated 65 DSL Ventura 2040 MHDT Aggregated 65 GAS Ventura 2040 MHDT Aggregated 65 DSL Ventura 2040 OBUS Aggregated 65 GAS Ventura 2040 OBUS Aggregated 65 DSL Ventura 2040 UBUS Aggregated 65 GAS Ventura 2040 UBUS Aggregated 65 DSL LM Total Total LM Diesel Emissions E E-06 Total Diesel Emissions Total Emissions per Volume Source for 2.11E E-05 Modeling Scenario PLS2 Copyright 2015 Kleinfelder Page 16 of 16 VEN US /22/2015
129 EMFAC2014 (v1.0.7) Emission Rates Region Type: County Region: Imperial Original Segment LM VMT/day HD VMT/day Calendar Year: 2040 IMP I-8 just east of El Centro Eastbound 25,684 11,364 Season: Annual IMP I-8 just east of El Centro Westbound 26,567 11,519 Vehicle Classification: EMFAC2007 Categories *IMP I-8 just east of El Centro Units: miles/day for VMT, g/mile for RUNEX, PMBW and PMTW Total Segment Length Eastbound 1.51 miles Total Segment Length Westbound 1.51 miles Emissions per Volume Source for 1- mile segment Model Eastbound Westbound Emission Factor Eastbound Westbound Eastbound Westbound Eastbound Westbound No. of Vol Sources No. of Vol Sources g/sec g/sec Region CalYr VehClass MdlYr Speed Fuel VMT Diesel VMT/day Diesel VMT/day PM10_RUNEX Imperial 2040 HHDT Aggregated 55 GAS Imperial 2040 HHDT Aggregated 55 DSL E E-06 HHDT Total Imperial 2040 SBUS Aggregated 55 GAS Imperial 2040 SBUS Aggregated 55 DSL Imperial 2040 LDA Aggregated 65 GAS Imperial 2040 LDA Aggregated 65 DSL Imperial 2040 LDT1 Aggregated 65 GAS Imperial 2040 LDT1 Aggregated 65 DSL Imperial 2040 LDT2 Aggregated 65 GAS Imperial 2040 LDT2 Aggregated 65 DSL Imperial 2040 LHDT1 Aggregated 65 GAS Imperial 2040 LHDT1 Aggregated 65 DSL Imperial 2040 LHDT2 Aggregated 65 GAS Imperial 2040 LHDT2 Aggregated 65 DSL Imperial 2040 MDV Aggregated 65 GAS Imperial 2040 MDV Aggregated 65 DSL Imperial 2040 MH Aggregated 65 GAS Imperial 2040 MH Aggregated 65 DSL Imperial 2040 MHDT Aggregated 65 GAS Imperial 2040 MHDT Aggregated 65 DSL Imperial 2040 OBUS Aggregated 65 GAS Imperial 2040 OBUS Aggregated 65 DSL Imperial 2040 UBUS Aggregated 65 GAS Imperial 2040 UBUS Aggregated 65 DSL LM Total Total LM Diesel Emissions E E-07 Total Diesel Emissions Total Emissions per Volume Source 6.13E E-06 for Modeling Scenario PLS3 Copywrite 2015 Kleinfelder Page 1 of 16 IMP I-8 El Centro 10/22/2015
130 EMFAC2014 (v1.0.7) Emission Rates Region Type: County Region: Imperial Original Segment LM VMT/day HD VMT/day Calendar Year: 2040 IMP SR-78 Eastbound 13,729 2,263 Season: Annual IMP SR-78 Westbound 8,221 2,418 Vehicle Classification: EMFAC2007 Categories *IMP SR-78: State Road 78 Freeway in Westmorland Units: miles/day for VMT, g/mile for RUNEX, PMBW and PMTW Total segment length Total Segment Length Eastbound 0.88 miles Total Segment Length Westbound 0.88 miles Emissions per Volume Source for 1- mile segment Model Eastbound Westbound Emission Factor Eastbound Westbound Eastbound Westbound Eastbound Westbound No. of Vol Sources No. of Vol Sources g/sec g/sec Region CalYr VehClass MdlYr Speed Fuel VMT Diesel VMT/day Diesel VMT/day PM10_RUNEX Imperial 2040 HHDT Aggregated 55 GAS Imperial 2040 HHDT Aggregated 55 DSL E E-06 HHDT Total Imperial 2040 SBUS Aggregated 55 GAS Imperial 2040 SBUS Aggregated 55 DSL Imperial 2040 LDA Aggregated 65 GAS Imperial 2040 LDA Aggregated 65 DSL Imperial 2040 LDT1 Aggregated 65 GAS Imperial 2040 LDT1 Aggregated 65 DSL Imperial 2040 LDT2 Aggregated 65 GAS Imperial 2040 LDT2 Aggregated 65 DSL Imperial 2040 LHDT1 Aggregated 65 GAS Imperial 2040 LHDT1 Aggregated 65 DSL Imperial 2040 LHDT2 Aggregated 65 GAS Imperial 2040 LHDT2 Aggregated 65 DSL Imperial 2040 MDV Aggregated 65 GAS Imperial 2040 MDV Aggregated 65 DSL Imperial 2040 MH Aggregated 65 GAS Imperial 2040 MH Aggregated 65 DSL Imperial 2040 MHDT Aggregated 65 GAS Imperial 2040 MHDT Aggregated 65 DSL Imperial 2040 OBUS Aggregated 65 GAS Imperial 2040 OBUS Aggregated 65 DSL Imperial 2040 UBUS Aggregated 65 GAS Imperial 2040 UBUS Aggregated 65 DSL LM Total Total LM Diesel Emissions E E-07 Total Diesel Emissions Total Emissions per Volume Source 2.11E E-06 for Modeling Scenario PLS3 Copywrite 2015 Kleinfelder Page 2 of 16 IMP SR-78 10/22/2015
131 EMFAC2014 (v1.0.7) Emission Rates Region Type: County Region: Los Angeles Additional Segment LM VMT/day HD VMT/day Calendar Year: 2040 LA I-110 Northbound 138,972 23,539 Season: Annual LA I-110 Southbound 138,737 20,874 Vehicle Classification: EMFAC2007 Categories *LA I-110 in the LA County area, Carson Units: miles/day for VMT, g/mile for RUNEX, PMBW and PMTW Total segment length Total Segment Length Northbound 1.98 miles Total Segment Length Southbound 1.92 miles Emissions per Volume Source for 1- mile segment Model Northbound Southbound Emission Factor Northbound Southbound Northbound Southbound Northbound Southbound No. of Vol Sources No. of Vol Sources g/sec g/sec Region CalYr VehClass MdlYr Speed Fuel VMT Diesel VMT/day Diesel VMT/day PM10_RUNEX Los Angele 2040 HHDT Aggregated 55 GAS Los Angele 2040 HHDT Aggregated 55 DSL E E-05 HHDT Total Los Angele 2040 SBUS Aggregated 55 GAS Los Angele 2040 SBUS Aggregated 55 DSL Los Angele 2040 LDA Aggregated 65 GAS Los Angele 2040 LDA Aggregated 65 DSL Los Angele 2040 LDT1 Aggregated 65 GAS Los Angele 2040 LDT1 Aggregated 65 DSL Los Angele 2040 LDT2 Aggregated 65 GAS Los Angele 2040 LDT2 Aggregated 65 DSL Los Angele 2040 LHDT1 Aggregated 65 GAS Los Angele 2040 LHDT1 Aggregated 65 DSL Los Angele 2040 LHDT2 Aggregated 65 GAS Los Angele 2040 LHDT2 Aggregated 65 DSL Los Angele 2040 MDV Aggregated 65 GAS Los Angele 2040 MDV Aggregated 65 DSL Los Angele 2040 MH Aggregated 65 GAS Los Angele 2040 MH Aggregated 65 DSL Los Angele 2040 MHDT Aggregated 65 GAS Los Angele 2040 MHDT Aggregated 65 DSL Los Angele 2040 OBUS Aggregated 65 GAS Los Angele 2040 OBUS Aggregated 65 DSL Los Angele 2040 UBUS Aggregated 65 GAS Los Angele 2040 UBUS Aggregated 65 DSL LM Total Total LM Diesel Emissions E E-06 Total Diesel Emissions Total Emissions per Volume Source 2.33E E-05 for Modeling Scenario PLS3 Copywrite 2015 Kleinfelder Page 3 of 16 LA County I /22/2015
132 EMFAC2014 (v1.0.7) Emission Rates Region Type: County Region: Los Angeles Original Segment LM VMT/day HD VMT/day Calendar Year: 2040 LA I-710 in Compton Northbound 165,574 24,677 Season: Annual LA I-710 in Compton Southbound 158,749 21,609 Vehicle Classification: EMFAC2007 Categories *LA I-710 in Compton, north of the intersection with SR 91 Units: miles/day for VMT, g/mile for RUNEX, PMBW and PMTW Total Segment Length Northbound 1.34 miles Total Segment Length Southbound 1.34 miles Emissions per Volume Source for 1- mile segment Model Northbound Southbound Emission Factor Northbound Southbound Northbound Southbound Northbound Southbound No. of Vol Sources No. of Vol Sources g/sec g/sec Region CalYr VehClass MdlYr Speed Fuel VMT Diesel VMT/day Diesel VMT/day PM10_RUNEX Los Angele 2040 HHDT Aggregated 55 GAS Los Angele 2040 HHDT Aggregated 55 DSL E E-05 HHDT Total Los Angele 2040 SBUS Aggregated 55 GAS Los Angele 2040 SBUS Aggregated 55 DSL Los Angele 2040 LDA Aggregated 65 GAS Los Angele 2040 LDA Aggregated 65 DSL Los Angele 2040 LDT1 Aggregated 65 GAS Los Angele 2040 LDT1 Aggregated 65 DSL Los Angele 2040 LDT2 Aggregated 65 GAS Los Angele 2040 LDT2 Aggregated 65 DSL Los Angele 2040 LHDT1 Aggregated 65 GAS Los Angele 2040 LHDT1 Aggregated 65 DSL Los Angele 2040 LHDT2 Aggregated 65 GAS Los Angele 2040 LHDT2 Aggregated 65 DSL Los Angele 2040 MDV Aggregated 65 GAS Los Angele 2040 MDV Aggregated 65 DSL Los Angele 2040 MH Aggregated 65 GAS Los Angele 2040 MH Aggregated 65 DSL Los Angele 2040 MHDT Aggregated 65 GAS Los Angele 2040 MHDT Aggregated 65 DSL Los Angele 2040 OBUS Aggregated 65 GAS Los Angele 2040 OBUS Aggregated 65 DSL Los Angele 2040 UBUS Aggregated 65 GAS Los Angele 2040 UBUS Aggregated 65 DSL LM Total Total LM Diesel Emissions E E-05 Total Diesel Emissions Total Emissions per Volume Source 5.03E E-05 for Modeling Scenario PLS3 Copywrite 2015 Kleinfelder Page 4 of 16 LA County I /22/2015
133 EMFAC2014 (v1.0.7) Emission Rates Region Type: County Region: Los Angeles Original Segment LM VMT/day HD VMT/day Calendar Year: 2040 LA SR-60 DB Eastbound 322,875 39,502 Season: Annual LA SR-60 DB Westbound 361,180 36,844 Vehicle Classification: EMFAC2007 Categories *LA SR-60 near Diamond Bar Units: miles/day for VMT, g/mile for RUNEX, PMBW and PMTW Total Segment Length Eastbound 3.14 miles Total Segment Length Westbound 3.12 miles Emissions per Volume Source for 1- mile segment Model Eastbound Westbound Emission Factor Eastbound Westbound Eastbound Westbound Eastbound Westbound No. of Vol Sources No. of Vol Sources g/sec g/sec Region CalYr VehClass MdlYr Speed Fuel VMT Diesel VMT/day Diesel VMT/day PM10_RUNEX Los Angeles 2040 HHDT Aggregated 55 GAS Los Angeles 2040 HHDT Aggregated 55 DSL E E-05 HHDT Total Los Angeles 2040 SBUS Aggregated 55 GAS Los Angeles 2040 SBUS Aggregated 55 DSL Los Angeles 2040 LDA Aggregated 65 GAS Los Angeles 2040 LDA Aggregated 65 DSL Los Angeles 2040 LDT1 Aggregated 65 GAS Los Angeles 2040 LDT1 Aggregated 65 DSL Los Angeles 2040 LDT2 Aggregated 65 GAS Los Angeles 2040 LDT2 Aggregated 65 DSL Los Angeles 2040 LHDT1 Aggregated 65 GAS Los Angeles 2040 LHDT1 Aggregated 65 DSL Los Angeles 2040 LHDT2 Aggregated 65 GAS Los Angeles 2040 LHDT2 Aggregated 65 DSL Los Angeles 2040 MDV Aggregated 65 GAS Los Angeles 2040 MDV Aggregated 65 DSL Los Angeles 2040 MH Aggregated 65 GAS Los Angeles 2040 MH Aggregated 65 DSL Los Angeles 2040 MHDT Aggregated 65 GAS Los Angeles 2040 MHDT Aggregated 65 DSL Los Angeles 2040 OBUS Aggregated 65 GAS Los Angeles 2040 OBUS Aggregated 65 DSL Los Angeles 2040 UBUS Aggregated 65 GAS Los Angeles 2040 UBUS Aggregated 65 DSL LM Total Total LM Diesel Emissions E E-05 Total Diesel Emissions Total Emissions per Volume Source 2.77E E-05 for Modeling Scenario PLS3 Copywrite 2015 Kleinfelder Page 5 of 16 LA County SR60 DB 10/22/2015
134 EMFAC2014 (v1.0.7) Emission Rates Region Type: County Region: Los Angeles Additional Segment LM VMT/day HD VMT/day Calendar Year: 2040 LA SR-60 SEM, El Monte Eastbound 182,089 14,039 Season: Annual LA SR-60 SEM, El Monte Westbound 196,074 16,103 Vehicle Classification: EMFAC2007 Categories *LA SR-60 in the El Monte / Peck Rd area Units: miles/day for VMT, g/mile for RUNEX, PMBW and PMTW Total segment length Total Segment Length Eastbound 1.52 miles Total Segment Length Westbound 1.50 miles Emissions per Volume Source for 1-mile segment Model Northbound Southbound Emission Factor Northbound Southbound Northbound Southbound Northbound Southbound No. of Vol Sources No. of Vol Sources g/sec g/sec Region CalYr VehClass MdlYr Speed Fuel VMT Diesel VMT/day Diesel VMT/day PM10_RUNEX Los Angeles 2040 HHDT Aggregated 55 GAS Los Angeles 2040 HHDT Aggregated 55 DSL E E-05 HHDT Total Los Angeles 2040 SBUS Aggregated 55 GAS Los Angeles 2040 SBUS Aggregated 55 DSL Los Angeles 2040 LDA Aggregated 65 GAS Los Angeles 2040 LDA Aggregated 65 DSL Los Angeles 2040 LDT1 Aggregated 65 GAS Los Angeles 2040 LDT1 Aggregated 65 DSL Los Angeles 2040 LDT2 Aggregated 65 GAS Los Angeles 2040 LDT2 Aggregated 65 DSL Los Angeles 2040 LHDT1 Aggregated 65 GAS Los Angeles 2040 LHDT1 Aggregated 65 DSL Los Angeles 2040 LHDT2 Aggregated 65 GAS Los Angeles 2040 LHDT2 Aggregated 65 DSL Los Angeles 2040 MDV Aggregated 65 GAS Los Angeles 2040 MDV Aggregated 65 DSL Los Angeles 2040 MH Aggregated 65 GAS Los Angeles 2040 MH Aggregated 65 DSL Los Angeles 2040 MHDT Aggregated 65 GAS Los Angeles 2040 MHDT Aggregated 65 DSL Los Angeles 2040 OBUS Aggregated 65 GAS Los Angeles 2040 OBUS Aggregated 65 DSL Los Angeles 2040 UBUS Aggregated 65 GAS Los Angeles 2040 UBUS Aggregated 65 DSL LM Total Total LM Diesel Emissions E E-05 Total Diesel Emissions Total Emissions per Volume 3.06E E-05 Source for Modeling Scenario PLS3 Copywrite 2015 Kleinfelder Page 6 of 16 LA County SR-60 10/22/2015
135 EMFAC2014 (v1.0.7) Emission Rates Region Type: County Region: Orange Original Segment LM VMT/day HD VMT/day Calendar Year: 2040 ORA I-5 Northbound 197,857 19,018 Season: Annual ORA I-5 Southbound 120,743 12,045 Vehicle Classification: EMFAC2007 Categories *ORA I-5 in Orange County, near intersection of SR 57 and SR 22 Units: miles/day for VMT, g/mile for RUNEX, PMBW and PMTW Total segment length Total Segment Length Northbound 1.32 miles Total Segment Length Southbound 0.81 miles Emissions per Volume Source for 1- mile segment Model Northbound Southbound Emission Factor Northbound Southbound Northbound Southbound Northbound Southbound No. of Vol Sources No. of Vol Sources g/sec g/sec Region CalYr VehClass MdlYr Speed Fuel VMT Diesel VMT/day Diesel VMT/day PM10_RUNEX Orange 2040 HHDT Aggregated 55 GAS Orange 2040 HHDT Aggregated 55 DSL E E-05 HHDT Total Orange 2040 SBUS Aggregated 55 GAS Orange 2040 SBUS Aggregated 55 DSL Orange 2040 LDA Aggregated 65 GAS Orange 2040 LDA Aggregated 65 DSL Orange 2040 LDT1 Aggregated 65 GAS Orange 2040 LDT1 Aggregated 65 DSL Orange 2040 LDT2 Aggregated 65 GAS Orange 2040 LDT2 Aggregated 65 DSL Orange 2040 LHDT1 Aggregated 65 GAS Orange 2040 LHDT1 Aggregated 65 DSL Orange 2040 LHDT2 Aggregated 65 GAS Orange 2040 LHDT2 Aggregated 65 DSL Orange 2040 MDV Aggregated 65 GAS Orange 2040 MDV Aggregated 65 DSL Orange 2040 MH Aggregated 65 GAS Orange 2040 MH Aggregated 65 DSL Orange 2040 MHDT Aggregated 65 GAS Orange 2040 MHDT Aggregated 65 DSL Orange 2040 OBUS Aggregated 65 GAS Orange 2040 OBUS Aggregated 65 DSL Orange 2040 UBUS Aggregated 65 GAS Orange 2040 UBUS Aggregated 65 DSL LM Total Total LM Diesel Emissions E E-05 Total Diesel Emissions Total Emissions per Volume Source 4.45E E-05 for Modeling Scenario PLS3 Copywrite 2015 Kleinfelder Page 7 of 16 Orange County I-5 10/22/2015
136 EMFAC2014 (v1.0.7) Emission Rates Region Type: County Region: Orange Original Segment LM VMT/day HD VMT/day Calendar Year: 2040 ORA I-405 Seal Beach, Corona Northbound 217,162 33,790 Season: Annual ORA I-405 Seal Beach, Corona Southbound 200,359 31,149 Vehicle Classification: EMFAC2007 Categories *I-405 in Seal Beach, east of the I-605 interchange Units: miles/day for VMT, g/mile for RUNEX, PMBW and PMTW Total Segment Length Northbound 1.09 miles Total Segment Length Southbound 1.02 miles Emissions per Volume Source for 1- mile segment Model Northbound Southbound Emission Factor Northbound Southbound Northbound Southbound Northbound Southbound No. of Vol Sources No. of Vol Sources g/sec g/sec Region CalYr VehClass MdlYr Speed Fuel VMT Diesel VMT/day Diesel VMT/day PM10_RUNEX Orange 2040 HHDT Aggregated 55 GAS Orange 2040 HHDT Aggregated 55 DSL E E-05 HHDT Total Orange 2040 SBUS Aggregated 55 GAS Orange 2040 SBUS Aggregated 55 DSL Orange 2040 LDA Aggregated 65 GAS Orange 2040 LDA Aggregated 65 DSL Orange 2040 LDT1 Aggregated 65 GAS Orange 2040 LDT1 Aggregated 65 DSL Orange 2040 LDT2 Aggregated 65 GAS Orange 2040 LDT2 Aggregated 65 DSL Orange 2040 LHDT1 Aggregated 65 GAS Orange 2040 LHDT1 Aggregated 65 DSL Orange 2040 LHDT2 Aggregated 65 GAS Orange 2040 LHDT2 Aggregated 65 DSL Orange 2040 MDV Aggregated 65 GAS Orange 2040 MDV Aggregated 65 DSL Orange 2040 MH Aggregated 65 GAS Orange 2040 MH Aggregated 65 DSL Orange 2040 MHDT Aggregated 65 GAS Orange 2040 MHDT Aggregated 65 DSL Orange 2040 OBUS Aggregated 65 GAS Orange 2040 OBUS Aggregated 65 DSL Orange 2040 UBUS Aggregated 65 GAS Orange 2040 UBUS Aggregated 65 DSL LM Total Total LM Diesel Emissions E E-05 Total Diesel Emissions Total Emissions per Volume Source 7.67E E-05 for Modeling Scenario PLS3 Copywrite 2015 Kleinfelder Page 8 of 16 Orange County I /22/2015
137 EMFAC2014 (v1.0.7) Emission Rates Region Type: County Region: Riverside Additional Segment LM VMT/day HD VMT/day Calendar Year: 2040 RIV I-10 in the Banning area Eastbound 309, ,499 Season: Annual RIV I-10 in the Banning area Westbound 365, ,836 Vehicle Classification: EMFAC2007 Categories *RIV I-10 in the Banning area Units: miles/day for VMT, g/mile for RUNEX, PMBW and PMTW Total segment length Total Segment Length Eastbound 5.01 miles Total Segment Length Westbound 4.98 miles Emissions per Volume Source for 1- mile segment Model Eastbound Westbound Emission Factor Eastbound Westbound Eastbound Westbound Eastbound Westbound No. of Vol Sources No. of Vol Sources g/sec g/sec Region CalYr VehClass MdlYr Speed Fuel VMT Diesel VMT/day Diesel VMT/day PM10_RUNEX Riverside 2040 HHDT Aggregated 55 GAS Riverside 2040 HHDT Aggregated 55 DSL E E-05 HHDT Total Riverside 2040 SBUS Aggregated 55 GAS Riverside 2040 SBUS Aggregated 55 DSL Riverside 2040 LDA Aggregated 65 GAS Riverside 2040 LDA Aggregated 65 DSL Riverside 2040 LDT1 Aggregated 65 GAS Riverside 2040 LDT1 Aggregated 65 DSL Riverside 2040 LDT2 Aggregated 65 GAS Riverside 2040 LDT2 Aggregated 65 DSL Riverside 2040 LHDT1 Aggregated 65 GAS Riverside 2040 LHDT1 Aggregated 65 DSL Riverside 2040 LHDT2 Aggregated 65 GAS Riverside 2040 LHDT2 Aggregated 65 DSL Riverside 2040 MDV Aggregated 65 GAS Riverside 2040 MDV Aggregated 65 DSL Riverside 2040 MH Aggregated 65 GAS Riverside 2040 MH Aggregated 65 DSL Riverside 2040 MHDT Aggregated 65 GAS Riverside 2040 MHDT Aggregated 65 DSL Riverside 2040 OBUS Aggregated 65 GAS Riverside 2040 OBUS Aggregated 65 DSL Riverside 2040 UBUS Aggregated 65 GAS Riverside 2040 UBUS Aggregated 65 DSL LM Total Total LM Diesel Emissions E E-06 Total Diesel Emissions Total Emissions per Volume Source 3.71E E-05 for Modeling Scenario PLS3 Copywrite 2015 Kleinfelder Page 9 of 16 RIV I-10 10/22/2015
138 EMFAC2014 (v1.0.7) Emission Rates Region Type: County Region: Riverside Additional Segment LM VMT/day HD VMT/day Calendar Year: 2040 RIV I-15, Riverside Northbound 467,052 75,882 Season: Annual RIV I-15, Riverside Southbound 553,597 90,864 Vehicle Classification: EMFAC2007 Categories *RIV I-15, Riverside County, near Temecula Units: miles/day for VMT, g/mile for RUNEX, PMBW and PMTW Total segment length Total Segment Length Northbound 4.81 miles Total Segment Length Southbound 5.83 miles Emissions per Volume Source for 1- mile segment Model Eastbound Westbound Emission Factor Eastbound Westbound Eastbound Westbound Eastbound Westbound No. of Vol Sources No. of Vol Sources g/sec g/sec Region CalYr VehClass MdlYr Speed Fuel VMT Diesel VMT/day Diesel VMT/day PM10_RUNEX Riverside 2040 HHDT Aggregated 55 GAS Riverside 2040 HHDT Aggregated 55 DSL E E-05 HHDT Total Riverside 2040 SBUS Aggregated 55 GAS Riverside 2040 SBUS Aggregated 55 DSL Riverside 2040 LDA Aggregated 65 GAS Riverside 2040 LDA Aggregated 65 DSL Riverside 2040 LDT1 Aggregated 65 GAS Riverside 2040 LDT1 Aggregated 65 DSL Riverside 2040 LDT2 Aggregated 65 GAS Riverside 2040 LDT2 Aggregated 65 DSL Riverside 2040 LHDT1 Aggregated 65 GAS Riverside 2040 LHDT1 Aggregated 65 DSL Riverside 2040 LHDT2 Aggregated 65 GAS Riverside 2040 LHDT2 Aggregated 65 DSL Riverside 2040 MDV Aggregated 65 GAS Riverside 2040 MDV Aggregated 65 DSL Riverside 2040 MH Aggregated 65 GAS Riverside 2040 MH Aggregated 65 DSL Riverside 2040 MHDT Aggregated 65 GAS Riverside 2040 MHDT Aggregated 65 DSL Riverside 2040 OBUS Aggregated 65 GAS Riverside 2040 OBUS Aggregated 65 DSL Riverside 2040 UBUS Aggregated 65 GAS Riverside 2040 UBUS Aggregated 65 DSL LM Total Total LM Diesel Emissions E E-06 Total Diesel Emissions Total Emissions per Volume Source 2.47E E-05 for Modeling Scenario PLS3 Copywrite 2015 Kleinfelder Page 10 of 16 RIV I-15 10/22/2015
139 EMFAC2014 (v1.0.7) Emission Rates Region Type: County Region: Riverside Original Segment LM VMT/day HD VMT/day Calendar Year: 2040 RIV SR-91 in Corona Eastbound 279,032 43,468 Season: Annual RIV SR-91 in Corona Westbound 261,691 45,686 Vehicle Classification: EMFAC2007 Categories *SR 91 in Corona, east of the intersection with SR 71 Units: miles/day for VMT, g/mile for RUNEX, PMBW and PMTW Total Segment Length Eastbound 2.01 miles Total Segment Length Westbound 1.74 miles Emissions per Volume Source for 1- mile segment Model Eastbound Westbound Emission Factor Eastbound Westbound Eastbound Westbound Eastbound Westbound No. of Vol Sources No. of Vol Sources g/sec g/sec Region CalYr VehClass MdlYr Speed Fuel VMT Diesel VMT/day Diesel VMT/day PM10_RUNEX Riverside 2040 HHDT Aggregated 55 GAS Riverside 2040 HHDT Aggregated 55 DSL E E-05 HHDT Total Riverside 2040 SBUS Aggregated 55 GAS Riverside 2040 SBUS Aggregated 55 DSL Riverside 2040 LDA Aggregated 65 GAS Riverside 2040 LDA Aggregated 65 DSL Riverside 2040 LDT1 Aggregated 65 GAS Riverside 2040 LDT1 Aggregated 65 DSL Riverside 2040 LDT2 Aggregated 65 GAS Riverside 2040 LDT2 Aggregated 65 DSL Riverside 2040 LHDT1 Aggregated 65 GAS Riverside 2040 LHDT1 Aggregated 65 DSL Riverside 2040 LHDT2 Aggregated 65 GAS Riverside 2040 LHDT2 Aggregated 65 DSL Riverside 2040 MDV Aggregated 65 GAS Riverside 2040 MDV Aggregated 65 DSL Riverside 2040 MH Aggregated 65 GAS Riverside 2040 MH Aggregated 65 DSL Riverside 2040 MHDT Aggregated 65 GAS Riverside 2040 MHDT Aggregated 65 DSL Riverside 2040 OBUS Aggregated 65 GAS Riverside 2040 OBUS Aggregated 65 DSL Riverside 2040 UBUS Aggregated 65 GAS Riverside 2040 UBUS Aggregated 65 DSL LM Total Total LM Diesel Emissions E E-05 Total Diesel Emissions Total Emissions per Volume Source 4.41E E-05 for Modeling Scenario PLS3 Copywrite 2015 Kleinfelder Page 11 of 16 RIV SR-91 Corona 10/22/2015
140 EMFAC2014 (v1.0.7) Emission Rates Region Type: County Region: San Bernardino Original Segment LM VMT/day HD VMT/day Calendar Year: 2040 SB I-15 in Ontario Northbound 242,855 56,315 Season: Annual SB I-15 in Ontario Southbound 226,754 58,633 Vehicle Classification: EMFAC2007 Categories *SB I-15 in Ontario Units: miles/day for VMT, g/mile for RUNEX, PMBW and PMTW Total Segment Length Northbound 2.95 miles Total Segment Length Southbound 2.97 miles Emissions per Volume Source for 1- mile segment Model Northbound Southbound Emission Factor Northbound Southbound Northbound Southbound Northbound Southbound No. of Vol Sources No. of Vol Sources g/sec g/sec Region CalYr VehClass MdlYr Speed Fuel VMT Diesel VMT/day Diesel VMT/day PM10_RUNEX San Bernar 2040 HHDT Aggregated 55 GAS San Bernar 2040 HHDT Aggregated 55 DSL E E-05 HHDT Total San Bernar 2040 SBUS Aggregated 55 GAS San Bernar 2040 SBUS Aggregated 55 DSL San Bernar 2040 LDA Aggregated 65 GAS San Bernar 2040 LDA Aggregated 65 DSL San Bernar 2040 LDT1 Aggregated 65 GAS San Bernar 2040 LDT1 Aggregated 65 DSL San Bernar 2040 LDT2 Aggregated 65 GAS San Bernar 2040 LDT2 Aggregated 65 DSL San Bernar 2040 LHDT1 Aggregated 65 GAS San Bernar 2040 LHDT1 Aggregated 65 DSL San Bernar 2040 LHDT2 Aggregated 65 GAS San Bernar 2040 LHDT2 Aggregated 65 DSL San Bernar 2040 MDV Aggregated 65 GAS San Bernar 2040 MDV Aggregated 65 DSL San Bernar 2040 MH Aggregated 65 GAS San Bernar 2040 MH Aggregated 65 DSL San Bernar 2040 MHDT Aggregated 65 GAS San Bernar 2040 MHDT Aggregated 65 DSL San Bernar 2040 OBUS Aggregated 65 GAS San Bernar 2040 OBUS Aggregated 65 DSL San Bernar 2040 UBUS Aggregated 65 GAS San Bernar 2040 UBUS Aggregated 65 DSL LM Total Total LM Diesel Emissions E E-06 Total Diesel Emissions Total Emissions per Volume Source 3.12E E-05 for Modeling Scenario PLS3 Copywrite 2015 Kleinfelder Page 12 of 16 SB County I-15 Ont 10/22/2015
141 EMFAC2014 (v1.0.7) Emission Rates Region Type: County Region: San Bernardino Additional Segment LM VMT/day HD VMT/day Calendar Year: 2040 SB I-15 in the Victorville area Northbound 191,880 85,605 Season: Annual SB I-15 in the Victorville area Southbound 177,731 88,343 Vehicle Classification: EMFAC2007 Categories *I-15 in the Victorville area Units: miles/day for VMT, g/mile for RUNEX, PMBW and PMTW Total segment length Total Segment Length Northbound 4.32 miles Total Segment Length Southbound 4.39 miles Emissions per Volume Source for 1- mile segment Model Eastbound Westbound Emission Factor Eastbound Westbound Eastbound Westbound Eastbound Westbound No. of Vol Sources No. of Vol Sources g/sec g/sec Region CalYr VehClass MdlYr Speed Fuel VMT Diesel VMT/day Diesel VMT/day PM10_RUNEX San Bernar 2040 HHDT Aggregated 55 GAS San Bernar 2040 HHDT Aggregated 55 DSL E E-05 HHDT Total San Bernar 2040 SBUS Aggregated 55 GAS San Bernar 2040 SBUS Aggregated 55 DSL San Bernar 2040 LDA Aggregated 65 GAS San Bernar 2040 LDA Aggregated 65 DSL San Bernar 2040 LDT1 Aggregated 65 GAS San Bernar 2040 LDT1 Aggregated 65 DSL San Bernar 2040 LDT2 Aggregated 65 GAS San Bernar 2040 LDT2 Aggregated 65 DSL San Bernar 2040 LHDT1 Aggregated 65 GAS San Bernar 2040 LHDT1 Aggregated 65 DSL San Bernar 2040 LHDT2 Aggregated 65 GAS San Bernar 2040 LHDT2 Aggregated 65 DSL San Bernar 2040 MDV Aggregated 65 GAS San Bernar 2040 MDV Aggregated 65 DSL San Bernar 2040 MH Aggregated 65 GAS San Bernar 2040 MH Aggregated 65 DSL San Bernar 2040 MHDT Aggregated 65 GAS San Bernar 2040 MHDT Aggregated 65 DSL San Bernar 2040 OBUS Aggregated 65 GAS San Bernar 2040 OBUS Aggregated 65 DSL San Bernar 2040 UBUS Aggregated 65 GAS San Bernar 2040 UBUS Aggregated 65 DSL LM Total Total LM Diesel Emissions E E-06 Total Diesel Emissions Total Emissions per Volume Source 1.96E E-05 for Modeling Scenario PLS3 Copywrite 2015 Kleinfelder Page 13 of 16 SB I-15 10/22/2015
142 EMFAC2014 (v1.0.7) Emission Rates Region Type: County Region: San Bernardino Original Segment LM VMT/day HD VMT/day Calendar Year: 2040 SB SR-60 in Ontario Eastbound 239,792 34,038 Season: Annual SB SR-60 in Ontario Westbound 232,920 30,838 Vehicle Classification: EMFAC2007 Categories *SR 60 in Ontario, west of the I-15 interchange Units: miles/day for VMT, g/mile for RUNEX, PMBW and PMTW Total Segment Length Eastbound 2.35 miles Total Segment Length Westbound 2.22 miles Emissions per Volume Source for 1- mile segment Model Eastbound Westbound Emission Factor Eastbound Westbound Eastbound Westbound Eastbound Westbound No. of Vol Sources No. of Vol Sources g/sec g/sec Region CalYr VehClass MdlYr Speed Fuel VMT Diesel VMT/day Diesel VMT/day PM10_RUNEX San Bernar 2040 HHDT Aggregated 55 GAS San Bernar 2040 HHDT Aggregated 55 DSL E E-05 HHDT Total San Bernar 2040 SBUS Aggregated 55 GAS San Bernar 2040 SBUS Aggregated 55 DSL San Bernar 2040 LDA Aggregated 65 GAS San Bernar 2040 LDA Aggregated 65 DSL San Bernar 2040 LDT1 Aggregated 65 GAS San Bernar 2040 LDT1 Aggregated 65 DSL San Bernar 2040 LDT2 Aggregated 65 GAS San Bernar 2040 LDT2 Aggregated 65 DSL San Bernar 2040 LHDT1 Aggregated 65 GAS San Bernar 2040 LHDT1 Aggregated 65 DSL San Bernar 2040 LHDT2 Aggregated 65 GAS San Bernar 2040 LHDT2 Aggregated 65 DSL San Bernar 2040 MDV Aggregated 65 GAS San Bernar 2040 MDV Aggregated 65 DSL San Bernar 2040 MH Aggregated 65 GAS San Bernar 2040 MH Aggregated 65 DSL San Bernar 2040 MHDT Aggregated 65 GAS San Bernar 2040 MHDT Aggregated 65 DSL San Bernar 2040 OBUS Aggregated 65 GAS San Bernar 2040 OBUS Aggregated 65 DSL San Bernar 2040 UBUS Aggregated 65 GAS San Bernar 2040 UBUS Aggregated 65 DSL LM Total Total LM Diesel Emissions E E-06 Total Diesel Emissions Total Emissions per Volume Source 2.60E E-05 for Modeling Scenario PLS3 Copywrite 2015 Kleinfelder Page 14 of 16 SB SR-60 Ont 10/22/2015
143 EMFAC2014 (v1.0.7) Emission Rates Region Type: County Region: Ventura Original Segment LM VMT/day HD VMT/day Calendar Year: 2040 VEN US-101 SB Ventura Freeway Northbound 163,992 28,969 Season: Annual VEN US-101 SB Ventura Freeway Southbound 164,327 30,022 Vehicle Classification: EMFAC2007 Categories *US-101 Freeway in San Buenaventura near the Ventura Harbor Units: miles/day for VMT, g/mile for RUNEX, PMBW and PMTW Total segment length Total Segment Length Northbound 3.21 miles Total Segment Length Southbound 3.26 miles Emissions per Volume Source for 1- mile segment Model Northbound Southbound Emission Factor Northbound Southbound Northbound Southbound Northbound Southbound No. of Vol Sources No. of Vol Sources g/sec g/sec Region CalYr VehClass MdlYr Speed Fuel VMT Diesel VMT/day Diesel VMT/day PM10_RUNEX Ventura 2040 HHDT Aggregated 55 GAS Ventura 2040 HHDT Aggregated 55 DSL E E-06 HHDT Total Ventura 2040 SBUS Aggregated 55 GAS Ventura 2040 SBUS Aggregated 55 DSL Ventura 2040 LDA Aggregated 65 GAS Ventura 2040 LDA Aggregated 65 DSL Ventura 2040 LDT1 Aggregated 65 GAS Ventura 2040 LDT1 Aggregated 65 DSL Ventura 2040 LDT2 Aggregated 65 GAS Ventura 2040 LDT2 Aggregated 65 DSL Ventura 2040 LHDT1 Aggregated 65 GAS Ventura 2040 LHDT1 Aggregated 65 DSL Ventura 2040 LHDT2 Aggregated 65 GAS Ventura 2040 LHDT2 Aggregated 65 DSL Ventura 2040 MDV Aggregated 65 GAS Ventura 2040 MDV Aggregated 65 DSL Ventura 2040 MH Aggregated 65 GAS Ventura 2040 MH Aggregated 65 DSL Ventura 2040 MHDT Aggregated 65 GAS Ventura 2040 MHDT Aggregated 65 DSL Ventura 2040 OBUS Aggregated 65 GAS Ventura 2040 OBUS Aggregated 65 DSL Ventura 2040 UBUS Aggregated 65 GAS Ventura 2040 UBUS Aggregated 65 DSL LM Total Total LM Diesel Emissions E E-06 Total Diesel Emissions Total Emissions per Volume Source 8.50E E-06 for Modeling Scenario PLS3 Copywrite 2015 Kleinfelder Page 15 of 16 VEN US-101 SB 10/22/2015
144 EMFAC2014 (v1.0.7) Emission Rates Region Type: County Region: Ventura Original Segment LM VMT/day HD VMT/day Calendar Year: 2040 VEN US-101 in Thousand Oaks Northbound 66,450 10,473 Season: Annual VEN US-101 in Thousand Oaks Southbound 79,638 12,646 Vehicle Classification: EMFAC2007 Categories *US 101 in Thousand Oaks, east of SR 23 Units: miles/day for VMT, g/mile for RUNEX, PMBW and PMTW Total segment length Total Segment Length Northbound 0.79 miles Total Segment Length Southbound 0.94 miles Emissions per Volume Source for 1- mile segment Model Northbound Southbound Emission Factor Northbound Southbound Northbound Southbound Northbound Southbound No. of Vol Sources No. of Vol Sources g/sec g/sec Region CalYr VehClass MdlYr Speed Fuel VMT Diesel VMT/day Diesel VMT/day PM10_RUNEX Ventura 2040 HHDT Aggregated 55 GAS Ventura 2040 HHDT Aggregated 55 DSL E E-05 HHDT Total Ventura 2040 SBUS Aggregated 55 GAS Ventura 2040 SBUS Aggregated 55 DSL Ventura 2040 LDA Aggregated 65 GAS Ventura 2040 LDA Aggregated 65 DSL Ventura 2040 LDT1 Aggregated 65 GAS Ventura 2040 LDT1 Aggregated 65 DSL Ventura 2040 LDT2 Aggregated 65 GAS Ventura 2040 LDT2 Aggregated 65 DSL Ventura 2040 LHDT1 Aggregated 65 GAS Ventura 2040 LHDT1 Aggregated 65 DSL Ventura 2040 LHDT2 Aggregated 65 GAS Ventura 2040 LHDT2 Aggregated 65 DSL Ventura 2040 MDV Aggregated 65 GAS Ventura 2040 MDV Aggregated 65 DSL Ventura 2040 MH Aggregated 65 GAS Ventura 2040 MH Aggregated 65 DSL Ventura 2040 MHDT Aggregated 65 GAS Ventura 2040 MHDT Aggregated 65 DSL Ventura 2040 OBUS Aggregated 65 GAS Ventura 2040 OBUS Aggregated 65 DSL Ventura 2040 UBUS Aggregated 65 GAS Ventura 2040 UBUS Aggregated 65 DSL LM Total Total LM Diesel Emissions E E-06 Total Diesel Emissions Total Emissions per Volume Source for 2.09E E-05 Modeling Scenario PLS3 Copywrite 2015 Kleinfelder Page 16 of 16 VEN US /22/2015
145 EMFAC2014 (v1.0.7) Emissions Inventory Region Type: County Original Segment LM VMT/day HD VMT/day Region: Imperial IMP I-8 just east of El Centro Eastbound 25,734 11,339 Calendar Year: 2040 IMP I-8 just east of El Centro Westbound 26,612 11,487 Season: Annual *IMP I-8 just east of El Centro Vehicle Classification: EMFAC2007 Categories Total Segment Length Eastbound 1.51 miles Units: miles/day for VMT, tons/day for Emissions, 1000 gallons/day for Fuel Consumption Total Segment Length Westbound 1.51 miles Emissions per Volume Source for 1-mile segment Model Eastbound Westbound Emission Factor Eastbound Westbound Eastbound Westbound Eastbound Westbound No. of Vol Sources No. of Vol Sources g/sec g/sec Region CalYr VehClass MdlYr Speed Fuel VMT Diesel VMT/day Diesel VMT/day PM10_RUNEX Imperial 2040 HHDT Aggregated 55 GAS Imperial 2040 HHDT Aggregated 55 DSL E E-06 HHDT Total Imperial 2040 LDA Aggregated 65 GAS Imperial 2040 LDA Aggregated 65 DSL Imperial 2040 LDT1 Aggregated 65 GAS Imperial 2040 LDT1 Aggregated 65 DSL Imperial 2040 LDT2 Aggregated 65 GAS Imperial 2040 LDT2 Aggregated 65 DSL Imperial 2040 LHDT1 Aggregated 65 GAS Imperial 2040 LHDT1 Aggregated 65 DSL Imperial 2040 LHDT2 Aggregated 65 GAS Imperial 2040 LHDT2 Aggregated 65 DSL Imperial 2040 MDV Aggregated 65 GAS Imperial 2040 MDV Aggregated 65 DSL Imperial 2040 MH Aggregated 65 GAS Imperial 2040 MH Aggregated 65 DSL Imperial 2040 MHDT Aggregated 65 GAS Imperial 2040 MHDT Aggregated 65 DSL Imperial 2040 OBUS Aggregated 65 GAS Imperial 2040 OBUS Aggregated 65 DSL Imperial 2040 SBUS Aggregated 55 GAS Imperial 2040 SBUS Aggregated 55 DSL Imperial 2040 UBUS Aggregated 65 GAS Imperial 2040 UBUS Aggregated 65 DSL LM Total Total LM Diesel Emissions E E-07 Total Diesel Emissions Total Emissions per Volume Source for 6.12E E-06 Modeling Scenario PLS3B Copyright 2015 Kleinfelder Page 1 of 16 Imperial County I8 El Centro 10/22/2015
146 EMFAC2014 (v1.0.7) Emissions Inventory Region Type: County Original Segment LM VMT/day HD VMT/day Region: Imperial IMP SR-78 Eastbound 13,731 2,287 Calendar Year: 2040 IMP SR-78 Westbound 8,225 2,427 Season: Annual *IMP SR-78: State Road 78 Freeway in Westmorland Vehicle Classification: EMFAC2007 Categories Total Segment Length Eastbound 0.88 miles Units: miles/day for VMT, tons/day for Emissions, 1000 gallons/day for Fuel Consumption Total Segment Length Westbound 0.88 miles Emissions per Volume Source for 1-mile segment Model Eastbound Westbound Emission Factor Eastbound Westbound Eastbound Westbound Eastbound Westbound No. of Vol Sources No. of Vol Sources g/sec g/sec Region CalYr VehClass MdlYr Speed Fuel VMT Diesel VMT/day Diesel VMT/day PM10_RUNEX Imperial 2040 HHDT Aggregated 55 GAS Imperial 2040 HHDT Aggregated 55 DSL E E-06 HHDT Total Imperial 2040 LDA Aggregated 65 GAS Imperial 2040 LDA Aggregated 65 DSL Imperial 2040 LDT1 Aggregated 65 GAS Imperial 2040 LDT1 Aggregated 65 DSL Imperial 2040 LDT2 Aggregated 65 GAS Imperial 2040 LDT2 Aggregated 65 DSL Imperial 2040 LHDT1 Aggregated 65 GAS Imperial 2040 LHDT1 Aggregated 65 DSL Imperial 2040 LHDT2 Aggregated 65 GAS Imperial 2040 LHDT2 Aggregated 65 DSL Imperial 2040 MDV Aggregated 65 GAS Imperial 2040 MDV Aggregated 65 DSL Imperial 2040 MH Aggregated 65 GAS Imperial 2040 MH Aggregated 65 DSL Imperial 2040 MHDT Aggregated 65 GAS Imperial 2040 MHDT Aggregated 65 DSL Imperial 2040 OBUS Aggregated 65 GAS Imperial 2040 OBUS Aggregated 65 DSL Imperial 2040 SBUS Aggregated 55 GAS Imperial 2040 SBUS Aggregated 55 DSL Imperial 2040 UBUS Aggregated 65 GAS Imperial 2040 UBUS Aggregated 65 DSL LM Total Total LM Diesel Emissions E E-07 Total Diesel Emissions Total Emissions per Volume Source for 2.12E E-06 Modeling Scenario PLS3B Copyright 2015 Kleinfelder Page 2 of 16 Imperial County SR78 10/22/2015
147 EMFAC2014 (v1.0.7) Emissions Inventory Additional Segment LM VMT/day HD VMT/day Region Type: County LA I-110 Northbound 139,279 23,686 Region: Los Angeles LA I-110 Southbound 137,658 21,046 Calendar Year: 2040 *LA I-110 in the LA County area, Carson Season: Annual Total Segment Length Northbound 1.98 miles Vehicle Classification: EMFAC2007 Categories Total Segment Length Southbound 1.92 miles Units: miles/day for VMT, tons/day for Emissions, 1000 gallons/day for Fuel Consumption Emissions per Volume Source for 1- mile segment Model Northbound Southbound Emission Factor Northbound Southbound Northbound Southbound Northbound Southbound No. of Vol Sources No. of Vol Sources g/sec g/sec Region CalYr VehClass MdlYr Speed Fuel VMT Diesel VMT/day Diesel VMT/day PM10_RUNEX Los Angeles 2040 HHDT Aggregated 55 GAS Los Angeles 2040 HHDT Aggregated 55 DSL E E-05 HHDT Total Los Angeles 2040 LDA Aggregated 65 GAS Los Angeles 2040 LDA Aggregated 65 DSL Los Angeles 2040 LDT1 Aggregated 65 GAS Los Angeles 2040 LDT1 Aggregated 65 DSL Los Angeles 2040 LDT2 Aggregated 65 GAS Los Angeles 2040 LDT2 Aggregated 65 DSL Los Angeles 2040 LHDT1 Aggregated 65 GAS Los Angeles 2040 LHDT1 Aggregated 65 DSL Los Angeles 2040 LHDT2 Aggregated 65 GAS Los Angeles 2040 LHDT2 Aggregated 65 DSL Los Angeles 2040 MDV Aggregated 65 GAS Los Angeles 2040 MDV Aggregated 65 DSL Los Angeles 2040 MH Aggregated 65 GAS Los Angeles 2040 MH Aggregated 65 DSL Los Angeles 2040 MHDT Aggregated 65 GAS Los Angeles 2040 MHDT Aggregated 65 DSL Los Angeles 2040 OBUS Aggregated 65 GAS Los Angeles 2040 OBUS Aggregated 65 DSL Los Angeles 2040 SBUS Aggregated 55 GAS Los Angeles 2040 SBUS Aggregated 55 DSL Los Angeles 2040 UBUS Aggregated 65 GAS Los Angeles 2040 UBUS Aggregated 65 DSL LM Total Total LM Diesel Emissions E E-06 Total Diesel Emissions Total Emissions per Volume Source 2.34E E-05 for Modeling Scenario PLS3B Copyright 2015 Kleinfelder Page 3 of 16 Los Angeles County I /22/2015
148 EMFAC2014 (v1.0.7) Emissions Inventory Original Segment LM VMT/day HD VMT/day Region Type: County LA I-710 in Compton Northbound 167,305 24,030 Region: Los Angeles LA I-710 in Compton Southbound 160,316 21,136 Calendar Year: 2040 *LA I-710 in Compton, north of the intersection with SR 91 Season: Annual Total Segment Length Northbound 1.34 miles Vehicle Classification: EMFAC2007 Categories Total Segment Length Southbound 1.34 miles Units: miles/day for VMT, tons/day for Emissions, 1000 gallons/day for Fuel Consumption Emissions per Volume Source for 1- mile segment Model Northbound Southbound Emission Factor Northbound Southbound Northbound Southbound Northbound Southbound No. of Vol Sources No. of Vol Sources g/sec g/sec Region CalYr VehClass MdlYr Speed Fuel VMT Diesel VMT/day Diesel VMT/day PM10_RUNEX Los Angele 2040 HHDT Aggregated 55 GAS Los Angele 2040 HHDT Aggregated 55 DSL E E-05 HHDT Total Los Angele 2040 LDA Aggregated 65 GAS Los Angele 2040 LDA Aggregated 65 DSL Los Angele 2040 LDT1 Aggregated 65 GAS Los Angele 2040 LDT1 Aggregated 65 DSL Los Angele 2040 LDT2 Aggregated 65 GAS Los Angele 2040 LDT2 Aggregated 65 DSL Los Angele 2040 LHDT1 Aggregated 65 GAS Los Angele 2040 LHDT1 Aggregated 65 DSL Los Angele 2040 LHDT2 Aggregated 65 GAS Los Angele 2040 LHDT2 Aggregated 65 DSL Los Angele 2040 MDV Aggregated 65 GAS Los Angele 2040 MDV Aggregated 65 DSL Los Angele 2040 MH Aggregated 65 GAS Los Angele 2040 MH Aggregated 65 DSL Los Angele 2040 MHDT Aggregated 65 GAS Los Angele 2040 MHDT Aggregated 65 DSL Los Angele 2040 OBUS Aggregated 65 GAS Los Angele 2040 OBUS Aggregated 65 DSL Los Angele 2040 SBUS Aggregated 55 GAS Los Angele 2040 SBUS Aggregated 55 DSL Los Angele 2040 UBUS Aggregated 65 GAS Los Angele 2040 UBUS Aggregated 65 DSL LM Total Total LM Diesel Emissions E E-05 Total Diesel Emissions Total Emissions per Volume Source 6.84E E-05 for Modeling Scenario PLS3B Copyright 2015 Kleinfelder Page 4 of 16 Los Angeles County I710 Compton 10/22/2015
149 EMFAC2014 (v1.0.7) Emissions Inventory Original Segment LM VMT/day HD VMT/day Region Type: County LA SR-60 DB Eastbound 320,534 39,881 Region: Los Angeles LA SR-60 DB Westbound 362,669 36,647 Calendar Year: 2040 *LA SR-60 near Diamond Bar Season: Annual Total Segment Length Eastbound 3.14 miles Vehicle Classification: EMFAC2007 Categories Total Segment Length Westbound 3.12 miles Units: miles/day for VMT, tons/day for Emissions, 1000 gallons/day for Fuel Consumption Emissions per Volume Source for 1- mile segment Model Eastbound Westbound Emission Factor Eastbound Westbound Eastbound Westbound Eastbound Westbound No. of Vol Sources No. of Vol Sources g/sec g/sec Region CalYr VehClass MdlYr Speed Fuel VMT Diesel VMT/day Diesel VMT/day PM10_RUNEX Los Angeles 2040 HHDT Aggregated 55 GAS Los Angeles 2040 HHDT Aggregated 55 DSL E E-05 HHDT Total Los Angeles 2040 LDA Aggregated 65 GAS Los Angeles 2040 LDA Aggregated 65 DSL Los Angeles 2040 LDT1 Aggregated 65 GAS Los Angeles 2040 LDT1 Aggregated 65 DSL Los Angeles 2040 LDT2 Aggregated 65 GAS Los Angeles 2040 LDT2 Aggregated 65 DSL Los Angeles 2040 LHDT1 Aggregated 65 GAS Los Angeles 2040 LHDT1 Aggregated 65 DSL Los Angeles 2040 LHDT2 Aggregated 65 GAS Los Angeles 2040 LHDT2 Aggregated 65 DSL Los Angeles 2040 MDV Aggregated 65 GAS Los Angeles 2040 MDV Aggregated 65 DSL Los Angeles 2040 MH Aggregated 65 GAS Los Angeles 2040 MH Aggregated 65 DSL Los Angeles 2040 MHDT Aggregated 65 GAS Los Angeles 2040 MHDT Aggregated 65 DSL Los Angeles 2040 OBUS Aggregated 65 GAS Los Angeles 2040 OBUS Aggregated 65 DSL Los Angeles 2040 SBUS Aggregated 55 GAS Los Angeles 2040 SBUS Aggregated 55 DSL Los Angeles 2040 UBUS Aggregated 65 GAS Los Angeles 2040 UBUS Aggregated 65 DSL LM Total Total LM Diesel Emissions E E-05 Total Diesel Emissions Total Emissions per Volume Source 2.78E E-05 for Modeling Scenario PLS3B Copyright 2015 Kleinfelder Page 5 of 16 Los Angeles County SR60 DB 10/22/2015
150 EMFAC2014 (v1.0.7) Emissions Inventory Additional Segment LM VMT/day HD VMT/day Region Type: County LA SR-60 SEM, El Monte Eastbound 181,977 14,103 Region: Los Angeles LA SR-60 SEM, El Monte Westbound 197,128 15,975 Calendar Year: 2040 *LA SR-60 in the El Monte / Peck Rd area Season: Annual Total Segment Length Eastbound 1.52 miles Vehicle Classification: EMFAC2007 Categories Total Segment Length Westbound 1.50 miles Units: miles/day for VMT, tons/day for Emissions, 1000 gallons/day for Fuel Consumption Emissions per Volume Source for 1- mile segment Model Northbound Southbound Emission Factor Northbound Southbound Northbound Southbound Northbound Southbound No. of Vol Sources No. of Vol Sources g/sec g/sec Region CalYr VehClass MdlYr Speed Fuel VMT Diesel VMT/day Diesel VMT/day PM10_RUNEX Los Angeles 2040 HHDT Aggregated 55 GAS Los Angeles 2040 HHDT Aggregated 55 DSL E E-05 HHDT Total Los Angeles 2040 LDA Aggregated 65 GAS Los Angeles 2040 LDA Aggregated 65 DSL Los Angeles 2040 LDT1 Aggregated 65 GAS Los Angeles 2040 LDT1 Aggregated 65 DSL Los Angeles 2040 LDT2 Aggregated 65 GAS Los Angeles 2040 LDT2 Aggregated 65 DSL Los Angeles 2040 LHDT1 Aggregated 65 GAS Los Angeles 2040 LHDT1 Aggregated 65 DSL Los Angeles 2040 LHDT2 Aggregated 65 GAS Los Angeles 2040 LHDT2 Aggregated 65 DSL Los Angeles 2040 MDV Aggregated 65 GAS Los Angeles 2040 MDV Aggregated 65 DSL Los Angeles 2040 MH Aggregated 65 GAS Los Angeles 2040 MH Aggregated 65 DSL Los Angeles 2040 MHDT Aggregated 65 GAS Los Angeles 2040 MHDT Aggregated 65 DSL Los Angeles 2040 OBUS Aggregated 65 GAS Los Angeles 2040 OBUS Aggregated 65 DSL Los Angeles 2040 SBUS Aggregated 55 GAS Los Angeles 2040 SBUS Aggregated 55 DSL Los Angeles 2040 UBUS Aggregated 65 GAS Los Angeles 2040 UBUS Aggregated 65 DSL LM Total Total LM Diesel Emissions E E-05 Total Diesel Emissions Total Emissions per Volume Source 3.06E E-05 for Modeling Scenario PLS3B Copyright 2015 Kleinfelder Page 6 of 16 Los Angeles County SR60 10/22/2015
151 EMFAC2014 (v1.0.7) Emissions Inventory Original Segment LM VMT/day HD VMT/day Region Type: County ORA I-5 Northbound 195,497 19,319 Region: Orange ORA I-5 Southbound 119,133 12,062 Calendar Year: 2040 *ORA I-5 in Orange County, near intersection of SR 57 and SR 22 Season: Annual Total Segment Length Northboun 1.32 miles Vehicle Classification: EMFAC2007 Categories Total Segment Length Eastbound 0.81 miles Units: miles/day for VMT, tons/day for Emissions, 1000 gallons/day for Fuel Consumption Emissions per Volume Source for 1-mile segment Model Northbound Southbound Emission Factor Northbound Southbound Northbound Southbound Northbound Southbound No. of Vol Sources No. of Vol Sources g/sec g/sec Region CalYr VehClass MdlYr Speed Fuel VMT Diesel VMT/day Diesel VMT/day PM10_RUNEX Orange 2040 HHDT Aggregated 55 GAS Orange 2040 HHDT Aggregated 55 DSL E E-05 HHDT Total Orange 2040 LDA Aggregated 65 GAS Orange 2040 LDA Aggregated 65 DSL Orange 2040 LDT1 Aggregated 65 GAS Orange 2040 LDT1 Aggregated 65 DSL Orange 2040 LDT2 Aggregated 65 GAS Orange 2040 LDT2 Aggregated 65 DSL Orange 2040 LHDT1 Aggregated 65 GAS Orange 2040 LHDT1 Aggregated 65 DSL Orange 2040 LHDT2 Aggregated 65 GAS Orange 2040 LHDT2 Aggregated 65 DSL Orange 2040 MDV Aggregated 65 GAS Orange 2040 MDV Aggregated 65 DSL Orange 2040 MH Aggregated 65 GAS Orange 2040 MH Aggregated 65 DSL Orange 2040 MHDT Aggregated 65 GAS Orange 2040 MHDT Aggregated 65 DSL Orange 2040 OBUS Aggregated 65 GAS Orange 2040 OBUS Aggregated 65 DSL Orange 2040 SBUS Aggregated 55 GAS Orange 2040 SBUS Aggregated 55 DSL Orange 2040 UBUS Aggregated 65 GAS Orange 2040 UBUS Aggregated 65 DSL LM Total Total LM Diesel Emissions E E-05 Total Diesel Emissions Total Emissions per Volume 4.47E E-05 Source for Modeling Scenario PLS3B Copyright 2015 Kleinfelder Page 7 of 16 Orange County I5 10/22/2015
152 EMFAC2014 (v1.0.7) Emissions Inventory Original Segment LM VMT/day HD VMT/day Region Type: County ORA I-405 Seal Beach, Corona Northbound 217,036 33,923 Region: Orange ORA I-405 Seal Beach, Corona Southbound 199,867 31,326 Calendar Year: 2040 *I-405 in Seal Beach, east of the I-605 interchange Season: Annual Total Segment Length Northboun 1.09 miles Vehicle Classification: EMFAC2007 Categories Total Segment Length Southboun 1.02 miles Units: miles/day for VMT, tons/day for Emissions, 1000 gallons/day for Fuel Consumption Emissions per Volume Source for 1-mile segment Model Northbound Southbound Emission Factor Northbound Southbound Northbound Southbound Northbound Southbound No. of Vol Sources No. of Vol Sources g/sec g/sec Region CalYr VehClass MdlYr Speed Fuel VMT Diesel VMT/day Diesel VMT/day PM10_RUNEX Orange 2040 HHDT Aggregated 55 GAS Orange 2040 HHDT Aggregated 55 DSL E E-05 HHDT Total Orange 2040 LDA Aggregated 65 GAS Orange 2040 LDA Aggregated 65 DSL Orange 2040 LDT1 Aggregated 65 GAS Orange 2040 LDT1 Aggregated 65 DSL Orange 2040 LDT2 Aggregated 65 GAS Orange 2040 LDT2 Aggregated 65 DSL Orange 2040 LHDT1 Aggregated 65 GAS Orange 2040 LHDT1 Aggregated 65 DSL Orange 2040 LHDT2 Aggregated 65 GAS Orange 2040 LHDT2 Aggregated 65 DSL Orange 2040 MDV Aggregated 65 GAS Orange 2040 MDV Aggregated 65 DSL Orange 2040 MH Aggregated 65 GAS Orange 2040 MH Aggregated 65 DSL Orange 2040 MHDT Aggregated 65 GAS Orange 2040 MHDT Aggregated 65 DSL Orange 2040 OBUS Aggregated 65 GAS Orange 2040 OBUS Aggregated 65 DSL Orange 2040 SBUS Aggregated 55 GAS Orange 2040 SBUS Aggregated 55 DSL Orange 2040 UBUS Aggregated 65 GAS Orange 2040 UBUS Aggregated 65 DSL LM Total Total LM Diesel Emissions E E-05 Total Diesel Emissions Total Emissions per Volume 7.69E E-05 Source for Modeling Scenario PLS3B Copyright 2015 Kleinfelder Page 8 of 16 Orange County I405 Seal Beach 10/22/2015
153 EMFAC2014 (v1.0.7) Emissions Inventory Additional Segment LM VMT/day HD VMT/day Region Type: County RIV I-10 in the Banning area Eastbound 307, ,302 Region: Riverside RIV I-10 in the Banning area Westbound 362, ,692 Calendar Year: 2040 *RIV I-10 in the Banning area Season: Annual Total Segment Length Eastbound 5.01 miles Vehicle Classification: EMFAC2007 Categories Total Segment Length Westbound 4.98 miles Units: miles/day for VMT, tons/day for Emissions, 1000 gallons/day for Fuel Consumption Emissions per Volume Source for 1- mile segment Model Eastbound Westbound Emission Factor Eastbound Westbound Eastbound Westbound Eastbound Westbound No. of Vol Sources No. of Vol Sources g/sec g/sec Region CalYr VehClass MdlYr Speed Fuel VMT Diesel VMT/day Diesel VMT/day PM10_RUNEX Riverside 2040 HHDT Aggregated 55 GAS Riverside 2040 HHDT Aggregated 55 DSL E E-05 HHDT Total Riverside 2040 LDA Aggregated 65 GAS Riverside 2040 LDA Aggregated 65 DSL Riverside 2040 LDT1 Aggregated 65 GAS Riverside 2040 LDT1 Aggregated 65 DSL Riverside 2040 LDT2 Aggregated 65 GAS Riverside 2040 LDT2 Aggregated 65 DSL Riverside 2040 LHDT1 Aggregated 65 GAS Riverside 2040 LHDT1 Aggregated 65 DSL Riverside 2040 LHDT2 Aggregated 65 GAS Riverside 2040 LHDT2 Aggregated 65 DSL Riverside 2040 MDV Aggregated 65 GAS Riverside 2040 MDV Aggregated 65 DSL Riverside 2040 MH Aggregated 65 GAS Riverside 2040 MH Aggregated 65 DSL Riverside 2040 MHDT Aggregated 65 GAS Riverside 2040 MHDT Aggregated 65 DSL Riverside 2040 OBUS Aggregated 65 GAS Riverside 2040 OBUS Aggregated 65 DSL Riverside 2040 SBUS Aggregated 55 GAS Riverside 2040 SBUS Aggregated 55 DSL Riverside 2040 UBUS Aggregated 65 GAS Riverside 2040 UBUS Aggregated 65 DSL LM Total Total LM Diesel Emissions E E-06 Total Diesel Emissions Total Emissions per Volume Source 3.65E E-05 for Modeling Scenario PLS3B Copyright 2015 Kleinfelder Page 9 of 16 Riverside County I10 Palm Des 10/22/2015
154 EMFAC2014 (v1.0.7) Emissions Inventory Additional Segment LM VMT/day HD VMT/day Region Type: County RIV 1-15, Riverside Northbound 467,016 75,897 Region: Riverside RIV 1-15, Riverside Southbound 553,334 90,970 Calendar Year: 2040 *RIV 1-15, Riverside County, near Temecula Season: Annual Total Segment Length Northbound 4.81 miles Vehicle Classification: EMFAC2007 Categories Total Segment Length Southbound 5.83 miles Units: miles/day for VMT, tons/day for Emissions, 1000 gallons/day for Fuel Consumption Emissions per Volume Source for 1- mile segment Model Northbound Southbound Emission Factor Northbound Southbound Northbound Southbound Northbound Southbound No. of Vol Sources No. of Vol Sources g/sec g/sec Region CalYr VehClass MdlYr Speed Fuel VMT Diesel VMT/day Diesel VMT/day PM10_RUNEX Riverside 2040 HHDT Aggregated 55 GAS Riverside 2040 HHDT Aggregated 55 DSL E E-05 HHDT Total Riverside 2040 LDA Aggregated 65 GAS Riverside 2040 LDA Aggregated 65 DSL Riverside 2040 LDT1 Aggregated 65 GAS Riverside 2040 LDT1 Aggregated 65 DSL Riverside 2040 LDT2 Aggregated 65 GAS Riverside 2040 LDT2 Aggregated 65 DSL Riverside 2040 LHDT1 Aggregated 65 GAS Riverside 2040 LHDT1 Aggregated 65 DSL Riverside 2040 LHDT2 Aggregated 65 GAS Riverside 2040 LHDT2 Aggregated 65 DSL Riverside 2040 MDV Aggregated 65 GAS Riverside 2040 MDV Aggregated 65 DSL Riverside 2040 MH Aggregated 65 GAS Riverside 2040 MH Aggregated 65 DSL Riverside 2040 MHDT Aggregated 65 GAS Riverside 2040 MHDT Aggregated 65 DSL Riverside 2040 OBUS Aggregated 65 GAS Riverside 2040 OBUS Aggregated 65 DSL Riverside 2040 SBUS Aggregated 55 GAS Riverside 2040 SBUS Aggregated 55 DSL Riverside 2040 UBUS Aggregated 65 GAS Riverside 2040 UBUS Aggregated 65 DSL LM Total Total LM Diesel Emissions E E-06 Total Diesel Emissions Total Emissions per Volume Source 2.47E E-05 for Modeling Scenario PLS3B Copyright 2015 Kleinfelder Page 10 of 16 Riverside County I15 Temecula 10/22/2015
155 EMFAC2014 (v1.0.7) Emissions Inventory Original Segment LM VMT/day HD VMT/day Region Type: County RIV SR-91 in Corona Eastbound 276,171 43,193 Region: Riverside RIV SR-91 in Corona Westbound 259,551 45,549 Calendar Year: 2040 *SR 91 in Corona, east of the intersection with SR 71 Season: Annual Total Segment Length Eastbound 2.01 miles Vehicle Classification: EMFAC2007 Categories Total Segment Length Westbound 1.76 miles Units: miles/day for VMT, tons/day for Emissions, 1000 gallons/day for Fuel Consumption Emissions per Volume Source for 1- mile segment Model Eastbound Westbound Emission Factor Eastbound Westbound Eastbound Westbound Eastbound Westbound No. of Vol Sources No. of Vol Sources g/sec g/sec Region CalYr VehClass MdlYr Speed Fuel VMT Diesel VMT/day Diesel VMT/day PM10_RUNEX Riverside 2040 HHDT Aggregated 55 GAS Riverside 2040 HHDT Aggregated 55 DSL E E-05 HHDT Total Riverside 2040 LDA Aggregated 65 GAS Riverside 2040 LDA Aggregated 65 DSL Riverside 2040 LDT1 Aggregated 65 GAS Riverside 2040 LDT1 Aggregated 65 DSL Riverside 2040 LDT2 Aggregated 65 GAS Riverside 2040 LDT2 Aggregated 65 DSL Riverside 2040 LHDT1 Aggregated 65 GAS Riverside 2040 LHDT1 Aggregated 65 DSL Riverside 2040 LHDT2 Aggregated 65 GAS Riverside 2040 LHDT2 Aggregated 65 DSL Riverside 2040 MDV Aggregated 65 GAS Riverside 2040 MDV Aggregated 65 DSL Riverside 2040 MH Aggregated 65 GAS Riverside 2040 MH Aggregated 65 DSL Riverside 2040 MHDT Aggregated 65 GAS Riverside 2040 MHDT Aggregated 65 DSL Riverside 2040 OBUS Aggregated 65 GAS Riverside 2040 OBUS Aggregated 65 DSL Riverside 2040 SBUS Aggregated 55 GAS Riverside 2040 SBUS Aggregated 55 DSL Riverside 2040 UBUS Aggregated 65 GAS Riverside 2040 UBUS Aggregated 65 DSL LM Total Total LM Diesel Emissions E E-05 Total Diesel Emissions Total Emissions per Volume Source 4.38E E-05 for Modeling Scenario PLS3B Copyright 2015 Kleinfelder Page 11 of 16 Riverside County SR91 Corona 10/22/2015
156 EMFAC2014 (v1.0.7) Emissions Inventory Original Segment LM VMT/day HD VMT/day Region Type: County SB I-15 in Ontario Northbound 237,047 55,236 Region: San Bernardino SB I-15 in Ontario Southbound 219,210 57,152 Calendar Year: 2040 *SB I-15 in Ontario Season: Annual Total Segment Length Northbound 2.95 miles Vehicle Classification: EMFAC2007 Categories Total Segment Length Southbound 2.97 miles Units: miles/day for VMT, tons/day for Emissions, 1000 gallons/day for Fuel Consumption Emissions per Volume Source for 1- mile segment Model Northbound Southbound Emission Factor Northbound Southbound Northbound Southbound Northbound Southbound No. of Vol Sources No. of Vol Sources g/sec g/sec Region CalYr VehClass MdlYr Speed Fuel VMT Diesel VMT/day Diesel VMT/day PM10_RUNEX San Bernar 2040 HHDT Aggregated 55 GAS San Bernar 2040 HHDT Aggregated 55 DSL E E-05 HHDT Total San Bernar 2040 LDA Aggregated 65 GAS San Bernar 2040 LDA Aggregated 65 DSL San Bernar 2040 LDT1 Aggregated 65 GAS San Bernar 2040 LDT1 Aggregated 65 DSL San Bernar 2040 LDT2 Aggregated 65 GAS San Bernar 2040 LDT2 Aggregated 65 DSL San Bernar 2040 LHDT1 Aggregated 65 GAS San Bernar 2040 LHDT1 Aggregated 65 DSL San Bernar 2040 LHDT2 Aggregated 65 GAS San Bernar 2040 LHDT2 Aggregated 65 DSL San Bernar 2040 MDV Aggregated 65 GAS San Bernar 2040 MDV Aggregated 65 DSL San Bernar 2040 MH Aggregated 65 GAS San Bernar 2040 MH Aggregated 65 DSL San Bernar 2040 MHDT Aggregated 65 GAS San Bernar 2040 MHDT Aggregated 65 DSL San Bernar 2040 OBUS Aggregated 65 GAS San Bernar 2040 OBUS Aggregated 65 DSL San Bernar 2040 SBUS Aggregated 55 GAS San Bernar 2040 SBUS Aggregated 55 DSL San Bernar 2040 UBUS Aggregated 65 GAS San Bernar 2040 UBUS Aggregated 65 DSL LM Total Total LM Diesel Emissions E E-06 Total Diesel Emissions Total Emissions per Volume Source 3.06E E-05 for Modeling Scenario PLS3B Copyright 2015 Kleinfelder Page 12 of 16 SanBern County I15 Ontario 10/22/2015
157 EMFAC2014 (v1.0.7) Emissions Inventory Additional Segment LM VMT/day HD VMT/day Region Type: County SB I-15 in the Victorville area Northbound 186,288 83,910 Region: San Bernardino SB I-15 in the Victorville area Southbound 171,351 86,521 Calendar Year: 2040 *I-15 in the Victorville area Season: Annual Total Segment Length Northbound 4.32 miles Vehicle Classification: EMFAC2007 Categories Total Segment Length Southbound 4.39 miles Units: miles/day for VMT, tons/day for Emissions, 1000 gallons/day for Fuel Consumption Emissions per Volume Source for 1- mile segment Model Northbound Southbound Emission Factor Northbound Southbound Northbound Southbound Northbound Southbound No. of Vol Sources No. of Vol Sources g/sec g/sec Region CalYr VehClass MdlYr Speed Fuel VMT Diesel VMT/day Diesel VMT/day PM10_RUNEX San Bernar 2040 HHDT Aggregated 55 GAS San Bernar 2040 HHDT Aggregated 55 DSL E E-05 HHDT Total San Bernar 2040 LDA Aggregated 65 GAS San Bernar 2040 LDA Aggregated 65 DSL San Bernar 2040 LDT1 Aggregated 65 GAS San Bernar 2040 LDT1 Aggregated 65 DSL San Bernar 2040 LDT2 Aggregated 65 GAS San Bernar 2040 LDT2 Aggregated 65 DSL San Bernar 2040 LHDT1 Aggregated 65 GAS San Bernar 2040 LHDT1 Aggregated 65 DSL San Bernar 2040 LHDT2 Aggregated 65 GAS San Bernar 2040 LHDT2 Aggregated 65 DSL San Bernar 2040 MDV Aggregated 65 GAS San Bernar 2040 MDV Aggregated 65 DSL San Bernar 2040 MH Aggregated 65 GAS San Bernar 2040 MH Aggregated 65 DSL San Bernar 2040 MHDT Aggregated 65 GAS San Bernar 2040 MHDT Aggregated 65 DSL San Bernar 2040 OBUS Aggregated 65 GAS San Bernar 2040 OBUS Aggregated 65 DSL San Bernar 2040 SBUS Aggregated 55 GAS San Bernar 2040 SBUS Aggregated 55 DSL San Bernar 2040 UBUS Aggregated 65 GAS San Bernar 2040 UBUS Aggregated 65 DSL LM Total Total LM Diesel Emissions E E-06 Total Diesel Emissions Total Emissions per Volume Source 1.92E E-05 for Modeling Scenario PLS3B Copyright 2015 Kleinfelder Page 13 of 16 SanBern County I15 Victorville 10/22/2015
158 EMFAC2014 (v1.0.7) Emissions Inventory Original Segment LM VMT/day HD VMT/day Region Type: County SB SR-60 in Ontario Eastbound 291,240 38,446 Region: Riverside SB SR-60 in Ontario Westbound 231,384 31,159 Calendar Year: 2040 *SR 60 in Ontario, west of the I-15 interchange Season: Annual Total Segment Length Eastbound 2.35 miles Vehicle Classification: EMFAC2007 Categories Total Segment Length Westbound 2.22 miles Units: miles/day for VMT, tons/day for Emissions, 1000 gallons/day for Fuel Consumption Emissions per Volume Source for 1- mile segment Model Eastbound Westbound Emission Factor Eastbound Westbound Eastbound Westbound Eastbound Westbound No. of Vol Sources No. of Vol Sources g/sec g/sec Region CalYr VehClass MdlYr Speed Fuel VMT Diesel VMT/day Diesel VMT/day PM10_RUNEX Riverside 2040 HHDT Aggregated 55 GAS Riverside 2040 HHDT Aggregated 55 DSL E E-05 HHDT Total Riverside 2040 LDA Aggregated 65 GAS Riverside 2040 LDA Aggregated 65 DSL Riverside 2040 LDT1 Aggregated 65 GAS Riverside 2040 LDT1 Aggregated 65 DSL Riverside 2040 LDT2 Aggregated 65 GAS Riverside 2040 LDT2 Aggregated 65 DSL Riverside 2040 LHDT1 Aggregated 65 GAS Riverside 2040 LHDT1 Aggregated 65 DSL Riverside 2040 LHDT2 Aggregated 65 GAS Riverside 2040 LHDT2 Aggregated 65 DSL Riverside 2040 MDV Aggregated 65 GAS Riverside 2040 MDV Aggregated 65 DSL Riverside 2040 MH Aggregated 65 GAS Riverside 2040 MH Aggregated 65 DSL Riverside 2040 MHDT Aggregated 65 GAS Riverside 2040 MHDT Aggregated 65 DSL Riverside 2040 OBUS Aggregated 65 GAS Riverside 2040 OBUS Aggregated 65 DSL Riverside 2040 SBUS Aggregated 55 GAS Riverside 2040 SBUS Aggregated 55 DSL Riverside 2040 UBUS Aggregated 65 GAS Riverside 2040 UBUS Aggregated 65 DSL LM Total Total LM Diesel Emissions E E-06 Total Diesel Emissions Total Emissions per Volume Source 3.27E E-05 for Modeling Scenario PLS3B Copyright 2015 Kleinfelder Page 14 of 16 San Bern County SR60 Ontario 10/22/2015
159 EMFAC2014 (v1.0.7) Emissions Inventory Original Segment LM VMT/day HD VMT/day Region Type: County VEN US-101 SB Ventura Freeway Northbound 163,132 28,992 Region: Ventura VEN US-101 SB Ventura Freeway Southbound 163,677 30,100 Calendar Year: 2040 *US-101 Freeway in San Buenaventura near the Ventura Harbor Season: Annual Total segment length Vehicle Classification: EMFAC2007 Categories Total Segment Length Northbound 3.21 miles Units: miles/day for VMT, tons/day for Emissions, 1000 gallons/day for Fuel Consumption Total Segment Length Southbound 3.26 miles Emissions per Volume Source for 1- mile segment Model Northbound Southbound Emission Factor Northbound Southbound Northbound Southbound Northbound Southbound No. of Vol Sources No. of Vol Sources g/sec g/sec Region CalYr VehClass MdlYr Speed Fuel VMT Diesel VMT/day Diesel VMT/day PM10_RUNEX Ventura 2040 HHDT Aggregated 55 GAS Ventura 2040 HHDT Aggregated 55 DSL E E-06 HHDT Total Ventura 2040 LDA Aggregated 65 GAS Ventura 2040 LDA Aggregated 65 DSL Ventura 2040 LDT1 Aggregated 65 GAS Ventura 2040 LDT1 Aggregated 65 DSL Ventura 2040 LDT2 Aggregated 65 GAS Ventura 2040 LDT2 Aggregated 65 DSL Ventura 2040 LHDT1 Aggregated 65 GAS Ventura 2040 LHDT1 Aggregated 65 DSL Ventura 2040 LHDT2 Aggregated 65 GAS Ventura 2040 LHDT2 Aggregated 65 DSL Ventura 2040 MDV Aggregated 65 GAS Ventura 2040 MDV Aggregated 65 DSL Ventura 2040 MH Aggregated 65 GAS Ventura 2040 MH Aggregated 65 DSL Ventura 2040 MHDT Aggregated 65 GAS Ventura 2040 MHDT Aggregated 65 DSL Ventura 2040 OBUS Aggregated 65 GAS Ventura 2040 OBUS Aggregated 65 DSL Ventura 2040 SBUS Aggregated 55 GAS Ventura 2040 SBUS Aggregated 55 DSL Ventura 2040 UBUS Aggregated 65 GAS Ventura 2040 UBUS Aggregated 65 DSL LM Total Total LM Diesel Emissions E E-06 Total Diesel Emissions Total Emissions per Volume Source 8.10E E-06 for Modeling Scenario PLS3B Copyright 2015 Kleinfelder Page 15 of 16 Ventura County US101 Vent Fwy 10/22/2015
160 EMFAC2014 (v1.0.7) Emissions Inventory Original Segment LM VMT/day HD VMT/day Region Type: County VEN US-101 in Thousand Oaks Northbound 66,525 10,447 Region: Ventura VEN US-101 in Thousand Oaks Southbound 79,292 12,626 Calendar Year: 2040 *US 101 in Thousand Oaks, east of SR 23 Season: Annual Total segment length Vehicle Classification: EMFAC2007 Categories Total Segment Length Northbound 0.79 miles Units: miles/day for VMT, tons/day for Emissions, 1000 gallons/day for Fuel Consumption Total Segment Length Southbound 0.94 miles Emissions per Volume Source for 1- Northbound Southbound Emission Factor Northbound Southbound Northbound Southbound Northbound Southbound No. of Vol Sources No. of Vol Sources g/sec g/sec Region CalYr VehClass MdlYr Speed Fuel VMT Diesel VMT/day Diesel VMT/day PM10_RUNEX Ventura 2040 HHDT Aggregated 55 GAS Ventura 2040 HHDT Aggregated 55 DSL E E-05 HHDT Total Ventura 2040 LDA Aggregated 65 GAS Ventura 2040 LDA Aggregated 65 DSL Ventura 2040 LDT1 Aggregated 65 GAS Ventura 2040 LDT1 Aggregated 65 DSL Ventura 2040 LDT2 Aggregated 65 GAS Ventura 2040 LDT2 Aggregated 65 DSL Ventura 2040 LHDT1 Aggregated 65 GAS Ventura 2040 LHDT1 Aggregated 65 DSL Ventura 2040 LHDT2 Aggregated 65 GAS Ventura 2040 LHDT2 Aggregated 65 DSL Ventura 2040 MDV Aggregated 65 GAS Ventura 2040 MDV Aggregated 65 DSL Ventura 2040 MH Aggregated 65 GAS Ventura 2040 MH Aggregated 65 DSL Ventura 2040 MHDT Aggregated 65 GAS Ventura 2040 MHDT Aggregated 65 DSL Ventura 2040 OBUS Aggregated 65 GAS Ventura 2040 OBUS Aggregated 65 DSL Ventura 2040 SBUS Aggregated 55 GAS Ventura 2040 SBUS Aggregated 55 DSL Ventura 2040 UBUS Aggregated 65 GAS Ventura 2040 UBUS Aggregated 65 DSL LM Total Total LM Diesel Emissions E E-06 Total Diesel Emissions Total Emissions per Volume Source 1.98E E-05 for Modeling Scenario PLS3B Copyright 2015 Kleinfelder Page 16 of 16 Ventura County US101 Thous Oaks 10/22/2015
161 APPENDIX C Location of Modeled Receptors for Each Transportation Segment


162 " "


163 " "


164 " "


165 " "


166


167 " "


168
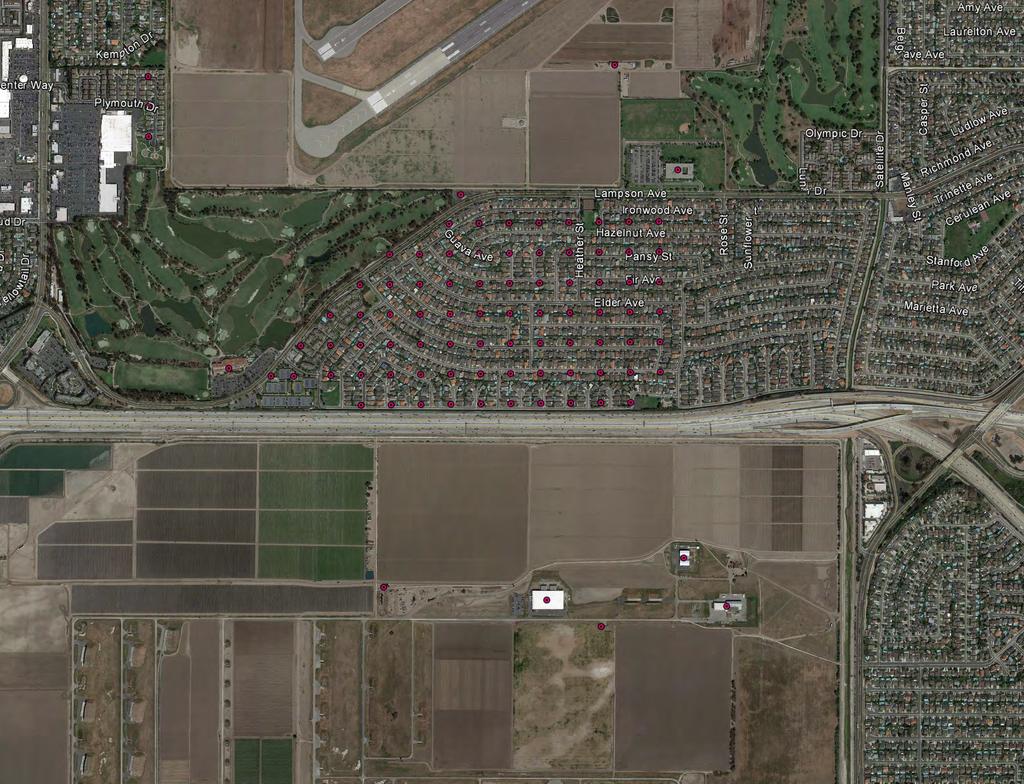

169
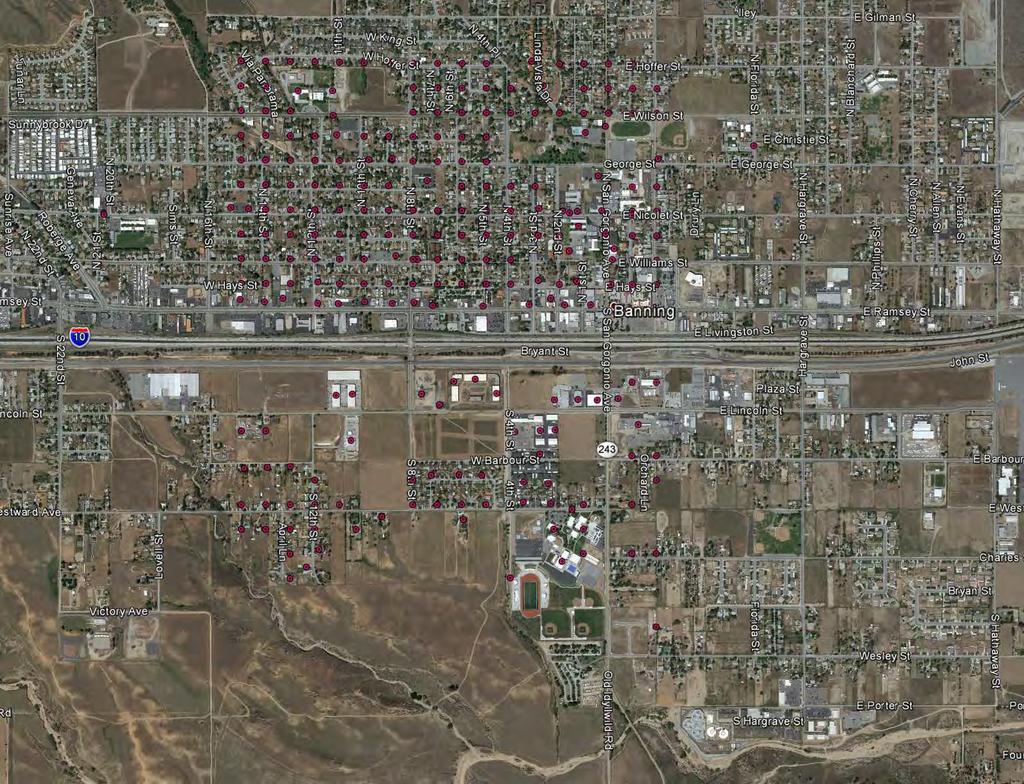

170


171 " "


172 " "


173 " "


174 " "


175 " "


176 " "

177 " "
Executive Summary. Draft Environmental Impact Statement/Environmental Impact Report ES-1
 Executive Summary Introduction The Eastside Transit Corridor Phase 2 Project is a vital public transit infrastructure investment that would provide a transit connection to the existing Metro Gold Line
Comprehensive Regional Goods Movement Plan and Implementation Strategy Goods Movement in the 2012 RTP/SCS
 Comprehensive Regional Goods Movement Plan and Implementation Strategy Goods Movement in the 2012 RTP/SCS Annie Nam Southern California Association of Governments September 24, 2012 The Goods Movement
2012 Air Emissions Inventory
 SECTION 6 HEAVY-DUTY VEHICLES This section presents emissions estimates for the heavy-duty vehicles (HDV) source category, including source description (6.1), geographical delineation (6.2), data and information
Alpine Highway to North County Boulevard Connector Study
 Alpine Highway to North County Boulevard Connector Study prepared by Avenue Consultants March 16, 2017 North County Boulevard Connector Study March 16, 2017 Table of Contents 1 Summary of Findings... 1
City of Pacific Grove
 Regional Study Utilizing Caltrans Intersection Evaluation Section 7: City of Pacific Grove s: FIRST STREET AT CENTRAL AVENUE Transportation Agency for Monterey County Prepared by Transportation Agency
3.17 Energy Resources
 3.17 Energy Resources 3.17.1 Introduction This section characterizes energy resources, usage associated with the proposed Expo Phase 2 project, and the net energy demand associated with changes to the
The major roadways in the study area are State Route 166 and State Route 33, which are shown on Figure 1-1 and described below:
 3.5 TRAFFIC AND CIRCULATION 3.5.1 Existing Conditions 3.5.1.1 Street Network DRAFT ENVIRONMENTAL IMPACT REPORT The major roadways in the study area are State Route 166 and State Route 33, which are shown
Transportation Electrification: Reducing Emissions, Driving Innovation. August 2017
 Transportation Electrification: Reducing Emissions, Driving Innovation August 2017 CA raising the bar in environmental policy and action Senate Bill 350 (DeLeon, 2015) established broad and ambitious clean
RAILYARDS SUPPORT A VARIETY OF OPERATIONS INCLUDING: LOCOMOTIVES, ON-ROAD AND OFF-ROAD TRUCKS, CARGO-HANDLING EQUIPMENT, TRANSPORTATION
 RAILYARDS SUPPORT A VARIETY OF OPERATIONS INCLUDING: LOCOMOTIVES, ON-ROAD AND OFF-ROAD TRUCKS, CARGO-HANDLING EQUIPMENT, TRANSPORTATION REFRIGERATION UNITS AND MAINTENANCE SHOPS. CHAPTER FIVE railyards
La Canada Flintridge Parents for Healthy Air November 1, 2018 Presented by Elizabeth Krider, Ph.D., Esther Kornfeld and Tamar Tujian
 Concerns regarding the Devil s Gate Sediment Removal Project 1. New science demands new assessment of health risks to 3,000 sensitive receptors nearby. a. Air pollution is the new tobacco health crisis,
Presentation to the Senate Committee on Transportation. April 7, Carson City, NV
 Presentation to the Senate Committee on Transportation April 7, 2015 Carson City, NV A Robust Market with a True Need On average, 38 million people visited Las Vegas annually between 2005 and 2013. Over
APPENDIX B Traffic Analysis
 APPENDIX B Traffic Analysis Rim of the World Unified School District Reconfiguration Prepared for: Rim of the World School District 27315 North Bay Road, Blue Jay, CA 92317 Prepared by: 400 Oceangate,
On-Road Emissions Reductions and the Regional Comprehensive Goods Movement Plan Background and Policy Questions
 On-Road Emissions Reductions and the Regional Comprehensive Goods Movement Plan Background and Policy Questions Presented to SCAG Regional Goods Movement Study Steering Committee Tom Kear Cambridge Systematics
PRESENTATION Metro s Streets & Freeways Subcommittee
 PRESENTATION Metro s Streets & Freeways Subcommittee Los Angeles County Metro s 2011 Interstate 210 Truck Origin & Destination (O D) Study Presented by: Fred Minagar MINAGAR & ASSOCIATES, INC. October
Missouri Seat Belt Usage Survey for 2017
 Missouri Seat Belt Usage Survey for 2017 Conducted for the Highway Safety & Traffic Division of the Missouri Department of Transportation by The Missouri Safety Center University of Central Missouri Final
4 COSTS AND OPERATIONS
 4 COSTS AND OPERATIONS 4.1 INTRODUCTION This chapter summarizes the estimated capital and operations and maintenance (O&M) costs for the Modal and High-Speed Train (HST) Alternatives evaluated in this
Key Project Elements Status Report
 Los Angeles County Metropolitan Transportation Authority Key Project Elements Status Report presented to the Corridor Advisory Committee August 18, 2016 Background Motion 22.1 elements are grouped into
Highway 18 BNSF Railroad Overpass Feasibility Study Craighead County. Executive Summary
 Highway 18 BNSF Railroad Overpass Feasibility Study Craighead County Executive Summary October 2014 Highway 18 BNSF Railroad Overpass Feasibility Study Craighead County Executive Summary October 2014 Prepared
Parks and Transportation System Development Charge Methodology
 City of Sandy Parks and Transportation System Development Charge Methodology March, 2016 Background In order to implement a City Council goal the City of Sandy engaged FCS Group in January of 2015 to update
Federal Funding Opportunities Northeast Drayage Workshop October 13, Reema Loutan Environmental Engineer EPA Region 2
 Federal Funding Opportunities Northeast Drayage Workshop October 13, 2010 Reema Loutan Environmental Engineer EPA Region 2 Opportunities Overview Diesel Emission Reduction Program Congestion Mitigation
Spatial and Temporal Analysis of Real-World Empirical Fuel Use and Emissions
 Spatial and Temporal Analysis of Real-World Empirical Fuel Use and Emissions Extended Abstract 27-A-285-AWMA H. Christopher Frey, Kaishan Zhang Department of Civil, Construction and Environmental Engineering,
Energy Technical Memorandum
 Southeast Extension Project Lincoln Station to RidgeGate Parkway Prepared for: Federal Transit Administration Prepared by: Denver Regional Transportation District May 2014 Table of Contents Page No. Chapter
Subarea Study. Manning Avenue (CSAH 15) Corridor Management and Safety Improvement Project. Final Version 1. Washington County.
 Corridor Management and Safety Improvement Project. Final Version 1. Washington County.") Subarea Study Manning Avenue (CSAH 15) Corridor Management and Safety Improvement Project Final Version 1 Washington County June 12, 214 SRF No. 138141 Table of Contents Introduction... 1 Forecast Methodology
Subarea Study Manning Avenue (CSAH 15) Corridor Management and Safety Improvement Project Final Version 1 Washington County June 12, 214 SRF No. 138141 Table of Contents Introduction... 1 Forecast Methodology
APPLICATION OF A PARCEL-BASED SUSTAINABILITY TOOL TO ANALYZE GHG EMISSIONS
 APPLICATION OF A PARCEL-BASED SUSTAINABILITY TOOL TO ANALYZE GHG EMISSIONS Jung Seo, Hsi-Hwa Hu, Frank Wen, Simon Choi, Cheol-Ho Lee Research & Analysis Southern California Association of Governments 2012
Table Existing Traffic Conditions for Arterial Segments along Construction Access Route. Daily
 5.8 TRAFFIC, ACCESS, AND CIRCULATION This section describes existing traffic conditions in the project area; summarizes applicable regulations; and analyzes the potential traffic, access, and circulation
CHAPTER 7: EMISSION FACTORS/MOVES MODEL
 CHAPTER 7: EMISSION FACTORS/MOVES MODEL 7.1 Overview This chapter discusses development of the regional motor vehicle emissions analysis for the North Central Texas nonattainment area, including all key
U.S. System Summary: ARIZONA/SOUTHWEST
 U.S. System Summary: ARIZONA/SOUTHWEST Arizona/Southwest High-Speed Rail System (Source: Texas A&M Transportation Institute) The Arizona/Southwest high-speed rail system described in this summary groups
REALIZING THE AIR QUALITY BENEFITS OF PORT INFRASTRUCTURE PROJECTS. A Case Study of the Alameda Corridor
 REALIZING THE AIR QUALITY BENEFITS OF PORT INFRASTRUCTURE PROJECTS A Case Study of the Alameda Corridor April 29, 25 Dr. Margaret Lobnitz, Weston Solutions, Inc. 1 BACKGROUND In mid-198 s, growing concern
Table of Contents INTRODUCTION... 3 PROJECT STUDY AREA Figure 1 Vicinity Map Study Area... 4 EXISTING CONDITIONS... 5 TRAFFIC OPERATIONS...
 Crosshaven Drive Corridor Study City of Vestavia Hills, Alabama Table of Contents INTRODUCTION... 3 PROJECT STUDY AREA... 3 Figure 1 Vicinity Map Study Area... 4 EXISTING CONDITIONS... 5 TRAFFIC OPERATIONS...
Review of the SMAQMD s Construction Mitigation Program Enhanced Exhaust Control Practices February 28, 2018, DRAFT for Outreach
 ABSTRACT The California Environmental Quality Act (CEQA) review process requires projects to mitigate their significant impacts. The Sacramento Metropolitan Air Quality Management District (SMAQMD or District)
1.1 Purpose of This Environmental Impact Report EIR Process Use of This Report Report Organization...
 Table of Contents SUMMARY PAGE S.1 Project Location and Project Characteristics... S-1 S.2 Project Objectives... S-9 S.3 Project Approvals... S-11 S.4 Impacts and Mitigation Measures... S-12 S.5 Alternatives...
Overview of Plug-In Electric Vehicle Readiness. Coachella Valley Association of Governments
 Overview of Plug-In Electric Vehicle Readiness Coachella Valley Association of Governments Philip Sheehy and Mike Shoberg February 21, 2013 Electric Drive Community Readiness Workshop 2006 ICF International.
I-405 Corridor Master Plan
 Southern California Association of Governments I-405 Corridor Master Plan Presentation to Streets and Freeways Subcommittee October 13, 2015 1 Presentation Overview Expectations and Approach Corridor Performance
Chapter 7: Travel Demand Analysis. Chapter 8. Plan Scenarios. LaSalle Community Center. Image Credit: Town of LaSalle
 Chapter 7: Travel Demand Analysis Chapter 8 Plan Scenarios LaSalle Community Center. Image Credit: Town of LaSalle 164 Chapter 8: Plan Scenarios Moving Ahead for Progress in the 21 st Century Act (MAP
Port of Long Beach. Diesel Emission Reduction Program
 Diesel Emission Reduction Program Competition Port of Long Beach, Planning Division July 16, 2004 Contact: Thomas Jelenić, Environmental Specialist 925 Harbor Plaza, Long Beach, CA 90802 (562) 590-4160
VEHICLE TECHNOLOGY APPENDIX
 VEHICLE TECHNOLOGY APPENDIX Southern California Association of Governments ADOPTED APRIL 2012 THE ROLE OF VEHICLE TECHNOLOGY IN MEETING LONG-TERM AIR QUALITY AND ENERGY CHALLENGES SCAG s Collaborative
EXECUTIVE SUMMARY. The following is an outline of the traffic analysis performed by Hales Engineering for the traffic conditions of this project.
 EXECUTIVE SUMMARY This study addresses the traffic impacts associated with the proposed Shopko redevelopment located in Sugarhouse, Utah. The Shopko redevelopment project is located between 1300 East and
Transportation Electrification: Reducing Emissions, Driving Innovation. July 2017
 Transportation Electrification: Reducing Emissions, Driving Innovation July 2017 California is Raising the Bar in Environmental Policy and Action Senate Bill 32 requires California to reduce emissions
Parking Management Element
 Parking Management Element The State Transportation Planning Rule, adopted in 1991, requires that the Metropolitan Planning Organization (MPO) area implement, through its member jurisdictions, a parking
Transit and Job Growth: Lessons for SB 375. Jed Kolko Public Policy Institute of California
 Transit and Job Growth: Lessons for SB 375 Jed Kolko Public Policy Institute of California Outline Approaches to reducing VMT The land use transportation connection California s experience with transit-oriented
Pacific Electric Right-of-Way / West Santa Ana Branch Corridor Alternatives Analysis
 Pacific Electric Right-of-Way / West Santa Ana Branch Corridor Alternatives Analysis Transit Coalition September 26, 2012 2 Study Area Pacific Electric Rightof-Way/West Santa Ana Branch (PEROW/ WSAB) extends
Introduction and Background Study Purpose
 Introduction and Background The Brent Spence Bridge on I-71/75 across the Ohio River is arguably the single most important piece of transportation infrastructure the Ohio-Kentucky-Indiana (OKI) region.
Bi-County Transitway/ Bethesda Station Access Demand Analysis
 Bi-County Transitway/ Bethesda Station Access Demand Analysis Prepared for: Washington Metropolitan Area Transit Authority Office of Planning and Project Development May 2005 Prepared by: in conjunction
Zorik Pirveysian, Air Quality Policy and Management Division Manager Policy and Planning Department
 Environment Committee Meeting: April 11, 2006 To: From: Environment Committee Zorik Pirveysian, Air Quality Policy and Management Division Manager Policy and Planning Department Date: March 20, 2006 Subject:
DEVELOPMENT OF RIDERSHIP FORECASTS FOR THE SAN BERNARDINO INFRASTRUCTURE IMPROVEMENT STUDY
 APPENDIX 1 DEVELOPMENT OF RIDERSHIP FORECASTS FOR THE SAN BERNARDINO INFRASTRUCTURE IMPROVEMENT STUDY INTRODUCTION: This Appendix presents a general description of the analysis method used in forecasting
Traffic Impact Analysis 5742 BEACH BOULEVARD MIXED USE PROJECT
 Traffic Impact Analysis 5742 BEACH BOULEVARD MIXED USE PROJECT CITY OF BUENA PARK Prepared by Project No. 14139 000 April 17 th, 2015 DKS Associates Jeffrey Heald, P.E. Rohit Itadkar, T.E. 2677 North Main
Executive Summary. Treasure Valley High Capacity Transit Study Priority Corridor Phase 1 Alternatives Analysis October 13, 2009.
 Treasure Valley High Capacity Transit Study Priority Corridor Phase 1 Alternatives Analysis October 13, 2009 Background As the Treasure Valley continues to grow, high-quality transportation connections
Open House. Highway212. Meetings. Corridor Access Management, Safety & Phasing Plan. 5:30 to 6:30 p.m. - Southwest Corridor Transportation Coalition
 Welcome Meetings 5:30 to 6:30 p.m. - Southwest Corridor Transportation Coalition 6:30 to 8:00 p.m. - Open House Why is Highway 212 Project Important? Important Arterial Route Local Support Highway 212
MILLERSVILLE PARK TRAFFIC IMPACT ANALYSIS ANNE ARUNDEL COUNTY, MARYLAND
 MILLERSVILLE PARK TRAFFIC IMPACT ANALYSIS ANNE ARUNDEL COUNTY, MARYLAND Prepared for: Department of Public Works Anne Arundel County Prepared by: URS Corporation 4 North Park Drive, Suite 3 Hunt Valley,
Benefits of greener trucks and buses
 Rolling Smokestacks: Cleaning Up America s Trucks and Buses 31 C H A P T E R 4 Benefits of greener trucks and buses The truck market today is extremely diverse, ranging from garbage trucks that may travel
BROWARD BOULEVARD CORRIDOR TRANSIT STUDY
 BROWARD BOULEVARD CORRIDOR TRANSIT STUDY FM # 42802411201 EXECUTIVE SUMMARY July 2012 GOBROWARD Broward Boulevard Corridor Transit Study FM # 42802411201 Executive Summary Prepared For: Ms. Khalilah Ffrench,
Travel Forecasting Methodology
 Travel Forecasting Methodology Introduction This technical memorandum documents the travel demand forecasting methodology used for the SH7 BRT Study. This memorandum includes discussion of the following:
FINAL. Sound Transit Long-Range Plan Update. Issue Paper S.1: Tacoma Link Integration with Central Link. Prepared for: Sound Transit
 Sound Transit Long-Range Plan Update Issue Paper S.1: Tacoma Link Integration with Central Link Prepared for: Sound Transit Prepared by: Quade & Douglas, Inc. FINAL March 2005 Foreword This issue paper
B. Approval of the Statement of Proceedings/Minutes for the meeting of October 24, 2017.
 COUNTY OF SAN DIEGO AIR POLLUTION CONTROL BOARD REGULAR MEETING MEETING AGENDA WEDNESDAY, NOVEMBER 15, 2017, 9:00 AM BOARD OF SUPERVISORS NORTH CHAMBER 1600 PACIFIC HIGHWAY SAN DIEGO, CA 92101 A. Roll
City of Marina. Regional Roundabout Study Utilizing Caltrans Intersection Control Evaluation Section 4: Transportation Agency for Monterey County
 Regional Roundabout Study Utilizing Caltrans Intersection Control Evaluation Section 4: City of Marina Study Intersections: RESERVATION ROAD AT BEACH ROAD RESERVATION ROAD AT DEFOREST ROAD CARDOZA AVENUE
Interstate Operations Study: Fargo-Moorhead Metropolitan Area Simulation Output
 NDSU Dept #2880 PO Box 6050 Fargo, ND 58108-6050 Tel 701-231-8058 Fax 701-231-6265 www.ugpti.org www.atacenter.org Interstate Operations Study: Fargo-Moorhead Metropolitan Area 2015 Simulation Output Technical
2. Valley Circle Boulevard/Andora Avenue/Baden Avenue and Lassen Street
 IV.J TRANSPORTATION 1. INTRODUCTION This section presents an overview of the existing traffic and circulation system in and surrounding the project site. This section also discusses the potential impacts
Technical Memorandum Analysis Procedures and Mobility Performance Measures 100 Most Congested Texas Road Sections What s New for 2015
 Technical Memorandum Analysis Procedures and Mobility Performance Measures 100 Most Congested Texas Road Sections Prepared by Texas A&M Transportation Institute August 2015 This memo documents the analysis
Restoration of Historic Streetcar Services in Downtown Los Angeles
 Restoration of Historic Streetcar Services in Downtown Los Angeles Alternatives Analysis Community Update Meeting August 2, 2011 Introduction Key players Local lead agency: Metro Federal lead agency: Federal
Broward County Intermodal Center And People Mover. AASHTO Value Engineering Conference Presentation. September 1, 2009 San Diego, CA
 Project Development & Environment Study Broward County Intermodal Center And People Mover AASHTO Value Engineering Conference Presentation September 1, 2009 San Diego, CA Background P D & E Study Regional
Electric Vehicle Cost-Benefit Analyses
 Electric Vehicle Cost-Benefit Analyses Results of plug-in electric vehicle modeling in eight US states Quick Take M.J. Bradley & Associates (MJB&A) evaluated the costs and States Evaluated benefits of
New Buck O Neil (U. S. 169) Crossing Benefit-Cost Analysis. Kansas City, Missouri
 Crossing Benefit-Cost Analysis. Kansas City, Missouri") New Buck O Neil (U. S. 169) Crossing Benefit-Cost Analysis Kansas City, Missouri New Buck O Neil (U. S. 169) Crossing Benefit-Cost Analysis prepared for Kansas City, Missouri prepared by Burns & McDonnell
New Buck O Neil (U. S. 169) Crossing Benefit-Cost Analysis Kansas City, Missouri New Buck O Neil (U. S. 169) Crossing Benefit-Cost Analysis prepared for Kansas City, Missouri prepared by Burns & McDonnell
Downtown Lee s Summit Parking Study
 Downtown Lee s Summit Parking Study As part of the Downtown Lee s Summit Master Plan, a downtown parking and traffic study was completed by TranSystems Corporation in November 2003. The parking analysis
Funding Scenario Descriptions & Performance
 Funding Scenario Descriptions & Performance These scenarios were developed based on direction set by the Task Force at previous meetings. They represent approaches for funding to further Task Force discussion
Metropolitan Freeway System 2013 Congestion Report
 Metropolitan Freeway System 2013 Congestion Report Metro District Office of Operations and Maintenance Regional Transportation Management Center May 2014 Table of Contents PURPOSE AND NEED... 1 INTRODUCTION...
Point A Point B Point C Point D. Fulton County Board of Commissioners and Mayors Meeting December 14, 2017
 Fulton County Board of Commissioners and Mayors Meeting December 14, 2017 Master Plan Overview Phase 1 Community Vision and Existing Transit Conditions Phase 2 Scenario Development Phase 3 Transit Master
2016 Congestion Report
 2016 Congestion Report Metropolitan Freeway System May 2017 2016 Congestion Report 1 Table of Contents Purpose and Need...3 Introduction...3 Methodology...4 2016 Results...5 Explanation of Percentage Miles
AMBER M. KLESGES BOARD SECRETARY. No.\w-Tm
 \C. 9! J RECOMMENDATION APPROVED; RESOLUTION NO. 16-7999 AND TEMPORARY ORDER 16-7209 & PERMANENT ORDER 16-7210 ADOPTED; BY THE BOARD OF HARBOR COMMISSIONERS \b 1 September 15, 2016 1A THE PORT OF LOS ANGELES
Transportation Sustainability Program
 Transportation Sustainability Program Photo: Sergio Ruiz San Francisco 2016 Roads and public transit nearing capacity Increase in cycling and walking despite less than ideal conditions 2 San Francisco
Kendall Drive Premium Transit PD&E Study Project Kick-Off Meeting SR 94/Kendall Drive/SW 88 Street Project Development and Environment (PD&E) Study
 Study") Florida Department of Transportation District Six Kendall Drive Premium Transit PD&E Study Project Kick-Off Meeting SR 94/Kendall Drive/SW 88 Street Project Development and Environment (PD&E) Study What
Florida Department of Transportation District Six Kendall Drive Premium Transit PD&E Study Project Kick-Off Meeting SR 94/Kendall Drive/SW 88 Street Project Development and Environment (PD&E) Study What
REPORT CARD FOR CALIFORNIA S INFRASTRUCTURE WHAT YOU SHOULD KNOW ABOUT CALIFORNIA S TRANSIT FACILITIES
 TRANSIT GRADE: C- WHAT YOU SHOULD KNOW ABOUT TRANSIT FACILITIES California needs robust, flexible and reliable transit systems to reduce peak congestion on our highways, provide options for citizens who
Summit County Greenhouse Gas Emissions Summary, 2017
 Summit County Greenhouse Gas Emissions Summary, 2017 In 2018, Summit County completed its first greenhouse gas inventory to better understand its emissions profile and to give insight to policies and programs
Office of the Mayor City of Los Angeles MAYOR VILLARAIGOSA LAUNCHES LANDMARK CLEAN TRUCK PROGRAM TO CLEAN LOS ANGELES' AIR
 Office of the Mayor City of Los Angeles FOR IMMEDIATE RELEASE Contact:. Janelle Erickson (21 3) 978-0741 MAYOR VILLARAIGOSA LAUNCHES LANDMARK CLEAN TRUCK PROGRAM TO CLEAN LOS ANGELES' AIR The most ambitious
Clearing the Air in West Oakland: Port Impacts, Freight Transport & Environmental Justice
 Clearing the Air in West Oakland: Port Impacts, Freight Transport & Environmental Justice Swati Prakash, Pacific Institute (Community Strategies for Sustainability & Justice) & Ditching Dirty Diesel Collaborative
Clean Diesel Funding. Clean Airport Fleets Workshop June 14, 2011
 National Clean Diesel Campaign: Clean Diesel Funding Clean Airport Fleets Workshop June 14, 2011 Francisco Dóñez, U.S. EPA PRESENTATION OUTLINE Why Diesel Matters National Clean Diesel Campaign West Coast
Town of Londonderry, New Hampshire NH Route 28 Western Segment Traffic Impact Fee Methodology
 Town of Londonderry, New Hampshire NH Route 28 Western Segment Traffic Impact Fee Methodology Prepared by the Londonderry Community Development Department Planning & Economic Development Division Based
SAN FRANCISCO MUNICIPAL TRANSPORTATION AGENCY
 THIS PRINT COVERS CALENDAR ITEM NO: 10.2 DIVISION: Sustainable Streets BRIEF DESCRIPTION: SAN FRANCISCO MUNICIPAL TRANSPORTATION AGENCY Approving various routine parking and traffic modifications. SUMMARY:
REMOVE II VANPOOL VOUCHER INCENTIVE PROGRAM
 REMOVE II VANPOOL VOUCHER INCENTIVE PROGRAM GUIDELINES, POLICIES, AND PROCEDURES Complete Version The San Joaquin Valley Air Pollution Control District (District) is seeking applications from vanpool riders
Interstate Operations Study: Fargo-Moorhead Metropolitan Area Simulation Results
 NDSU Dept #2880 PO Box 6050 Fargo, ND 58108-6050 Tel 701-231-8058 Fax 701-231-6265 www.ugpti.org www.atacenter.org Interstate Operations Study: Fargo-Moorhead Metropolitan Area 2025 Simulation Results
Sales and Use Transportation Tax Implementation Plan
 Sales and Use Transportation Tax Implementation Plan Transportation is more than just a way of getting from here to there. Reliable, safe transportation is necessary for commerce, economic development,
Transit in Bay Area Blueprint
 Rail~Volution 2010 Click to edit Master title style Transit in Bay Area Blueprint October 21, 2010 0 Bottom Line State-of-Good Repair essential for reliable transit service large funding shortfalls BART
A IR Q UALITY A PPENDIX
 A P P E N D I X B A IR Q UALITY A PPENDIX... CO EWP Petaluma East Washington Place, Petaluma CARBON MONOXIDE ANALYSIS PM Peak Hour Assumes worst case of all intersections based on total volume, LOS and
The Preferred Alternative: a Vision for Growth on the Northeast Corridor
 A Long-Term Vision is Needed The Preferred Alternative: a Vision for Growth on the Northeast Corridor The Federal Railroad Administration (FRA) has released the Tier 1 Final Environmental Impact Statement
UTA Transportation Equity Study and Staff Analysis. Board Workshop January 6, 2018
 UTA Transportation Equity Study and Staff Analysis Board Workshop January 6, 2018 1 Executive Summary UTA ranks DART 6 th out of top 20 Transit Agencies in the country for ridership. UTA Study confirms
LOS ANGELES COUNTY METROPOLITAN TRANSPORTATION AUTHORITY (LACMTA) AND FEDERAL TRANSIT ADMINISTRATION (FTA)
 AND FEDERAL TRANSIT ADMINISTRATION (FTA)") LOS ANGELES COUNTY METROPOLITAN TRANSPORTATION AUTHORITY (LACMTA) AND FEDERAL TRANSIT ADMINISTRATION (FTA) NOTICE OF PREPARATION (NOP)/NOTICE OF INTENT (NOI) OF AN ENVIRONMENTAL IMPACT STATEMENT (EIS)/ENVIRONMENTAL
LOS ANGELES COUNTY METROPOLITAN TRANSPORTATION AUTHORITY (LACMTA) AND FEDERAL TRANSIT ADMINISTRATION (FTA) NOTICE OF PREPARATION (NOP)/NOTICE OF INTENT (NOI) OF AN ENVIRONMENTAL IMPACT STATEMENT (EIS)/ENVIRONMENTAL
San Pedro Bay Ports. Port of Los Angeles 7.9 million TEUs Port of Long Beach 6.0 million TEUs. Total 13.9 million TEUs in 2011
 Port Background San Pedro Bay Ports Port of Los Angeles 7.9 million TEUs Port of Long Beach 6.0 million TEUs Total 13.9 million TEUs in 2011 San Pedro Bay Port Complex Emissions and the Clean Air Action
Travel Time Savings Memorandum
 04-05-2018 TABLE OF CONTENTS 1 Background 3 Methodology 3 Inputs and Calculation 3 Assumptions 4 Light Rail Transit (LRT) Travel Times 5 Auto Travel Times 5 Bus Travel Times 6 Findings 7 Generalized Cost
CITY OF LOS ANGELES DEPARTMENT OF AIRPORTS
 CITY OF LOS ANGELES DEPARTMENT OF AIRPORTS COMPRESSED NATURAL GAS 35-FOOT TRANSIT BUSES CONTRACT NUMBER ML09032 FINAL REPORT APRIL 2015 SUBMITTED BY: LOS ANGELES WORLD AIRPORTS MAINTENANCE DIVISION Prepared
2030 Multimodal Transportation Study
 2030 Multimodal Transportation Study City of Jacksonville Planning and Development Department Prepared by Ghyabi & Associates April 29,2010 Introduction Presentation Components 1. Study Basis 2. Study
Clean Harbors Canada, Inc.
 Clean Harbors Canada, Inc. Proposed Lambton Landfill Expansion Environmental Assessment Terms of Reference Transportation Assessment St. Clair Township, Ontario September 2009 itrans Consulting Inc. 260
The Case for. Business. investment. in Public Transportation
 The Case for Business investment in Public Transportation Introduction Public transportation is an enterprise with expenditure of $55 billion in the United States. There has been a steady growth trend
Driving to Net Zero. County of Santa Clara Office of Sustainability. Submitted to: Santa Clara County Submitted by: ICF
 Driving to Net Zero Submitted to: Santa Clara County Submitted by: ICF County of Santa Clara Office of Sustainability Funded through a grant awarded by the California Strategic Growth Council MARCH 9,
Transportation & Climate Initiative Regional EV Corridors
 Transportation & Climate Initiative Regional EV Corridors NEDC Partners Meeting September 25, 2017 Matthew Goetz Georgetown Climate Center Georgetown Climate Center: A Resource for State and Federal Climate
Michigan/Grand River Avenue Transportation Study TECHNICAL MEMORANDUM #18 PROJECTED CARBON DIOXIDE (CO 2 ) EMISSIONS
 EMISSIONS") TECHNICAL MEMORANDUM #18 PROJECTED CARBON DIOXIDE (CO 2 ) EMISSIONS Michigan / Grand River Avenue TECHNICAL MEMORANDUM #18 From: URS Consultant Team To: CATA Project Staff and Technical Committee Topic:
TECHNICAL MEMORANDUM #18 PROJECTED CARBON DIOXIDE (CO 2 ) EMISSIONS Michigan / Grand River Avenue TECHNICAL MEMORANDUM #18 From: URS Consultant Team To: CATA Project Staff and Technical Committee Topic:
Stakeholders Advisory Working Groups (SAWGs) Traffic and Transit SAWG Meeting #7
 Traffic and Transit SAWG Meeting #7") Presentation Tappan Zee Bridge/I-287 Corridor Environmental Review December 4, 2008 Slide 1 Title Slide Slide 2 This presentation discusses the contents of the Transit Mode Selection Report. Slide 3 The
Presentation Tappan Zee Bridge/I-287 Corridor Environmental Review December 4, 2008 Slide 1 Title Slide Slide 2 This presentation discusses the contents of the Transit Mode Selection Report. Slide 3 The
REGIONAL GREENHOUSE GAS INVENTORY: TRANSPORTATION AND STATIONARY ENERGY
 SOUTHEAST FLORIDA REGIONAL COMPACT CLIMATE CHANGE REGIONAL GREENHOUSE GAS INVENTORY: TRANSPORTATION AND STATIONARY ENERGY METHODOLOGY REPORT Implementation support provided by: With funding support from:
Charlotte-Mecklenburg Region Rapid Transit and Land-Use Integration
 Charlotte-Mecklenburg Region Rapid Transit and Land-Use Integration Legislative Committee on Urban Growth and Infrastructure Carolyn Flowers CEO Charlotte Area Transit System March 23, 2010 Charlotte Region
Rapid Transit and Land-Use Integration a Reality
 City of Charlotte Rapid Transit and Land-Use Integration a Reality Transportation Oversight Committee Carolyn Flowers CEO Charlotte Area Transit System April 29, 2010 Charlotte Region Statistics Mecklenburg
YULA Boys High School Expansion
 Environmental Review Section City Hall 200 N. Spring Street, Room 750 Los Angeles, CA 90012 RECIRCULATED TRAFFIC/TRANSPORTATION/PARKING CHAPTER WEST LOS ANGELES COMMUNITY PLAN AREA YULA Boys High School
Florida Strategic Highway Safety Planning Florida Strategic Highway Safety Plan (SHSP) Update and Performance Overview
 Update and Performance Overview") Session 1 Florida Strategic Highway Safety Planning Florida Strategic Highway Safety Plan (SHSP) Update and Performance Overview Joe Santos, PE, FDOT, State Safety Office October, 23, 2013 Florida Statistics
Session 1 Florida Strategic Highway Safety Planning Florida Strategic Highway Safety Plan (SHSP) Update and Performance Overview Joe Santos, PE, FDOT, State Safety Office October, 23, 2013 Florida Statistics