S.1 Introduction. ES-1 Final December 2008
|
|
|
- Barbara Charles
- 5 years ago
- Views:
Transcription
1 S.1 Introduction The Regional Connector Transit Corridor project (Regional Connector) is a vital, core piece of public transit infrastructure that enhances investments already made in the existing Metro Light Rail system. It will link four distinct travel corridors covering over 50 miles across the County through the center of downtown Los Angeles. The Los Angeles County Metropolitan Transportation Authority (Metro) has envisioned this connection for nearly two decades beginning in the late 1980 s/early 1990 s. At the time of the Metro Rail system s inception, the Long Beach and Pasadena light rail branches were envisioned to meet in downtown Los Angeles and operate as a single line 1. However, the downtown segment was never built, and passengers now must transfer to the Metro Red Line to move between the two branches as well as reach many major central business district destinations. This solution has functioned acceptably during the Metro Rail system s infancy. However, with the Metro Expo Line to Culver City and Metro Gold Line Eastside Extension opening over the next two years, increasing ridership, increased traffic congestion, and new major regional developments occurring in downtown Los Angeles, a direct high-capacity link to tie the unconnected regional branches of Metro s light rail system together through downtown is needed. The proposed Regional Connector would directly link 7 th St./Metro Center Station (the Metro Blue Line and Metro Expo Line (2010) terminus) located at 7 th and Figueroa Sts., to the Little Tokyo/Arts District Station (a new Metro Gold Line Station opening in 2009) at 1 st and Alameda Sts. The project would include several new stations downtown and would allow train operations between Long Beach and Pasadena without the need to transfer. Simultaneously, it would allow train operations between East Los Angeles and Culver City also without the need to transfer. It would also provide passengers with direct trains into the heart of the business and civic districts, whereas the line currently passes along the periphery and then north to Union Station. Metrolink, Amtrak, and Metro Red Line passengers would also have the option to transfer to the Long Beach-Pasadena and East Los Angeles-Culver City trains and reach portions of the downtown area not presently served by Metro Rail. The Regional Connector is a project which provides regional benefits to residents across the County, and can be accomplished with just 1.8 miles of a new set of dual tracks. Since conclusion of early studies conducted in the early 90 s and even as late as 2004, much has changed in the downtown Los Angeles area including the availability of right-of-way due to new civic and private developments and the residential explosion created by new development as well as re-use of historic underutilized buildings. Alternatives previously studied, while being mindful of the tight physical and environmental constraints concerning the construction of new infrastructure in a dense urban area like downtown Los Angeles were no longer applicable. Particularly challenging is the lack of vacant rail rights-of-way for transit vehicles to use, the high traffic pedestrian volumes on streets throughout the project study area (PSA), and the high volume of trains that will funnel into the Regional Connector. New solutions that 1 Pasadena to Los Angeles Project EIR ES-1 Final December 2008

2 negotiate these difficulties while maximizing benefits to the regional transit system, providing opportunities for land use improvements, and minimizing impingement on the existing street network have been challenging to develop. Some proposed solutions include splitting the tracks into a couplet to avoid taking two lanes on the same street for rail use, building underpasses to eliminate conflicts between trains and automobiles, and building the tracks underground. The following map (Figure S-1) shows the PSA and illustrates the present gap in the light rail network. Figure S-1 Project Study Area By linking the 7 th St./Metro Center and Little Tokyo/Arts District Stations, Metro will have the ability to provide continuous service across the region in two different directions: east/west and north/south without the need for transfer. The Regional Connector would thus provide a faster, more attractive transit option that provides greater access to the downtown area and mobility region-wide. The project would make possible the following operation plan (Figure S- 2); without it, each of the light rail branches shown would reach only the edge of downtown Los Angeles. ES-2 Final December 2008

3 Figure S-2 Anticipated Service Plan Recognizing the potential benefits to Southern California residents, the Metro Board authorized an Alternatives Analysis (AA) study in July 2007 to explore various technologies and route alignments for the Regional Connector. This report contains the results of that AA study. S.2 Purpose of this Study The AA is the first phase in the fixed guideway transit project development process defined by Metro and the Federal Transit Administration (FTA) under the New Starts program s Project Planning and Development process. The AA defines a specific transportation need in a corridor, identifies all reasonable alternatives and narrows down the alternatives based on a screening process using evaluation criteria developed during early scoping. The AA provides the reasoning for decisions regarding the identification and narrowing of alternatives. The ES-3 Final December 2008

4 study is based on evaluation criteria and measures consistent with FTA New Starts guidelines including costs, benefits, environmental and community impacts and financial feasibility, as well as input from local stakeholders, community members, and public agencies. Figure S-3 Alternatives Analysis Process Final Alternative Relying on sound assumptions, public input, and initial conceptual engineering, this AA report includes a recommendation to carry a short list of alternatives into the next phase, which includes environmental documentation and clearance per the National Environmental Policy Act (NEPA) and the California Environmental Quality Act (CEQA), advanced conceptual engineering, and the selection of a Locally Preferred Alternative (LPA). Upon selection of the LPA and securement of FTA approval, final environmental documentation and preliminary engineering will be initiated. The process will ultimately lead to a certification of the environmental document, a Record of Decision by FTA, and potential negotiation of a Full Funding Grant Agreement between FTA and Metro. The following diagram (Figure S-4) shows the AA phase with respect to the entire FTA New Starts process. ES-4 Final December 2008

5 Figure S-4 FTA New Starts Process Graphic by Federal Transit Administration ES-5 Final December 2008

6 S.3 Background The PSA is bounded by the Harbor Freeway (SR-110) on the west, the Santa Ana Freeway (US- 101) on the north, Alameda St. on the east, and 7 th and 9 th Sts. on the south. The area presently experiences heavy traffic congestion on weekdays, particularly on the surrounding freeways and the arterial streets leading to freeway on-ramps. Streets in the dense western portion of the PSA (Bunker Hill and the Financial District) routinely experience the highest traffic volumes, with 20,000-30,000 trips per day on some segments of Figueroa and Flower Sts. Though the volumes on these streets are high, the roadways are configured for one-way operation, and are six lanes wide in most places. As such, they accommodate traffic better than some of the narrower streets with lower traffic volumes elsewhere in the PSA. The worstperforming intersection in the PSA, 1 st and Alameda Sts., operates at level of service (LOS, a measure of vehicular traffic) F during the morning rush hour, indicating severe congestion. In light of the rapid resurgence of development in the downtown area, traffic conditions are likely to worsen in the absence of improved transit connections to and within the PSA. In the early 1990 s, prior to the selection of a finalized rail transit route from downtown Los Wide roadway on Flower Street near 5 th Street, with six automobile traffic lanes and one curb lane of parking. This segment of Flower Street carries about 20,000 cars on a typical weekday. Angeles to Pasadena, the Los Angeles County Transportation Commission (LACTC, one of Metro s predecessors) studied the continuation of the Metro Blue Line from the existing 7 th St./Metro Center Station north to Pasadena. However, LACTC decided to initiate the new light rail service to Pasadena from Union Station, concluding that in the interim, riders would be ES-6 Final December 2008
7 required to transfer to the existing Metro Red Line, which connects Union Station to 7 th St./Metro Center Station, until additional funding for a direct connection became available. Transfer to Red Line Required Interim solution for connections between the Metro Gold Line and Metro Blue Line selected by LACTC in Trips involving both the Metro Gold Line and the Metro Blue Line require two transfers. In 2004, after the Metro Gold Line to Pasadena had opened and construction of the Metro Gold Line Eastside Extension had commenced, Metro initiated studies to revisit the connection between the Metro Gold and Blue Lines. Originally planned as an extension of the heavy rail Metro Red Line that would serve the strong east-west travel demand in the region, the Metro Gold Line Eastside Extension is currently being built as a light rail line to Union Station. In addition, the first phase of a new light rail line, the Metro Expo Line, is also being constructed between Culver City and 7 th St./Metro Center Station. This first phase is scheduled for completion in The benefits of having three light rail lines serving four distinct transit corridors connecting through downtown Los Angeles allowing for cross-county trips on a single train prompted Metro to initiate an AA study that would guide the development and funding of this project. In June 2008, Metro included the Regional Connector Transit Corridor project in its Draft Long Range Transportation Plan (LRTP) (Figure S-5) as the highest ranking rail project in the Tier 1 Unfunded Strategic Plan. At the moment, $160 million has been identified in the recent passage of the half cent sales tax, Measure R, and additional funding will need to be secured to ES-7 Final December 2008
8 build and operate the line. This is consistent with Regional Transportation Plan (RTP) which was approved by the Southern California Association of Governments (SCAG) in May ES-8 Final December 2008

9 Figure S-5 Metro 2008 Draft Long Range Transportation Plan Summary ES-9 Final December 2008
10 S.4 Purpose and Need for Transit Investment As population, congestion and energy costs increase, there is a need to create mobility options for Los Angeles County. A transportation investment in the PSA will improve mobility, the environment, the economy and the livability for all of Los Angeles County. As the densest business district in the region, the downtown area includes major civic uses, high rise office buildings, the historic core, and multi-billion dollar entertainment venues, all surrounded by four major interstates and state highways operating at poor levels of service. Expansion of the roadway and highway network within the Regional Connector PSA is greatly limited due to the built-out nature of this central business core. The Metro Rail system provides an efficient alternative to driving for people travelling to the downtown area, but Los Angeles County has several other dense business and activity districts not within downtown Los Angeles that are also served by the rail system, requiring many passengers to pass through downtown to reach them. At present, passengers wishing to travel through downtown Los Angeles on the light rail system must make two transfers, and many Metro Gold and Blue Line passengers need to transfer to the Metro Red Line to reach destinations within the downtown area. Metro Gold Line Eastside Extension and Metro Expo Line passengers will face the same delays (up to 20 minutes for transfers in some cases) and contribute to crowding on the Metro Red Line. According to the 2004 Metro Rail Onboard Survey, approximately half of all Gold Line riders used more than one train to complete their trips, suggesting that about 10,000 people are transferring between the Red and Gold Lines each day to travel in the direction of downtown Los Angeles. Ridership on the Metro Gold Line has grown by nearly one-third since 2004, so the number of passengers transferring to the Metro Red and Purple Lines today is likely higher. Surveys have not been completed for potential Metro riders of the Metro Gold Line Eastside Extension, the Metro Expo Line and the current riders of the Metro Blue Line. Updated surveys will be completed to determine size of stations and frequency of trains. A direct connection linking Metro s light rail lines together will allow for more transfer-free trips to be made through the downtown Los Angeles from dense residential areas to other employment-rich districts. The following table shows the current and projected year 2030 Metro Rail boardings under No Build conditions. Table S-1 Current and Projected Year 2030 No Build Rail Boardings Line Average Weekday Boardings Projected Average Weekday Boardings Metro Light Rail Lines 130, ,200 Metro Heavy Rail Lines 125, ,500 Total 255, ,700 ES-10 Final December 2008
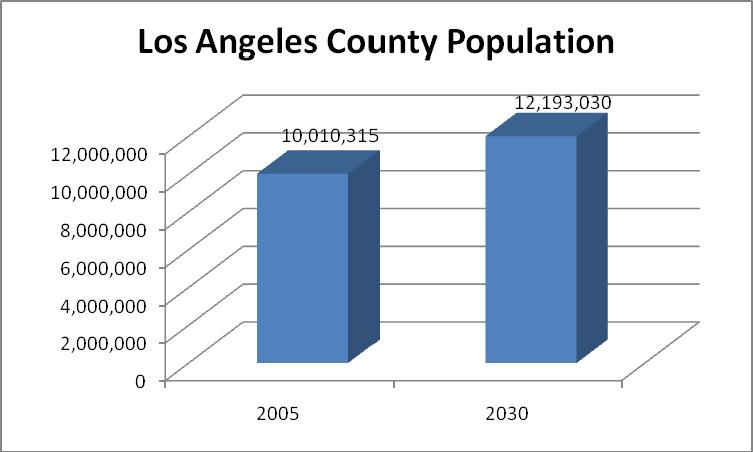
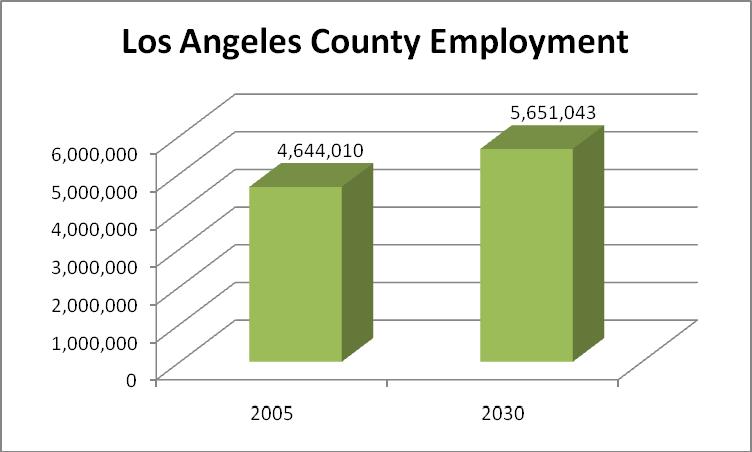
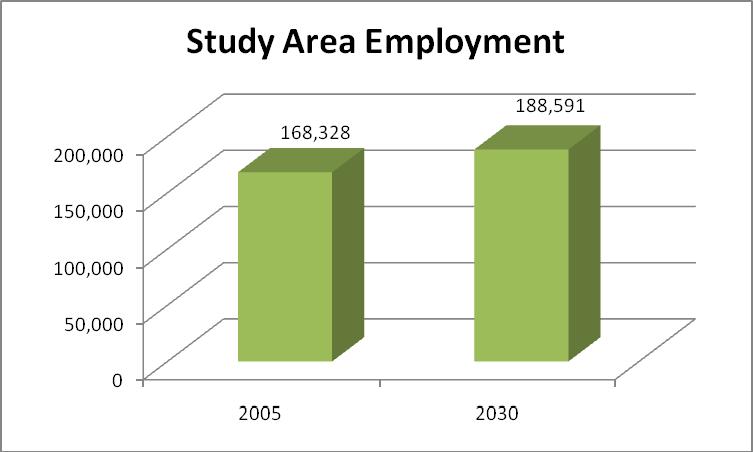
11 Demographics According to year 2005 data provided by the Southern California Association of Governments, the PSA houses nearly 18,000 people at a density of 11,700 per square mile. However, there are over 168,000 jobs in the same area, at a density of 111,000 per square mile. This formidable imbalance between jobs and housing within the PSA results in heavy inbound commute traffic in the morning and similarly large outbound flows in the afternoon. Accordingly, the PSA records the highest levels of transit ridership in the region, and the existing transit system lifts a significant burden off of the freeways and arterial streets radiating from downtown Los Angeles. Improving the efficiency and speed of the transit system has historically been shown, particularly with the introduction of the Metro Rapid bus system and the existing Metro Rail system, to generate sizeable increases in ridership, especially in areas where the demand for transit service is already high. Additional transportation infrastructure will prove invaluable as the PSA grows. SCAG predicts that the PSA s population will increase by 16.5% and the number of employees will increase by 12% by 2030 (Figure S-6). This is partly due to dozens of new and adaptive reuse housing developments currently under construction in the area. Because the Regional Connector is intended to close a gap in the countywide rail system, it is important to note that Los Angeles County s population is expected to grow to 12.2 million people (22 percent) over the same time period, and no freeway expansion projects are planned near the downtown area. Increasing transit capacity and making operations more efficient will be key to allowing the transportation system to accommodate the projected regional growth. Table S-2 shows the projected growth in both the PSA and Los Angeles County as a whole. Table S-2 Population, Household, and Employment Growth Forecast Increase Between Population Study Area 17,795 20, % LA County 10,010,315 12,193, % Study Area % of LA County 0.18% 0.17% --- Households Study Area 9,673 12, % LA County 3,298,210 4,116, % Study Area % of LA County 0.29% 0.39% --- Employment Study Area 168, , % LA County 4,644,010 5,651, % Study Area % of LA County Source: SCAG, 2005 data and 2030 projections 3.62% 3.34% --- ES-11 Final December 2008

12 Figure S-6 Projected Population and Employment Growth ES-12 Final December 2008
13 The following maps (Figures S-7 to S-11) show the population and employment distribution within the PSA. The downtown area has a high concentration of both jobs and residences. As the maps show, areas that contain relatively few jobs contain high numbers of residents, and vice versa. As such, nearly all areas of the PSA contain transit supportive land uses. Most of the jobs and residences are within walking distance of either the proposed Regional Connector routes, or the existing Metro Red and Purple lines. As such, the proposed rail network would provide good coverage of most jobs and housing units in downtown Los Angeles, both now and in Of the 18,000 people that currently live in the PSA, most live in the northern portion of Bunker Hill and the area south of Little Tokyo, both of which would have new rail stations in more proximate locations than the existing ones upon implementation of the Regional Connector. There is evidence of concentrated levels of transit dependency, since 8,600 of the 9,700 households in the area do not have cars, and 7,200 are classified as low income (average annual salary below $12,755 for a two-person household). Furthermore, children and the elderly are among those most likely to use public transportation because they often lack drivers licenses and access to private automobiles, and they account for over one quarter of the PSA s population. As such, a large portion of PSA residents stand to benefit from the new businesses, developments, and amenities in the downtown area, and will augment ridership volumes on the Regional Connector. Like the overall population, low income households are concentrated in the northern portion of Bunker Hill and the southeastern section of the PSA. Like the PSA, Los Angeles County as a whole is expected to undergo a similar growth spurt over the next two decades. Figures S-11 through S-14 map these growth patterns. As shown by the maps, the Metro Rail system passes through many areas with dense employment and residential land uses, including downtown Los Angeles. With large numbers of people within walking distance of the rail lines, the systemwide efficiency gains and better connections between lines generated by the Regional Connector would likely result in substantially increased transit use. ES-13 Final December 2008
14 Figure S-7: Year 2005 Population in the PSA ES-14 Final December 2008

15 Figure S-8: Year 2030 Population in the PSA ES-15 Final December 2008
16 Figure S-9: Year 2005 Employment in the PSA ES-16 Final December 2008

17 Figure S-10: Year 2030 Employment in the PSA ES-17 Final December 2008
18 Table S-3 Transit Dependent Demographic Information Study Area LA County Study Area % of LA County Population 17,795 10,010, % Under 18 years 976 2,798, % Over 65 years 3, , % Households 9,673 3,298, % No vehicle households 8, , % Use public transportation 1, , % Low income households 7,244 1,481, % Total employment 168,328 4,644, % Source: U.S. Census Bureau, 2005 Transportation System Downtown Los Angeles has the highest concentration of transit service in Los Angeles County. Historic growth patterns have established downtown as the crossroads of the region s transportation system. Ten transit operators provide service to 125 stops in the area along 112 bus routes and three rail lines (four when the Metro Expo Line opens in 2010). Bus service runs in a grid pattern through the downtown area, with the heaviest service on 1 st St., the 4 th St./5 th St. couplet, Hill St., Broadway, the Main St./Spring St. couplet, and the Grand Ave./Olive St. couplet. There is also heavy pedestrian activity throughout the PSA. On the Metro Bus system alone, there are over 90,000 daily boardings within the PSA. Headways on some lines are as little as two minutes during peak hours, and there are dozens of express freeway flyer style lines that provide added service during peak periods. The Metro Rail system extends outward from downtown Los Angeles with 73 track miles and 62 stations. Altogether, it logs about 255,000 daily boardings systemwide. Overall, the countywide Metro Bus and Metro Rail systems average 1.6 million boardings each weekday. The busiest routes travel to the areas east and west of downtown, both of which will have expanded light rail service within the next two years. With downtown Los Angeles firmly established as the center of the regional transit network, improved connections and service efficiency in the PSA will reap benefits for transit users throughout Los Angeles County. The relatively low population compared to the number of jobs in the PSA results in over 70,000 inbound commuters every day, and many more passing through. With such high travel demand in and out of the PSA, all of the freeways entering downtown Los Angeles operate at LOS F during peak hours, indicating severe congestion and delays. Like the PSA, most areas of Los Angeles County are affected by freeway congestion, though traffic volumes in the PSA are among the worst, as evidenced by Figure S-15. ES-18 Final December

19 Figure S Regional Population Density ES-19 Final December 2008
20 Figure S Project Regional Population Density ES-20 Final December 2008

21 Figure S Regional Employment Density ES-21 Final December 2008

22 Figure S Projected Regional Employment Density ES-22 Final December 2008
23 Figure S-15 Freeway Levels of Service ES-23 Final December 2008
24 The Level of Service Definitions are provided in Table S-4. On surface streets, many intersections in the PSA carry upwards of 4,000 vehicles during their busiest hour, with many of these located on Figueroa and Flower Sts. Some of worst LOS ratings occur at some of the narrow intersections along 2 nd St., but the only intersection with a rating of LOS F is at 1 st and Alameda Sts. By 2030, two additional intersections are expected to deteriorate to LOS F in the absence of one of the Regional Connector build alternatives. The following tables (Figure S-5 and Figure S-6) summarize the levels of service recently observed (2007) in the PSA. Table S-4 Level of Service Definitions Level of Service Volume/Capacity Ratio Definition A EXCELLENT. No vehicle waits longer than one red light and no approach phase is fully used. B VERY GOOD. An occasional approach phase is fully utilized; many drivers begin to feel somewhat restricted within groups of vehicles. C GOOD. Occasionally drivers may have to wait through more than one red light; backups may develop behind turning vehicles. D FAIR. Delays may be substantial during portions of the rush hours, but enough lower volume periods occur to permit clearing of developing lines, preventing excessive backups. E POOR. Represents the most vehicles intersection approaches can accommodate; may be long lines of waiting vehicles through several signal cycles. F >1.000 FAILURE. Backups from nearby locations or on cross streets may restrict or prevent movement of vehicles out of the intersection approaches. Tremendous delays with continuously increasing queue lengths. Source: Transportation Research Board, Transportation Research Circular No. 212, Interim Materials on Highway Capacity, ES-24 Final December 2008
25 Table S-5: Existing (2007) Intersection Level of Service Intersection AM Peak Hour PM Peak Hour V/C Ratio LOS V/C Ratio LOS Hill St. / 1 st St B 0.73 C Broadway / 1 st St B 0.56 A Spring St. / 1 st St A 0.45 A Main St. / 1 st St A 0.55 A Los Angeles St. / 1 st St A 0.58 A Judge John Aiso St. / 1 st St A 0.69 B Alameda St. / 1 st St F 0.88 D Broadway / 2 nd St D 0.46 A Spring St. / 2 nd St A 0.40 A Main St. / 2 nd St A 0.62 B Los Angeles St. / 2 nd St A 0.59 B San Pedro St. / 2 nd St A 0.52 A Central Ave. / 2 nd St A 0.54 A Alameda St. /2 nd St B 0.67 B Broadway / 3 rd St C 0.60 A Spring St. / 3 rd St A 0.55 A Main St. / 3 rd St A 0.73 C Los Angeles St. / 3 rd St B 0.57 A San Pedro St. / 3 rd St B 0.44 A Central Ave. / 3 rd St A 0.41 A Alameda St. / 3 rd St C 0.57 A Figueroa St. / 3 rd St B 0.84 D Hope St. / Temple St C 0.82 D Grand Ave. / Temple St B 0.68 B Broadway / Temple St. N/A N/A 0.76 C Spring St. / Temple St A 0.42 A Main St. / Temple St A 0.69 B Los Angeles St. / Temple St A 0.63 B Judge John Aiso St. / Temple St A 0.50 A Alameda St. / Temple St B 0.65 B ES-25 Final December 2008
26 Table S-6: Existing (2007) Roadway Segment Average Daily Traffic (ADT) Analysis Primary Street Cross Street Facility Type Number of lanes Capacity ADT V/C Ratio LOS Flower St. 2 nd St. Los Angeles St. Main St. Temple St. 1 st St. 3 rd St. Alameda St. 3 rd St. Secondary 4 28,000 11, A 5 th St. Secondary 6 45,000 19, A 6 th St. Secondary 4 30,000 17, A Wilshire Bl. Secondary 4 30,000 19, B 7 th St. Secondary 4 30,000 18, B Alameda St. Secondary 3 21,000 8, A Central Ave. Secondary 2 14,000 10, C Los Angeles St. Secondary 3 21,000 16, C Main St. Secondary 3 21,000 19, E San Pedro St. Secondary 2 14,000 13, E Spring St. Secondary 4 28,000 14, A 1 st St. Secondary 4 28,000 18, B 2 nd St. Secondary 4 28,000 17, B Temple St. Secondary 5 35,000 22, B 1 st St. 1-Way Major Class II 3 25,500 12, A 2 nd St. 1-Way Major Class II 3 25,500 13, A Temple St. Major Class II 4 34,000 25, C Judge John Aiso St. Major Class II 4 32,000 17, A Los Angeles St. Major Class II 4 32,000 16, A Main St. Major Class II 4 32,000 17, A Alameda St. Secondary 4 28,000 21, C Central Ave. Secondary 4 28,000 23, D Los Angeles St. Secondary 6 42,000 22, A Main St. Secondary 6 42,000 23, A Spring St. Secondary 6 42,000 20, A Flower St. Secondary 4 30,000 19, B Spring St. Secondary 3 22,500 17, C Los Angeles St. Secondary 3 22,500 17, C Main St. Secondary 3 22,500 16, C 1 st St. Major Class II 4 32,000 30, E 2 nd St. Major Class II 4 32,000 27, D The high intersection traffic volumes are largely attributable to the PSA s position as a major regional employment hub. Travel demand from all directions is high, especially from the areas east and west of the PSA. Of the relatively few home-based work trips originating in the PSA, most are bound for the Central East, Central West, and West Los Angeles areas. This is further illustrated in the spider diagrams in Figure S-16 and Figure S-17: ES-26 Final December 2008
27 Figure S-16 Transit Trips to the PSA Year 2006 Home Based Work Transit Trips From Outside Districts to the Regional Connector Study Area ES-27 Final December 2008
28 Figure S-17 Transit Trips from the PSA Year 2006 Home Based Work Transit Trips From the Regional Connector Study Area to Outside Districts ES-28 Final December 2008
29 Transit-Supportive Land Uses and Activity Centers In light of the special constraints on roadway expansion and high traffic volumes in the downtown area, several planning entities have included transit-supportive language and projects in their published guidelines and planning documents. The County of Los Angeles, for example, seeks to encourage a range of transportation services for transit dependent populations, support the linking of regional transportation systems, and expand transportation options throughout the county. The City of Los Angeles Community Redevelopment Agency (CRA/LA) publishes a set of Downtown Design Guidelines, which call for accessible transportation with an emphasis on walking, biking, and transit, rather than automobiles. The potential transit markets for the Regional Connector are two-fold. As mentioned in previous sections, the project will provide a continuous, transfer-free connection between over 50 miles of light rail lines spanning much of Los Angeles County. In addition, there are many activity centers and major destinations within the PSA that will be more easily accessible from the new Regional Connector stations. Downtown Los Angeles is a primary destination for employment, services, entertainment, and increasingly, housing. The Downtown Center Business Improvement District, which comprises a larger area of the downtown than the PSA, expects 10,000 new residents to move downtown between 2006 and The continued growth and revitalization of downtown Los Angeles will generate new transit trips both to and within the PSA, heightening the need for increased transit capacity and more efficient operations. Major development is expected in the Bunker Hill area, where the proposed Grand Avenue Project will add 3.6 million square feet of new construction, including 449,000 sq. ft. of retail and 2,600 new housing units, nearly doubling the existing total. Similarly, the number of planned and recently completed housing units exceeds 2,000 in Little Tokyo, and planning for new housing is underway at the proposed terminus of the Regional Connector, near the Little Tokyo/Arts District Station. The Financial Core is also expected to generate a large number of new trips within the next several years as two projects, Metropolis and Park Fifth, add over 1,000 new residential units and 200 hotel rooms to the PSA. Just south of the study area, near the Pico Station, the four million square foot entertainment, office, and residential complex, LA Live, will serve as major attractions that could generate many through-trips on the Regional Connector. Conclusion Seamlessly linking all of Metro s light rail lines together will allow for shorter trip times, fewer transfers, better schedule adherence, and more reliable service. All of these benefits are key factors that will improve the transit system s ability to attract high ridership. Los Angeles County has invested over $10 billion in its regional rail system over the past two decades, and the Regional Connector would significantly enhance that investment by improving the operations of the existing system, enabling the system to better accommodate future extensions, and making rail transit more convenient and attractive to potential users. By improving the operation of the entire rail system, the Regional Connector will lure solo drivers ES-29 Final December 2008
30 from their cars, reduce burdensome passenger loads on the bus network, and improve access to Los Angeles growing downtown area. In turn, lighter traffic loads on the region s roadways would improve air quality, reduce greenhouse gas emissions, reduce fuel consumption, and represent a step toward a more sustainable transportation system. S.5 Community Input Process In order to ensure that the public was kept informed about the study on an ongoing basis and provided with opportunities to comment at key milestones throughout the study, a detailed Community Outreach and Public Involvement Plan was developed. The Plan included detailed stakeholder identification, communications protocols, public input tracking, and a proposed schedule for interfacing with the public and recommendations for how meetings should be conducted at various stages of the study. Additional recommendations for key stakeholder interviews or briefings, inter-agency coordination, topic specific and other meetings were also included in the Plan. It is important to note, that while plans are important, outreach activities, especially on complex projects, were developed to be flexible enough to accommodate changing circumstances and enhanced approaches. Details of this and other outreach efforts can be found in the Community Participation Summary and Report prepared in November Three series of public meetings were held respectively in November 2007, February 2008, and October 2008 as part of the ongoing community outreach and public involvement process. The overwhelming majority of comments received supported the need for a Regional Connector to enhance the efficiency of the current and future rail system by providing through service between the Metro Blue Line, Gold Line, Gold Line Eastside Extension and Expo Line, and service to link these rail corridors directly to Union Station. Most comments supported almost equally a Grand Avenue and 1 st St. alignment, below grade (i.e. subway), and utilizing Light Rail Transit (LRT) technology. Several potential stations received wide popularity, including, in order of their level of support, Little Tokyo, 7 th St./Metro Center, Bunker Hill, Union Station, Main/1 st St. and Civic Center (i.e., in the northern portion of the study area). No comments were received opposing the Regional Connector, though a few remarks noted that other transit projects may need to receive a higher priority. Many comments specifically pointed out the need to develop a transit system that connects multiple lines, as well as expanding the 7 th St./Metro Center Station to accommodate enhanced service and upgrading various operational systems. Of those providing feedback about the evaluation criteria, the most thought that access was paramount. After the initial scoping meetings, a set of two community update meetings was held to present stakeholders with the results of the early scoping process. The majority of those who submitted comments supported a below-grade alignment. There was very little support for an at-grade alignment, particularly in the financial district. There were no concerns about noise and vibration expressed regarding tunneling through downtown Los Angeles. The community expressed interest in identifying ways to minimize transfers between the transit lines, and improved connections to the Metro Red Line. ES-30 Final December 2008
31 S.6 Alternatives Identification and Evaluation Methodology At the outset of the AA process, Metro considered a wide range of possible modes and alignments to close the gap in the light rail system through downtown Los Angeles. The evaluation and screening process used to compare alternatives is shown in Table S-8 and described briefly in this section. At the start of this AA, an initial set of conceptual alternatives to be considered for the Regional Connector was developed by researching previous studies and related reports. Alternatives no longer viable due to changes in the environment were removed from further consideration. Changes in the environment included but were not limited to new developments of property previously vacant during the development of an earlier report, changes in land use, and placement of new infrastructure. The initial set of conceptual alternatives was then studied with respect to the following attributes: Modes Alignments Configurations Station Locations The following table provides a graphic representation of some of the widely-used transit modes and configurations that were considered for the Regional Connector. During the AA study phase, the project has undergone extensive research and analysis in developing alternatives. This process included: Consideration of alternatives previously studied during the 1990 s as part of the Los Angeles County Metropolitan Transportation Commission s and Metro s Pasadena Blue Line Project Comments received from community involvement activities, including meetings with stakeholders, public agencies, local jurisdiction, and the public during the Initial Scoping phase. Analysis of the engineering and geographic constraints of building new infrastructure in a dense central business district. Surveys of land use and travel patterns to determine the most ideal routes and station locations. Analysis of each alternative s ability to enhance connectivity and reduce transfers within the existing rail system. ES-31 Final December 2008

32 Table S-7 Modes Considered Bus Traditional bus service operates in mixed flow traffic on freeways and arterial streets. Bus service is flexible, easily changed, and has the ability to detour around road obstacles. Service reliability depends heavily on traffic conditions. Bus Rapid Transit (BRT) BRT uses buses in exclusive right-ofway or bus-only lanes with traffic signal priority. Exclusive right-of-way could be configured at-grade, underground, or on aerial structures. Buses have the flexibility to leave their right-of-way and detour around road obstacles. Because of the limited use of mixed flow lanes, BRT service quality is affected less by traffic conditions than traditional bus service. A BRT bus (Metro Orange Line) operating on dedicated right-of-way in an at-grade configuration Light Rail Transit (LRT) LRT uses electric trains on conventional rails, powered by overhead wires. Because the power delivery system is overhead, tracks can be installed in mixed flow lanes, exclusive right-of-way with grade crossings, or roadway medians. Automobiles can drive across or along the tracks at grade crossings and on street-running segments. Right-of-way can be at-grade, aerial, or underground. Trains do not have the flexibility to detour around obstacles, and such incidents typically require single tracking and service interruptions. Because of the limited use of mixed flow lanes, LRT service is typically affected little by traffic conditions. LRT train (Metro Gold Line) operating in an at-grade configuration ES-32 Final December 2008
33 Heavy Rail Transit (HRT) HRT uses electric trains on conventional rails, powered by a third rail. Because the power delivery system is located at track level, tracks can only run in exclusive right-of-way without grade crossings. Automobiles cannot cross the tracks at all. Right-of-way can be at-grade, aerial, or underground, but at-grade alignments require cross-traffic to use overpasses and underpasses. Trains do not have the flexibility to detour around obstacles, and such incidents typically require single tracking and service interruptions. HRT does not use mixed flow lanes, and service is unaffected by roadway traffic conditions. HRT train (Purple Line above) operating in an underground configuration Based on these attributes, 32 initial conceptual alternatives were identified that would link the 7 th St./Metro Center Station and the Metro Gold Line at 1 st and Alameda (Figure S-18). ES-33 Final December 2008

34 Figure S-18 Universe of Alternatives Considered ES-34 Final December 2008
35 Upon completion of an early scoping process where both the general public and public agencies were engaged and provided input. During this process, goals, objectives and evaluation criteria were developed and documented in the Alternatives Analysis Methodology Report (May 2008). From the early scoping process the following seven goals were established: Goal 1 Improve Mobility and Accessibility both Locally and Regionally Develop an efficient and sustainable level of mobility within Los Angeles County to accommodate planned growth and a livable environment. Goal 2 Provide a Cost Effective Transportation System Develop a project that provides sufficient regional benefits to justify the investment. Goal 3 Provide a Safe and Secure Alternative Transportation System Develop a project that is safe for riders, pedestrians and drivers while meeting the region s need for security. Goal 4 Achieve a Financially Feasible Project Develop a project that maximizes opportunity for funding and financing that is financially sustainable. Goal 5 Support Public Involvement and Community Preservation Incorporate the public in the planning process and balance the benefits and impacts while preserving communities in the area, such as Little Tokyo, the Arts District, Bunker Hill, Civic Center and the Historic District. Goal 6 Support Efforts to Improve Environmental Quality Develop a project that minimizes environmental impacts. Goal 7 Support Community Planning Efforts Support the progression of the regional center area as an integrated destination and a dynamic and livable area accommodating projected growth in a sustainable manner. A detailed summary of each of the sub criteria for each of the seven goals is provided in Table S-8. The initial set of alternatives was further refined according to the criteria in the above table, and a set of alternatives identified for additional screening was developed. Some of the initial alternatives were developed in 2004 or earlier, and they assumed the use of several thenvacant parcels which now contain new construction or planned developments. These alternatives, along with others where engineering feasibility would have been problematic, were subsequently reconfigured or dropped from consideration. Altogether total of eight alternatives were identified with some alternatives having minor variations, as shown in Figure S-19. ES-35 Final December 2008
36 Table S-8: Regional Connector Goals, Objectives, Evaluation Criteria and Performance Measures Goal 1 Support Community Planning Efforts Support the progression of the regional center area as an integrated destination and a dynamic and livable area accommodating projected growth in a sustainable manner 2 Support Public Involvement and Community Preservation Incorporate the public in the planning process and balance the benefits and impacts while preserving communities in the area, such as Little Tokyo/Arts District, Bunker Hill, Civic Objectives Support land use policies and Community Plans Support and coordinate with development and redevelopment efforts Support the City s effort to improve urban design and the pedestrian environment by contributing to a healthy environment Support efforts to improve safety and security for downtown residents, employees and visitors Support transit dependent communities Balance the benefits and impacts to low income and minority communities Enable workers and visitors to gain access to the regional center to increase its economic vitality and benefit from its economic opportunity Initial Screening Criteria (Performance Measures) Population, Population Density, Households, Household Density for year 2030 ¼ mile of alignment Transit Oriented Design supportive plans and policies in place (Score 1 - worst to 5 -best) Number of jobs, employment density for year 2030 within a ¼ mile of alignment Number of direct connections to key activity centers within ¼ mile of alignment (Score 1 -worst to 5 -best) Number of opportunities for redevelopment within ¼ mile of alignment (underdeveloped or underutilized properties along alternative alignment) Evaluation of potential disproportionate effects:environmental justice effects will be evaluated per CEQA/NEPA requirements (Score 1 to 5) Initial areas identified for potential acquisitions for stations and alignment (does not include actually in construction) within ¼ mile of alignment Evaluation of potential disproportionate effects: Number of low income HH within¼ mile of proposed alignment Number of residents by ethnicity within ¼ mile of alignment (US Census) Final Screening Criteria (Performance Measures) Number of planned development projects in the area over the next 10 years, including residential/office space/commercial units within a 1/4 mile of stations Number of connections with sidewalks that support the City s Downtown Street Standards Number of potential acquisitions Percentage of service grade separated Evaluation of potential disproportionate effects and risk to environmental justice populations related to construction activities (Score 1 to 5) Urban fit potential, including pedestrian accessibility and urban design enhancement opportunities (Score 1 to 5) ES-36 Final December 2008
37 Table S-8: Regional Connector Goals, Objectives, Evaluation Criteria and Performance Measures 3 Improve Mobility and Accessibility both Locally and Regionally Develop an efficient and sustainable level of mobility within LA County to accommodate planned growth and a livable environment Improve the connectivity of the regional transit service and provide a more attractive travel alternative for residents, workers and visitors in the region Facilitate sustainable regional development Increase ridership of the Metro transit system and reduce single occupancy trips Maintain or enhance transit services to the transit dependent Improve travel time for transit users system-wide Improve person throughput Urban fit potential for alignment and for stations, including physical scale, visual fit, and cultural preservation (Score 1 to 5) Percentage of service grade separated Community Acceptance (High, Medium,Low) Increase in daily transit boardings (amount of transit users increased compared to No Build) New daily transit trips compared to No Build and Transportation System Management (TSM) alternatives Traffic impacts (Number of intersections with E or F Level of Service) Reduction in number of transfers system-wide by operational plan of alignmnet (daily reductions at US & 7th/Metro) Total number of lanes reduced (cumulative for all streets) Number of potentially impacted intersections Hours of transportation user benefits Congestion relief (Reduction in highway travel demand in the corridor) Comparison of highway, bus, and fixed guideway peak period travel times between major travel pairs (Run times, head ways, average speed, station spacing) Peak period travel time (door to door) Travel time savings (Union Station to 7th/Flower) Reduction in Vehicle Miles Traveled (VMT) (VMT compared to No Build) 4 Support Efforts to Improve Environmental Quality Minimize adverse environmental impacts Reduce growth of congestion in corridor Minimize adverse environmental impacts Implement mitigation measures to reduce environmental effects to acceptable levels Peak period travel time through Regional Connector Alignment (including 5 min for each transfer) Number of left turn pockets affected Number of parking spaces potentially affected Number of driveways affected Daily hours of transportation user benefits (Compared to No Build) Noise (Number of curves for LRT alignment) Potential visual impacts to notable architectural resources within ¼ mile of alignment (Score 1 to 5) Assessment of expandability (Score 1 to 5) Expected level of impacts after mitigation to biological, social, and physical resources will be evaluated per CEQA/NEPA requirements (Score 1 to 5) Reductions in PM10, NOx, and SOx emissions ES-37 Final December 2008
38 Table S-8: Regional Connector Goals, Objectives, Evaluation Criteria and Performance Measures 5 Provide a Cost Effective Alternative Transportation System Develop a system that serves as an alternative to travel economically Reduce emissions and improve air quality Increase ridership on the Metro system Minimize cost per passenger Maximize travel time savings Number of Potential Sensitive Receptors within ¼ mile of alignment (Score 1 to 5) Potential impacts to historically significant locations within ¼ mile alignment (Score 1 to 5) Geologic and geotechnical issues along alignment (Score 1 to 5) Rough order of magnitude annual O&M (2008$) costs per alignment (millions) User cost - Cost effectiveness compared to No Build ($/hour of transit user benefit) Annual O&M costs Reduction in carbon footprint for average user Annualized cost per hour of transit system user benefit compared to No Build and Transportation System Management (TSM) alternatives 6 Achieve a Financially Feasible Project Develop a project that maximizes opportunities for funding and financing and that is financially sustainable 7 Provide a Safe and Secure Alternative Transportation System Develop a project that is safe for riders, pedestrians, and drivers while meeting the regions needs for security Opportunities for private/public funding Opportunities for Federal and outside funding Secure entire alignment, stations, track and other facilities Develop direct and indirect safety measures that exceed safety precautions typical of the Metro system Develop a system that balances the need for accessibility and mobility with security Develop a system that uses accessibility and mobility as measures for safety and security ROM Capital costs total and per mile per alignment (2008$) (millions) Evaluation of availability and eligibility of capital funds at federal/state/local levels to construct, operate and maintain (Score 1 to 5) Safety determined to be able to provide measures typical of requirements per ADA, per typical CPUC requirements, fire life safety guidelines, and per Metro Design Guidelines for access to and from stations (amount grade separated) (Score 1 to 5) Number of emergency facilities located within ¼ mile of thealignment, i.e., fire stations, police stations, hospitals. Number of public events within ¼ mile of alignment Capital cost estimate disaggregated by right of way (ROW), guideway, stations, yards, and vehicles on a cost per mile basis Number of crossing with high pedestrian activities on a daily basis Number of events along the alignment Number of potential issues related to accessibility and line of sight for pedestrians and vehicle drivers (Score 1 to 5) ES-38 Final December 2008

39 Figure S-19 Screened Alternatives ES-39 Final December 2008
40 Using the evaluation criteria developed to measure how well each alternative met the goals and objectives for the Regional Connector, the eight alternatives were compared to one another and a final two alternatives (Figure S-19), with one alternative maintaining a variation in one station location, were identified. The evaluation took into account level of urban fit, amount of the population served, community acceptability, jobs within a one-quarter mile radius, opportunities for transit-oriented design, number of connections to key activity centers, and other factors pertaining to potential transit benefits. The Initial Screening Report details the routes and configurations of the eight alternatives from which the final two were selected. S.7 Alternative Recommendations Two build alternatives (one with two options) are studied in this AA Report, along with a No Build Alternative and a Transportation System Management (TSM) Alternative, both of which are required by the Federal Transit Administration as part of the New Starts application. No Build The No Build Alternative would maintain existing transit service through the year No new infrastructure would be built, aside from projects currently under construction or identified in Metro s 2008 Long Range Transportation Plan. The rail infrastructure serving the PSA under this alternative is: The existing Metro Gold Line from Union Station to Pasadena, a 13.6-mile light rail transit line along the northeastern edge of the PSA. The Metro Gold Line Eastside Extension Phase 1 from Union Station to East Los Angeles, a six-mile LRT line scheduled for completion in late The existing Metro Blue Line from 7 th St./Metro Center Station to Long Beach, a 22-mile LRT line travelling south from the PSA. The Metro Expo Line Phase 1, an 8.5 mile LRT line scheduled to open in 2010, running from 7 th St./Metro Center Station to Washington and National Blvds. in Culver City. The existing Metro Red Line from Union Station to North Hollywood and the Metro Purple Line from Union Station to Wilshire/Western Station. Together these routes comprise a 17.4-mile underground HRT system that presently serves as the sole rail connection between Union Station and 7 th St./Metro Center Station. LRT trains are not able to operate on HRT tracks, so the Metro Red and Purple Lines are not suitable for carrying Metro Blue, Gold, or Expo Line trains. The 20-mile Metro Green Line runs from Norwalk in southeast Los Angeles County to Redondo Beach, primarily in the center median of the I-105 freeway. ES-40 Finale December 2008
41 TSM The TSM Alternative would include the provisions of the No Build Alternative and add two shuttle bus routes to simulate the proposed LRT link between 7 th St./Metro Center and Union Station, one along Grand Ave. and 1 st St., and one along Figueroa, Flower, 2 nd, and 3 rd Sts. The shuttle buses would use existing bus-only lanes, where available, and would be fitted with transit-priority signalization devices similar to those used on Metro Rapid. The following map, Figure S-20, shows the two routes. Stops would be located every few blocks so as to provide good coverage of the PSA. ES-41 Finale December 2008

42 Figure S-20 Transportation System Management Alternative ES-42 Final December 2008
43 Based on the analysis of the Regional Connector PSA during the initial screening process, there are two preferred build alternatives linking the Metro Gold Line on Alameda between 1 st and Commercial Sts. to the Metro Blue and Expo Lines terminus at 7 th St./Metro Center Station (Flower and 7 th Sts.): At-Grade Emphasis LRT Alternative The At-Grade Emphasis LRT Alternative would bridge the gap between the Metro Gold Line and the Metro Blue and Expo Lines using an a combination of at-grade and underground tracks along Temple, Main, Los Angeles, 2nd, and Flower Sts. The route is shown in Figure S- 21. ES-43 Final December 2008

44 Figure S-21 At-Grade Emphasis LRT Alternative Option A Option B ES-44 Final December 2008
45 The new tracks would branch off of the Metro Gold Line Eastside Extension at Temple and Alameda Sts. in a wye junction. At this location, a new vehicular underpass for through traffic on Alameda St. would be constructed to remove conflicts between trains and the high volumes of truck and automobile traffic frequently observed at this intersection. A new pedestrian bridge structure over the intersection would also reduce the conflicts between pedestrian and trains, and reduce delays for trains passing through the intersection. Looking Southeast at Temple and Alameda Before Looking Southeast at Temple and Alameda After ES-45 Final December 2008


46 The tracks would then continue west on Temple St. to Los Angeles St. Here, the tracks would split into a couplet on Main and Los Angeles Sts. in order to travel south to 2 nd St. Southbound trains would continue west on Temple St. to Main St., then turn south on Main St. to reach 2 nd St. Northbound trains from 2 nd and Main Sts. would go east on 2 nd St. and north on Los Angeles St. to rejoin the southbound tracks at Temple and Los Angeles Sts. Both the northbound and southbound tracks would have a new station along the couplet just north of 1 st St. Main St. at Temple, Looking South Before Main St. at Temple, Looking South - After ES-46 Final December 2008

47 Continuing west along 2 nd St. from Main St., there is an option to have a split-platform station in the vicinity of Broadway or Spring St. After crossing Hill St., the trains will enter the existing 2 nd St. tunnel and then veer southward into a new tunnel beneath Bunker Hill linking the 2 nd St tunnel with Flower St. 2 nd and Hill, Looking East - Before 2 nd and Broadway Looking East, After ES-47 Final December 2008

48 There would be an underground station in this tunnel to allow connections with Bunker Hill. Trains would then surface through the hillside on the northeast corner of 3 rd and Flower Sts. and cross the intersection at grade to travel southbound in the median of Flower St. Looking North on Flower Street at 3 rd Street Before Looking North on Flower Street at 3 rd Street After ES-48 Final December 2008


49 At this point, there are two options for the configuration on Flower St.: Option A: After crossing 3 rd St., trains would transition to underground tracks and continue south on Flower St. to a new underground station just south of 5 th St. From there, trains would proceed underground to 7 th St./Metro Center Station and arrive at the existing Metro Blue Line platform. Option B: After crossing 3 rd St., trains would arrive at an at-grade station in the median of Flower St., just south of 3 rd. From there trains would continue southward and transition to an underground alignment near 4 th St. Trains would then proceed south under Flower St. to 7 th St./Metro Center Station and arrive at the existing Metro Blue Line platform. 3 rd and Flower, Looking South - Before ES-49 Final December 2008
.")
50 3 rd and Flower, Looking South - After Underground Emphasis LRT The Underground Emphasis LRT Alternative would have a single at-grade crossing at the intersection of 1 st and Alameda Sts. The rest of the route would be underground, as shown on the following map (Figure S-22). ES-50 Final December 2008

51 Figure S-22 Underground Emphasis LRT Alternative ES-51 Final December 2008
52 The Underground Emphasis LRT Alternative would branch off from the Metro Gold Line Eastside Extension tracks in a wye junction in the intersection of 1 st and Alameda Sts., immediately south of the Little Tokyo/Arts District Station. Trains from East Los Angeles would approach the junction from the east along 1 st St, and trains from Pasadena would approach from the north along Alameda St., stopping first at the Little Tokyo/Arts District Station. Both lines would then cross the intersection to reach the southwest corner, where a new tunnel portal would bring the trains underground. At 1 st and Alameda, a new underpass would carry car and truck traffic along Alameda St. below the rail junction, and a new overhead pedestrian bridge structure would eliminate most conflicts between pedestrians and trains. Looking Southwest at 1 st and Alameda - After Once in the tunnel, trains would turn west under 2 nd St. to reach a new underground station to be located between Los Angeles St. and Broadway. ES-52 Final December 2008
53 2 nd and Los Angeles, Looking West - Before 2 nd and Los Angeles, Looking West - After ES-53 Final December 2008
54 Trains would then proceed west on 2 nd St. and turn southward beneath the 2 nd St. tunnel. A new station along this stretch of tunnel would provide access to Bunker Hill. After the leaving the station, the tunnel would run south underneath Flower St. to reach the next station, just north of 5 th St. Trains would then continue south to 7 th St./Metro Center Station and arrive on the existing Metro Blue Line platform. 5 th and Flower, Looking North - After S.8 Transportation Impacts & Benefits The PSA is currently served by three rail lines and 112 bus lines operated by 10 transit agencies. Service on many of these lines operates very frequently, with vehicles arriving as few as two minutes apart during peak hours. Region-wide commuter rail service (Metrolink) and nationwide passenger rail service (Amtrak) both serve Union Station, just two blocks northeast of the PSA. Two additional LRT extensions, the Metro Gold Line Eastside Extension to East Los Angeles and the Metro Expo Line to Culver City are presently under construction, and are expected to be operational by The area is also served by several radial freeways branching out toward other major regional destinations, and many of them carry express bus service during peak hours. Despite the area s dense transportation infrastructure, rapid growth in downtown Los Angeles is overwhelming many of the facilities, including transit transfer stations. Reducing the number of transfers needed to traverse the LRT system would alleviate some of the crowding, particularly at 7 th St./Metro Center and Union Station, where two separate portions of the LRT system terminate and many riders must transfer to the HRT Metro Red and Purple Lines to complete their trips. The Regional Connector would improve the link between these two stations and enable transfer- ES-54 Final December 2008
55 free service throughout much of the LRT network, most notably from Long Beach to Pasadena along the Metro Blue and Gold Lines, and from East Los Angeles to Culver City along the Metro Gold and Expo Lines. Alternatives Studied Because the purpose of the Regional Connector is to bridge a gap in the existing LRT system, LRT is the mode that survived the screening process and is under consideration for the build alternatives. Other modes such as HRT, monorail, commuter rail, people mover, etc. were eliminated due to their high cost and inability to allow single-vehicle service throughout the LRT network. The forecasted effects of the build alternatives (At-Grade Emphasis LRT and Underground Emphasis LRT) were compared with those of the No Build and TSM Alternatives to determine the amount of benefits the new LRT link might provide. Travel Time Savings The Regional Connector build alternatives would reduce travel times for many trips on the Metro Rail system whose current headways are shown in Table S-10. Downtown-bound passengers on the Metro Gold Line would no longer have to transfer to reach their destinations, and Metro Blue and Expo Line passengers could also reach the northern and eastern areas of the central business district without changing trains. Riders passing through downtown from East Los Angeles to Long Beach and Pasadena to Culver City would need to make one less transfer, and riders travelling from East Los Angeles to Culver City and Pasadena to Long Beach would have both of their presently required transfers eliminated. Under the current Pasadena-Long Beach and East Los Angeles-Culver City operating plan, passengers wishing to travel along the Gold Line from Pasadena to East Los Angeles would need to make one transfer at a new Regional Connector station in order to complete their trips. In the case of the Underground Emphasis LRT Alternative, this would be a cross-platform transfer at the new station on 2 nd St. For the At-Grade Emphasis LRT Alternative, the transfer would occur at City Hall, and passengers would need to walk one block from the southbound platform on Main St. to the northbound platform on Los Angeles St. Tables S-10 and S-11 show the potential time savings for passengers travelling along both of the proposed Regional Connector routes (East Los Angeles to Culver City and Pasadena to Long Beach). These estimates include current travel times along existing lines as well as predicted travel times along the lines that are presently under construction. The No Build estimates reflect a transfer from the Metro Gold Line to the Metro Red and Purple Lines at Union Station, which could take from five to 12 minutes at most times of day; the five-minute ride from Union Station to 7 th St./Metro Center Station on the Metro Red and Purple Lines; and the transfer from the Metro Red and Purple Lines to the Metro Blue Line at 7 th St./Metro Center Station, which could take anywhere from two to twelve minutes. In some cases, the best case scenario for the No Build Alternative is the same as the predicted travel time along some of the build alternatives. However, it should be noted that the rush hour headways are different on every Metro Rail line serving downtown, as shown in Table S-9, and the best case scenario under the No Build alternative happens only by chance. Most trips take longer. ES-55 Final December 2008
56 Table S-9 Current Peak Hour Headways on Downtown Metro Rail Lines Metro Rail Line Metro Gold Line Metro Red and Purple Lines Metro Blue Line Headway 8 minutes 10 minutes each, 5 minutes combined 5 ½ minutes Table S-10 East Los Angeles to Culver City (in minutes) No Build At-Grade Option A At-Grade Option B Underground Pomona/Atlantic to Pico/Aliso Pico/Aliso to 7th St./Metro Center 7th St./Metro Center to Washington/National to 32* Total 58 to *via Metro Red and Purple Lines Table S-11 Pasadena to Long Beach (in minutes) No Build At-Grade Option A At-Grade Option B Underground Sierra Madre Villa to Union Station Union Station to 7th St./Metro Center 7th St./Metro Center to Transit Mall to 29* Total 96 to *via Metro Red and Purple Lines ES-56 Final December 2008
57 Ridership Model runs predicted the highest overall transit ridership, an increase of 0.7 percent over current levels (about 10,000 new transit trips), for the Underground Emphasis LRT Alternative. This is probably because it bridges the missing link in the LRT system, minimizes transfers, and provides a shorter trip time than the other build alternative. These improvements will increase the attractiveness of the system to people who do not currently ride transit. The rise in the number of rail linked trips is partially offset, however, by a small drop in the number of bus passengers. This indicates that many of the riders attracted to the rail system by the new link will be existing transit riders lured away from buses. However, the increase in rail riders is more than double than the decrease in bus riders, so the majority of the new rail passengers will be new transit users. Underground-running tracks will eliminate conflicts with surface traffic and allow for faster train speeds The At-Grade Emphasis LRT alternative would achieve the same results, but to a slightly lesser extent. Trains would traverse the Regional Connector more slowly because they will need to safely navigate street-running alignments and potentially stop for red lights at intersections. The increase in overall transit ridership would be 0.5 percent, or about 8,000 linked trips. ES-57 Final December 2008
58 Trains running at-grade will have to traverse some parts of the At-Grade Emphasis LRT Alternative alignment slowly to navigate 90-degree turns and avoid conflicts with automobiles and pedestrians. The TSM Alternative would cause overall transit ridership to increase by about 1,000 trips, and cause an additional 1,000 riders to switch from rail to buses. This is likely because the new shuttle buses would provide a convenient new alternative to the Metro Red and Purple Lines for trips entirely within the downtown area, though they would not reduce the number of transfers needed to complete trips into or through downtown. The No Build Alternative provided the smallest increase in transit ridership over current levels, since it includes the fewest service improvements. Rail ridership is actually slightly higher under the No Build Alternative than under TSM, because there is no competition for riders from the TSM shuttle bus service. Table S-12 outlines the potential ridership benefits for each alternative in terms of total linked trips systemwide in the year Table S-12 Linked Transit Trip Estimates by Mode No Build TSM At-Grade Option A At-Grade Option B Underground Bus Linked Trips 1,191,300 1,193,000 1,187,100 1,186,600 1,185,800 Metro Rail Linked Trips 248, , , , ,200 Metrolink Linked Trips 76,300 76,400 75,900 75,900 76,000 Total 1,515,800 1,516,800 1,523,400 1,524,200 1,526,000 Increment Over No Build 0 1,000 7,600 8,400 10,200 ES-58 Final December 2008
59 Roadway Analysis The traffic impacts of each alternative were compared using volume-to-capacity (V/C) ratio forecasts to identify the predicted amount of congestion. Level of service (LOS) was used to assign degrees of driver comfort to ranges of V/C ratios, with LOS A indicating free-flowing traffic, and LOS F indicating severe congestion. As of 2007, the entire PSA road network was operating at LOS D (acceptable for urban conditions) or better, except the intersection of 1 st and Alameda Sts. (LOS F) and three roadway segments along 2 nd and Alameda Sts. (LOS E). Under predicted year 2030 No Build conditions, five additional LOS E and LOS F intersections and nine additional LOS E/F roadway segments were identified. The traffic impacts of the No Build, TSM, and Underground Emphasis LRT Alternatives were found to be minimal and essentially equal, due to their lack of street-running tracks or changes to the road network (Table S-13). The At-Grade Emphasis LRT Alternative, on the other hand, would convert traffic lanes, including bus only lanes, along Flower, 2 nd, Main, Los Angeles, and Temple Sts. to rail rights-of-way, thus reducing the road capacity for automobiles and buses. Numerous turning restrictions would also force additional around-the-block movements and limit access to some parcels. As such, the traffic modeling revealed that roadway congestion in the PSA would increase as a result of the At- Grade Emphasis LRT Alternative (Table S-14). There would be four additional LOS E/F intersections and two additional LOS E/F roadway segments beyond year 2030 No Build conditions. As a result, this alternative is the least preferable from the standpoint of roadway traffic congestion, and the other alternatives are all equally favorable. The following tables show the performance of some roadway segments in the PSA under each of the alternatives. Table S-15 summarizes the LOS in various intersections in the PSA. The highest number of LOS E and F intersections for both Option A and B of the At Grade Emphasis LRT. Table S-13 Future (2030) Roadway Segment Average Daily Traffic (ADT) Analysis No Build, TSM and Underground Emphasis LRT Alternatives Primary Street Cross Street Facility Type Flower St. 2 nd St. Los Angeles St. Main St. Number of lanes Capacity ADT V/C Ratio 3 rd St. Secondary 4 28,000 15, A 5 th St. Secondary 6 45,000 27, B 6 th St. Secondary 4 30,000 23, C Wilshire Bl. Secondary 4 30,000 26, D 7 th St. Secondary 4 30,000 26, D Alameda St. Secondary 3 21,000 10, A Central Ave. Secondary 2 14,000 13, E Los Angeles St. Secondary 3 21,000 20, E Main St. Secondary 3 21,000 24, F San Pedro St. Secondary 2 14,000 16, F Spring St. Secondary 4 28,000 18, B 1 st St. Secondary 4 28,000 23, D 2 nd St. Secondary 4 28,000 21, C Temple St. Secondary 5 35,000 27, C 1 st St. 1-Way Major Class II 3 25,500 15, A 2 nd St. 1-Way Major Class II 3 25,500 17, B Temple St. Major Class II 4 34,000 32, E LOS ES-59 Final December 2008
60 Table S-13 Future (2030) Roadway Segment Average Daily Traffic (ADT) Analysis No Build, TSM and Underground Emphasis LRT Alternatives Primary Street Cross Street Facility Type Temple St. 1 st St. 3 rd St. Alameda St. Number of lanes Capacity ADT V/C Ratio Judge John Aiso St. Major Class II 4 32,000 21, B Los Angeles St. Major Class II 4 32,000 21, B Main St. Major Class II 4 32,000 21, B Alameda St. Secondary 4 28,000 27, E Central Ave. Secondary 4 28,000 29, F Los Angeles St. Secondary 6 42,000 27, B Main St. Secondary 6 42,000 30, C Spring St. Secondary 6 42,000 25, B Flower St. Secondary 4 30,000 24, D Spring St. Secondary 3 22,500 22, E Los Angeles St. Secondary 3 22,500 22, F Main St. Secondary 3 22,500 20, E 1 st St. Major Class II 4 32,000 42, F 2 nd St. Major Class II 4 32,000 38, F LOS Primary Street Flower St. 2 nd St. Los Angeles St. Table S-14: Future (2030) Roadway Segment Average Daily Traffic (ADT) Analysis At-Grade Emphasis LRT Alternative Cross Street Facility Type Number of Lanes Capacity ADT V/C Ratio LOS 3 rd St. Secondary 3 21,000 15, C 5 th St. Secondary 6 45,000 27, B 6 th St. Secondary 4 30,000 23, C Wilshire Bl. Secondary 4 30,000 26, D 7 th St. Secondary 4 30,000 26, D Alameda St. Secondary 3 21,000 10, A Central Ave. Secondary 2 14,000 13, E Los Angeles St. Secondary 1 7,000 4, A Main St. Secondary 1 7,000 4, C San Pedro St. Secondary 2 14,000 16, F Spring St. Secondary 1 7,000 3, A 1 st St. Secondary 3 21,000 23, F 2 nd St. Secondary 4 28,000 21, C ES-60 Final December 2008
61 Table S-14: Future (2030) Roadway Segment Average Daily Traffic (ADT) Analysis At-Grade Emphasis LRT Alternative Primary Street Cross Street Number of Lanes Capacity ADT V/C Ratio LOS Temple St. Secondary 4 28,000 27, D Main St. 1 st St. 1-Way Major Class II 3 25,500 15, A 2 nd St. 1-Way Major Class II 3 25,500 17, B Temple St. Major Class II 3 25,500 32, F Temple St. Judge John Aiso St. Major Class II 2 16,000 21, F Los Angeles St. Major Class II 2 16,000 21, F Main St. Major Class II 3 24,000 21, D 1 st St. Alameda St. Secondary 4 28,000 27, E Central Ave. Secondary 4 28,000 29, F Los Angeles St. Secondary 6 42,000 35, D Main St. Secondary 6 42,000 39, E Spring St. Secondary 6 42,000 32, C 3 rd St. Flower St. Secondary 4 30,000 24, D Spring St. Secondary 3 22,500 29, F Los Angeles St. Secondary 3 22,500 30, F Main St. Secondary 3 22,500 30, F Alameda St. 1 st St. Major Class II 4 32,000 42, F 2 nd St. Major Class II 4 32,000 38, F Additionally, Table S-15 also outlines how LOS at each intersection would vary with each alternative. Table S-15: Future (2030) Intersection Level of Service PM Peak Hour Intersection No Build TSM Option A Option B Underground V/C LOS V/C LOS V/C LOS V/C LOS V/C LOS Hill St. / 1 st St E 0.91 E 0.91 E 0.91 E 0.91 E Broadway / 1 st St B 0.70 B 0.78 C 0.78 C 0.70 B Spring St. / 1 st St A 0.56 A 0.62 B 0.62 B 0.56 A Main St. / 1 st St B 0.67 B 0.91 E 0.91 E 0.67 B Los Angeles St. / 1 st St C 0.71 C 0.88 D 0.88 D 0.71 C Judge John Aiso St. / 1 st St D 0.85 D 1.06 F 1.06 F 0.85 D Alameda St. / 1 st St F 1.10 F 1.10 F 1.10 F 0.87 D Broadway / 2 nd St A 0.57 A 0.54 A 0.54 A 0.57 A Spring St. / 2 nd St A 0.49 A 0.44 A 0.44 A 0.49 A Main St. / 2 nd St C 0.77 C 0.85 D 0.85 D 0.77 C Los Angeles St. / 2 nd St C 0.73 C 0.82 D 0.82 D 0.73 C San Pedro St. / 2 nd St C 0.75 C 0.59 A 0.59 A 0.75 C Central Ave. / 2 nd St B 0.67 B 0.67 B 0.67 B 0.67 B Alameda St. / 2 nd St D 0.89 D 0.89 D 0.89 D 0.89 D Broadway / 3 rd St C 0.74 C 0.92 E 0.92 E 0.74 C Spring St. / 3 rd St B 0.67 B 0.82 D 0.82 D 0.67 B ES-61 Final December 2008

62 Intersection Table S-15: Future (2030) Intersection Level of Service PM Peak Hour No Build TSM Option A Option B Underground V/C LOS V/C LOS V/C LOS V/C LOS V/C LOS Main St. / 3 rd St D 0.90 D 1.04 F 1.04 F 0.90 D Los Angeles St. / 3 rd St B 0.70 B 0.74 C 0.74 C 0.70 B San Pedro St. / 3 rd St A 0.54 A 0.62 B 0.62 B 0.54 A Central Ave. / 3 rd St A 0.51 A 0.51 A 0.51 A 0.51 A Alameda St. / 3 rd St B 0.70 B 0.70 B 0.70 B 0.70 B Figueroa St. / 3 rd St F 1.22 F 1.22 F 1.22 F 1.22 F Hope St. / Temple St E 0.96 E 0.96 E 0.96 E 0.96 E Grand Ave. / Temple St D 0.87 D 0.87 D 0.87 D 0.87 D Broadway / Temple St E 0.92 E 0.92 E 0.92 E 0.92 E Spring St. / Temple St A 0.51 A 0.51 A 0.51 A 0.51 A Main St. / Temple St D 0.85 D 1.00 E 1.00 E 0.85 D Los Angeles St. / Temple St C 0.77 C 1.34 F 1.34 F 0.77 C Judge John Aiso St. / Temple St B 0.61 B 0.93 E 0.93 E 0.61 B Alameda St. / Temple St C 0.80 C 1.04 F 1.04 F 0.80 C LOS E Intersections LOS F Intersections Parking Evaluation The number of curb parking spaces that would need to be removed was calculated for both of the build alternatives. Neither the No Build nor the TSM Alternatives would result in the loss of curb parking spaces. The Underground Emphasis LRT Alternative would require the removal of 20 curb parking spaces on the east side of Alameda St. near 1 st St. in order to accommodate the new underpass structure. The At-Grade Emphasis LRT Alternative would displace a total of 88 parking spaces. Mitigation measures, such as new off-street parking facilities, may be needed to offset the impact of removing these curb spaces. Summary The No Build Alternative would result in the smallest increase in transit ridership over current volumes, and would not address the missing link in the LRT system. However, it would have no negative parking or roadway circulation impacts. The TSM Alternative would result in a small increase in transit ridership, as well as a redistribution of a small number of passengers from rail to buses. It would augment transit service between both ends of the missing link in the LRT system, but would not eliminate any transfers. Like the No Build alternative, it would have no negative parking or roadway circulation ES-62 Final December 2008
63 impacts. The Underground Emphasis LRT Alternative would attract the greatest volume of new riders to the transit system of the alternatives considered, and it would bridge the missing link in the LRT system and allow new, transfer-free service from Long Beach to Pasadena and from East Los Angeles to Culver City. It would have no negative impacts on roadway congestion, but would result in the loss of 20 curb parking spaces. The At-Grade Emphasis LRT Alternative would attract fewer riders than the Underground Emphasis LRT Alternative because it would operate at lower speeds along the new tracks. It would still bridge the missing link in the LRT system and allow the same transfer-free service between the Metro Blue, Gold, and Expo Lines, but the overall trip times would be longer. The removal of traffic lanes for rail use would increase congestion to severe levels at several locations within the PSA, and would result in the loss of 44 curb parking spaces. S.9 Environmental Impacts & Benefits The challenge of defining a major piece of public transit infrastructure within the urban core of downtown Los Angeles where rail rights of way do not exist is making the project fit while not compromising service or the quality of life for the area. The 1.8 mile gap between the operating lines includes major civic, entertainment, historic and cultural districts within a dense, everchanging, high rise environment. This section summarizes the environmental considerations of the recommended build alternatives. The recommended alternatives will undergo further scoping, analysis and development leading to circulation of a Draft Environmental Impact Statement/Draft Environmental Impact Report per NEPA and CEQA in the next phase of this project per authorization by Metro s Board of Directors. Land Use and Economic Development The at-grade and underground alternatives follow similar routes through downtown and never stray more than two blocks from each other. The At-Grade Emphasis LRT Alternative could create some additional traffic congestion in the area by removing automobile lanes on 2 nd, Main, Temple, and Los Angeles Sts., thus making access to the surrounding businesses by car more difficult. The tracks may also be difficult for pedestrians to traverse, making the area unattractive for walking, especially if existing mid-block crosswalks are removed. However, this impact would be offset by the generation of increased pedestrian trips near the stations. The Underground Emphasis LRT Alternative would have fewer negative impacts on the existing land-use patterns than the At-Grade Emphasis LRT Alternative because it would not involve removing any existing automobile rights-of-way for rail use. The Underground Emphasis LRT Alternative may also attract more transit trips and business patrons to the area than the At-Grade Emphasis LRT Alternative due to the shorter trip times typically associated with fully grade separated rail. ES-63 Final December 2008
64 Displacement and Relocation of Existing Uses The At-Grade Emphasis LRT Alternative may require reduction of sidewalk widths, and partial or full right-of-way acquisitions at Flower and 3 rd Sts. (Option A) or Flower and 5 th Sts. (Option B) where the tracks rise to street level. On Main and Los Angeles Sts., a 5-foot wide strip of land from the existing sidewalk or full or partial right-of-way acquisitions will be needed for station construction. Loss of right-of-way and curb parking is likely along 2 nd, Main, Los Angeles, and Temple Sts. The Underground Emphasis LRT Alternative would require fewer acquisitions, but would necessitate purchasing the entire block bounded by Central Avenue, Alameda Street, 1st Street, and 2nd Street, which is currently occupied entirely by retail and restaurant businesses. Though no residential units are located in this block, the acquisition could still impact local residents due to the loss of some commercial services. No other displacement or loss of curb parking is anticipated. Community and Neighborhood Impacts Construction impacts would be temporary, but significant for both of the build alternatives. Noise, vibration, dust, and increased construction vehicle traffic would be necessary during business hours, and road and sidewalk closures could be in effect for months at a time. Both alternatives will have a pedestrian overpass on Alameda St., which will change the appearance of the streetscape. The At-Grade Emphasis LRT Alternative will significantly alter the character of 2 nd, Temple. Main, Los Angeles, and Flower Sts. 25-foot tall catenary poles would be erected above the street to supply electricity to the trains, and high-platform stations with canopies would be constructed in the roadway medians or along the curb lanes. The street-running tracks could also present new obstructions to pedestrians wishing to cross. Also, the permanent removal of automobile traffic lanes to install tracks and stations may slow both car and bus trips. The removal of left-turn lanes and curb parking spaces would make navigating the area by car more difficult. Metro Rail currently operates from 4 a.m. to 1 a.m. daily, and trains and stations will generate noise in the form of bells, horns, public address announcements, and rail squealing during these times. The Underground Emphasis LRT Alternative has few surface impacts aside from the placement of station entrances along existing sidewalks. The operation noises may still be heard where the tracks surface at 1 st and Alameda Sts., as well as in the vicinity of tunnel ventilation shafts. Noise emanating from the ventilation shafts would be quieter at street level than noise generated along at-grade tracks. ES-64 Final December 2008
65 At-grade stations allow pedestrians to move been the sidewalk and the platform quickly without having to navigate stairwells and concourses. Visual and Aesthetic Impacts Both alignments will pass within one-quarter mile of over 200 notable architectural resources. The substantial roadway modifications needed during construction will result in potential visual disruption, though the finished infrastructure will be consistent in character with the existing urban landscape. Both alignments will include a pedestrian overpass at Alameda Street, which will impose visual impacts both during and after construction. Platforms, signage, tracks, and overhead wires would be added along PSA streets and sidewalks for the At-Grade Emphasis LRT Alternative, and the wires at some intersections may be numerous enough to produce an overhead web-like effect. The Underground Emphasis LRT Alternative would add station portals to the PSA, and these would change the appearance of the parcels on which they are located. They would not be tall enough, however, to block views of the surrounding architectural resources. Aside from the portal area at Alameda St., there would be no other visual or aesthetic impacts associated with the Underground Emphasis LRT Alternative. Further study is needed to determine whether the proposed portals would block views of existing public art installations. Though the At-Grade Emphasis LRT Alternative imposes more long-term visual impacts, the Underground Emphasis LRT Alternative would present greater impacts during the construction phase because tunneling takes longer and involves more machinery than installing at-grade tracks. ES-65 Final December 2008
66 Air Quality Impacts Construction-related emissions are expected to be higher for the Underground Emphasis LRT Alternative because it involves significantly more work over a longer period of time than the At- Grade Emphasis LRT Alternative. Changes in intersection configuration, especially under the At- Grade Emphasis LRT Alternative, could cause localized congestion and CO emissions increases. However, on a regional scale, both alternatives would yield fewer vehicle miles traveled (VMT) than the No Build Alternative, and would thus prove beneficial to the region s air quality. Noise and Vibration LRT vehicles on both alternatives would generate noise in the form of rail squealing, brakes, propulsion systems, horns, bells, and station platform announcements. The At-Grade Emphasis LRT Alternative may also include crossing bells at street level, and the Underground Emphasis LRT Alternative would have mechanical HVAC systems that could also generate additional noise. The Underground Emphasis LRT Alternative would generate more noise and vibration at track level due to the higher train speeds associated with grade-separated operation, but the amount escaping to the street through the ventilation structures would be minimal and would likely be drowned out by the already-high ambient noise levels in the downtown area. Overall, the At-Grade Emphasis LRT Alternative presents more potential for noise impacts than the Underground Emphasis LRT Alternative, though the magnitude would be similar to bus operations and can be mitigated through careful design and maintenance. Ecosystems/Biological Resources There are no protected wildlife areas or waterways within one-quarter mile of the build alternatives. There are also very few locations for vegetation and wildlife to exist in the dense downtown area. As such, the ecosystem impacts of the build alternatives would be minimal. Nesting sites for birds could be affected if construction requires the removal of street trees. Geotechnical: Subsurface and Hazardous Materials There are over 500 hazardous materials regulatory database listings located within the PSA, though some sites are listed on multiple databases. There is significant potential for subsurface hazardous materials to be found in the PSA due to the area s long history of commercial and industrial use. The At-Grade Emphasis LRT Alternative would be less likely to encounter these materials than the Underground Emphasis LRT Alternative due to the relatively little tunneling required. Water Resources Both build alternatives present relatively low potential for water resources impacts, since the project is not located within one-quarter mile of any major water bodies or flood zones, the downtown area already has very few pervious surfaces, and runoff is monitored and treated before discharge. The Underground Emphasis LRT Alternative is more likely to encounter groundwater during construction because it involves extensive tunneling. Also, the tunneling could open a new pathway for contaminated groundwater to spread quickly. Any dewatering that is needed during construction would be conducted in a manner that does not impact water quality or runoff volumes. ES-66 Final December 2008


67 Energy Both build alternatives would be powered by an overhead catenary system, and the trains energy requirements would be similar. The Underground Emphasis LRT Alternative s stations would present greater energy needs than the at-grade stations because of the extra lighting, HVAC systems, elevators, and escalators. It would also consume more energy resources during construction due to the complexity of the additional tunneling. Whichever alternative yields the highest volume of new transit riders would impart the greatest reduction in vehicle miles traveled and regional fuel consumption. Historic, Archaeological & Paleontological Resources There are hundreds of known historic resources located within one-quarter mile of each build alternative. Because the routes are located close to each other, the lists are largely the same. There are 21 known archeological resources within one-quarter mile of the At-Grade Emphasis LRT Alternative, versus 11 near the Underground Emphasis LRT Alternative. However, construction of the Underground Emphasis LRT Alternative s tunnels is more likely to disturb these known sites as well as unknown sites that may be uncovered. The increased tunneling involved with the Underground Emphasis LRT Alternative also makes it more likely to damage surrounding historic buildings during construction, and the damage may not be detected until years later. The stations and catenary poles needed for the at-grade alignment could alter the character of any historic districts in which they are located, and potentially alter nearby historic buildings if the wires need to be anchored to their exterior walls. Either construction project would need to be conducted in consultation with a qualified architectural historian and archeologist. Los Angeles historic City Hall, as seen from the corner of Main and Temple Streets, adjacent to the alignment of the At-Grade Emphasis LRT Alternative ES-67 Final December 2008

68 Parklands and Other Community Facilities Public transit service generally enhances access to nearby parklands and community facilities. However, the construction of new light rail infrastructure could impede access to facilities located adjacent to the rights-of-way. The list of nearby community facilities and parklands are similar for both build alternatives, and both call for a potential station portal in the vicinity of the Central Library park space. The At-Grade Emphasis LRT Alternative would require restricted vehicle and pedestrian access at certain points along the alignment, which could impede trips to and from community facilities. The grade crossings could also delay emergency vehicles, which may have to wait for trains to pass. The At-Grade Emphasis LRT Alternative also calls for the removal of curb parking spaces, thus reducing ease of access to community facilities for people arriving by car. The Underground Emphasis LRT Alternative would have fewer impacts on access to community facilities via the road network and circulation of emergency vehicles, though the need for more station entrance portals could necessitate placing them in existing park areas. Park space outside of Central Library ES-68 Final December 2008
69 Economic & Fiscal Impacts Construction will be temporarily disruptive to economic activity in the PSA, though its effects will be tempered by the creation of temporary construction jobs. These effects are expected to be more pronounced for the At-Grade Emphasis LRT Alternative Couplet A option than for Couplet B or the Underground Emphasis LRT Alternative. For both alternatives, construction could restrict access to nearby businesses and parking facilities, resulting in fewer customers choosing to visit the area. However, many of the businesses in the Civic Center perform government functions, and do not rely on customers being able to reach their offices. Both build alternatives will require tunneling, and the method used will determine the extent of the surface street closures and associated access restrictions. The Underground Emphasis LRT Alternative will involve more tunneling and the lane closures will be temporary, whereas the At- Grade Emphasis LRT Alternative calls for permanent removal of curb parking and traffic lanes. The Underground Emphasis LRT Alternative will also require more property acquisitions than the At-Grade Emphasis LRT Alternative, and the loss of tax revenue will be higher. However, the loss of tax revenue associated with both alternatives would be of similar magnitude, and is insignificant when compared to the overall tax revenue generated in the PSA. Over time, the new transit service will cause economic activity in the area to increase, and this is expected to be most noticeable for the At-Grade Emphasis LRT Alternative Couplet A option. Safety and Security Pedestrian and vehicular traffic volumes are high in the PSA, and there are significant safety concerns associated with adding light rail trains to the area. The At-Grade Emphasis LRT Alternative is particularly susceptible to pedestrian and automobile safety issues due to the open arrangement of the trackway and stations. Pedestrians could easily walk along the tracks and risk being struck by trains. Also, because trains would cross intersections and crosswalks without crossing arms, there would be no physical barriers to keep the trains from colliding with pedestrians or automobiles. Motorist error could cause an automobile to accidentally swerve into the rail right-of-way and collide with a train. The risk of collision increases with the number of pedestrians, trains, automobiles, and train passengers in the area. Pedestrians may also risk being struck by automobiles when using crosswalks to access stations located in roadway medians. Signal phase timing could be adjusted and additional warning devices could be placed at grade crossings to mitigate the safety hazards. The Underground Emphasis LRT Alternative presents no pedestrian or motorist safety hazards because the tracks would be located underground for nearly the entire length of the alignment and there would be no grade crossings. Pedestrians might still be injured or struck by a train if the platforms become too crowded or if they are not adequately cautious when trains enter the stations. The stations and tracks along the Underground Emphasis LRT Alternative are concealed from view, and it would be difficult for passersby and local law enforcement officers to notice potential security problems. Underground stations and tracks may also create venues for crime, trespassing, and refuge from the elements for non-domiciled persons. One security benefit, however, is that the Underground Emphasis LRT Alternative would not encounter service delays during demonstrations, civil unrest, and public events taking place on the surface. ES-69 Final December 2008
70 Potential for conflicts between trains, automobiles, and pedestrians will exist at grade Construction Impacts Intensive construction activity would be needed for both build alternatives. The heaviest construction activities, including tunneling, trenching, sidewalk construction, and roadway refinishing would last for two to three years. Both projects involve tunneling and the installation of at-grade tracks, and construction staging areas will need to be established. During construction, traffic and emergency vehicle circulation could be impeded, and vibration, noise, dust, and localized short-term air pollution could occur. These effects would be felt over a longer period of time for the Underground Emphasis LRT Alternative, since the construction effort would be more complex. Growth-Inducing Impacts New transit service does not typically cause growth. It may, however, redistribute the locations of new growth within a region or cause the growth to be more transit-oriented. Downtown Los Angeles already operates as a transit-oriented area and is well-served by the existing transit system, so the Regional Connector is unlikely to spur additional growth in the area. However, the addition of more transit stations to the PSA would help nearby development projects attain their goals of having as many patrons as possible arrive by transit. Since the growth-inducing impacts of the Regional Connector would be minimal, there are no significant differences between the effects of the Underground and At-Grade Emphasis LRT Alternative. ES-70 Final December 2008
71 Environmental Justice The demographic characteristics of the areas within one-quarter mile of the two build alternatives are similar, since the two potential routes are located very close together. Year 2000 census data for both alignments reveals that about 80% of the population belongs to a minority group, the median annual household income is approximately $15,000-$19,000, 35% live below the poverty threshold, and about 24% are unemployed. The PSA is home to over two dozen homeless shelters and single room occupancy hotels. The large numbers of low-income residents are likely to be benefited by improved transit service, as this group typically demonstrates the highest degree of transit dependency. In accordance with federal regulations, several community meetings have been held within the PSA to invite public participation and receive comments about the project. During the public input process, issues of transit service equity, disproportionate impacts borne by low-income or minority communities, health impacts, social and economic impacts, neighborhood impacts, noise, vibration, displacement, and construction impacts were considered. One major difference between the two build alternatives is that the At-Grade Emphasis LRT Alternative would bypass the Little Tokyo neighborhood and add a significant amount of new street-running tracks to the Civic Center area. The Underground Emphasis LRT Alternative would travel through Little Tokyo and the Civic Center beneath 2 nd St. and transition to at-grade tracks in the block southwest of 1 st and Alameda Sts. Major Utilities Both build alternatives will involve tunneling under Flower St., where there are large storm drain and gravity lines spanning the entire route from 3rd Street extending south of 7 th St. The deepest of these lines is 15 feet below grade. The location of these large utility lines will make cut-andcover tunneling difficult. The Underground Emphasis LRT Alternative will face more conflicts with utilities than the At-Grade Emphasis LRT Alternative, especially in the vicinity of stations. Utilities on 2 nd St. extend as far at 16 feet underground, and will need to be relocated or bypassed using tunnel boring machines. S.10 Financial Analysis The At-Grade Emphasis LRT Alternative and the Underground Emphasis LRT Alternative are approximately the same length (1.8 miles). The capital costs are estimated to be $795.7 million in year 2008 dollars for the At-Grade Emphasis LRT Option A, $709.3 million for Option B and $910.4 million for the Underground Emphasis LRT Alternative. The shuttle bus TSM Alternative would cost $62.7 million (Table S-16). ES-71 Final December 2008
72 Table S-16 Capital Costs of Each Alternative (in millions of dollars) Alternative 2008 Dollars No Build $0.00 TSM $62.74 At-Grade Emphasis LRT Alternative Option A $ At-Grade Emphasis LRT Alternative Option B $ Underground Emphasis LRT Alternative $ For all of the build alternatives, about 62 percent of the capital costs will go toward construction. Two to seven percent would pay for new light rail vehicles, about 21 percent would pay for professional services, and nine percent would be reserved for unallocated contingencies. The potential funding sources assume 50 percent local funding through transportation sales taxes, benefit assessment districts, and Mello-Roos community facilities districts. Potentially, local congestion pricing revenues and transportation impact mitigation fees may also be used. The strategies also call for at least 50 percent federal funding through the New Starts program, and in the case of the TSM Alternatives, the Section 5309 Bus Discretionary Program. Federal Congestion Management and Air Quality Program (CMAQ) funds could potentially be used to finance the Regional Connector, as the project will be capable of reducing congestion and thereby improving air quality. On the state level, a potential source of funding is the California High- Speed Rail Project, which will offer money to connect existing regional rail services to the new project should it be constructed. S.11 Issues to be Resolved Upon Metro Board Authorization, environmental analysis and continued engineering will support continued identification and resolution of project challenges. The following lists current identified issues and the need for further study for both of the alternatives. Metro will continue to review the safety and security considerations essential to making the Regional Connector a reliable, safe and secure system for pedestrians, riders, autos and bicyclists. Traffic conditions for the At-Grade Emphasis LRT will continue to be evaluated during the environmental process in close collaboration with LADOT. The use of the 2 nd St. tunnel and 2 nd St. from Hill to Los Angeles St. for the couplet element will transform 2 nd St. to a transit mall. This will mean less autos but not necessarily less people using 2 nd St. Street parking will be removed in this location. An additional station on 2 nd St. will be analyzed for potential benefits. ES-72 Final December 2008

73 Construction methods will continue to be evaluated for safety, expediency and impacts to the environment. Station entrance locations will be evaluated on how well certain locations perform when evaluated based on attracting riders, visibility, close proximity to activity centers, least impacting to property. Station construction and construction staging will be defined more during the environmental process. Property impacts will be identified. 2 nd and San Pedro Streets, looking west - Before ES-73 Final December 2008

74 2 nd and San Pedro Streets, looking west After (Underground Emphasis LRT Alternative) S.12 Conclusion Metro has completed this AA Study in a collaborative effort with the community to determine the need and benefit of linking three rail lines serving the region, to identify alternatives and evaluate which alternatives achieve certain goals and criteria, and to provide the Metro Board of Directors the information need to make a selection of alternatives to be further engineered and analyzed in a Draft Environmental Impact Statement/Draft Environmental Impact Report per the National Environmental Policy Act and the California Environmental Quality Act. The engineering and environmental analysis for Board selected alternatives will also be used to prepare documents and submission consistent with the requirements of project pursuing FTA New Starts funding including the request for authorization from the FTA to initiate preliminary engineering. The following Table S-17 provides a quick glance summary for the screened and potential alternatives which have are a result of the AA analysis. ES-74 Final December 2008
Executive Summary. Draft Environmental Impact Statement/Environmental Impact Report ES-1
 Executive Summary Introduction The Eastside Transit Corridor Phase 2 Project is a vital public transit infrastructure investment that would provide a transit connection to the existing Metro Gold Line
Restoration of Historic Streetcar Services in Downtown Los Angeles
 Restoration of Historic Streetcar Services in Downtown Los Angeles Alternatives Analysis Community Update Meeting August 2, 2011 Introduction Key players Local lead agency: Metro Federal lead agency: Federal
Pacific Electric Right-of-Way / West Santa Ana Branch Corridor Alternatives Analysis
 Pacific Electric Right-of-Way / West Santa Ana Branch Corridor Alternatives Analysis Transit Coalition September 26, 2012 2 Study Area Pacific Electric Rightof-Way/West Santa Ana Branch (PEROW/ WSAB) extends
Restoration of Historic Streetcar Services in Downtown Los Angeles
 Restoration of Historic Streetcar Services in Downtown Los Angeles Early Scoping Meeting for Alternatives Analysis (AA) May 17, 2011 Introduction Key players Local lead agency: Metro Federal lead agency:
Project Scoping Report Appendix B Project Web Site. APPENDIX B Project Web Site
 Project Scoping Report Appendix B Project Web Site APPENDIX B Project Web Site WESTSIDE EXTENSION TRANSIT CORRIDOR STUDY February 4, 2008 News and Info of 1 http://metro.net/projects_programs/westside/news_info.htm#topofpage
Preliminary Definition of Alternatives. 3.0 Preliminary Definition of Alternatives
 3.0 What preliminary alternatives are being evaluated? The alternatives for the East San Fernando Valley Transit Corridor project that were considered for screening include the No Build Alternative, Transportation
Crenshaw-Prairie Transit Corridor Study Public Meetings
 Crenshaw-Prairie Transit Corridor Study Public Meetings Darby Park: Wednesday, February 20, 2008 6:30 8:00 PM US Bank Community Room: Thursday, February 21, 2008 6:30 8:00 PM Nate Holden Performing Arts
4.0 TIER 2 ALTERNATIVES
 4.0 TIER 2 ALTERNATIVES The Tier 2 Alternatives represent the highest performing Tier 1 Alternatives. The purpose of the Tier 2 Screening was to identify the LPA utilizing a more robust list of evaluation
5. OPPORTUNITIES AND NEXT STEPS
 5. OPPORTUNITIES AND NEXT STEPS When the METRO Green Line LRT begins operating in mid-2014, a strong emphasis will be placed on providing frequent connecting bus service with Green Line trains. Bus hours
Northeast Corridor Alternatives Analysis. Public Involvement Round 2 Input on Alternatives for Further Study
 Northeast Corridor Alternatives Analysis Public Involvement Round 2 Input on Alternatives for Further Study Feb. 7-9, 2012 Agenda Review project background Progress summary Recommended alternatives for
Needs and Community Characteristics
 Needs and Community Characteristics Anticipate Population and Job Growth in the City Strongest density of population and jobs in Ann Arbor are within the Study Area Population expected to grow 8.4% by
Executive Summary. Treasure Valley High Capacity Transit Study Priority Corridor Phase 1 Alternatives Analysis October 13, 2009.
 Treasure Valley High Capacity Transit Study Priority Corridor Phase 1 Alternatives Analysis October 13, 2009 Background As the Treasure Valley continues to grow, high-quality transportation connections
West Santa Ana Branch Transit Corridor. Informational Briefing Gateway Cities Service Council April 13, 2017
 West Santa Ana Branch Transit Corridor Informational Briefing Gateway Cities Service Council April 13, 2017 Project Study Area 98 square miles 20 individual cities plus unincorporated LA County 1.2 million
1.0 Overview of Purpose and Need
 1.0 Overview of Purpose and Need 1.1 Introduction This report describes the purpose and need for transportation investments in the Regional Connector Project Study Area (PSA). The Regional Connector will
East San Fernando Valley Transit Corridor. TAC Briefing December 4, 2013
 East San Fernando Valley Transit Corridor TAC Briefing December 4, 2013 Overview Measure R Project Long Range Transportation Plan Reserves $170.1 Million 2018 Revenue Operations Date Coordination with
Bi-County Transitway/ Bethesda Station Access Demand Analysis
 Bi-County Transitway/ Bethesda Station Access Demand Analysis Prepared for: Washington Metropolitan Area Transit Authority Office of Planning and Project Development May 2005 Prepared by: in conjunction
CITY OF LONDON STRATEGIC MULTI-YEAR BUDGET ADDITIONAL INVESTMENTS BUSINESS CASE # 6
 2016 2019 CITY OF LONDON STRATEGIC MULTI-YEAR BUDGET ADDITIONAL INVESTMENTS BUSINESS CASE # 6 STRATEGIC AREA OF FOCUS: SUB-PRIORITY: STRATEGY: INITIATIVE: INITIATIVE LEAD(S): BUILDING A SUSTAINABLE CITY
Mobility Corridor Updates. Transit & Active Transportation Projects
 Mobility Corridor Updates Transit & Active Transportation Projects Manjeet Ranu, SEO East San Fernando Valley Transit Corridor Metro Board LPA selection: June 2018 Recently awarded $200 million in Senate
US 81 Bypass of Chickasha Environmental Assessment Public Meeting
 US 81 Bypass of Chickasha Environmental Assessment Public Meeting March 14, 2013 Introductions ODOT FHWA SAIC Meeting Purpose Present need for bypass Provide responses to 10/04/11 public meeting comments
Public Meeting. City of Chicago Department of Transportation & Department of Housing and Economic Development
 Public Meeting City of Chicago Department of Transportation & Department of Housing and Economic Development Funded by Regional Transportation Authority September 12, 2011 In partnership with Presentation
East San Fernando Valley Transit Corridor. Information Session, October 10, 2017
 East San Fernando Valley Transit Corridor Information Session, October 10, 2017 1 Welcome and Meeting Purpose Introductions Metro Transit Corridors Planning Metro Real Estate Metro Community Relations
US 29 Bus Rapid Transit Planning Board Briefing. February 16, 2017
 US 29 Bus Rapid Transit Planning Board Briefing February 16, 2017 Project Goals Improve the quality of transit service Improve mobility opportunities and choices Enhance quality of life Support master
Develop ground transportation improvements to make the Airport a multi-modal regional
 Project Overview TRANSPORTATION IMPROVEMENTS WHAT ARE THE PROJECT GOALS? Transportation transportation hub. Develop ground transportation improvements to make the Airport a multi-modal regional Land Use
Kendall Drive Premium Transit PD&E Study Project Kick-Off Meeting SR 94/Kendall Drive/SW 88 Street Project Development and Environment (PD&E) Study
 Study") Florida Department of Transportation District Six Kendall Drive Premium Transit PD&E Study Project Kick-Off Meeting SR 94/Kendall Drive/SW 88 Street Project Development and Environment (PD&E) Study What
Florida Department of Transportation District Six Kendall Drive Premium Transit PD&E Study Project Kick-Off Meeting SR 94/Kendall Drive/SW 88 Street Project Development and Environment (PD&E) Study What
I-10 West AA/EIS Pre-Screening and Tier 1 Analysis Results. Public Meeting. Wulf Grote, Director Project Development Rick Pilgrim, Project Manager
 I-10 West AA/EIS Pre-Screening and Tier 1 Analysis Results Public Meeting Wulf Grote, Director Project Development Rick Pilgrim, Project Manager March 4 & 5, 2008 Today s Agenda Overview of Alternatives
7 COMPARATIVE EVALUATION OF ALTERNATIVES
 7 COMPARATIVE EVALUATION OF ALTERNATIVES 7.1 INTRODUCTION This chapter presents the comparative analysis of the four Level 2 build alternatives along with a discussion of the relative performance of the
Energy Technical Memorandum
 Southeast Extension Project Lincoln Station to RidgeGate Parkway Prepared for: Federal Transit Administration Prepared by: Denver Regional Transportation District May 2014 Table of Contents Page No. Chapter
STRATEGIC PRIORITIES AND POLICY COMMITTEE MAY 5, 2016
 STRATEGIC PRIORITIES AND POLICY COMMITTEE MAY 5, 2016 Shift Rapid Transit Initiative Largest infrastructure project in the city s history. Rapid Transit initiative will transform London s public transit
Mobility Corridor Updates. Transit & Active Transportation Projects
 Mobility Corridor Updates Transit & Active Transportation Projects Laura Cornejo, DEO Regional Planner Regional Operator Metro is LA County s Regional Builder/Funder Rail Bus Service (Metro/Muni/Local)
Proposed Program of Interrelated Projects
 DALLAS AREA RAPID TRANSIT Proposed Program of Interrelated Projects Federal Transit Administration Capital Investment Program Summer 204 INTRODUCTION The current federal transportation bill, Moving Ahead
FINAL. Sound Transit Long-Range Plan Update. Issue Paper S.1: Tacoma Link Integration with Central Link. Prepared for: Sound Transit
 Sound Transit Long-Range Plan Update Issue Paper S.1: Tacoma Link Integration with Central Link Prepared for: Sound Transit Prepared by: Quade & Douglas, Inc. FINAL March 2005 Foreword This issue paper
Comprehensive Regional Goods Movement Plan and Implementation Strategy Goods Movement in the 2012 RTP/SCS
 Comprehensive Regional Goods Movement Plan and Implementation Strategy Goods Movement in the 2012 RTP/SCS Annie Nam Southern California Association of Governments September 24, 2012 The Goods Movement
Waco Rapid Transit Corridor (RTC) Feasibility Study
 Feasibility Study") Waco Rapid Transit Corridor (RTC) Feasibility Study Chris Evilia, Director of Waco Metropolitan Planning Organization Allen Hunter, General Manager Waco Transit System Jimi Mitchell, Project Manager AECOM
Waco Rapid Transit Corridor (RTC) Feasibility Study Chris Evilia, Director of Waco Metropolitan Planning Organization Allen Hunter, General Manager Waco Transit System Jimi Mitchell, Project Manager AECOM
Service Quality: Higher Ridership: Very Affordable: Image:
 Over the past decade, much attention has been placed on the development of Bus Rapid Transit (BRT) systems. These systems provide rail-like service, but with buses, and are typically less expensive to
Green Line Long-Term Investments
 Enhancements Short-term improvements to keep Austin moving. Investments Long-term projects to support our future. Mobility Hubs MetroRapid MetroRail MetroExpress Connectors Circulators Project Connect
TORONTO TRANSIT COMMISSION REPORT NO.
 Form Revised: February 2005 TORONTO TRANSIT COMMISSION REPORT NO. MEETING DATE: October 24, 2012 SUBJECT: DOWNTOWN RAPID TRANSIT EXPANSION STUDY (DRTES) PHASE 1 STRATEGIC PLAN ACTION ITEM RECOMMENDATIONS
I-26 Fixed Guideway Alternatives Analysis
 I-26 Fixed Guideway Alternatives Analysis Steering & Technical Advisory Committees Joint Meeting January 15, 2016 @ 10:00 AM SC/TAC Meeting Winter 2016 Agenda I. Welcome & Introductions II. III. Project
Office of Transportation Bureau of Traffic Management Downtown Parking Meter District Rate Report
 Office of Transportation Bureau of Traffic Management 1997 Downtown Parking Meter District Rate Report Introduction The City operates approximately 5,600 parking meters in the core area of downtown. 1
6/6/2018. June 7, Item #1 CITIZENS PARTICIPATION
 June 7, 2018 Item #1 CITIZENS PARTICIPATION 1 Item #2 APPROVAL OF MINUTES Item #3 TRAC GOALS, FRAMEWORK & AGENDA REVIEW 2 COMMITTEE GOALS Learn about Southern Nevada s mobility challenges, new developments
THE WILSHIRE CORRIDOR: RAIL AND ITS ALTERNATIVES. Prepared By: Jacki Murdock Transportation and Environmental Planner
 THE WILSHIRE CORRIDOR: RAIL AND ITS ALTERNATIVES Prepared By: Jacki Murdock Transportation and Environmental Planner December 13 th, 2012 Overview Characteristics of Wilshire Boulevard Overview of the
LOS ANGELES COUNTY METROPOLITAN TRANSPORTATION AUTHORITY (LACMTA) AND FEDERAL TRANSIT ADMINISTRATION (FTA)
 AND FEDERAL TRANSIT ADMINISTRATION (FTA)") LOS ANGELES COUNTY METROPOLITAN TRANSPORTATION AUTHORITY (LACMTA) AND FEDERAL TRANSIT ADMINISTRATION (FTA) NOTICE OF PREPARATION (NOP)/NOTICE OF INTENT (NOI) OF AN ENVIRONMENTAL IMPACT STATEMENT (EIS)/ENVIRONMENTAL
LOS ANGELES COUNTY METROPOLITAN TRANSPORTATION AUTHORITY (LACMTA) AND FEDERAL TRANSIT ADMINISTRATION (FTA) NOTICE OF PREPARATION (NOP)/NOTICE OF INTENT (NOI) OF AN ENVIRONMENTAL IMPACT STATEMENT (EIS)/ENVIRONMENTAL
Alternatives Analysis Findings Report
 6.0 This chapter presents estimates of the potential capital, operations and maintenance costs associated with the alternatives carried forward for detailed evaluation. The methodology used to develop
I-26 Fixed Guideway Alternatives Analysis
 I-26 Fixed Guideway Alternatives Analysis Public Meetings: North Charleston, January 25, 2016 Charleston: January 26, 2016 Summerville: January 28, 2016 Agenda I. Project Update II. III. IV. Screen Two
FREQUENTLY ASKED QUESTIONS
 FREQUENTLY ASKED QUESTIONS 2018 What is the More MARTA Atlanta program? The More MARTA Atlanta program is a collaborative partnership between MARTA and the City of Atlanta to develop and implement a program
A Transit Plan for the Future. Draft Network Plan
 A Transit Plan for the Future Draft Network Plan Project Overview and Status Completed Market Analysis and Service Evaluation. Developed Plan Framework and Guiding Principles. Developed a draft Five Year
August 2, 2010 Public Meeting
 Public Meeting LYMMO Expansion Alternatives Analysis Study Purpose of study is to provide a fresh look at potential LYMMO expansion, following Federal Transit Administration (FTA) Alternatives Analysis
METRO Orange Line BRT American Boulevard Station Options
 METRO Orange Line BRT American Boulevard Station Options Bloomington City Council Work Session November 18, 2013 Christina Morrison BRT/Small Starts Project Office Coordinating Planning and Design AMERICAN
Point A Point B Point C Point D. Fulton County Board of Commissioners and Mayors Meeting December 14, 2017
 Fulton County Board of Commissioners and Mayors Meeting December 14, 2017 Master Plan Overview Phase 1 Community Vision and Existing Transit Conditions Phase 2 Scenario Development Phase 3 Transit Master
Table Existing Traffic Conditions for Arterial Segments along Construction Access Route. Daily
 5.8 TRAFFIC, ACCESS, AND CIRCULATION This section describes existing traffic conditions in the project area; summarizes applicable regulations; and analyzes the potential traffic, access, and circulation
EUGENE-SPRINGFIELD, OREGON EAST WEST PILOT BRT LANE TRANSIT DISTRICT
 EUGENE-SPRINGFIELD, OREGON EAST WEST PILOT BRT LANE TRANSIT DISTRICT (BRIEF) Table of Contents EUGENE-SPRINGFIELD, OREGON (USA)... 1 COUNTY CONTEXT AND SYSTEM DESCRIPTION... 1 SYSTEM OVERVIEW... 1 PLANNING
TRANSPORTATION STUDY FOR THE 8899 BEVERLY BOULEVARD PROJECT
 DRAFT TRANSPORTATION STUDY FOR THE 8899 BEVERLY BOULEVARD PROJECT WEST HOLLYWOOD, CALIFORNIA NOVEMBER 2013 PREPARED FOR BEVERLY BOULEVARD ASSOCIATION PREPARED BY DRAFT TRANSPORTATION STUDY FOR THE 8899
Sepulveda Pass Corridor Systems Planning Study
 Los Angeles County Metropolitan Transportation Authority Sepulveda Pass Corridor Systems Planning Study Streets and Freeways Subcommittee January 17, 2013 1 Sepulveda Pass Study Corridor Extends for 30
Charlotte-Mecklenburg Region Rapid Transit and Land-Use Integration
 Charlotte-Mecklenburg Region Rapid Transit and Land-Use Integration Legislative Committee on Urban Growth and Infrastructure Carolyn Flowers CEO Charlotte Area Transit System March 23, 2010 Charlotte Region
Attachment D Environmental Justice and Outreach
 Attachment D Environmental Justice and Outreach ATTACHMENT D Environmental Justice and Outreach Indicate whether the project will have disproportionately high and adverse impacts on minority or low income
Public Meeting. March 21, 2013 Mimosa Elementary School
 Public Meeting March 21, 2013 Mimosa Elementary School Today s Meeting Purpose 2 Where We Are The Process What We ve Heard and Findings Transit Technologies Station Types Break-out Session Where We Are
Midtown Corridor Alternatives Analysis. Policy Advisory Committee Meeting February 12, 2014
 Midtown Corridor Alternatives Analysis Policy Advisory Committee Meeting February 12, 2014 Today s Agenda Introductions Outreach efforts and survey results Other updates since last meeting Evaluation results
STH 60 Northern Reliever Route Feasibility Study Report
 #233087 v3 STH 60 Northern Reliever Route Feasibility Study Report Washington County Public Works Committee Meeting September 28, 2016 1 STH 60 Northern Reliever Route Feasibility Study Hartford Area Development
2.4 TRANSIT VISION 2040 FROM VISION TO ACTION. Support the revitalization of urban cores STRATEGIC DIRECTION
 TRANSIT VISION 2040 FROM VISION TO ACTION TRANSIT VISION 2040 defines a future in which public transit maximizes its contribution to quality of life with benefits that support a vibrant and equitable society,
QUALITY OF LIFE EXECUTIVE SUMMARY REPORT I O N S TAT I O N
 QUALITY OF LIFE EXECUTIVE SUMMARY REPORT UN I O N S TAT I O N T R AV E L by TR A I N Published September 2017 2015 PROGRESS MAP This document reports FasTracks progress through 2015 BACKGROUND RTD The
The Engineering Department recommends Council receive this report for information.
 CORPORATE REPORT NO: R161 COUNCIL DATE: July 23, 2018 REGULAR COUNCIL TO: Mayor & Council DATE: July 19, 2018 FROM: General Manager, Engineering FILE: 8740-01 SUBJECT: Surrey Long-Range Rapid Transit Vision
KANSAS CITY STREETCAR
 KANSAS CITY STREETCAR KAREN CLAWSON MID-AMERICA REGIONAL COUNCIL KANSAS CITY STREETCAR Regional Context Alternatives Analysis Kansas City Streetcar Project KANSAS CITY REGION KANSAS CITY REGION KANSAS
The major roadways in the study area are State Route 166 and State Route 33, which are shown on Figure 1-1 and described below:
 3.5 TRAFFIC AND CIRCULATION 3.5.1 Existing Conditions 3.5.1.1 Street Network DRAFT ENVIRONMENTAL IMPACT REPORT The major roadways in the study area are State Route 166 and State Route 33, which are shown
Executive Summary. Phase 2 Evaluation Report. Introduction
 , Executive Summary Executive Summary Introduction TransLink and the Province of British Columbia sponsored a multi-phase study to evaluate alternatives for rapid transit service in the Broadway corridor
CEDAR AVENUE TRANSITWAY Implementation Plan Update
 CEDAR AVENUE TRANSITWAY Implementation Plan Update EECUTIVE SUMMARY DECEMBER 2015 Executive Summary In 2013, the Twin Cities metropolitan area s first bus rapid transit (BRT) line, the METRO Red Line,
Rapid Transit and Land-Use Integration a Reality
 City of Charlotte Rapid Transit and Land-Use Integration a Reality Transportation Oversight Committee Carolyn Flowers CEO Charlotte Area Transit System April 29, 2010 Charlotte Region Statistics Mecklenburg
Alpine Highway to North County Boulevard Connector Study
 Alpine Highway to North County Boulevard Connector Study prepared by Avenue Consultants March 16, 2017 North County Boulevard Connector Study March 16, 2017 Table of Contents 1 Summary of Findings... 1
King County Metro. Columbia Street Transit Priority Improvements Alternative Analysis. Downtown Southend Transit Study. May 2014.
 King County Metro Columbia Street Transit Priority Improvements Alternative Analysis Downtown Southend Transit Study May 2014 Parametrix Table of Contents Introduction... 1 Methodology... 1 Study Area...
IV. ENVIRONMENTAL IMPACT ANALYSIS K.2. PARKING
 IV. ENVIRONMENTAL IMPACT ANALYSIS K.2. PARKING ENVIRONMENTAL SETTING The following analysis summarizes the findings and conclusions of the Traffic Analysis (Traffic Study), prepared by The Mobility Group,
Leadership NC. November 8, 2018
 v Leadership NC November 8, 2018 Planning for our region s growth The Triangle is one of the fastestgrowing regions in the nation. More than 2 million people are already part of the equation, and the
Highway 18 BNSF Railroad Overpass Feasibility Study Craighead County. Executive Summary
 Highway 18 BNSF Railroad Overpass Feasibility Study Craighead County Executive Summary October 2014 Highway 18 BNSF Railroad Overpass Feasibility Study Craighead County Executive Summary October 2014 Prepared
Subarea Study. Manning Avenue (CSAH 15) Corridor Management and Safety Improvement Project. Final Version 1. Washington County.
 Corridor Management and Safety Improvement Project. Final Version 1. Washington County.") Subarea Study Manning Avenue (CSAH 15) Corridor Management and Safety Improvement Project Final Version 1 Washington County June 12, 214 SRF No. 138141 Table of Contents Introduction... 1 Forecast Methodology
Subarea Study Manning Avenue (CSAH 15) Corridor Management and Safety Improvement Project Final Version 1 Washington County June 12, 214 SRF No. 138141 Table of Contents Introduction... 1 Forecast Methodology
Funding Scenario Descriptions & Performance
 Funding Scenario Descriptions & Performance These scenarios were developed based on direction set by the Task Force at previous meetings. They represent approaches for funding to further Task Force discussion
4 COSTS AND OPERATIONS
 4 COSTS AND OPERATIONS 4.1 INTRODUCTION This chapter summarizes the estimated capital and operations and maintenance (O&M) costs for the Modal and High-Speed Train (HST) Alternatives evaluated in this
Pomona Rotary December 19, 2017
 Pomona Rotary December 19, 2017 Los Angeles County s population will grow by 5.9% to 10.7 million by 2024 During that same period, the San Gabriel Valley will grow by 7.6% to more than 1.5 million; taking
Sepulveda Pass Corridor Systems Planning Study Final Compendium Report. Connecting the San Fernando Valley and the Westside
 Los Angeles County Metropolitan Transportation Authority November 2012 Connecting the San Fernando Valley and the Westside Interstate 405 Sepulveda Pass THIS PAGE INTENTIONALLY LEFT BLANK Sepulveda Pass
Green Line LRT: Beltline Segment Update April 19, 2017
 Green Line LRT: Beltline Segment Update April 19, 2017 Quick Facts On April 11, 2017, City Council approved Administration s recommendation for the Green Line to be underground in the Beltline from 2 Street
The range of alternatives has been reviewed with the RTAC Subgroup and the preliminary analysis is proceeding on the following HCT alternatives:
 Attachment 2 Boise Treasure Valley Phase 1 Alternatives Analysis August 14, 2009 Introduction The Treasure Valley High Capacity Transit Priority Corridor Phase 1 Alternatives Analysis is being prepared
TRANSPORTATION REVIEW
 TRANSPORTATION REVIEW - PROPOSED MIX OF LAND USES IS CONSISTENT WITH THE CITY S UNDER THE GRANVILLE BRIDGE POLICIES THAT AIM TO MEET NEIGHBOURING RESIDENTS SHOPPING NEEDS AND REDUCE RELIANCE ON AUTOMOBILE
3.0 TRANSPORTATION ISSUES AND ANALYSIS
 3.0 TRANSPORTATION ISSUES AND ANALYSIS 3.1 Transit Analysis The following sections address the anticipated transit service levels under each of the alternatives considered in the detailed screening as
Sound Transit East Link: Bus/LRT System Integration Study
 Sound Transit East Link: Bus/LRT System Integration Study Prepared For: Sound Transit King County Metro Mercer Island WSDOT Prepared By: CH2M HILL July, 2014 1 SOUND TRANSIT EAST LINK: BUS/LRT SYSTEMES
CITY OF ANN ARBOR, MICHIGAN 301 E. Huron St., P.O. Box 8647 Ann Arbor, Michigan
 Date: Wednesday, June 24, 2014 Location: Ann Arbor District Library Attendees: 40 citizen attendees Ann Arbor Station Environmental Review Public Meeting Meeting Notes Meeting #2 The second public meeting
Draft Results and Open House
 Waco Rapid Transit Corridor (RTC) Feasibility Study Draft Results and Open House Chris Evilia, Director of Waco Metropolitan Planning Organization Allen Hunter, General Manager Waco Transit System Jimi
2030 Multimodal Transportation Study
 2030 Multimodal Transportation Study City of Jacksonville Planning and Development Department Prepared by Ghyabi & Associates April 29,2010 Introduction Presentation Components 1. Study Basis 2. Study
West Broadway Transit Study. Community Advisory Committee September 17, 2015
 West Broadway Transit Study Community Advisory Committee September 17, 2015 Introductions Community Engagement Summer Outreach Fall Outreach Technical Analysis Process Update Alternatives Review Economic
9. Downtown Transit Plan
 CORRADINO 9. Downtown Transit Plan KAT Transit Development Plan As part of the planning process for the TDP, an examination of downtown transit operations was conducted. The Downtown Transit Plan 1 is
Metropolitan Council Budget Overview SFY
 Metropolitan Council Budget Overview SFY 2016-2017 H T t ti C itt House Transportation Committee February 4, 2015 Transit connects us to the places that matter Transportation Needs Grow as the Region Grows
BROWARD BOULEVARD CORRIDOR TRANSIT STUDY
 BROWARD BOULEVARD CORRIDOR TRANSIT STUDY FM # 42802411201 EXECUTIVE SUMMARY July 2012 GOBROWARD Broward Boulevard Corridor Transit Study FM # 42802411201 Executive Summary Prepared For: Ms. Khalilah Ffrench,
IMPROVEMENT CONCEPTS
 IMPROVEMENT CONCEPTS for the South Novato Transit Hub Study Prepared by: January 11, 2010 DKS Associates With Wilbur Smith Associates IMPROVEMENT CONCEPTS Chapter 1: Introduction 1. INTRODUCTION The strategic
Kenosha-Racine-Milwaukee (KRM)
") Kenosha-Racine-Milwaukee (KRM) Commuter Rail #147925 November 6, 2009 1 Guidance of KRM Commuter Rail Studies Intergovernmental Partnership Technical Steering Committee Temporary and Limited Authority
Kenosha-Racine-Milwaukee (KRM) Commuter Rail #147925 November 6, 2009 1 Guidance of KRM Commuter Rail Studies Intergovernmental Partnership Technical Steering Committee Temporary and Limited Authority
Federal Way Link Extension
 Federal Way Link Extension Draft EIS Summary Route & station alternatives and impacts Link Light Rail System Map Lynnwood Mountlake Terrace Lynnwood Link Extension Shoreline 14th Northgate 40 Northgate
Feasibility Study. Community Meeting March, North-South Commuter Rail Feasibility Study
 Feasibility Study Community Meeting March, 2017 1 Agenda 1. Welcome / Introductions 2. Background / Meeting Purpose 3. Progress to Date Options Evaluated Capital/Operating Costs Ridership 4. Financial
Purpose and Need for Proposed Action
 S.0. S.1. EXECUTIVE SUMMARY Purpose and Need for Proposed Action Project and Study Area Description The Eastside Transit Corridor Phase 2 project seeks to improve transit service to an area hampered by
Transportation Demand Management Element
 Transportation Demand Management Element Over the years, our reliance on the private automobile as our primary mode of transportation has grown substantially. Our dependence on the automobile is evidenced
I-20 EAST TRANSIT INITIATIVE Tier 1 and Tier 2 Alternatives Screening Report EXECUTIVE SUMMARY
 EXECUTIVE SUMMARY The purpose of this report is to document the results of the Tier 1 and Tier 2 Screening of alternatives for the I-20 East Transit Initiative. The two-tier screening process presented
2 EXISTING ROUTE STRUCTURE AND SERVICE LEVELS
 2 EXISTING ROUTE STRUCTURE AND SERVICE LEVELS In the Study Area, as in most of the Metro Transit network, there are two distinct route structures. The base service structure operates all day and the peak
Note: The October 2007 version of this report has been updated in this December 2008 report to present costs in year 2007 dollars.
 Sound Transit Phase 2 South Corridor LRT Design Report: SR 99 and I-5 Alignment Scenarios (S 200 th Street to Tacoma Dome Station) Tacoma Link Extension to West Tacoma Prepared for: Sound Transit Prepared
Parking Management Element
 Parking Management Element The State Transportation Planning Rule, adopted in 1991, requires that the Metropolitan Planning Organization (MPO) area implement, through its member jurisdictions, a parking
2. Valley Circle Boulevard/Andora Avenue/Baden Avenue and Lassen Street
 IV.J TRANSPORTATION 1. INTRODUCTION This section presents an overview of the existing traffic and circulation system in and surrounding the project site. This section also discusses the potential impacts
REPORT CARD FOR CALIFORNIA S INFRASTRUCTURE WHAT YOU SHOULD KNOW ABOUT CALIFORNIA S TRANSIT FACILITIES
 TRANSIT GRADE: C- WHAT YOU SHOULD KNOW ABOUT TRANSIT FACILITIES California needs robust, flexible and reliable transit systems to reduce peak congestion on our highways, provide options for citizens who
Making Mobility Better, Together
 Making Mobility Better, Together Austin Transportation Department Gordon Derr, P.E., for Robert J. Spillar, P.E Director, Austin Transportation Department 1 AUSTIN TRANSPORTATION DEPARTMENT Our Mission