Energy in Transportation Energy Management
|
|
|
- Stanley Copeland
- 5 years ago
- Views:
Transcription
1 Energy in Transportation Energy Management Carlos A. Santos Silva
2 Energy Management 1. Energy Systems Concepts Tools (Sankey Diagrams, Energy Balance, block Diagrams) 2. Energy Management Buildings Transportation Industry 3. Energy Management Tools Project Evaluation
3 What do we need? Mobility or Accessibility?

4 What do we need? Accessibility not mobility To people To places To information To goods To services (job, school, ) To entertainment.


5 Energy use in transports

6 Historical evolution of energy use in transports

7 Energy vectors for transports

8 Worldwide fuel use distribution in transport sector

9 End-use technologies in transports

10 Evolution of end use technologies in transports

11 Influence of urban density
12 Energy consumption (PJ) Energy use in transports in Europe The road transportation subsector is the largest energy consumer in the transportation sector, accounting for 82% of Total Road Rail Aviation Maritime Unspecified the final energy consumption % 0.4% The two other largest subsectors are aviation, accounting for 14%, and rail responsible for 2%. 7.0% 8.6% 83.2% Passenger cars Buses Rail Aviation Maritime EU27 passenger split per transport mode in 2010 (Eurostat, 2014)
13 Final energy consumption (ktoe) Energy use in transports: Portugal Services Residential Transportation construction Industry Agriculture
14 Final energy consumption (ktoe) Energy use in transports: Portugal Road Rail National Maritime Transport National Aviation

15 Road transportation fuels in Portugal Diesel sales have increased, due to the contribution of freight transport and the dieselization of the light-duty fleet.
16 Austria Belgium Bulgaria Croatia Cyprus Czech Rep, Denmark Estonia Finland France Germany Greece Hungary Ireland Italy Latvia Lithuania Luxembourg Malta Netherlands Poland Portugal Romania Slovakia Slovenia Spain Sweden UK /liter Austria Belgium Bulgaria Croatia Cyprus Czech Rep, Denmark Estonia Finland France Germany Greece Hungary Ireland Italy Latvia Lithuania Luxembourg Malta Netherlands Poland Portugal Romania Slovakia Slovenia Spain Sweden UK /liter Diesel and gasoline prices 2,00 1,80 1,60 1,40 1,20 1,00 0,80 0,60 0,40 0,20 0,00 Gasoline VAT Excise duties Excluding taxes 2,00 1,80 1,60 1,40 1,20 1,00 0,80 0,60 0,40 0,20 0,00 Diesel VAT Excise duties Excluding taxes
17 Supply of fuels for transports in Portugal Few refueling infrastructure available for alternative energy pathways Se te m be r Fu e l P rice N u m b e r o f st a t io n s Bio d iesel B % Bio d iesel B % D iesel % D iesel (co lo red ) % H eatin g d iesel % S p ecial d iesel % G aso lin e % G aso lin e % G aso lin e (w ith ad d itives) % M ix tu re g aso lin e (2 stro ke en g in es) % S p ecial g aso lin el % S p ecial g aso lin e % G P L A u to % %

18 The problems of current transportation systems


19 The problems of current transportation systems. Supply interruptions since oil became a dominant energy source in the 1950s


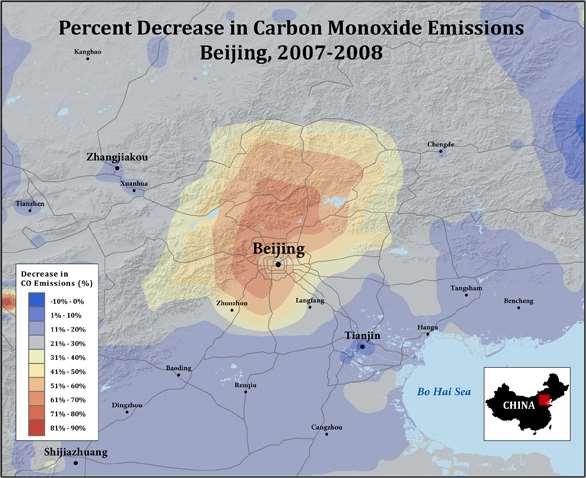

20 The problems of current transportation systems Emissions


21 Main providers of urban mobility Motorized Modes Car Taxi Bus Motorbike Train Metro Soft Modes Walking Biking
22 Main providers of urban mobility How do we compare them? L / 100 km
23 Main providers of urban mobility How do we compare them? MJ / km L / 100 km

24 Main providers of urban mobility How do we compare them? Energy Service MJ / pass.km Energy per pass.km Car (gasoline) Car (Diesel) Train Bus Tram Metro Bicycle walking
25 Diesel >2,0 l Diesel 1,4-2,0 l Gasoline >2,0 l Gasoline 0,8-1,4 l Gasoline 1,4-2,0 l LPG Coaches Urban Buses Urban CNG Buses 2-stroke <50 cm³ Motorcycles 2-stroke >50 cm³ 4-stroke <250 cm³ 4-stroke >750 cm³ 4-stroke cm³ National flights Intra-EU flights Extra-EU flights Electric Diesel Million pkm Main providers of urban mobility The total EU mobility service provided by the Basket-of-products is quantified in passenger.kilometers (pkm) per sub-product: 56% passenger cars 32% aviation 5% buses 5% rail 2% two-wheelers Passengers cars Buses 2W Aviation Train


26 How to reduce the impact of Mobility? 26
27 How to reduce the impact of Mobility? Lower emission and better efficiency Energy Source / Energy Chain Vehicle Technology & Efficiency Mobility Management Biodiesel Ethanol Natural Gas Electricity, hydrogen Lighter vehicles Hybrids Electric and Plug Ins + Public Transport + Soft modes Parking management Tolls, Urban Planning.
28 How to reduce the impact of Mobility? Lower emission and better efficiency Energy Source / Energy Chain Vehicle Technology & Efficiency Mobility Management Biodiesel Ethanol Natural Gas Electricity, hydrogen Lighter vehicles Hybrids Electric and Plug Ins + Public Transport + Soft modes Parking management Tolls, Urban Planning. Change of behavior Training Education New Culture Concerning Mobility
29 Regulation in transport sector Lower emission and better efficiency Energy Source / Energy Chain Renewable Energy Directive - RED: 2020 target of 10% of renewable energy in the transportation sector Fuel Quality Directive FQD: 10% reduction of GHG life-cycle emissions of fossil fuels (6% through the introduction of biofuels) Infrastructure changes - COM/2013/018 final
 Infrastructure changes -")
30 Regulation in transport sector Lower emission and better efficiency Energy Source / Energy Chain Renewable Energy Directive - RED: 2020 target of 10% of renewable energy in the transportation sector Fuel Quality Directive FQD: 10% reduction of GHG life-cycle emissions of fossil fuels (6% through the introduction of biofuels) Infrastructure changes - COM/2013/018 final
 Infrastructure changes -")
31 Regulation in transport sector Lower emission and better efficiency Energy Source / Energy Chain Renewable Energy Directive - RED: 2020 target of 10% of renewable energy in the transportation sector Fuel Quality Directive FQD: 10% reduction of GHG life-cycle emissions of fossil fuels (6% through the introduction of biofuels) Infrastructure changes - COM/2013/018 final
32 Regulation in transport sector Lower emission and better efficiency Energy Source / Energy Chain Renewable Energy Directive - RED: 2020 target of 10% of renewable energy in the transportation sector Fuel Quality Directive FQD: 10% reduction of GHG life-cycle emissions of fossil fuels (6% through the introduction of biofuels) Infrastructure changes - COM/2013/018 final
 Infrastructure changes -")
33 Regulation in transport sector Lower emission and better efficiency Energy Source / Energy Chain Renewable Energy Directive - RED: 2020 target of 10% of renewable energy in the transportation sector Fuel Quality Directive FQD: 10% reduction of GHG life-cycle emissions of fossil fuels (6% through the introduction of biofuels) Infrastructure changes - COM/2013/018 final
34 Regulation in transport sector Lower emission and better efficiency Energy Source / Energy Chain Renewable Energy Directive - RED: 2020 target of 10% of renewable energy in the transportation sector Fuel Quality Directive FQD: 10% reduction of GHG life-cycle emissions of fossil fuels (6% through the introduction of biofuels) Infrastructure changes - COM/2013/018 final


35 Alternative fuels and vehicle technologies New energy sources / energy chains Ethanol Biodiesel Natural Gas Biogas New Propulsion systems Hybrid, electric, plug in, fuel cell... Electricity... Hydrogen

36 Alternative fuels for the transportation sector


37 Electric Vehicles Sales Source: Source:

")
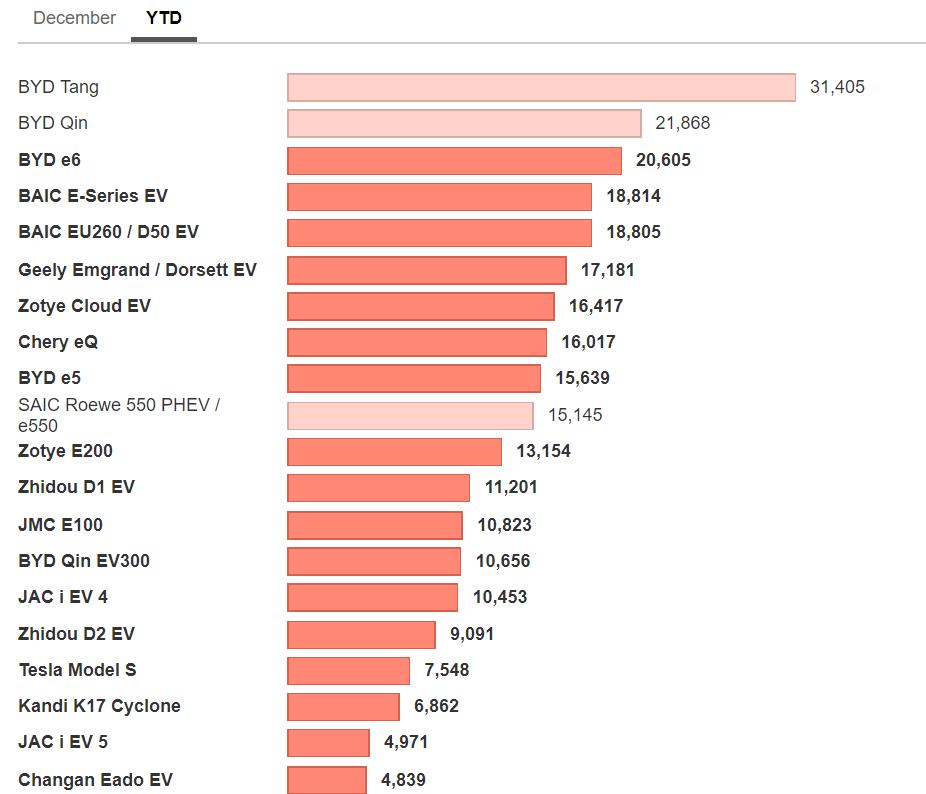
38 Elecric vehicles Sales (US, Europe, China) Source:
39 Alternative fuels for the transportation sector - Prices: DOE, 2015
40 LCA of vehicle technologies and energy sources 1. Tank-to-Wheel (TTW) - vehicle utilization stage related to driving the vehicle. 3. Materials Cradle-to- Grave (CTG) - the vehicle manufacturing, maintenance and recycling. 2. Well-to-Tank (WTT) - fuel production stage.


41 Full life cycle including alternative vehicle technologies Source: Baptista, P., Tomás, M., and Silva, C., Plug-in hybrid fuel cell vehicles market penetration scenarios, International Journal of Hydrogen Energy, 2010, 35 (18), p

42 What about cost? Including all vehicle costs along its lifetime Acquisition and sale Circulation tax Insurance Inspection Energy Maintenance
43 Regulation in transport sector Lower emission and better efficiency Energy Source / Energy Chain Vehicle Technology & Efficiency Renewable Energy Directive - RED: 2020 target of 10% of renewable energy in the transportation sector Fuel Quality Directive FQD: 10% reduction of GHG life-cycle emissions of fossil fuels (6% through the introduction of biofuels) Infrastructure changes - COM/2013/018 final EU targets: 130g/km in 2015 and 90g/km in 2020 in new vehicle sales mix in EU Euro Standards: emission limits according vehicle age
44 Emission targets Vehicle evolution: mass and fuel consumption
45 Emission targets EU targets: 130g/km in 2015 and 90g/km in 2020 in new vehicle sales mix in EU a) b) Emission targets in new vehicle sales

46 Emission targets EU targets: 130g/km in 2015 and 90g/km in 2020 in new vehicle sales mix in EU ACEA 2015
47 Emission targets EU targets: 130g/km in 2015 and 90g/km in 2020 in new vehicle sales mix in EU

48 Euro standards European emission standards define the acceptable limits for exhaust emissions of new vehicles sold in EU member states. The emission standards are defined in a series of European Union directives staging the progressive introduction of increasingly stringent standards.

49 Euro standards

50 v (km/h) Euro standards Euro Standards: emission limits according vehicle age (HC, CO, NOx, PM) Europe: NEDC standard cycle 125 EUDC ECE t (s)
51 Euro standards Euro Standards: emission limits according vehicle age Some characteristics of the NEDC: - The cycle must be performed on a cold vehicle at 20 30ºC (typically run at 25ºC) - The cycles may be performed on a flat road, in the absence of wind. However, to improve repeatability, they are generally performed on a roller test bench. - For each vehicle configuration, a look-up table is applied: each speed corresponds to a certain value of resistance (reverse torque applied to the drive wheels). This arrangement enables the use of a single physical vehicle to test all vehicle body styles (Sedan, hatchback, MPV etc.). - The test is conducted with all ancillary loads turned off (Air conditioning compressor and fan, lights, heated rear window, etc.).

52 Euro standards Euro Standards: emission limits according vehicle age Differences between certification and real world data


53 Speed reduction legislation


54 Regulation in transport sector Lower emission and better efficiency Mobility Management Alternative products: carsharing, car-pooling, bikesharing, etc Alternative integrated ticketing options Tolling access to city centers Low emission zones Green parking permits.


55 Alternative products ZER - zonas de emissão reduzidas / LOZ low emission zones Tolling access to city centers Example of London: The Congestion Charge is an daily charge for driving a vehicle within the charging zone between 07:00 and 18:00, Monday to Friday.


56 Alternative products Alternative products: CAR- SHARING Car-sharing: model of car rental where people rent cars for short periods of time, often by the hour, with reduced costs since total ownership costs are displaced. Types of car-sharing Infrastructure dependent: - Two-way car-sharing: pick up and return to same parking location - One-way car-sharing: pick up in pre-defined parking location an return in other parking location within the network Free-floating car-sharing - Pick up / drop off a car is possible freely in a defined zone of a city, as cars have no fixed positioning. Peer-to-peer car-sharing (also known as person-to-person car-sharing and peer-to-peer car rental) is the process whereby existing car owners make their vehicles available for others to rent for short periods of time.
57 Alternative products Alternative products: CAR- SHARING More than 400 cities with car-sharing systems were identified, mostly located in Europe (around 80%), followed by North America (approximately 18%) and by Oceania (approximately 2%). Wider deployment in the 2000 s, despite some prior initial trials in Switzerland, UK and USA. In 2011 and 2012, more than 25 new systems were created. Most widely known systems: Autolib (Paris, 1750 Electric Vehicles, 4000 charging points, registered subscribers) Zipcar (expanded worldwide, members, vehicles) Hertz on demand (started in 2008, vast distribution in US, Europe and Australia, users) Car2Go (started in Germany in 2008, expanded to 18 cities worldwide, customers, 6000 conventional and alternative vehicles) These 4 operators are the bigger systems with more than 100 vehicles per city, representing 47% of the total system considered. 1/10/2018 Instituto Superior Técnico 57


58 Number of bike-sharing systems by start year Alternative products: BIKE- SHARING Alternative products Increasing number of BSS across the world, mostly since Europe North America South America Asia Oceania BSS identified 0 Most new BSS are located in Europe, but largest are in Asia 58
59 Alternative products Alternative products: BIKE- SHARING Diverse profiles in deployment of bikes and stations: highest deployment of bikes in Asia Distinct adhesion and usage of BSS 1/10/2018 Instituto Superior Técnico 59
60 Energy management approach 1. What is the question we are trying to answer? Improve efficiency, reduce cost or emissions, comply with regulations? Just characterize? 2. Fully characterize the problem: - Fleet, mobility patterns, constrains, - Consumption, emissions, cost, impacts 3. What alternative solutions are available - Technological - Mobility management - Behavior,. 4. Characterize alternative solutions - Time, cost, energy, emissions, 5. Compare and conclude


,")
61 Fleet management tools Objective: Improve operational management of fleets as well as its performance Tools used: simple GPS trackers, on-board monitoring devices, mobile apps, etc. Typical collected data: Engine management (OBD), GPS, Vehicle dynamics (speed, acceleration), etc.
 - Organizing preventive and repair maintenance")

62 Fleet management tools Examples of purpose for fleet management tools - Geo-location in case of vehicle theft - Route management (reduce unnecessary VKT) - Organizing preventive and repair maintenance information - Refueling and fuel consumption registration, in order to promotion of energy efficiency - Better allocation of vehicles to type of service - Implementation of eco-driving (in class training or real time feedback)
ACEA Report. Vehicles in use Europe 2017
 ACEA Report Vehicles in use Europe 2017 TABLE OF CONTENTS Summary... 2 Vehicles in use in Europe... 3 Passenger cars... 3 Light commercial vehicles... 4 Medium and heavy commercial vehicles... 5 Buses...
ACEA Report. Vehicles in use Europe 2018
 ACEA Report Vehicles in use Europe 2018 TABLE OF CONTENTS Summary... 2 Vehicles in use in Europe... 3 Passenger cars... 3 Light commercial vehicles... 4 Medium and heavy commercial vehicles... 5 Buses...
NEW PASSENGER CAR REGISTRATIONS BY ALTERNATIVE FUEL TYPE IN THE EUROPEAN UNION 1 Quarter
 PRESS EMBARGO: NEW PASSENGER CAR REGISTRATIONS BY ALTERNATIVE FUEL TYPE IN THE EUROPEAN UNION 1 Quarter 3 2017 Alternative fuel vehicle registrations: +51.4% in third quarter of 2017 In the third quarter
NEW ALTERNATIVE FUEL VEHICLE REGISTRATIONS IN THE EUROPEAN UNION 1 Q1 2015
 NEW ALTERNATIVE FUEL VEHICLE REGISTRATIONS IN THE Q1 2015 ALTERNATIVE FUEL VEHICLE registrations: +28.8% in in first quarter In the first quarter of 2015, total alternative fuel vehicle (AFV) registrations
NEW ALTERNATIVE FUEL VEHICLE REGISTRATIONS IN THE EUROPEAN UNION 1 Q2 2015
 NEW ALTERNATIVE FUEL VEHICLE REGISTRATIONS IN THE Q2 2015 New alternative fuel vehicle (AFV) registrations in the EU by engine type Q2 2014 Q2 2015 Thousand units 70 60 50 40 30 20 10 0 EVs HEVs AFVs other
NEW PASSENGER CAR REGISTRATIONS BY FUEL TYPE IN THE EUROPEAN UNION 1
 PRESS EMBARGO: NEW PASSENGER CAR REGISTRATIONS BY FUEL TYPE IN THE EUROPEAN UNION 1 Quarter 3 2018 Fuel types of new cars: diesel 18.2%, petrol +15.2%, electric +30.0% in third quarter of 2018 In the third
NEW PASSENGER CAR REGISTRATIONS BY ALTERNATIVE FUEL TYPE IN THE EUROPEAN UNION 1 Quarter
 PRESS EMBARGO: NEW PASSENGER CAR REGISTRATIONS BY ALTERNATIVE FUEL TYPE IN THE EUROPEAN UNION 1 Quarter 2 2016 Alternative fuel vehicle registrations: +0.6% in second quarter of 2016 In the second quarter
NEW PASSENGER CAR REGISTRATIONS BY ALTERNATIVE FUEL TYPE IN THE EUROPEAN UNION 1 Quarter
 PRESS EMBARGO: NEW PASSENGER CAR REGISTRATIONS BY ALTERNATIVE FUEL TYPE IN THE EUROPEAN UNION 1 Quarter 2 2017 Alternative fuel vehicle registrations: +38.0% in second quarter of 2017 In the second quarter
NEW COMMERCIAL VEHICLE REGISTRATIONS EUROPEAN UNION 1. December 2018
 PRESS EMBARGO: NEW COMMERCIAL VEHICLE REGISTRATIONS EUROPEAN UNION 1 December 2018 Commercial vehicle registrations: +3.2% in 2018; 4.0% in December Total new commercial vehicles In December 2018, commercial
NEW PASSENGER CARS BY FUEL TYPE IN THE EUROPEAN UNION 1 Quarter
 PRESS EMBARGO: NEW PASSENGER CARS BY FUEL TYPE IN THE EUROPEAN UNION 1 Quarter 1 2018 Next press release: Thursday 6 September 2018 1 Data for Croatia, Cyprus, Luxembourg and Malta is not available Page
NEW PASSENGER CARS BY FUEL TYPE IN THE EUROPEAN UNION 1 Quarter
 PRESS EMBARGO: NEW PASSENGER CARS BY FUEL TYPE IN THE EUROPEAN UNION 1 Quarter 1 2018 Next press release: Thursday 6 September 2018 1 Data for Croatia, Cyprus, Luxembourg and Malta is not available Page
BREXIT AND THE AUTO INDUSTRY: FACTS AND FIGURES
 BREXIT AND THE AUTO INDUSTRY: FACTS AND FIGURES GLOBAL TRADE European Union EU vehicle imports: Total value: 45,693 million Quantity: 3,395,419 units EU vehicle exports: Total value: 135,398 million Quantity:
NEW COMMERCIAL VEHICLE REGISTRATIONS EUROPEAN UNION 1 February 2018
 PRESS EMBARGO: NEW COMMERCIAL VEHICLE REGISTRATIONS EUROPEAN UNION 1 February 2018 Next press release: Tuesday 24 April 2018 1 Malta not available Page 1 of 7 Commercial vehicle registrations: +6.5% first
BREXIT AND THE AUTO INDUSTRY: FACTS AND FIGURES
 BREXIT AND THE AUTO INDUSTRY: FACTS AND FIGURES GLOBAL TRADE European Union EU vehicle imports: Total value: 48,019 million Quantity: 3,640,975 units EU vehicle exports: Total value: 138,536 million Quantity:
NEW COMMERCIAL VEHICLE REGISTRATIONS EUROPEAN UNION 1. April 2017
 PRESS EMBARGO: NEW COMMERCIAL VEHICLE REGISTRATIONS EUROPEAN UNION 1 April 2017 Next press release: Friday 23 June 2017 1 Data for Malta unavailable Page 1 of 7 Commercial vehicle registrations: +3.8%
NEW COMMERCIAL VEHICLE REGISTRATIONS EUROPEAN UNION 1. November 2018
 PRESS EMBARGO: NEW COMMERCIAL VEHICLE REGISTRATIONS EUROPEAN UNION 1 November 2018 Commercial vehicle registrations: +3.8% 11 months into 2018; +2.7% in November Total new commercial vehicles In November
NEW COMMERCIAL VEHICLE REGISTRATIONS EUROPEAN UNION 1. October 2016
 PRESS EMBARGO: NEW COMMERCIAL VEHICLE REGISTRATIONS EUROPEAN UNION 1 October 2016 Next press release: Thursday 22 December 2016 1 Data for Malta unavailable Page 1 of 7 Commercial vehicle registrations:
AUSTRIA. Table 1. FDI flows in the host economy, by geographical origin. (Millions of US dollars)
") Table 1. FDI flows in the host economy, by geographical origin World 5 690 138 6 195 3 184 10 784 7 933 31 154 6 858 9 303 840 10 618 5 760 Developed economies 5 740 13 5 341 2 689 10 137 6 291 29 721
Table 1. FDI flows in the host economy, by geographical origin World 5 690 138 6 195 3 184 10 784 7 933 31 154 6 858 9 303 840 10 618 5 760 Developed economies 5 740 13 5 341 2 689 10 137 6 291 29 721
1. INTERNATIONAL OVERVIEW. 1.0 Area and population. population (1,000) area
 area") 1.0 Area and population area population (1,000) km 2 2000 2010 2018 1 inhabitants per km 2 Belgium 30,530 10,251 10,920 11,443 375 Germany 357,380 82,212 81,777 82,952 232 Estonia 45,230 1,397 1,331 1,315
1.0 Area and population area population (1,000) km 2 2000 2010 2018 1 inhabitants per km 2 Belgium 30,530 10,251 10,920 11,443 375 Germany 357,380 82,212 81,777 82,952 232 Estonia 45,230 1,397 1,331 1,315
Sectoral Profile - Services
 Sectoral Profile - Services Energy consumption Changes in energy consumption and value added in services Since 2008 strong contraction of total energy consumption (-0.3%/year) although electricity consumption
NEW COMMERCIAL VEHICLE REGISTRATIONS EUROPEAN UNION* September 2014
 PRESS EMBARGO: 8.00 A.M. (7.00 A.M GMT), October 28, 2014 NEW COMMERCIAL VEHICLE REGISTRATIONS EUROPEAN UNION* September 2014 Next Press Release: November 27, 2014 *Data for Malta unavailable Page 1 of
December 2011 compared with November 2011 Industrial producer prices down by 0.2% in both euro area and EU27
 18/2012-2 February 2012 December 2011 compared with November 2011 Industrial producer prices down by 0.2% in both euro area and EU27 In December 2011, compared with November 2011, the industrial producer
September 2011 compared with August 2011 Industrial producer prices up by 0.3% in euro area Up by 0.4% in EU27
 161/2011-4 November 2011 September 2011 compared with August 2011 Industrial producer prices up by 0.3% in euro area Up by 0.4% in EU27 In September 2011 compared with August 2011, the industrial producer
Monitoring the CO 2 emissions from new passenger cars in the EU: summary of data for 2010
 Monitoring the CO 2 emissions from new passenger cars in the EU: summary of data for 2010 EXECUTIVE SUMMARY EEA has collected data submitted by Member States on vehicle registrations in the year 2010,
June EU Countries NEW COMMERCIAL VEHICLE REGISTRATIONS. PRESS EMBARGO FOR ALL DATA: July 26, 2013, 8.00 A.M. (6.00 A.M. GMT)
") PRESS EMBARGO FOR ALL DATA: y 26, 213, 8. A.M. (6. A.M. GMT) Press s Release e e NEW COMMERCIAL VEHICLE REGISTRATIONS e 213 EU Countries 15, LCVs up to 3.5t 2, Heavy Trucks of 16t and over ons New Registrati
PRESS EMBARGO FOR ALL DATA: y 26, 213, 8. A.M. (6. A.M. GMT) Press s Release e e NEW COMMERCIAL VEHICLE REGISTRATIONS e 213 EU Countries 15, LCVs up to 3.5t 2, Heavy Trucks of 16t and over ons New Registrati
Emissions per capita and GDP
 Emissions per capita and GDP (1990 -) CEIP Centre on Emission Inventories and Projections Emissions per capita and emissions per GDP were calculated for all years from 1990 to where data was available
Summary. Accessibility not mobility. What do we need? How to deliver? What do we need?
 1 Summary Solutions for reducing energy consumption and pollutant emissions from the road transportation sector. 1. Introduction What do we need / How to deliver? Impacts and challenges 2. Solutions for
Gestão de Sistemas Energéticos 2016/2017
 Gestão de Sistemas Energéticos 2016/2017 Energy efficiency in transports: characterization Patrícia Baptista IN+ Center for Innovation, Technology and Policy Research Instituto Superior Técnico, Universidade
Passenger cars in the EU
 Passenger cars in the EU Statistics Explained Data extracted in April 2018 Planned article update: April 2019 This article describes developments in passenger car stocks and new registrations in the European
TAXATION N 322 JC/ 49 /14 LC/ 39 /14 BARS/ 25 /14 WG-TX/ 2 /14 WG-CO2/ 23 /14 WG-EV/ 4 /14 WG-CSG/ 10 /14
 Brussels, 3 April 2014 TAXATION N 322 JC/ 49 /14 LC/ 39 /14 BARS/ 25 /14 WG-TX/ 2 /14 WG-CO2/ 23 /14 WG-EV/ 4 /14 WG-CSG/ 10 /14 Subject: Overview of C2 taxes and incentives for EVs Dear colleagues, Please
June EU Countries NEW COMMERCIAL VEHICLE REGISTRATIONS. PRESS EMBARGO FOR ALL DATA: July 26, 2012, 8.00 A.M. (6.00 A.M. GMT) LCVs up to 3.
 LCVs up to 3.") PRESS EMBARGO FOR ALL DATA: y 26, 212, 8. A.M. (6. A.M. GMT) Press s Release e e NEW COMMERCIAL VEHICLE REGISTRATIONS e 212 EU Countries 15, LCVs up to 3.5t 2, Heavy Trucks over 16t New Regis strations
PRESS EMBARGO FOR ALL DATA: y 26, 212, 8. A.M. (6. A.M. GMT) Press s Release e e NEW COMMERCIAL VEHICLE REGISTRATIONS e 212 EU Countries 15, LCVs up to 3.5t 2, Heavy Trucks over 16t New Regis strations
Energy efficiency policies and measures in transport in the EU 27, Norway and Croatia
 ODYSSEE MURE Final Meeting Paris, May 18-19 2009 Energy efficiency policies and measures in transport in the EU 27, Norway and Croatia B Lapillonne Karine Pollier Enerdata Content Overview of measures:
Krakow, 16 September Laurence A. Bannerman President EPA
 Krakow, 16 September 2016 Laurence A. Bannerman President EPA THE URBAN MOBILITY SYSTEMS - EU - TODAY PUBLIC MOBILITY INFRASTRUCTURES : PUBLIC TRANSPORT: Rail regional, suburban, metro, light rail, train
Technologies for Urban Transport
 Downloaded from orbit.dtu.dk on: Dec 19, 2017 Technologies for Urban Transport Dhar, Subash; Shukla, P.R. Publication date: 2013 Link back to DTU Orbit Citation (APA): Dhar, S., & Shukla, P. R. (2013).
Recent development of liquid biofuels in the European Union. 14 July 2006 Sofia Jean-Marc Jossart
 Recent development of liquid biofuels in the European Union 14 July 26 Sofia Jean-Marc Jossart Content - Directives 23/3 and 96 - Biomass Action Plan - EU strategy for biofuels -BIOFRAC andebtp -Standards
KEY DRIVERS AND SLOWERS OF PASSENGER CAR TRANSPORT (ENERGY) DEMAND IN THE EU-27
 DEMAND IN THE EU-27") Amela Ajanovic KEY DRIVERS AND SLOWERS OF PASSENGER CAR TRANSPORT (ENERGY) DEMAND IN THE EU-27 Vienna University of Technology, Energy Economics Group, Austria, Phone +431 5881 37364, e-mail ajanovic@eeg.tuwien.ac.at
Amela Ajanovic KEY DRIVERS AND SLOWERS OF PASSENGER CAR TRANSPORT (ENERGY) DEMAND IN THE EU-27 Vienna University of Technology, Energy Economics Group, Austria, Phone +431 5881 37364, e-mail ajanovic@eeg.tuwien.ac.at
Production of heat by type Terajoules
 Production of heat by type Table Notes geo represents heat used directly for district heating, agriculture etc. without a commercial transaction taking place. Please refer to the Definitions Section on
USDA Agricultural Outlook Forum 2007
 USDA Agricultural Outlook Forum 2007 EU BIOFUELS POLICY AND EFFECTS ON PRODUCTION, CONSUMPTION AND LAND USE FOR ENERGY CROPS Hilkka Summa Head of Unit for Bioenergy, Biomass, Forestry and Climate Change
Mileage-based User Fees In Europe and USA
 Mileage-based User Fees In Europe and USA Dr. Toshinori Nemoto Professor at Hitotsubashi University The 31th Japan Road Congress International symposium: Road-tolling policies and technologies October
CO2 BASED MOTOR VEHICLE TAXES IN THE EU
 CO2 BASED MOTOR VEHICLE TAXES IN THE EU AUSTRIA A deduction of VAT is applicable for zero CO2 emission passenger cars. Fuel consumption/pollution tax (Normverbrauchsabgabe or NoVA) is levied on the purchase
Biofuels in Europe: Overview and Features of a New Industry
 XXXII International IAEE Conference Biofuels in Europe: Overview and Features of a New Industry June 23rd, 2009 San Francisco Pietro Lanzini, Iefe-Bocconi University European framework: - Directive 2003/30/EC
NEW PASSENGER CAR REGISTRATIONS EUROPEAN UNION 1
 PRESS EMBARGO: 8.00 AM (6.00 AM GMT), 19 September 2018 NEW PASSENGER CAR REGISTRATIONS EUROPEAN UNION 1 Passenger car registrations: +6.1% eight months into 2018; +10.5% in July and +31.2% in August In
Overview of Global Fuel Economy Policies
 Overview of Global Fuel Economy Policies Zifei Yang Researcher 2018 APCAP Joint Forum and Clean Air Week Theme: Solutions Landscape for Clean Air Bangkok, Mar 20, 2018 What is ICCT? ICCT is an independent
September 2003 Industrial producer prices stable in euro-zone and EU15
 STAT/03/123 31 October 2003 September 2003 Industrial producer prices stable in euro-zone and EU15 The euro-zone 1 industrial producer price index 2 remained unchanged in September 2003 compared with the
Winners & Losers by Market - January 2019 vs January 2018
 Countries 19/18 % Chg LITHUANIA +49,0 ROMANIA +18,8 HUNGARY +9,2 PORTUGAL +8,3 DENMARK +7,0 GREECE +3,7 LATVIA +0,7 POLAND -0,3 FRANCE -1,1 GERMANY -1,4 UNITED KINGDOM -1,6 NORWAY -2,2 LUXEMBOURG -3,4
Civil Dialogue Group on WINE Thursday April 19th, 2018
 COMMISSION EUROPÉENNE DIRECTION GÉNÉRALE DE L'AGRICULTURE ET DU DÉVELOPPEMENT RURAL Directorate G. Markets and Observatories G.2. Wine, spirits and horticultural products Bruxelles, le G.2/GD(2017) Civil
WLTP for fleet. How the new test procedure affects the fleet business
 WLTP for fleet How the new test procedure affects the fleet business Editorial Ladies and Gentlemen, The automotive industry is facing a major transformation process that will also affect the fleet business
Production of heat by type Terajoules
 Production of heat by type Table Notes geo represents heat used directly for district heating, agriculture etc. without a commercial transaction taking place. represents heat used for the production of
Winners & Losers by Market - December 2018 vs December 2017
 Countries December 18/17 % Chg LITHUANIA +24,8 CROATIA +16,1 NETHERLANDS +15,3 ROMANIA +12,3 ITALY +2,0 GREECE -1,1 SPAIN -3,5 PORTUGAL -5,3 CYPRUS -5,3 POLAND -5,5 UNITED KINGDOM -5,5 GERMANY -6,7 LUXEMBOURG
DRINK-DRIVING IN THE EUROPEAN UNION
 DRINK-DRIVING IN THE EUROPEAN UNION Safe and Sober Talk Switzerland Bern, 17 th of October 2017 Frank Mütze Policy & Project Officer ETSC ETSC A science based approach to road safety Secretariat in Brussels
Vossloh Rail Vehicles
 Vossloh Rail Vehicles Economic Mobility June 2010 Vossloh Rail Vehicles Business Areas LOCOMOTIVES Diesel-Electric Electric Shunting Components for locomotives (bogies) PASSENGER VEHICLES Metros Tramways
Overview of Appropriate Vehicle Types for DRT Applications
 Overview of Appropriate Vehicle Types for DRT Applications Presentation at CONNECT 3rd Workshop on Future Vehicle Requirements for Flexible Transport Services Yngve Westerlund ywk@logistikcentrum.se What
Infographics on Electromobility (January 2019)
") Infographics on Electromobility (January 2019) Publisher: BMW Group Corporate Communications Electromobility Last Update: 04.01.2019 Contact: presse@bmw.de ELECTROMOBILITY IN GERMANY. SHARE IN NEW REGISTRATIONS
Infographics on Electromobility (January 2019) Publisher: BMW Group Corporate Communications Electromobility Last Update: 04.01.2019 Contact: presse@bmw.de ELECTROMOBILITY IN GERMANY. SHARE IN NEW REGISTRATIONS
Fiscal incentives and Feebates as tools for improving efficiency in transport sector
 Fiscal incentives and Feebates as tools for improving efficiency in transport sector Zifei Yang Researcher Taller sobre Propuestas para Impuestos e Incentivos para Promover la Importación de Vehículos
Taxing Petrol and Diesel
 Taxing Petrol and Diesel Colm Farrell Key Point Under the polluter pays principle, tax rates on diesel and petrol fuels should be at a rate which is commensurate with the total environmental costs they
NEW PASSENGER CAR REGISTRATIONS EUROPEAN UNION 1
 PRESS EMBARGO: 8.00 AM (6.00 AM GMT), 16 May 2017 NEW PASSENGER CAR REGISTRATIONS EUROPEAN UNION 1 Passenger car registrations: +4.7% four months into 2017; 6.6% in In 2017, the number of passenger cars
NEW PASSENGER CAR REGISTRATIONS EUROPEAN UNION 1
 PRESS EMBARGO: 8.00 AM (7.00 AM GMT), 15 February 2019 NEW PASSENGER CAR REGISTRATIONS EUROPEAN UNION 1 Passenger car registrations: 4.6% in 2019 In 2019, the European passenger car market saw a slow start
P r e s s R e l e a s e. June 2007
 PRESS EMBARGO FOR ALL DATA: 26 July 27, 8. A.M. (6. A.M. GMT) P r e s s NEW COMMERCIAL VEHICLE REGISTRATIONS June 27 European Union + EFTA Countries LCVs up to 3.5t Heavy Trucks over 16t 25, 3, 2, 15,
Green Mobility: The Future of Transportation in Denmark and in the EU Grøn Mobilitet: Fremtidens Transport i Danmark og EU
 Green Mobility: The Future of Transportation in Denmark and in the EU Grøn Mobilitet: Fremtidens Transport i Danmark og EU Nordisk Folkecenter for Vedvarende Energi, 7760 Hurup Thy, Danmark Incentive Schemes
Winners & Losers by Market - September 2018 vs September 2017
 Countries September 18/17 % Chg BULGARIA +8,5 CROATIA +3,3 SLOVENIA -7,3 HUNGARY -7,4 LITHUANIA -8,3 CYPRUS -9,9 LATVIA -11,0 FRANCE -12,8 PORTUGAL -14,0 DENMARK -16,0 NETHERLANDS -16,7 SWITZERLAND -16,8
June 2014 Euro area unemployment rate at 11.5% EU28 at 10.2%
 STAT/14/121 31 July 2014 June 2014 Euro area unemployment rate at 11.5% EU28 at 10.2% The euro area 1 (EA18) seasonally-adjusted 2 unemployment rate 3 was 11.5% in June 2014, down from 11.6% in May 2014
Energy efficiency policies for transport. John Dulac International Energy Agency Paris, 29 May 2013
 Energy efficiency policies for transport John Dulac International Energy Agency Paris, 29 May 2013 Transport scene-setting Why are transport policies needed, particularly in cities? Oil demand is driven
February 2014 Euro area unemployment rate at 11.9% EU28 at 10.6%
 STAT/14/52 1 April 2014 February 2014 Euro area unemployment rate at 11.9% EU28 at 10.6% The euro area 1 (EA18) seasonally-adjusted 2 unemployment rate 3 was 11.9% in February 2014, stable since October
In national currency
 Euro-super 95 In national currency Gas oil automobile Automotive gas oil Dieselkraftstoff Gasoil de chauffage Heating gas oil Heizöl (II) Soufre
In national currency
 Euro-super 95 In national currency Gas oil automobile Automotive gas oil Dieselkraftstoff Gasoil de chauffage Heating gas oil Heizöl (II) Soufre
In national currency
 Euro-super 95 In national currency Gas oil automobile Automotive gas oil Dieselkraftstoff Gasoil de chauffage Heating gas oil Heizöl (II) Soufre
In national currency. Gas oil automobile Automotive gas oil Dieselkraftstoff (I)
") In national currency Euro-super 95 Gas oil automobile Automotive gas oil Dieselkraftstoff Gasoil de chauffage Heating gas oil Heizöl (II) Soufre
In national currency Euro-super 95 Gas oil automobile Automotive gas oil Dieselkraftstoff Gasoil de chauffage Heating gas oil Heizöl (II) Soufre
NEW PASSENGER CAR REGISTRATIONS EUROPEAN UNION 1
 PRESS EMBARGO: 8.00 AM (7.00 AM GMT), 16 January 2019 NEW PASSENGER CAR REGISTRATIONS EUROPEAN UNION 1 Passenger car registrations: +0.1% in 2018; 8.4% in In 2018, the EU passenger car market declined
May 2014 Euro area unemployment rate at 11.6% EU28 at 10.3%
 STAT/14/103-1 July 2014 May 2014 Euro area unemployment rate at 11.6% EU28 at 10.3% The euro area 1 (EA18) seasonally-adjusted 2 unemployment rate 3 was 11.6% in May 2014, stable compared with April 2014
Greening transport taxation
 Greening transport taxation Jos Dings GBE conference, Budapest, 8 July 2010 www.transportenvironment.org A ranking of transport tax anomalies 1 Tax free aviation 2 Private benefits of company cars 3 Europe
The EU s Advanced Biofuels and Post 2020 policy
 The EU s Advanced Biofuels and Post 2020 policy Rob Vierhout, MSc ISCC fi?h Regional Stakeholder MeeEng 29 September 2016 - Las Vegas Agenda The EU Energy & Climate policy post 2020 Low Emission Mobility
NEW PASSENGER CAR REGISTRATIONS EUROPEAN UNION 1
 PRESS EMBARGO: 8.00 AM (6.00 AM GMT), 17 July 2018 NEW PASSENGER CAR REGISTRATIONS EUROPEAN UNION 1 Passenger car registrations: +2.9% during first half of 2018; +5.2% in In 2018, passenger car registrations
42/ March GDP growth in the euro area and EU28. GDP growth rates % change over the previous quarter, based on seasonally adjusted data
 2007Q1 2007Q2 2007Q3 2007Q4 2008Q1 2008Q2 2008Q3 2008Q4 2009Q1 2009Q2 2009Q3 2009Q4 2010Q1 2010Q2 2010Q3 2010Q4 2011Q1 2011Q2 2011Q3 2011Q4 2012Q1 2012Q2 2012Q3 2012Q4 2013Q1 2013Q2 2013Q3 2013Q4 2014Q1
Winners & Losers by Market - July 2018 vs July 2017
 Countries July 18/17 % Chg LITHUANIA +56,5 CROATIA +43,7 ROMANIA +34,2 HUNGARY +29,0 POLAND +25,7 SPAIN +19,3 FRANCE +18,9 SLOVENIA +17,6 BELGIUM +16,8 PORTUGAL +13,6 AUSTRIA +13,5 GERMANY +12,3 NETHERLANDS
Winners & Losers by Market - April 2017 vs April 2016
 Countries April 17/16 % Chg CROATIA +29,6 1 PORTUGAL +17,8 2 POLAND +14,4 BULGARIA +14,1 LITHUANIA +10,7 SLOVENIA +9,7 HUNGARY +7,7 ROMANIA +7,5 NETHERLANDS +6,3 ESTONIA +4,3 SPAIN +1,1 SLOVAKIA -0,1 CZECH
Winners & Losers by Market - June 2017 vs June 2016
 Countries June 17/16 % Chg ROMANIA +47,0 1 CYPRUS +46,0 2 LITHUANIA +40,6 ESTONIA +33,7 BULGARIA +31,4 SLOVENIA +16,4 SLOVAKIA +14,5 GREECE +14,4 ITALY +12,9 HUNGARY +11,6 ICELAND +10,2 CROATIA +8,8 POLAND
THE EUROPEAN MARKETS AND STRATEGIES TO WATCH FOR MAXIMUM OPPORTUNITY
 THE EUROPEAN MARKETS AND STRATEGIES TO WATCH FOR MAXIMUM OPPORTUNITY BRIAN MADSEN ONLINE AUCTIONS IT SOLUTIONS SMART DATA 1 THE SPEED OF CHANGE IS FASTER THAN EVER 2 THE NEW NORMAL 3 CHANGE OF OWMERSHIP
Operational Leasing in Russia Datamonitor Jugoslav Stojanov, Senior Analyst, Automotive, Datamonitor plc
 1 Emerging Markets in the European Fleet Arena: Template last updated 21.04.05 Operational Leasing in Russia Jugoslav Stojanov, Senior Analyst, Automotive, Datamonitor plc 2 Operational Leasing in Russia
Please note that the fuel cost per 100 km is based on 1,00 /kg (H-Gas) which is the average European price. Download the catalogue
 which is the average European price. Download the catalogue") VEHICLE CATALOGUE JUNE 217 NGVA Europe is a European association that promotes the use of natural and renewable gas as a fuel in vehicles and ships. Founded in 28, it currently comprises more than 13 members
VEHICLE CATALOGUE JUNE 217 NGVA Europe is a European association that promotes the use of natural and renewable gas as a fuel in vehicles and ships. Founded in 28, it currently comprises more than 13 members
NEW PASSENGER CAR REGISTRATIONS EUROPEAN UNION 1
 PRESS EMBARGO: 8.00 AM (6.00 AM GMT), 17 May 2018 NEW PASSENGER CAR REGISTRATIONS EUROPEAN UNION 1 Passenger car registrations: +2.7% four months into 2018; +9.6% in In 2018, the EU passenger car market
NEW PASSENGER CAR REGISTRATIONS EUROPEAN UNION 1
 PRESS EMBARGO: 8.00 AM (7.00 AM GMT), 14 December 2017 NEW PASSENGER CAR REGISTRATIONS EUROPEAN UNION 1 Passenger car registrations: +4.1% over 11 months; +5.9% in In 2017, registrations of new passenger
Euro area unemployment rate at 10.5%
 3/2016-7 January 2016 November 2015 Euro area unemployment rate at 10.5% EU28 at 9.1% The euro area (EA19) seasonally-adjusted unemployment rate was 10.5% in November 2015, down from 10.6% in October 2015,
67 th edition. Renewable energy. Appendices. 44 Other renewables consumption 45 Biofuels production
 Renewable energy 44 Other renewables consumption 45 Biofuels production Appendices A1 Solar Generation A2 Wind Generation A3 Geothermal, biomass and other Generation A4 Geothermal Cumulative installed
exports of goods annual change (%)
") 12.0 Austria s foreign trade 2015 by world region imports of goods 2015 exports of goods 2015 region 1 1 share (%) share (%) Europe 106,984 80.4 104,032 79.1 EU 93,686 70.4 90,841 69.1 EFTA 8,020 6.0 8,098
12.0 Austria s foreign trade 2015 by world region imports of goods 2015 exports of goods 2015 region 1 1 share (%) share (%) Europe 106,984 80.4 104,032 79.1 EU 93,686 70.4 90,841 69.1 EFTA 8,020 6.0 8,098
exports of goods annual change (%)
") 12.0 Austria s foreign trade 2016 by world region imports of goods 2016 exports of goods 2016 region 1 1 share (%) share (%) Europe 110,067 81.2 104,271 79.5 EU 96,801 71.4 91,112 69.4 EFTA 7,718 5.7 8,132
12.0 Austria s foreign trade 2016 by world region imports of goods 2016 exports of goods 2016 region 1 1 share (%) share (%) Europe 110,067 81.2 104,271 79.5 EU 96,801 71.4 91,112 69.4 EFTA 7,718 5.7 8,132
RSWGM meeting European Commission DG MOVE 3-4 April 2017
 Podgorica RSWGM meeting European Commission DG MOVE 3-4 April 2017 Mobility and Transport 1 WHITE PAPER 2011: Towards a zero-vision on road safety POLICY ORIENTATIONS ON ROAD SAFETY 2011-2020 The -50%
Improved timeliness of employment data
 2007Q1 2007Q2 2007Q3 2007Q4 2008Q1 2008Q2 2008Q3 2008Q4 2009Q1 2009Q2 2009Q3 2009Q4 2010Q1 2010Q2 2010Q3 2010Q4 2011Q1 2011Q2 2011Q3 2011Q4 2012Q1 2012Q2 2012Q3 2012Q4 2013Q1 2013Q2 2013Q3 2013Q4 2014Q1
Electric mobility Status, policies and prospects. Clean Transport Forum - 22 September 2016, Bogotá Marine Gorner, International Energy Agency
 Electric mobility Status, policies and prospects Clean Transport Forum - 22 September 216, Bogotá Marine Gorner, International Energy Agency Well to wheel GHG emissions (Gt CO₂) GHG emissions (Gt CO₂)
In national currency. Gas oil automobile Automotive gas oil Dieselkraftstoff (I)
") In national currency Euro-super 95 Gas oil automobile Automotive gas oil Dieselkraftstoff Gasoil de chauffage Heating gas oil Heizöl (II) Soufre
In national currency Euro-super 95 Gas oil automobile Automotive gas oil Dieselkraftstoff Gasoil de chauffage Heating gas oil Heizöl (II) Soufre
NEW PASSENGER CAR REGISTRATIONS EUROPEAN UNION 1
 PRESS EMBARGO: 8.00 AM (6.00 AM GMT), 16 June 2017 NEW PASSENGER CAR REGISTRATIONS EUROPEAN UNION 1 Passenger car registrations: +5.3% five months into 2017; +7.6% in In 2017, passenger car registrations
COMMUNICATION FROM THE COMMISSION TO THE COUNCIL
 EUROPEAN COMMISSION Brussels, 25.10.2017 COM(2017) 622 final COMMUNICATION FROM THE COMMISSION TO THE COUNCIL European Development Fund (EDF): forecasts of commitments, payments and contributions from
Workshop on Road Traffic Statistics
 Document: RTS-2008-2-EN Original: English EU transport statistics Workshop on Road Traffic Statistics Luxembourg, 04-05 November 2008 Bech Building Room BECH QUETELET Beginning 10:00 AM Measuring road
NEW PASSENGER CAR REGISTRATIONS EUROPEAN UNION 1
 PRESS EMBARGO: 8.00 AM (6.00 AM GMT), 14 September 2017 NEW PASSENGER CAR REGISTRATIONS EUROPEAN UNION 1 Passenger car registrations: +4.5% over eight months; +5.6% in August In August 2017, passenger