Overview of Global Fuel Economy Policies
|
|
|
- Delphia Bailey
- 5 years ago
- Views:
Transcription


1 Overview of Global Fuel Economy Policies Zifei Yang Researcher 2018 APCAP Joint Forum and Clean Air Week Theme: Solutions Landscape for Clean Air Bangkok, Mar 20, 2018

2 What is ICCT? ICCT is an independent non-profit research organization that provides technical support on transport efficiency and emission policies in major auto markets 2
3 Outline Motivation of fuel efficiency policies Fuel efficiency standards Fuel efficiency fiscal measurement Fuel efficiency labeling Summary 3
4 1 Background and motivation of fuel efficiency policies 4
5 Vehicles make up more than 20% of greenhouse gas emissions GLOBAL ANTHROPOGENIC EMISSIONS 38 GtCO 2 TRANSPORT EMISSIONS 8.8 GtCO 2 ROAD TRANSPORT EMISSIONS 6.5 GtCO 2 4.6% 10.6% Other 77% Transport 23% 73.9% 46.5% 53.5% 10.9% LEGEND RAIL AVIATION ROAD MARINE HEAVY-DUTY VEHICLES LIGHT-DUTY VEHICLES Notes: Global anthropogenic CO 2 emissions in 2010 based on IPCC (2014). Transport CO 2 emissions in 2010 estimated by ICCT (2014) include the full fuel lifecycle, including direct emissions from combustion & upstream emissions from extraction, refining, & distribution of fuels. Sources: 5
6 Robust vehicle sales growth in ASEAN countries 4,000,000 Vehicle sales per year 3,500,000 3,000,000 2,500,000 2,000,000 1,500,000 OTHERS SINGAPORE VIETNAM PHILIPPINES MALAYSIA THAILAND 1,000, ,000 INDONESIA Indonesia, Thailand, and Malaysia are among the top vehicle markets in the world. 6
7 Integrated Vehicle Efficiency Policy Portfolio VEHICLE FUEL EFFICIENCY STANDARDS FISCAL MEASURES MARKET-BASED APPROACHES Introduce and regularly strengthen mandatory standards Establish and harmonize testing procedures for fuel efficiency measurement. Fuel taxes and vehicle taxes to encourage the purchase of more fuel-efficient vehicles. Infrastructure support and incentive schemes for very fuel-efficient vehicles. Voluntary programs such as U.S. SmartWay and other green freight programs INFORMATION MEASURES Vehicle fuel economy labels Improving vehicle operational efficiency through eco-driving and other measures. 7
8 Performance standards, economic signals, and technological innovation complement each other. VEHICLE PERFORMANCE STANDARDS encourage AUTOMOAKERS to build efficient products Reduce cost VEHICLE AND FUEL FEES AND INCENTIVES encourage CONSUMERS to demand efficient products and drive less TECHNOLOGY INNOVATION AND DEPLOYMENT Slide 8
9 2 Fuel efficiency standards 9
10 The importance of mandatory standards CO 2 performance standards in the European Union New passenger cars CO 2 [in g/km] % % EU-27 new passenger cars CO 2 [in g/km] % target: 130 g/km (ca. 5.1 l/100km) % 1.1% % % % 1.5% 1.0% 1.0% 1.3% 1.6% 0.6% 0.7% % 5.1% 3.7% 3.7% Data sources: ACEA data for EU-15; EU CO 2 monitoring data ( EU-15, EU-25, EU-27). Note that changes in the number of member states (from 15 to 27) have only minor effects on the overall emission level (about 0.5 g CO 2/km) as passenger car sales numbers in the new member states are relatively low % % % % % % 2020 target: 95 g/km (ca. 3.7 l/100km) Annual 4.0% reduction rate 2.0% 0.0% 10
11 Comparison of the adopted standards for efficiency in selected regions New light-duty vehicles New heavy-duty vehicles Region Percent of global LDV sales, 2014 Baseline Model Year Implementation Period Reduction in average CO 2 rate (grams/vehicle-km) Percent of global HDV sales, 2014 Baseline Model Year Implementation Period China 27% % 31% % EU + EFTA 20% % US 17% % 11% % Japan 6% % 5% % Brazil 4% % India 3% % Canada 2% % 1% % South Korea 2% % Mexico 1% % Saudi Arabia 1% % Reduction in average CO 2 rate (grams/vehicle-km) 11
12 Historical fleet CO 2 emissions performance and current standards (gco 2 /km normalized to NEDC) for passenger cars 12

13 Cost-effectiveness analyses of light- and heavy-duty fuel economy and CO 2 standards 13


14 Flexibility system of compliance with standards Corporate average target Except LCV standards in China Credit banking and trading 3-5 years carry forward, 0-3 years carry backward Off-cycle credits Not all off-cycle credits are properly designed Super credits To promote electric and alternative fuel vehicles, with multipliers of 1 to 5 14
15 Effects of off-cycle credits and efficient vehicle credits on CO 2 targets 160 CO 2 emission target under NEDC (g/km) Target with max. off-cycle credits Original target Target with max. off-cycle and efficient vehicle credits 60 US 2025 Canada 2025 EU 2021 Korea 2020 India 2022 China 2020 Japan 2020 Brazil 2017 Saudi Arabia 2020 Mexico
16 Real world emissions are an issue that needs to be addressed 60% Japan: mode Divergence between official and real-world CO 2 emission values 50% 40% 30% 20% 10% 0% U.S.: introduction of Japan: JC08 phase-in 5-cycle method Japan: JC08 EU: NEDC U.S.: CAFE (for U.S. regulations) China: NEDC U.S.: EPA label values (for U.S. consumers) 10% Build year / Model year / Fleet year / Test year 16
17 3 Fuel efficiency fiscal policies 17

18 Fiscal measures to improve fuel efficiency Fiscal policy type Characteristics Vehicle tax/fee based on CO 2 Paid at time of purchase or annually Subsidy for efficient vehicles One-time Feebate Fuel taxes/co 2 taxes Infrastructure support A mix of tax and incentives Paid upon refueling; set by fuel type; Road pricing, VMT taxes, charging stations, discounted electricity 18
19 Vehicle tax is a common measure in Europe 33 European countries CO 2 emissions One-time tax Annual tax Engine features Vehicle features Registration tax (one-time payable) Price Fuel CO 2 emissions Engine features Vehicle features Motor vehicle tax (regularly payable in defined time intervals) Price Fuel Emissions Engine characteristics Vehicle characteristics Price Fuel Emissions Engine characteristics Vehicle characteristics Price Fuel Austria CO 2 emissions Engine power Belgium CO 2 emissions, Euro standards Cylinder capacity Age Fuel type CO 2 emissions Fuel type Bulgaria Engine power Age Croatia CO 2 emissions Price Fuel type Engine power Age Cyprus CO 2 emissions Cylinder capacity CO 2 emissions Czech Republic Euro standards Fuel type Engine capacity Denmark Equipment Price Fuel type Fuel consumption Weight Fuel type Estonia Finland CO 2 emissions Price CO 2 emissions France CO 2 emissions CO 2 emissions Germany CO 2 emissions Cylinder capacity Fuel type Greece CO 2 emissions Price CO 2 emissions Engine capacity Hungary Euro standards Engine capacity Age Fuel type Engine capacity Age Iceland CO 2 emissions CO 2 emissions Ireland CO 2 emissions Price CO 2 emissions Italy Engine power Euro standards Engine power Latvia CO 2 emissions Engine capacity Liechtenstein Weight Lithuania Luxembourg CO 2 emissions Fuel type Malta CO 2 emissions Length Price Fuel type CO 2 emissions Age Fuel type Netherlands CO 2 emissions, fuel consumption Fuel type CO 2 emissions Weight Fuel type Norway CO 2 emissions, NOx emissions Weight Fuel type Poland Engine capacity Price Portugal CO 2 emissions Cylinder capacity Fuel type CO 2 emissions Cylinder capacity Fuel type Romania Engine capacity Slovakia Engine power Age Cylinder capacity Age Slovenia CO 2 emissions Price Fuel type Cylinder capacity Spain CO 2 emissions Engine power Sweden CO 2 emissions Weight Fuel type Cylinder capacity, Switzerland Price Weight enigne power Turkey Engine power Price Engine capacity Age United CO 2 emissions Fuel type CO 2 emissions Engine capacity Price Fuel type Kingdom 19 Number of countries
20 CO 2 -based fee, rebate, or feebate program Feebates = fee + rebate Higher efficiency vehicles receive rebates Lower efficiency vehicles pay fees Fee 0 (Pivot point) Rebate CO 2 emission 20

21 Canadian fiscal system that did not work well Rebate $1,000 Toyota Yaris 6.4 l/100km Sales +49% Honda Fit 6.6 l/100km Sales +3% $0 Fee 6.5 Fuel Consumption liters/100 km Canada discontinued rebates early ran out of money because too many vehicles were shifted to < 6.4 l/100km
22 The design of the rebate influences how manufacturers response Tax-optimized vehicles Link to the report: Optimizing to the last digit: how taxes influence vehicle CO2 emission level 22
23 Gradually optimized system 23
24 High incentive level leads to high sales necessary but not sufficient! ct.org/drivingelectrificationglobalcomparisonfiscal-policyelectricvehicles 24

25 Emerging electric vehicle capitals 25
26 4 Fuel efficiency labeling 26


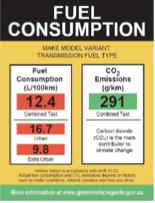
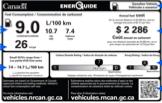
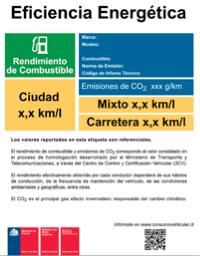
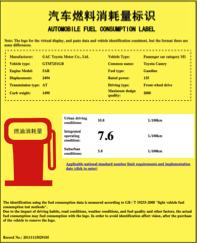
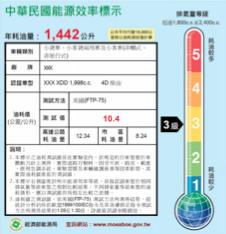
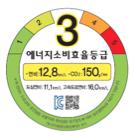
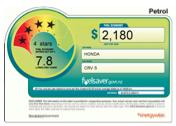
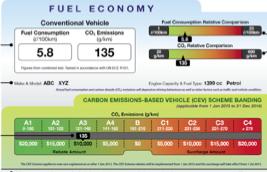
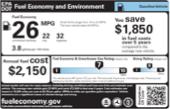
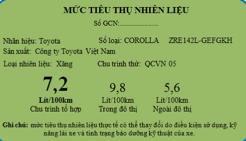
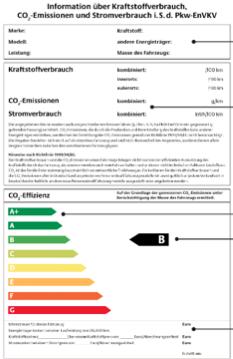
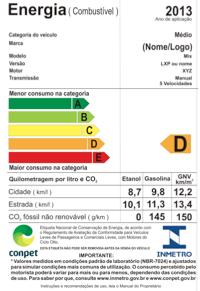
27 Vehicle fuel economy labeling schemes VFEL schemes include The fuel economy label referring information that is displayed about the car in the showroom, online or through other media Associated consumer information campaign 27

28 Vehicle fuel economy labeling (VFEL) makes an impact Raise consumer awareness Enable other policies Fuel economy standards Fiscal incentive Influence consumer purchase decision Influence manufacture technology investment strategy Promote vehicle fuel economy 28
29 Implementation of vehicle fuel economy labeling scheme MANDATE VOLUNTARY Japan China Market size covered by program US South Korea Canada Australia Germany New Zealand India Chile Vietnam Thailand UK Austria Netherlands Chinese Taipei Singapore Saudi Arabia Brazil 29


30 Six key elements for VFEL programs Management Empower agencies Reflect other FE policies Periodic Regulatory framework Ensure label credibility Monitor compliance Performance assessment Program design VFEL Compliance and enforcement Label design and information Consumer outreach Consumer 30
31 Conclusions Fuel economy standards are one of the most cost effective and politically attractive carbon mitigation measures Emerging markets are considering adopting fiscal measures such as feebates (which are easier to development and implement), especially in the context of promoting EVs Fuel efficiency labeling is widely spread in many markets Nations may want to consider regional collaborations to develop and implement policy actions across a wider market. 31
32 How are we doing against GFEI target to double fuel economy for new passenger vehicles by 2030? lifecycle CO 2 emissions! [billion metric tons per year]! 7.0! 6.0! 5.0! 4.0! 6.1! 4.7! 3.9! 35! 30! 25! 20! fuel consumption! [million barrels of oil per day]! 3.0! 3.2! 15! 2.0! 1.0! Business as usual! Adopted! GFEI Target! 10! 5! 0.0! 2010! 2015! 2020! 2025! 2030! Estimated using ICCT's Global Transportation Roadmap model (Facanha, et al., 2012). Business as usual = vehicle efficiency remains at 2005 levels. Adopted = currently adopted policies. GFEI Target = countries adopt standards that reduce average fuel consumption of new vehicles to 50% below 2005 levels by 2030 (GFEI, 2014). 0! 32
33 A ~70 g/km (NEDC) target by 2025 can be achieved cheaper if transitioning to electric vehicles earlier CO 2 target Total cost (2014 ) Electric vehicles (NEDC) market share 80 g/km 300-1, , % 70 g/km 650-1, , % 60 g/km 1,000-2, , % 50 g/km 1,300-2,950 1,000-2, % 40 g/km 1,650-3,500 1,250-2, % 33 Source:
Overview of Global Fuel Economy Policies
 Overview of Global Fuel Economy Policies Zifei Yang Researcher 2018 APCAP Joint Forum and Clean Air Week Theme: Solutions Landscape for Clean Air Bangkok, Mar 20, 2018 What is ICCT? ICCT is an independent
Vehicle Fuel Economy Standards and Feebate System
 Vehicle Fuel Economy Standards and Feebate System Zifei Yang Researcher ACEEE International Symposium on Energy Efficiency Washington DC, June 26, 2018 What is ICCT? ICCT is an independent non-profit research
Fiscal incentives and Feebates as tools for improving efficiency in transport sector
 Fiscal incentives and Feebates as tools for improving efficiency in transport sector Zifei Yang Researcher Taller sobre Propuestas para Impuestos e Incentivos para Promover la Importación de Vehículos
Infographics on Electromobility (January 2019)
") Infographics on Electromobility (January 2019) Publisher: BMW Group Corporate Communications Electromobility Last Update: 04.01.2019 Contact: presse@bmw.de ELECTROMOBILITY IN GERMANY. SHARE IN NEW REGISTRATIONS
Infographics on Electromobility (January 2019) Publisher: BMW Group Corporate Communications Electromobility Last Update: 04.01.2019 Contact: presse@bmw.de ELECTROMOBILITY IN GERMANY. SHARE IN NEW REGISTRATIONS
1. INTERNATIONAL OVERVIEW. 1.0 Area and population. population (1,000) area
 area") 1.0 Area and population area population (1,000) km 2 2000 2010 2018 1 inhabitants per km 2 Belgium 30,530 10,251 10,920 11,443 375 Germany 357,380 82,212 81,777 82,952 232 Estonia 45,230 1,397 1,331 1,315
1.0 Area and population area population (1,000) km 2 2000 2010 2018 1 inhabitants per km 2 Belgium 30,530 10,251 10,920 11,443 375 Germany 357,380 82,212 81,777 82,952 232 Estonia 45,230 1,397 1,331 1,315
Move forward fuel efficiency policy in Vietnam
 The ASEAN German Technical Cooperation Programme Cities, Environment and Transport Move forward fuel efficiency policy in Vietnam Alex Körner alex_koerner@gmx.de March 29 Hanoi Content Introduction: Some
ACEA Report. Vehicles in use Europe 2017
 ACEA Report Vehicles in use Europe 2017 TABLE OF CONTENTS Summary... 2 Vehicles in use in Europe... 3 Passenger cars... 3 Light commercial vehicles... 4 Medium and heavy commercial vehicles... 5 Buses...
AUSTRIA. Table 1. FDI flows in the host economy, by geographical origin. (Millions of US dollars)
") Table 1. FDI flows in the host economy, by geographical origin World 5 690 138 6 195 3 184 10 784 7 933 31 154 6 858 9 303 840 10 618 5 760 Developed economies 5 740 13 5 341 2 689 10 137 6 291 29 721
Table 1. FDI flows in the host economy, by geographical origin World 5 690 138 6 195 3 184 10 784 7 933 31 154 6 858 9 303 840 10 618 5 760 Developed economies 5 740 13 5 341 2 689 10 137 6 291 29 721
Thermal Coal Market Presentation to UNECE Ad Hoc Group of Experts on Coal in Sustainable Development December 7, 2004
 Thermal Coal Market Presentation to UNECE Ad Hoc Group of Experts on Coal in Sustainable Development December 7, 2004 Barlow Jonker Pty Ltd Commercial in Confidence 1 Presentation Outline 1. Barlow Jonker
ACEA Report. Vehicles in use Europe 2018
 ACEA Report Vehicles in use Europe 2018 TABLE OF CONTENTS Summary... 2 Vehicles in use in Europe... 3 Passenger cars... 3 Light commercial vehicles... 4 Medium and heavy commercial vehicles... 5 Buses...
NEW ALTERNATIVE FUEL VEHICLE REGISTRATIONS IN THE EUROPEAN UNION 1 Q1 2015
 NEW ALTERNATIVE FUEL VEHICLE REGISTRATIONS IN THE Q1 2015 ALTERNATIVE FUEL VEHICLE registrations: +28.8% in in first quarter In the first quarter of 2015, total alternative fuel vehicle (AFV) registrations
NEW ALTERNATIVE FUEL VEHICLE REGISTRATIONS IN THE EUROPEAN UNION 1 Q2 2015
 NEW ALTERNATIVE FUEL VEHICLE REGISTRATIONS IN THE Q2 2015 New alternative fuel vehicle (AFV) registrations in the EU by engine type Q2 2014 Q2 2015 Thousand units 70 60 50 40 30 20 10 0 EVs HEVs AFVs other
Total credit to the non-financial sector (core debt), % of GDP Table F1.1
, % of GDP Table F1.1") Total credit to the non-financial sector (core debt), % of GDP Table F1.1 2012 2013 2014 2015 2016 Q2 16 Q3 16 Q4 16 Q1 17 Q2 17 Argentina 62.6 66.4 64.6 75.5 75.3 81.7 80.1 75.3 71.6 72.7 Australia 208.0
Total credit to the non-financial sector (core debt), % of GDP Table F1.1 2012 2013 2014 2015 2016 Q2 16 Q3 16 Q4 16 Q1 17 Q2 17 Argentina 62.6 66.4 64.6 75.5 75.3 81.7 80.1 75.3 71.6 72.7 Australia 208.0
Taxing Petrol and Diesel
 Taxing Petrol and Diesel Colm Farrell Key Point Under the polluter pays principle, tax rates on diesel and petrol fuels should be at a rate which is commensurate with the total environmental costs they
Improving Fuel Economy in Southeast Asia
 Improving Fuel Economy in Southeast Asia Bert Fabian, Programme Officer, Transport Unit, UN Environment 29 March 2017, Bangkok, Thailand UN Environment Promoting Sustainable Low Emissions Transport Avoid
NEW COMMERCIAL VEHICLE REGISTRATIONS EUROPEAN UNION 1 February 2018
 PRESS EMBARGO: NEW COMMERCIAL VEHICLE REGISTRATIONS EUROPEAN UNION 1 February 2018 Next press release: Tuesday 24 April 2018 1 Malta not available Page 1 of 7 Commercial vehicle registrations: +6.5% first
BP Statistical Review of World Energy June 2017
 BP Statistical Review of World Energy June 217 Primary energy 8 Consumption 8 Consumption by fuel 9 66 th edition Primary energy Consumption* Growth rate per annum Million tonnes oil equivalent 26 27 28
NEW COMMERCIAL VEHICLE REGISTRATIONS EUROPEAN UNION 1. October 2016
 PRESS EMBARGO: NEW COMMERCIAL VEHICLE REGISTRATIONS EUROPEAN UNION 1 October 2016 Next press release: Thursday 22 December 2016 1 Data for Malta unavailable Page 1 of 7 Commercial vehicle registrations:
UAE draft regulation for Electric Vehicle
 UAE draft regulation for Electric Vehicle Emirates Authority for Standardization and Metrology Eng. Khaled Ali Abdullmajeed Contents - Introduction of ESMA. - Introduction of EV Regulation in UAE - The
Fuel Economy Policy for the Transport Sector in the ASEAN Region
 The ASEAN German Technical Cooperation Programme Cities, Environment and Transport Fuel Economy Policy for the Transport Sector in the ASEAN Region Alex Körner alex_koerner@gmx.de Sustainable Energy &
NEW PASSENGER CAR REGISTRATIONS BY ALTERNATIVE FUEL TYPE IN THE EUROPEAN UNION 1 Quarter
 PRESS EMBARGO: NEW PASSENGER CAR REGISTRATIONS BY ALTERNATIVE FUEL TYPE IN THE EUROPEAN UNION 1 Quarter 3 2017 Alternative fuel vehicle registrations: +51.4% in third quarter of 2017 In the third quarter
BREXIT AND THE AUTO INDUSTRY: FACTS AND FIGURES
 BREXIT AND THE AUTO INDUSTRY: FACTS AND FIGURES GLOBAL TRADE European Union EU vehicle imports: Total value: 45,693 million Quantity: 3,395,419 units EU vehicle exports: Total value: 135,398 million Quantity:
NEW COMMERCIAL VEHICLE REGISTRATIONS EUROPEAN UNION 1. December 2018
 PRESS EMBARGO: NEW COMMERCIAL VEHICLE REGISTRATIONS EUROPEAN UNION 1 December 2018 Commercial vehicle registrations: +3.2% in 2018; 4.0% in December Total new commercial vehicles In December 2018, commercial
NEW COMMERCIAL VEHICLE REGISTRATIONS EUROPEAN UNION 1. April 2017
 PRESS EMBARGO: NEW COMMERCIAL VEHICLE REGISTRATIONS EUROPEAN UNION 1 April 2017 Next press release: Friday 23 June 2017 1 Data for Malta unavailable Page 1 of 7 Commercial vehicle registrations: +3.8%
BREXIT AND THE AUTO INDUSTRY: FACTS AND FIGURES
 BREXIT AND THE AUTO INDUSTRY: FACTS AND FIGURES GLOBAL TRADE European Union EU vehicle imports: Total value: 48,019 million Quantity: 3,640,975 units EU vehicle exports: Total value: 138,536 million Quantity:
STATISTICAL ANNEX NOTE ON QUARTERLY PROJECTIONS
 OECD Economic Outlook, Volume 2017 Issue 1 OECD 2017 This annex contains data on key economic series which provide a background to the recent economic developments in the OECD area described in the main
NEW COMMERCIAL VEHICLE REGISTRATIONS EUROPEAN UNION 1. November 2018
 PRESS EMBARGO: NEW COMMERCIAL VEHICLE REGISTRATIONS EUROPEAN UNION 1 November 2018 Commercial vehicle registrations: +3.8% 11 months into 2018; +2.7% in November Total new commercial vehicles In November
NEW PASSENGER CAR REGISTRATIONS BY FUEL TYPE IN THE EUROPEAN UNION 1
 PRESS EMBARGO: NEW PASSENGER CAR REGISTRATIONS BY FUEL TYPE IN THE EUROPEAN UNION 1 Quarter 3 2018 Fuel types of new cars: diesel 18.2%, petrol +15.2%, electric +30.0% in third quarter of 2018 In the third
NEW PASSENGER CARS BY FUEL TYPE IN THE EUROPEAN UNION 1 Quarter
 PRESS EMBARGO: NEW PASSENGER CARS BY FUEL TYPE IN THE EUROPEAN UNION 1 Quarter 1 2018 Next press release: Thursday 6 September 2018 1 Data for Croatia, Cyprus, Luxembourg and Malta is not available Page
NEW PASSENGER CARS BY FUEL TYPE IN THE EUROPEAN UNION 1 Quarter
 PRESS EMBARGO: NEW PASSENGER CARS BY FUEL TYPE IN THE EUROPEAN UNION 1 Quarter 1 2018 Next press release: Thursday 6 September 2018 1 Data for Croatia, Cyprus, Luxembourg and Malta is not available Page
Improving fuel economy and integrating electric vehicles
 Improving fuel economy and integrating electric vehicles Air Quality & Mobility Unit March 2018 Global Fuel Economy Initiative Doubling LDV Fuel Efficiency Worldwide by 2050 Slowing improvement in OECD
NEW PASSENGER CAR REGISTRATIONS EUROPEAN UNION 1
 PRESS EMBARGO: 8.00 AM (6.00 AM GMT), 19 September 2018 NEW PASSENGER CAR REGISTRATIONS EUROPEAN UNION 1 Passenger car registrations: +6.1% eight months into 2018; +10.5% in July and +31.2% in August In
NEW COMMERCIAL VEHICLE REGISTRATIONS EUROPEAN UNION* September 2014
 PRESS EMBARGO: 8.00 A.M. (7.00 A.M GMT), October 28, 2014 NEW COMMERCIAL VEHICLE REGISTRATIONS EUROPEAN UNION* September 2014 Next Press Release: November 27, 2014 *Data for Malta unavailable Page 1 of
WLTP for fleet. How the new test procedure affects the fleet business
 WLTP for fleet How the new test procedure affects the fleet business Editorial Ladies and Gentlemen, The automotive industry is facing a major transformation process that will also affect the fleet business
67 th edition. Renewable energy. Appendices. 44 Other renewables consumption 45 Biofuels production
 Renewable energy 44 Other renewables consumption 45 Biofuels production Appendices A1 Solar Generation A2 Wind Generation A3 Geothermal, biomass and other Generation A4 Geothermal Cumulative installed
ASEAN International Merchandise Trade Statistics Yearbook 2014
 International Merchandise Trade Statistics Yearbook 2014 The Secretariat Jakarta The Association of Southeast Asian Nations () was established on 8 August 1967. The Member States of the Association are
The Global Fuel Economy Initiative. Jane Akumu UN Environment
 The Global Fuel Economy Initiative Jane Akumu UN Environment Historical High Growth Has Made Vehicles An Important Contributor To Local, Regional and Global Pollution Vehicle fleet to triple (from ~1 billion
June EU Countries NEW COMMERCIAL VEHICLE REGISTRATIONS. PRESS EMBARGO FOR ALL DATA: July 26, 2013, 8.00 A.M. (6.00 A.M. GMT)
") PRESS EMBARGO FOR ALL DATA: y 26, 213, 8. A.M. (6. A.M. GMT) Press s Release e e NEW COMMERCIAL VEHICLE REGISTRATIONS e 213 EU Countries 15, LCVs up to 3.5t 2, Heavy Trucks of 16t and over ons New Registrati
PRESS EMBARGO FOR ALL DATA: y 26, 213, 8. A.M. (6. A.M. GMT) Press s Release e e NEW COMMERCIAL VEHICLE REGISTRATIONS e 213 EU Countries 15, LCVs up to 3.5t 2, Heavy Trucks of 16t and over ons New Registrati
NEW PASSENGER CAR REGISTRATIONS BY ALTERNATIVE FUEL TYPE IN THE EUROPEAN UNION 1 Quarter
 PRESS EMBARGO: NEW PASSENGER CAR REGISTRATIONS BY ALTERNATIVE FUEL TYPE IN THE EUROPEAN UNION 1 Quarter 2 2016 Alternative fuel vehicle registrations: +0.6% in second quarter of 2016 In the second quarter
Energy efficiency policies and measures in transport in the EU 27, Norway and Croatia
 ODYSSEE MURE Final Meeting Paris, May 18-19 2009 Energy efficiency policies and measures in transport in the EU 27, Norway and Croatia B Lapillonne Karine Pollier Enerdata Content Overview of measures:
Monitoring the CO 2 emissions from new passenger cars in the EU: summary of data for 2010
 Monitoring the CO 2 emissions from new passenger cars in the EU: summary of data for 2010 EXECUTIVE SUMMARY EEA has collected data submitted by Member States on vehicle registrations in the year 2010,
I. World trade in Overview
 I. World trade in - Overview Table I.1 Growth in the volume of world merchandise exports and production, 2-5 (Annual percentage change) 2-5 23 24 World merchandise exports 4.5 5. 9.5 6. Agricultural products
Emissions per capita and GDP
 Emissions per capita and GDP (1990 -) CEIP Centre on Emission Inventories and Projections Emissions per capita and emissions per GDP were calculated for all years from 1990 to where data was available
Fuel Economy Policy Pathways for the ASEAN Region
 Fuel Economy Policy Pathways for the ASEAN Region Fuel economy standards in Asia Few Asian countries have fuel economy standards but growing over the years! Standards for passenger cars (LDV) are given
Primary energy. 8 Consumption 9 Consumption by fuel. 67 th edition
 Primary energy 8 Consumption 9 Consumption by fuel 67 th edition Primary energy Consumption* Growth rate per annum Million tonnes oil equivalent 27 28 29 2 211 212 213 214 215 216 217 217 26-16 Share 217
Imports of seed for sowing by country Calendar year 2011 Source: ISF compilation based on official statistics and international seed trade reports
 USA 157,432 15,562 464 173,458 523 318 67 908 Germany 195,159 5,913 520 201,592 595 97 22 714 France 125,701 4,389 277 130,367 522 150 11 683 Netherlands 140,899 12,253 796 153,948 250 330 48 628 Italy
exports of goods annual change (%)
") 12.0 Austria s foreign trade 2015 by world region imports of goods 2015 exports of goods 2015 region 1 1 share (%) share (%) Europe 106,984 80.4 104,032 79.1 EU 93,686 70.4 90,841 69.1 EFTA 8,020 6.0 8,098
12.0 Austria s foreign trade 2015 by world region imports of goods 2015 exports of goods 2015 region 1 1 share (%) share (%) Europe 106,984 80.4 104,032 79.1 EU 93,686 70.4 90,841 69.1 EFTA 8,020 6.0 8,098
exports of goods annual change (%)
") 12.0 Austria s foreign trade 2016 by world region imports of goods 2016 exports of goods 2016 region 1 1 share (%) share (%) Europe 110,067 81.2 104,271 79.5 EU 96,801 71.4 91,112 69.4 EFTA 7,718 5.7 8,132
12.0 Austria s foreign trade 2016 by world region imports of goods 2016 exports of goods 2016 region 1 1 share (%) share (%) Europe 110,067 81.2 104,271 79.5 EU 96,801 71.4 91,112 69.4 EFTA 7,718 5.7 8,132
Passenger cars in the EU
 Passenger cars in the EU Statistics Explained Data extracted in April 2018 Planned article update: April 2019 This article describes developments in passenger car stocks and new registrations in the European
Global Dialysis - Cost per Dialysis Session
 Cost per session for dialysis where a cost has been entered for a dialysis centre. All costs have been converted to US Dollars as at 19 May 2006. Note that the costs do not state what is covered by a dialysis
Technologies for Urban Transport
 Downloaded from orbit.dtu.dk on: Dec 19, 2017 Technologies for Urban Transport Dhar, Subash; Shukla, P.R. Publication date: 2013 Link back to DTU Orbit Citation (APA): Dhar, S., & Shukla, P. R. (2013).
NEW PASSENGER CAR REGISTRATIONS BY ALTERNATIVE FUEL TYPE IN THE EUROPEAN UNION 1 Quarter
 PRESS EMBARGO: NEW PASSENGER CAR REGISTRATIONS BY ALTERNATIVE FUEL TYPE IN THE EUROPEAN UNION 1 Quarter 2 2017 Alternative fuel vehicle registrations: +38.0% in second quarter of 2017 In the second quarter
How to notify a waste shipment.
 How to notify a waste shipment. Outline of Presentation What do I have to notify? How do I go about this? Problem areas Sources of guidance Contact details Which wastes do I have to notify? Re-cap Notification
AlixPartners Automotive Electrification Index. Second Quarter 2017
 AlixPartners Automotive Electrification Index Second Quarter 217 AlixPartners Automotive Electrification Index e-range E-RANGE = Sum of electric range of all electric vehicles (EV) sold By automaker, segment,
Over time consistency of PPP results in the OECD countries
 Public Disclosure Authorized Public Disclosure Authorized Public Disclosure Authorized Public Disclosure Authorized International Comparison Program Over time consistency of PPP results in the OECD countries
STATISTISCHER ANHANG VORLÄUFIGE AUSGABE
 OECD-Wirtschaftsausblick Ausgabe 2013/1 OECD 2013 STATISTISCHER ANHANG VORLÄUFIGE AUSGABE Die statistischen Daten für Israel wurden von den zuständigen israelischen Stellen bereitgestellt, die für sie
Winners & Losers by Market - January 2019 vs January 2018
 Countries 19/18 % Chg LITHUANIA +49,0 ROMANIA +18,8 HUNGARY +9,2 PORTUGAL +8,3 DENMARK +7,0 GREECE +3,7 LATVIA +0,7 POLAND -0,3 FRANCE -1,1 GERMANY -1,4 UNITED KINGDOM -1,6 NORWAY -2,2 LUXEMBOURG -3,4
Production of heat by type Terajoules
 Production of heat by type Table Notes geo represents heat used directly for district heating, agriculture etc. without a commercial transaction taking place. Please refer to the Definitions Section on
June EU Countries NEW COMMERCIAL VEHICLE REGISTRATIONS. PRESS EMBARGO FOR ALL DATA: July 26, 2012, 8.00 A.M. (6.00 A.M. GMT) LCVs up to 3.
 LCVs up to 3.") PRESS EMBARGO FOR ALL DATA: y 26, 212, 8. A.M. (6. A.M. GMT) Press s Release e e NEW COMMERCIAL VEHICLE REGISTRATIONS e 212 EU Countries 15, LCVs up to 3.5t 2, Heavy Trucks over 16t New Regis strations
PRESS EMBARGO FOR ALL DATA: y 26, 212, 8. A.M. (6. A.M. GMT) Press s Release e e NEW COMMERCIAL VEHICLE REGISTRATIONS e 212 EU Countries 15, LCVs up to 3.5t 2, Heavy Trucks over 16t New Regis strations
NEW PASSENGER CAR REGISTRATIONS EUROPEAN UNION 1
 PRESS EMBARGO: 8.00 AM (7.00 AM GMT), 14 December 2017 NEW PASSENGER CAR REGISTRATIONS EUROPEAN UNION 1 Passenger car registrations: +4.1% over 11 months; +5.9% in In 2017, registrations of new passenger
OECD unemployment rate stable at 5.4% in March 2018
 OECD unemployment rate stable at.4% in March 2018 The OECD unemployment rate remained stable at.4% in March 2018. Across the OECD area, 34 million people were unemployed, 1.4 million more than in April
Auto Fuel Economy Policy: An Opportunity to Choose Clean Mobility
 Auto Fuel Economy Policy: An Opportunity to Choose Clean Mobility Air Quality & Mobility Unit March 2018 Technology Choosers vs. Technology Takers Global Fuel Economy Initiative Auto fuel economy: rate
NEW PASSENGER CAR REGISTRATIONS EUROPEAN UNION 1
 PRESS EMBARGO: 8.00 AM (6.00 AM GMT), 17 May 2018 NEW PASSENGER CAR REGISTRATIONS EUROPEAN UNION 1 Passenger car registrations: +2.7% four months into 2018; +9.6% in In 2018, the EU passenger car market
OECD unemployment rate stable at 5.3% in July 2018
 OECD unemployment rate stable at.3% in July 208 The OECD unemployment rate was stable at.3% in July 208. Across the OECD, 33. million people were unemployed,.7 million less than the peak in January 203
NEW PASSENGER CAR REGISTRATIONS EUROPEAN UNION 1
 PRESS EMBARGO: 8.00 AM (6.00 AM GMT), 15 June 2018 NEW PASSENGER CAR REGISTRATIONS EUROPEAN UNION 1 Passenger car registrations: +2.4% five months into 2018; +0.8% in In 2018, the EU passenger car market
Civil Dialogue Group on WINE Thursday April 19th, 2018
 COMMISSION EUROPÉENNE DIRECTION GÉNÉRALE DE L'AGRICULTURE ET DU DÉVELOPPEMENT RURAL Directorate G. Markets and Observatories G.2. Wine, spirits and horticultural products Bruxelles, le G.2/GD(2017) Civil
OECD unemployment rate falls to 6.0% in March 2017
 OECD unemployment rate falls to 6.0% in March 017 The OECD unemployment rate for the population as a whole fell by 0.1 percentage point, to 6.0%, in March 017. Across the OECD area, 37.5 million people
Spain s exports by oil product group and country of destination
 Corporación de Reservas Estratégicas de Productos Petrolíferos Castellana, 79 28046 Madrid T. +34 91 360 09 10 Updated F. +34 91 420 on39 45 www.cores.es February 13 th 2017 Spain s exports by oil product
December 2011 compared with November 2011 Industrial producer prices down by 0.2% in both euro area and EU27
 18/2012-2 February 2012 December 2011 compared with November 2011 Industrial producer prices down by 0.2% in both euro area and EU27 In December 2011, compared with November 2011, the industrial producer
KINGDOM OF CAMBODIA NATION RELIGION KING 3
 KINGDOM OF CAMBODIA NATION RELIGION KING 3 TOURISM STATISTICS REPORT October 2018 MINISTRY OF TOURISM Statistics and Tourism Information Department No. A3, Street 169, Sangkat Veal Vong, Khan 7 Makara,
KINGDOM OF CAMBODIA NATION RELIGION KING 3
 KINGDOM OF CAMBODIA NATION RELIGION KING 3 TOURISM STATISTICS REPORT September 2018 MINISTRY OF TOURISM Statistics and Tourism Information Department No. A3, Street 169, Sangkat Veal Vong, Khan 7 Makara,
September 2011 compared with August 2011 Industrial producer prices up by 0.3% in euro area Up by 0.4% in EU27
 161/2011-4 November 2011 September 2011 compared with August 2011 Industrial producer prices up by 0.3% in euro area Up by 0.4% in EU27 In September 2011 compared with August 2011, the industrial producer
NEW PASSENGER CAR REGISTRATIONS EUROPEAN UNION 1
 PRESS EMBARGO: 8.00 AM (6.00 AM GMT), 17 July 2018 NEW PASSENGER CAR REGISTRATIONS EUROPEAN UNION 1 Passenger car registrations: +2.9% during first half of 2018; +5.2% in In 2018, passenger car registrations
An overview of International Policies on Vehicle Fuel Economy. Jane Akumu UN Environment
 An overview of International Policies on Vehicle Fuel Economy Jane Akumu UN Environment Fuel economy policies & instruments Target group: Consumer Monetary Fiscal instruments FE Consumer information Labelling
NEW PASSENGER CAR REGISTRATIONS EUROPEAN UNION 1
 PRESS EMBARGO: 8.00 AM (7.00 AM GMT), 15 February 2019 NEW PASSENGER CAR REGISTRATIONS EUROPEAN UNION 1 Passenger car registrations: 4.6% in 2019 In 2019, the European passenger car market saw a slow start
Global transport outlook to 2050 Targets and scenarios for a low-carbon transport sector
 OECD/IEA 2012 Global transport outlook to 2050 Targets and scenarios for a low-carbon transport sector John Dulac Energy Analyst, Energy Technology Policy Division International Energy Agency Content IEA
Access to the market & profession: quality-based regulations
 Access to the market & profession: quality-based regulations SSATP REC-TCC meeting 2-6 July 2018 Abuja iru.org 1. ECMT Quality Charter Multi-lateral permits a step towards a liberalised international market
NEW PASSENGER CAR REGISTRATIONS EUROPEAN UNION 1
 PRESS EMBARGO: 8.00 AM (6.00 AM GMT), 19 April 2017 NEW PASSENGER CAR REGISTRATIONS EUROPEAN UNION 1 Passenger car registrations: +8.4% first three months of 2017; +11.2% in In 2017, EU passenger car registrations
Mileage-based User Fees In Europe and USA
 Mileage-based User Fees In Europe and USA Dr. Toshinori Nemoto Professor at Hitotsubashi University The 31th Japan Road Congress International symposium: Road-tolling policies and technologies October
OECD unemployment rate down to 6.4% in March 2016
 OECD unemployment rate down to 6.4% in March 2016 The OECD unemployment rate fell by 0.1 percentage point to 6.4% in March 2016, 1.7 percentage point below the January 2013 peak. Across the OECD area,
RISK DASHBOARD ANNEX CREDIT RISK PARAMETERS Q2 2017
 RISK DASHBOARD ANNEX CREDIT RISK PARAMETERS Q2 2017 Corporates 4 0.57% 0.81% 0.84% 0.81% 4 8.75% 17.51% 26.12% 22.73% 57 0.23% 0.45% 1.66% 1.64% 58 33.81% 42.41% 45.00% 29.97% Corporates - Of Which: Specialised
RISK DASHBOARD ANNEX CREDIT RISK PARAMETERS Q4 2017
 RISK DASHBOARD ANNEX CREDIT RISK PARAMETERS Q4 2017 Corporates 10 1.22% 4.02% 26.81% 1.95% 9 15.68% 32.84% 36.64% 31.60% 51 0.20% 1.00% 4.08% 2.02% 54 34.12% 43.96% 45.10% 29.73% Corporates - Of Which:
Winners & Losers by Market - December 2018 vs December 2017
 Countries December 18/17 % Chg LITHUANIA +24,8 CROATIA +16,1 NETHERLANDS +15,3 ROMANIA +12,3 ITALY +2,0 GREECE -1,1 SPAIN -3,5 PORTUGAL -5,3 CYPRUS -5,3 POLAND -5,5 UNITED KINGDOM -5,5 GERMANY -6,7 LUXEMBOURG
Table B1. Advanced Economies: Unemployment, Employment, and Real per Capita GDP (Percent)
") Statistical Appendix Table B1. Advanced Economies: Unemployment, Employment, and Real per Capita GDP (Percent) Unemployment Rate 2 Averages 1 1993 2002 2003 12 Advanced Economies 6.8 6.9 6.7 6.5 6.3 5.8
Statistical Appendix Table B1. Advanced Economies: Unemployment, Employment, and Real per Capita GDP (Percent) Unemployment Rate 2 Averages 1 1993 2002 2003 12 Advanced Economies 6.8 6.9 6.7 6.5 6.3 5.8
TAXATION N 322 JC/ 49 /14 LC/ 39 /14 BARS/ 25 /14 WG-TX/ 2 /14 WG-CO2/ 23 /14 WG-EV/ 4 /14 WG-CSG/ 10 /14
 Brussels, 3 April 2014 TAXATION N 322 JC/ 49 /14 LC/ 39 /14 BARS/ 25 /14 WG-TX/ 2 /14 WG-CO2/ 23 /14 WG-EV/ 4 /14 WG-CSG/ 10 /14 Subject: Overview of C2 taxes and incentives for EVs Dear colleagues, Please
KINGDOM OF CAMBODIA NATION RELIGION KING 3
 KINGDOM OF CAMBODIA NATION RELIGION KING 3 TOURISM STATISTICS REPORT March 2015 MINISTRY OF TOURISM Statistics and Tourism Information Department No. A3, Street 169, Sangkat Veal Vong, Khan 7 Makara, Phnom
Production of heat by type Terajoules
 Production of heat by type Table Notes geo represents heat used directly for district heating, agriculture etc. without a commercial transaction taking place. represents heat used for the production of
Technology and policy drivers of the fuel economy of new light-duty vehicles Comparative analysis across selected automotive markets
 Technology and policy drivers of the fuel economy of new light-duty vehicles Comparative analysis across selected automotive markets Pierpaolo Cazzola, International Energy Agency Content GFEI and the
NEW PASSENGER CAR REGISTRATIONS EUROPEAN UNION 1
 PRESS EMBARGO: 8.00 AM (7.00 AM GMT), 15 February 2018 NEW PASSENGER CAR REGISTRATIONS EUROPEAN UNION 1 Passenger car registrations: +7.1% in 2018 In 2018, demand for passenger cars in the European Union
Winners & Losers by Market - September 2018 vs September 2017
 Countries September 18/17 % Chg BULGARIA +8,5 CROATIA +3,3 SLOVENIA -7,3 HUNGARY -7,4 LITHUANIA -8,3 CYPRUS -9,9 LATVIA -11,0 FRANCE -12,8 PORTUGAL -14,0 DENMARK -16,0 NETHERLANDS -16,7 SWITZERLAND -16,8
KINGDOM OF CAMBODIA NATION RELIGION KING 3
 KINGDOM OF CAMBODIA NATION RELIGION KING 3 TOURISM STATISTICS REPORT December 2015 MINISTRY OF TOURISM Statistics and Tourism Information Department No. A3, Street 169, Sangkat Veal Vong, Khan 7 Makara,
Winners & Losers by Market - July 2018 vs July 2017
 Countries July 18/17 % Chg LITHUANIA +56,5 CROATIA +43,7 ROMANIA +34,2 HUNGARY +29,0 POLAND +25,7 SPAIN +19,3 FRANCE +18,9 SLOVENIA +17,6 BELGIUM +16,8 PORTUGAL +13,6 AUSTRIA +13,5 GERMANY +12,3 NETHERLANDS
NEW PASSENGER CAR REGISTRATIONS EUROPEAN UNION 1
 PRESS EMBARGO: 8.00 AM (6.00 AM GMT), 17 October 2017 NEW PASSENGER CAR REGISTRATIONS EUROPEAN UNION 1 Passenger car registrations: +3.7% over nine months; 2.0% in In 2017, passenger car registrations
NEW PASSENGER CAR REGISTRATIONS EUROPEAN UNION *
 PRESS EMBARGO: 8.00 AM (7.00 AM GMT), 17 November 2015 NEW PASSENGER CAR REGISTRATIONS EUROPEAN UNION * Passenger car registrations: +8.2% over ten months; +2.9% in In 2015, the EU passenger car market
NEW PASSENGER CAR REGISTRATIONS EUROPEAN UNION 1
 PRESS EMBARGO: 8.00 AM (6.00 AM GMT), 16 June 2017 NEW PASSENGER CAR REGISTRATIONS EUROPEAN UNION 1 Passenger car registrations: +5.3% five months into 2017; +7.6% in In 2017, passenger car registrations
NEW PASSENGER CAR REGISTRATIONS EUROPEAN UNION 1
 PRESS EMBARGO: 8.00 AM (7.00 AM GMT), 16 January 2019 NEW PASSENGER CAR REGISTRATIONS EUROPEAN UNION 1 Passenger car registrations: +0.1% in 2018; 8.4% in In 2018, the EU passenger car market declined
NEW PASSENGER CAR REGISTRATIONS EUROPEAN UNION *
 PRESS EMBARGO: 8.00 AM (6.00 AM GMT), 16 April 2015 NEW PASSENGER CAR REGISTRATIONS EUROPEAN UNION * PASSENGER CAR registrations: +8.6% in first quarter; +10.6% in In 2015, demand for new passenger cars
KINGDOM OF CAMBODIA NATION RELIGION KING 3
 KINGDOM OF CAMBODIA NATION RELIGION KING 3 TOURISM STATISTICS REPORT March 2018 MINISTRY OF TOURISM Statistics and Tourism Information Department No. A3, Street 169, Sangkat Veal Vong, Khan 7 Makara, Phnom
WORLD MOTOR VEHICLE PRODUCTION BY COUNTRY AND TYPE QUARTERS June 14, 2018
 QUARTERS 2017-2018 June 14, 2018 CONTENTS BASEPROTOTAL BASEPROCARS BASEPROLCV BASEPROHCV BASEPROBC Summation of cars, LCVs, HCVs, heavy buses Cars LCVs HCVs Heavy buses Note: The production of cars and
KINGDOM OF CAMBODIA NATION RELIGION KING 3
 KINGDOM OF CAMBODIA NATION RELIGION KING 3 TOURISM STATISTICS REPORT February 2017 MINISTRY OF TOURISM Statistics and Tourism Information Department No. A3, Street 169, Sangkat Veal Vong, Khan 7 Makara,