2018 Annual Business Result
|
|
|
- Reynard Norris
- 5 years ago
- Views:
Transcription


1 2018 Annual Business Result
2 2018 Annual business result is prepared for investors consideration only before completion of independent auditors review. Therefore, parts of contents on this material could be changeable during independent auditors review. 1
3 Contents I Review II. III. IV. Market Analysis Performance Analysis Financials - Income Statement V. Awards VI. Rexton Sports KHAN launch VII. Way Forward in 2019 & Beyond 2

 in November 2018 Stable relationship between company")
 Decision to rehire dismissed")
4 2018 Review Rank 3rd in domestic market Growth for 9 consecutive years : +2% yoy in 2018 Successful launch of Rexton Sports Continuous popularity of Rexton & Tivoli brand Australia : Set-up local sales company & start of sales in Q4 India : Launch G4 (CKD) in November 2018 Stable relationship between company and labor leading to 9 consecutive years without production interruption Smooth implementation of day-time 2 shift system (8+8) Decision to rehire dismissed workers 3
5 2018 Review SUV Market Steady SUV market growth in both domestic and overseas - Domestic : +13.3% yoy thanks to new car effect and continuous consumers preference for SUV - Overseas : Continuous SUV growth in global market SYMC vehicle sales 2018 Total : 143,309 units (-0.3% yoy) - Domestic : 109,140 units (+2%) thanks to successful launch of Rexton Sports - Export : 34,169 units (-8%) due to Iran sanction and WLTP issue in Europe F/X movements (2018 USD/KRW Avg.: KRW 1,100/USD, -2.7% yoy) Currency 1,468 1,498 1,469 1,462 1,451 1,302 1,323 1,106 1,072 1, ,011 1,287 1, , , ,286 1,128 Q Q Q Q Q USD/KRW EUR/KRW 100JPY/KRW GBP/KRW 2018 avg. Price Chg. % (vs. 2017) USD/KRW 1, % EUR/KRW 1, % 100JPY/KRW % GBP/KRW 1, %
6 Domestic Market Trend Quarterly market trend (Including imported cars) 28.8% 499K 59K 31K 144K PC SUV MPV Commercial SUV M/S 34.4% 34.4% 32.1% 31.8% 31.3% 31.3% 26.7% 26.9% 474K 474K 483K 429K 443K 447K 427K 65K 62K 429K 60K 57K 55K 61K 28K 31K 54K 35K 51K 28K 26K 30K 24K 29K 128K 115K 142K 142K 149K 166K 134K 147K Q (vs. Q4 2017) - Total market : +8.2% (Domestic makers : +8.3%, Imported : +6.9%) - PC : +2.3% - SUV : +17.1% thanks to new car effect (Domestic makers : +17.5%, Imported : +13.9%) - SUV M/S : 34.4% (+2.6%p vs. Q4 2017) 265K 224K 250K 216K 224K 215K 229K 201K 229K - SYMC market share Total market : 6.4% (+0.4%p yoy) SUV market : 18.3% (+0.1%p yoy) Q Q Q Q Q Q Q Q Q Unit: vehicles Imported cars PC, SUV, MPV / Sports models : SUV 5
7 Domestic Market Trend Yearly market trend (Including imported cars) PC SUV MPV Commercial SUV M/S 32.9% 28.3% 29.3% 1,825K -1.8% 1,793K 1,813K +1.1% 232K +3% 238K 227K -5% 118K -3% 114K 117K +2% 517K +2% 526K +13% 596K 2018 (vs. 2017) - Total market : +1.1% (Domestic makers : -0.5%, Imported : +11.8%) - PC : -4.5% - SUV : +13.3% thanks to new car effect (Domestic makers : +17.5%, Imported : +13.9%) - SUV M/S : 32.9% (+3.6%p vs. 2017) 959K -5% 915K -4% 874K - SYMC market share Total market : 6.0% (+0.0%p yoy) SUV market : 17.8% (-1.7%p yoy) Unit: vehicles Imported cars PC, SUV, MPV / Sports models : SUV 6
 (36%) 14.3 +7.6% 15.4 SUV-C 49% 48% 43.6-3.4% 42.")

8 Overseas Market Trend Global demand by segments Sales volume % % % 5.0 SUV demand by segments Sales volume % % % Sales portion SUV-E 8% 8% SUV-D 23% 23% % 31.8 (34%) (36%) % 15.4 SUV-C 49% 48% % 42.1 (50%) (48%) % 6.7 SUV-A/B 20% 21% (F) (F) - Total market : +0.9% - SUV market : +8.1% (F) - SUV-A/B : +14.3% - SUV-C : +7.6% PC SUV MPV Others (pick-up) Unit : Million vehicle Source : IHS, SYMC Excluding commercial vehicles ( ) : Portion out of total market 7 SUV-A/B SUV-C SUV-D SUV-E
9 SYMC Sales Volume in Q ,034 10,204 (28%) 26,830 (72%) +11% -2% +16% 41,063 9,995 (24%) 31,068 (76%) Q Q Domestic Export Unit: vehicle (including CKD 504 units) Sales volume increase - Total Sales : +4,029 units (+11%) Domestic : +4,238 units (+16%) Export : -209 units (-2%) Domestic portion : +4%p - Q : Q = 72% : 76% Export by region (vs. Q4 2017) - W. Europe : +20% - Asia Pacific : +196% (Australia, India CKD) Rexton Sports vehicle sales increase - Total : 13,714 units (+64% YoY vs. K/Sports) thanks to new car launch effect 8
10 SYMC Sales Volume in , % 143,309 37,008-8% 34,169 (26%) (24%) Sales volume decrease - Total Sales : -376 units (-0.3%) Domestic : +2,463 units (+2%) Export : -2,839 units (-8%) Domestic portion : +2%p 106,67 (74%) 7 +2% 109,140 (76%) : 2018 = 74% : 76% Export by region (vs. 2017) - Asia Pacific : +116% (Australia, India CKD) Domestic Export Sports model vehicle sales increase - Total 49,367 units (+64% yoy vs. K/Sports only) Unit: vehicle (including CKD 1,314 units) 9
11 Region-wise Export in 2018 W. Europe % out of export sales volume (Including CKD) 47% 41% Asia Pacific Including: India, Australia Others 21% 20% 5% 13% South America 27% 26% Others: ME, AF, E. Europe
12 Income Statement(Consolidated) / Q vs. Q (Unit: billion krw) Category Q [K-IFRS 1018] Q Q vs. Q [K-IFRS 1018] Change Change (%) vs. Q Change Change (%) Sales , % % Cost of sales % % Gross Profit % % SG&A % % Operating Profit OP margin % -2.9% -3.2% -0.3% +2.6%p %p - PAT

13 Operating Costs / Q vs. Q (K-IFRS 1115) Cost of sales % SG&A expense % 88.5% -2.0%p 86.5% 14.8% -1.0%p 13.8% Q Q Q Q (Cost of Sales/Sales)*100 (SG&A expenses/sales)*100 12
14 Income Statement(Consolidated) / Q vs. Q (K-IFRS 1115) (Unit: billion krw) Category Q Q Change Change(%) Sales , % Cost of sales % Gross Profit % SG&A % Operating Profit OP margin % -2.4% -0.3% +2.1%p - PAT
15 Operating Costs / Q vs. Q (K-IFRS 1115) Cost of sales % SG&A expense % 87.9% -1.4%p 86.5% 14.5% -0.7%p 13.8% Q Q Q (Cost of Sales/Sales)*100 (SG&A expenses/sales)*100 Q
16 Income Statement(Consolidated) / 2018 Annual (Unit: billion krw) Category 2017 [K-IFRS 1018] vs [K-IFRS 1018] Change Change (%) vs Change Change (%) Sales 3, , , % % Cost of sales 2, , , % % Gross Profit % % SG&A % % Operating Profit OP margin % -1.9% -2.2% -1.7% +0.2%p %p - PAT

17 Operating Costs / 2018 Annual Cost of sales % SG&A expense % 86.8% +0.7%p 87.5% 15.3% -1.1%p 14.2% (Cost of Sales/Sales)*100 (SG&A expenses/sales)*

 G4 in")


18 Awards G4 Rexton in U.K of the Year Awards - Best Value for 2 years in a row Altruras (Rexton) G4 in India Auto Car Awards - Premium SUV of this year Musso(Rexton Sports) in U.K. - Pick-up of the year Awards - Best Value Auto Car : Automobile special magazine : 4WD special magazine in UK


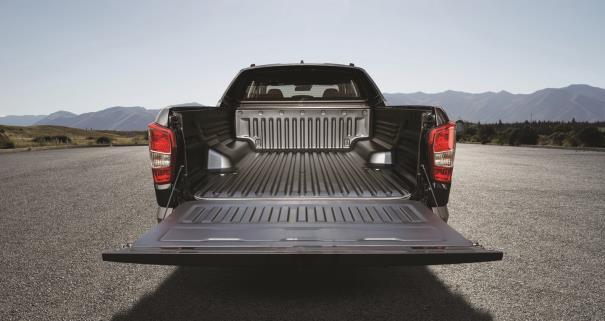
19 Rexton Sports KHAN Launch Sales trend of Sports model 30,188 7,276 22, % Domestic 49,367 7,346 42,021 Export (Unit: vehicle) : 49,367 units +64% yoy compared to K/Sports thanks to successful launch of Rexton Sports : Expectations of vehicle sales increase with Rexton Sports KHAN launch Features Wild Utility Deck Versatility for the most value : Outdoor activities and application with deck (length +310mm) Safety first: 6 Airbags, Advanced high-strength steel, Quad frame Powerful driving : 4 Tronic, Rear wheel drive 18

 - Tivoli F/L (H1) Continuous focus on new car development - EV : 2020 (Target) - New RV models Capacity rate increase -")
20 Way Forward in 2019 & Beyond Sales volume increase - Domestic : Steady vehicle sales growth with new car effect and tax support - Export : Focus on W. Europe, Australia and India New model launch schedule - Rexton Sports KHAN (Jan.) - Korando C FMC (Mar.) - Tivoli F/L (H1) Continuous focus on new car development - EV : 2020 (Target) - New RV models Capacity rate increase - Expectations of cost reduction effect Profitability priority Capital increase for new car development - KRW 50 bn from M&M 19
Q Business Result
 Q3 2018 Business Result Q3 2018 business result is prepared for investors consideration only before completion of independent auditors review. Therefore, parts of contents on this material could be changeable
H Business Result
 H1 2017 Business Result H1 2017 business result is prepared for investors consideration only before completion of independent auditors review. Therefore, parts of contents on this material could be changeable
H Business Result
 H1 2016 Business Result H1 2016 business result is prepared for investors consideration only before completion of independent auditors review. Therefore, parts of contents on this material could be changeable
2015 Business Result
 2015 Business Result 본자료는 2015 년실적에대한외부감사인의회계검토가완료되지않은상태에서투자자여러분의편의를위하여작성된자료입니다. 따라서본자료의일부내용은회계검토과정에서변경될수있음을양지하시기바랍니다. 2015 business result is prepared for investors consideration only before completion
Ssangyong Motor Company, South Korea
 Ssangyong Motor Company, South Korea Contents I. SYMC Overview II. Maximizing resource utilization III. YTD September 2015 IV. Way Forward 1 SYMC Overview SYMC Product Range SYMC Products (Segment-wise)
NET SALES AT SEPTEMBER 30, October 28, 2013
 NET SALES AT SEPTEMBER 30, 2013 October 28, 2013 1 NET SALES AT 30 SEPTEMBER 30, 2013 October 28, 2013 Net Sales of 15,282m over First 9 Months, Sales Volumes Up 2% in 3 rd Quarter Markets: up in Q3 Europe:
FISCAL YEAR MARCH 2018 FIRST QUARTER FINANCIAL RESULTS
 FISCAL YEAR MARCH 2018 FIRST QUARTER FINANCIAL RESULTS PRESENTATION OUTLINE Highlights Fiscal Year March 2018 First Quarter Results Fiscal Year March 2018 Full Year Forecast Structural Reform Stage 2 Progress
BMW GROUP QUARTERLY REPORT. TO 30 SEPTEMBER 2014
 . BMW GROUP QUARTERLY REPORT. TO 30 SEPTEMBER 2014 THE BMW GROUP IS WELL ON TRACK AND PERFORMS IN LINE WITH THE GUIDANCE. The BMW Group is well on track to reach its targets for 2014. Full year guidance
Third Quarter 2017 Performance and Business Update. October 26, 2017
 Third Quarter 2017 Performance and Business Update October 26, 2017 1 Important Notice Please read this management presentation together with the Company s press release issued earlier today announcing
Volvo Group THIRD QUARTER 2015 JAN GURANDER. Volvo Group Headquarters Third quarter
 Volvo Group THIRD QUARTER 2015 JAN GURANDER 1 VOLVO GROUP Third quarter highlights NET SALES SEK bn 12 months 310 bn IMPROVED PROFITABILITY ON FLAT VOLUMES UNDERLYING OPERATING MARGIN 6.9% 67 73 OPERATING
FISCAL YEAR MARCH 2018 THIRD QUARTER FINANCIAL RESULTS
 FISCAL YEAR MARCH 2018 THIRD QUARTER FINANCIAL RESULTS PRESENTATION OUTLINE Highlights Fiscal Year March 2018 Nine Month Results Fiscal Year March 2018 Full Year Forecast Progress of Key Initiatives 1
FY2015 Third Quarter Financial Results
 FY2015 Third Quarter Financial Results Mitsubishi Motors Corporation February 3, 2016 FY2015 Third Quarter Financial Results All-new Pajero Sport 1 FY2015 1-3Q Results Summary (vs. FY2014 1-3Q) Increase
FISCAL YEAR MARCH 2018 FIRST HALF FINANCIAL RESULTS
 FISCAL YEAR MARCH 2018 FIRST HALF FINANCIAL RESULTS PRESENTATION OUTLINE Highlights Fiscal Year March 2018 First Half Results Fiscal Year March 2018 Full Year Forecast Progress of Key Initiatives/ Business
As a note, this presentation was released as the dates shown and reflected management views as of these dates. All information in this presentation
 February 2004 1 As a note, this presentation was released as the dates shown and reflected management views as of these dates. All information in this presentation regarding the Company s financial results
Third Quarter 2018 Performance and Business Update. October 24, 2018
 Third Quarter 2018 Performance and Business Update October 24, 2018 1 Important Notice Please read this management presentation together with the Company s press release issued earlier today announcing
Hyundai Motor Company. Investor Presentation June 2013
 Hyundai Motor Company Investor Presentation June 2013 Table of Contents 1. Executive Summary 2. Key Strengths for HMC 3. Future Strategies 4. Market Update by Region Appendix 1 1. Executive Summary Executive
Q RESULTS. 24 th April 2018
 Q1 2018 RESULTS 24 th April 2018 DISCLAIMER This presentation does not constitute an offer to sell, or a solicitation of an offer to buy, PEUGEOT SA ( Company ) shares. This presentation may contain forward-looking
Third quarter AB Volvo
 Third quarter 2013 Third quarter 2013 TRUCKS EUROPE Excellent reception of the new products decision to optimize manufacturing Highlights in Commercial launch of the new product ranges Strong order situation
Third quarter AB Volvo
 1 VOLVO GROUP Slowing demand and lower earnings driven by one-offs and under-absorption SALES TREND SEK bn 12 months 318 bn OPERATING INCOME SEK bn 12 months* 25 bn 64 73 69 4.9 5.8 4.0* Q3 Q4 Q1 Q2 Q3
FISCAL YEAR MARCH 2014 FINANCIAL RESULTS
 FISCAL YEAR MARCH 214 FINANCIAL RESULTS Mazda CX-5 Mazda Atenza Mazda Motor Corporation April 25, 214 New Mazda Axela 1 PRESENTATION OUTLINE Highlights Fiscal Year March 214 Results Fiscal Year March 215
FOURTH QUARTER 2017 Martin Lundstedt, President and CEO
 FOURTH QUARTER 2017 Martin Lundstedt, President and CEO Volvo Group FOURTH QUARTER HIGHLIGHTS Net sales +11% (+16% excl. currency) Continued improved profitability for the Group - Trucks adjusted operating
Third Quarter Results (ended December 31, 2014)
") Fiscal Year 214 (ending March 31, 215) Third Quarter Results (ended December 31, 214) Brother Industries, Ltd. February 4, 215 Information on this report, other than historical facts, refers to future
Fiscal Year 214 (ending March 31, 215) Third Quarter Results (ended December 31, 214) Brother Industries, Ltd. February 4, 215 Information on this report, other than historical facts, refers to future
Q3 & 9M 2018 Results Presentation. October 24 th, 2018
 Q3 & 9M 2018 Results Presentation October 24 th, 2018 Q3 & 9M HIGHLIGHTS & CATEGORY SPOTLIGHTS Gonzalve BICH 3Q and 9M 2018 Results Presentation 2 9 Months 2018 Key Messages Continued challenging trading
Q3 Results November 16, 2006 Analyst Presentation
 Q3 Results 2006 November 16, 2006 Analyst Presentation Group Sales (in million Euro) Total Sales 2,395 +3.3% (+2.4%)* 2,474 Split per Business Group (YTD) Specialty Products 7% Q3 797 +1.0% (+2.5%)* 805
third QUARTER 2012 October 26, 2012
 third QUARTER 212 October 26, 212 Helena norrman Senior Vice President Communications third QUARTER 212 October 26, 212 This presentation contains forward-looking statements. Such statements are based
Kongsberg Automotive ASA. Fourth quarter February 28, 2019
 Kongsberg Automotive ASA Fourth quarter - February 28, 2019 Highlights Q4 Sales Revenues grew by 21 (7.3%) YoY to 288 including negative FX effects of 1. We booked new business with 77 in expected annual
1 st Half 2018 Results. August 1 st, 2018
 1 st Half 2018 Results August 1 st, 2018 H1 HIGHLIGHTS & CATEGORY SPOTLIGHTS Gonzalve BICH 2 First Half 2018 Key Messages Challenging market and business environment Continued investment in targeted Brand
First quarter Martin Lundstedt, President and CEO
 Martin Lundstedt, President and CEO FIRST QUARTER HIGHLIGHTS Net sales +12.2 bn, up 16% (+19% excl. currency) Increased operating income to SEK 8.3 bn (6.8) Construction Equipment s adjusted operating
2010 1Q Investor Meeting. May 2010
 2010 1Q Investor Meeting May 2010 This presentation contains preliminary figures which may be materially different from the final figures. While the statements in this presentation represent our current
FISCAL YEAR MARCH 2014 FIRST HALF FINANCIAL RESULTS. New Mazda Axela (Overseas name: New Mazda3)
") FISCAL YEAR MARCH 2014 FIRST HALF FINANCIAL RESULTS New Mazda Axela (Overseas name: New Mazda3) Mazda Motor Corporation October 31, 2013 1 PRESENTATION OUTLINE Highlights Fiscal Year March 2014 First Half
FISCAL YEAR MARCH 2014 FIRST HALF FINANCIAL RESULTS New Mazda Axela (Overseas name: New Mazda3) Mazda Motor Corporation October 31, 2013 1 PRESENTATION OUTLINE Highlights Fiscal Year March 2014 First Half
FY2014 2nd Quarter Business Results. Yamaha Motor Co., Ltd. August 5, 2014
 FY 2nd Quarter Business Results Yamaha Motor Co., Ltd. August 5, Forecast Consolidated Results Agenda FY 2nd Quarter Business Results Outline: Hiroyuki Yanagi President, CEO and Representative Director
GROUPE RENAULT NATIXIS CONFERENCE INDUSTRIALS PLENARY SESSION
 GROUPE RENAULT NATIXIS CONFERENCE INDUSTRIALS PLENARY SESSION DISCLAIMER Information contained within this document may contain forward looking statements. Although the Company considers that such information
2007 3Q Investor Meeting. November 2007
 2007 3Q Investor Meeting November 2007 Company Overview Cumulative 3Q 2007 Results Result By Division Appendix Company Overview Overview Doosan Infracore is the largest machinery company in Korea and also
2016 Annual Results Presentation. March 15, 2017
 2016 Annual Results Presentation March 15, 2017 Frank Chan 2 2016 Full Year Results (US$ m) 2015 2016 Change Local Curr Sales $5,038 $5,480 +8.8% +9.8% Gross Profit $1,798 $1,985 +10.4% Gross Margin %
1Q 2017 Earnings Release
 Investor Relations 2017 IT S Clinical Skin HANBUL Solution Cosmetics 1Q 2017 Earnings Release 2017. 05. 15. IR & PR Team Sales decreased 35.1% to 54.1bn, OP declined 51.8% to 13.3bn. IT S SKIN CHINA booked
FISCAL YEAR MARCH 2015 FIRST QUARTER FINANCIAL RESULTS. Mazda Roadster 25 th Anniversary Model
 FISCAL YEAR MARCH 2015 FIRST QUARTER FINANCIAL RESULTS Mazda Roadster 25 th Anniversary Model Mazda Motor Corporation July 31, 2014 1 PRESENTATION OUTLINE Highlights Fiscal Year March 2015 First Quarter
TOFAŞ RESULTS WEBCAST PRESENTATION
 TOFAŞ 31.12.2017 RESULTS WEBCAST PRESENTATION 02.02.2018 AGENDA Highlights Turkish Automotive Industry Production Domestic Market Developments Tofaş Domestic Market Performance Export Markets & Tofaş Performance
BMW Group posts record earnings for 2010
 10.03.2011 BMW Group posts record earnings for 2010 Profit before tax rises to euro 4,836 million Profit before financial result climbs to euro 5,094 million Automobiles segment reports EBIT of euro 4,355
FISCAL YEAR MARCH 2015 FIRST HALF FINANCIAL RESULTS. New Mazda Demio
 FISCAL YEAR MARCH 2015 FIRST HALF FINANCIAL RESULTS New Mazda Demio Mazda Motor Corporation October 31, 2014 1 PRESENTATION OUTLINE Highlights Fiscal Year March 2015 First Half Results Fiscal Year March
February Annual Results February 13, 2008
 February 2008 1 Annual Results February 13, 2008 AGENDA AGENDA 2007 Highlights 2007 Financial Results x Competitiveness Sales and products dynamic International 2008 Outlook February 2008 2 2007: performance
Earning Presentation
 Earning Presentation for the nine months ended December 31, 2018 February 13, 2019 This presentation contains forward looking statements that are based on current expectations and assumptions. Actual results
2003 fourth quarter and full-year results
 Dinesh Paliwal Member of Group Executive Committee, Head of Automation Technologies Division 2003 fourth quarter and full-year results Automation Technologies Copyright 2003 ABB. All rights reserved. -
FISCAL YEAR ENDING MARCH 2012 FIRST HALF FINANCIAL RESULTS
 FISCAL YEAR ENDING MARCH 2012 FIRST HALF FINANCIAL RESULTS Mazda Motor Corporation November 2, 2011 New Mazda CX-5 (European specifications) 1 PRESENTATION OUTLINE Highlights Fiscal Year Ending March 2012
RESULTS 3RD QUARTER AND NINE MONTHS OF 2016/17 1 APRIL 2016 TO 31 DECEMBER 2016
 RESULTS 3RD QUARTER AND NINE MONTHS OF 2016/17 1 APRIL 2016 TO 31 DECEMBER 2016 16 February 2017 Agenda 1. LEM at a Glance 2. Highlights and Business Review 3. Financial Review 4. Strategy and Outlook
FISCAL YEAR MARCH 2015 THIRD QUARTER FINANCIAL RESULTS. Updated Mazda CX-5 (Japanese specification model)
") FISCAL YEAR MARCH 2015 THIRD QUARTER FINANCIAL RESULTS Updated Mazda CX-5 (Japanese specification model) Mazda Motor Corporation February 4, 2015 1 PRESENTATION OUTLINE Highlights Fiscal Year March 2015
FISCAL YEAR MARCH 2015 THIRD QUARTER FINANCIAL RESULTS Updated Mazda CX-5 (Japanese specification model) Mazda Motor Corporation February 4, 2015 1 PRESENTATION OUTLINE Highlights Fiscal Year March 2015
EXANE BNP PARIBAS 13th European Seminar June 8, 2011
 EXANE BNP PARIBAS 13th European Seminar June 8, 2011 This presentation may contain forward-looking statements. Such forward-looking statements do not constitute forecasts regarding the Company s results
282m 75% +575m. Net sales Operating income before non-recurring items. Operating margin before non-recurring items. Net Loss.
 First-Half 2009 Financial Highlights Net sales Operating income before non-recurring items Operating margin before non-recurring items Net Loss Net debt-to-equity ratio Free cash flow** 7,134m 282m 4.0%
Conférence d Automne - Cheuvreux. Paris, September 26 th, 2011
 Conférence d Automne - Cheuvreux Paris, September 26 th, 2011 This presentation may contain forward-looking statements. Such forward-looking statements do not constitute forecasts regarding the Company
1 Copyright(C) 2012 Isuzu Motors Limited All rights reserved
 2012 Isuzu Motors Limited All rights reserved") FY2012 Financial Results May 10, 2012 1 Copyright(C) 2012 Isuzu Motors Limited All rights reserved Contents Ⅰ. President and Representative Director : Susumu Hosoi FY2012 Overview Ⅱ. Director Director
FY2012 Financial Results May 10, 2012 1 Copyright(C) 2012 Isuzu Motors Limited All rights reserved Contents Ⅰ. President and Representative Director : Susumu Hosoi FY2012 Overview Ⅱ. Director Director
Volvo Group THIRD QUARTER 2016 MARTIN LUNDSTEDT PRESIDENT AND CEO. Volvo Group Headquarters Third quarter
 Volvo Group THIRD QUARTER 2016 MARTIN LUNDSTEDT PRESIDENT AND CEO 1 VOLVO GROUP Third quarter highlights NET SALES SEK bn 12 months 299 bn 73.3 68.8 ADJUSTED OPERATING MARGIN* 12 months 6.7% % 6.9% 7.0%
NET SALES at September 30, 2014
 NET SALES at September 30, 2014 October 22, 2014 1 Net sales at September 30, 2014 October 22, 2014 Net sales of 14,558m in a still slowing global market The market slowdown observed since the second quarter
TOFAŞ Q ANALYST PRESENTATION
 TOFAŞ Q1 2016 ANALYST PRESENTATION 03.05.2016 1 2016 Q1 AGENDA Highlights Turkish Automotive Industry Production & Capacity Utilization Domestic Market Developments Tofaş Domestic Market Performance Export
Second quarter AB Volvo
 1 VOLVO GROUP Strengthened focus on core business divests Volvo Aero Enterprise value of SEK 6.9 billion. Completion expected during the third quarter of 2012. acquires shares in Deutz AG Largest shareholder
As a note, this presentation was released as the dates shown and reflected management views as of
 Oct. 2002 1 As a note, this presentation was released as the dates shown and reflected management views as of these dates. While reviewing this information, the data and information contain certain forward-looking
THREE MONTHS REPORT, JAN MARCH 2016
 THREE MONTHS REPORT, JAN MARCH 2016 TELEPHONE CONFERENCE 26 APRIL, 2016, AT 14:30 CET TOMMY ANDERSSON, PRESIDENT AND CEO HELENA WENNERSTRÖM, EVP AND CFO TO PARTICIPATE, PLEASE CALL 5 MINUTES BEFORE THE
Kongsberg Automotive ASA. Third quarter November 7, 2018
 Kongsberg Automotive ASA Third quarter - November 7, Q3 Highlights Continued improvements in turbulent times Revenues increased YoY by MEUR 18.3 (~8%) to MEUR 259 including negative FX effects of MEUR
Q Financial Results
 Q3 2018 Financial Results 1 Forward-looking statement The statements on the future in this presentation, including expected sales and earnings, are associated with risks and uncertainties and may be affected
Kia Motors Corporation Investor Presentation
 Kia Motors Corporation Investor Presentation February 2018 Table of Contents 1. 2018 Business Plan 3 2. Strategy for Sustainable Growth 11 3. Financial & Fundamentals 19 Appendix : 2017 Business Results
LOCK & LOCK. 2Q12 Earnings Release. July 30, 2012
 LOCK & LOCK 2Q12 Earnings Release July 30, 2012 Contents 1. 2Q12 Preliminary Earnings 2. Sales Breakdown by Region 3. Sales Breakdown by Channel 4. Sales Breakdown by Product Category 5. Summary Financials
Months Investor Presentation
 2018 9 Months Investor Presentation 25.10.2018 Disclaimer Ereğli Demir Çelik Fabrikaları T.A.Ş. (Erdemir) may, when necessary, make written or verbal announcements about forward-looking information, expectations,
Financial Results Digest for Q1 2017
 This material includes the comments and the reference data based on FY2017 Q1 Financial Results. Financial Results Digest for Q1 2017 May 2017 Financial Results Highlights for Q1 2017 All Businesses achieved
2017 Q3 REVENUE. October 25 th, 2017
 2017 Q3 REVENUE October 25 th, 2017 DISCLAIMER This presentation does not constitute an offer to sell, or a solicitation of an offer to buy, PEUGEOT SA ( Company ) shares. This presentation may contain
Fiscal Year 2015 Financial Results
 Fiscal Year 2015 Financial Results Nissan Motor Co., Ltd May 12, 2016 results FY16 outlook 2 Key performance indicators: financial results (TSE report basis - China JV Equity basis) Net revenue Operating
China Toy Industry Report, 2008
 China Toy Industry Report, 2008 According to China Customs, the accumulative toy export value of China toy (including game stations) was totaled at US $12.26 billion during Jan-Jul 2008, up 29.58% compared
FY2012 third-quarter financial results
 FY2012 third-quarter financial results Nissan Motor Co., LTD. February 8, 2013 Key performance indicators: financial results (billion yen) Net revenue 6,698.4 6,755.2 Operating profit 427.8 Net income
Earnings conference call Q3 2016
 Earnings conference call Q3 2016 Bo Annvik, CEO / Åke Bengtsson, CFO October 25, 2016 1 Agenda Business Highlights Market Update Sales Financials Outlook Public offer 2 Business Highlights Q3 2016 Solid
PRESS MEET Q3 - FY14. Dr. Reddy s Laboratories Limited February 11, Dr. Reddy's Laboratories Limited. All Rights Reserved.
 Dr. Reddy s Laboratories Limited February 11, 2014 Q3 FY 14 Business Highlights Sales ` 3,534 Cr 23 % Gross Margin 60.5 % 42% R & D 8.4 % 47 % 28.4 % 67 % to sales -- Q3 FY13 at 7.1% to Sales YoYGr% YoYGr%
LOCK & LOCK. 2Q 17 Earnings Release. 2 Aug 2017
 LOCK & LOCK 2Q 17 Earnings Release 2 Aug 2017 This document has been prepared by Lock & Lock, Co., Ltd. This document contains forward-looking statements, which are subject to risks, uncertainties, and
Earnings conference call. Q4 and Full year 2015
 Earnings conference call Q4 and Full year 2015 Bo Annvik, CEO / Åke Bengtsson, CFO 11 February 2016 1 Agenda Business Highlights Market Update Sales Financials Outlook 2 2015 in numbers Operating margin
Corporate Presentation May 2013
 Corporate Presentation May 2013 Geely Automobile In Figures Year started: 1998 Total workforce: 18,512 (on 31/12/2012) Manufacturing facilities: Products: Distribution network: 9 car plants in China 14
fy05i06 final results ESPRIT HOLDINGS LIMITED
 fy05i06 final results HOLDINGS LIMITED Forward-looking statements This presentation and subsequent discussion may contain certain forward-looking statements with respect to the financial condition, results
Results 1st Quarter 2018/19 1 April 2018 to 30 June 2018
 Results 1st Quarter 2018/19 1 April 2018 to 30 June 2018 31 July 2018 Agenda 1. LEM at a Glance 2. Highlights and Business Review 3. Financial Review 4. Strategy HOY / HOYA 2 1. Global Market Leader Market
Honda FY2011 Rating Review
 Honda Information Meeting 213 Spring Honda FY211 Rating Review 214 Acura MDX 1 1 Honda Information Meeting Honda FY211 Rating Review Current Honda Business Business Strategy Automobile Business Motorcycle
FISCAL YEAR ENDED MARCH 2011 FINANCIAL RESULTS
 FISCAL YEAR ENDED MARCH 211 FINANCIAL RESULTS Mazda Motor Corporation April 28, 211 Mazda MINAGI 1 PRESENTATION OUTLINE Highlights Fiscal Year Ended March 211 Results In Summary Question & Answer Session
FY2018 Financial Results
 FY2018 Financial Results May 14, 2018 ISUZU MOTORS LIMITED 1 Copyright(C) 2018 Isuzu Motors Limited All rights reserved Contents Ⅰ. President and Representative Director : Masanori Katayama FY2018 and
First in Mind First in Choice. Capital Markets Day 2006 Gunnar Brock, President and CEO
 First in Mind First in Choice Capital Markets Day 26 Gunnar Brock, President and CEO 1 December 4, 26 www.atlascopco.com Atlas Copco in a Snapshot Continuing operations A world leading provider of industrial
Mazda Motor Corporation FISCAL YEAR MARCH 2016 FIRST HALF FINANCIAL RESULTS (Speech Outline)
") (For your information) November 5, 2015 Mazda Motor Corporation FISCAL YEAR MARCH 2016 FIRST HALF FINANCIAL RESULTS (Speech Outline) Representative Director Executive Vice President Akira Marumoto 1. HIGHLIGHTS
(For your information) November 5, 2015 Mazda Motor Corporation FISCAL YEAR MARCH 2016 FIRST HALF FINANCIAL RESULTS (Speech Outline) Representative Director Executive Vice President Akira Marumoto 1. HIGHLIGHTS
FY2018 Financial Results Digest
 This material includes the comments and the reference data based on FY2018 Financial Results. FY2018 Financial Results Digest February 2019 Financial Results Highlight for 2018 Alcohol Beverages Business
April 20, Net Sales at March 31, 2017
 April 20, 2017 Net Sales at March 31, 2017 Q1 2017: 5.6 billion in net sales (up 10%), with strong growth in volumes Generally expanding market environment Sustained OE demand RT demand buoyed by early
Zurich, February 16, 2012, Ulrich Spiesshofer Discrete Automation and Motion Driving profitable growth. ABB Group February 16, 2012 Slide 1
 Zurich, February 16, 2012, Ulrich Spiesshofer Discrete Automation and Motion Driving profitable growth February 16, 2012 Slide 1 2011 a year of profitable growth Highlights Discrete automation Build sizeable
TOFAŞ RESULTS WEBCAST PRESENTATION
 TOFAŞ 31.12.2016 RESULTS WEBCAST PRESENTATION 02.02.2017 1 WEBCAST AGENDA Highlights Turkish Automotive Industry Production Domestic Market Developments Tofaş Domestic Market Performance Export Markets
FY17 RESULTS BUSINESS UPDATES FY18 OUTLOOK. Nissan Motor Co., Ltd. May 14 th, 2018
 Nissan Motor Co., Ltd. May 14 th, 2018 RESULTS BUSINESS UPDATES FY18 OUTLOOK www.nissan-global.com Copyright NISSAN MOTOR CO., LTD. All rights reserved. 2 GLOBAL 91.81 5.08 TIV * 1 vs. 93.52 GLOBAL +1.9%
Deutschland: Asiens Ingenieur, Europas Motor, Garant des Euro?
 Frankfurt/M., 2. Februar Deutschland: Asiens Ingenieur, Europas Motor, Garant des Euro? Dr. Stefan Kooths ing Center GDP: Slower pace ahead 114 2=1 QoQ annualized growth rate Level (chain index) 15 1 112
Investor Presentation March 2017
 Investor Presentation March 2017 Cautionary Statement with Respect to Forward-Looking Statements In the presentation that follows and in related comments by Hyundai Motor s management, our use of the words
Somboon Advance Technology PCL
 Somboon Advance Technology PCL Opportunity Day 2017Q2 September 12, 2017 1 Company Overview Automotive Industry Overview Tractor Industry Overview Sale Performance Financial Highlights Q&A 2 Company Overview
FY st Quarter Business Results. The Yamaha booth at the Japan International Boat Show 2013
 FY2013 1 st Quarter Business Results The Yamaha booth at the Japan International Boat Show 2013 Yamaha Motor Co., Ltd. 14 May, 2013 Agenda FY2013 1 st Quarter Business Results Outline Ryoichi Sumioka Senior
Q3 FY14 Performance and Financial Review February 13, 2014
 INVESTOR PRESENTATION Q3 FY14 Performance and Financial Review February 13, 2014 Contents Highlights and Financial Performance Aluminium Business Copper Business Projects 2 HIGHLIGHTS AND FINANCIAL PERFORMANCE
Global Motorcycle Market Research Report 2018
 Report Information More information from: https://www.wiseguyreports.com/reports/3271957-global-motorcycle-market-research-report-2018 Global Motorcycle Market Research Report 2018 Report / Search Code:
Earnings conference call Q4 & FY 2016
 Earnings conference call Q4 & FY 2016 Bo Annvik, CEO / Åke Bengtsson, CFO February 10, 2016 1 Agenda Business Highlights Market Update Sales Financials Way forward 2 Business Summary FY 2016 A year with
Financial Results for First Quarter of FY2015
 Financial Results for First Quarter of FY2015 (From April 1, 2014 to June 30, 2014) July 29, 2014 Hino Motors, Ltd. 1. Sales Turnover 2/15 Global Unit Sales (Retail Sales) 3/15 Sales Sales decreased decreased
FY 2010 first-half financial results
 FY 2010 first-half financial results November 4, 2010 Nissan Motor Co., Ltd. first-half financial results Key performance indicators: Financial results (billion yen) Net revenue Operating profit Net income
Results Briefing FY2014 1H
 Securities Code: 6770 Results Briefing FY2014 1H Friday, October 31, 2014 COPYRIGHT(C)2014 ALPS ELECTRIC CO.,LTD. ALL RIGHT RESERVED. Contents FY2014 1H Consolidated Financial Results P. 2-9 FY2014 Consolidated
Jaguar Land Rover Results For the quarter ended 30 June August 2015
 Jaguar Land Rover Results For the quarter ended 30 June 2015 7 August 2015 1 Disclaimer Statements in this presentation describing the objectives, projections, estimates and expectations of Jaguar Land
Earnings conference call
 Earnings conference call Full year 2017 Åke Bengtsson, President & CEO Andreas Ekberg, Acting CFO February 14, 2018 1 Agenda Business Summary Market Update Sales Financials Way forward 2 Business Summary
Dynasty Ceramic. We are making the impossible, POSSIBLE.
 Dynasty Ceramic We are making the impossible, POSSIBLE. Contents Road to Success Sales Reports Cost of Production Performance Competitor Analysis Going Forward Q & A 2 Dynasty Ceramic Road to Success DCC
Opel/Vauxhall Strategic Plan. Michael Lohscheller, CEO Opel Automobile GmbH
 Opel/Vauxhall Strategic Plan Michael Lohscheller, CEO Opel Automobile GmbH 1 STATUS QUO IS NOT AN OPTION New competitive mindset reflected in the plan s name Profitability Agility Collaboration Enablement
Third Quarter Results (ended December 31, 2013)
") Fiscal Year 213 (ending March 31, 214) Third Quarter Results (ended December 31, 213) Brother Industries, Ltd. February 4, 214 Information on this report, other than historical facts, refers to future
Fiscal Year 213 (ending March 31, 214) Third Quarter Results (ended December 31, 213) Brother Industries, Ltd. February 4, 214 Information on this report, other than historical facts, refers to future
Results 3 rd quarter and nine months of 2015/16. 1 April 2015 to 31 December 2015
 Results 3 rd quarter and nine months of 2015/16 1 April 2015 to 31 December 2015 16 February 2016 Agenda 1. LEM at a Glance 2. Highlights and Business Review 3. Financial Review 4. Strategy and Outlook
ANALYST BRIEFING FOR THE FOURTH QUARTER ENDED FEBRUARY 2017
 ANALYST BRIEFING FOR THE FOURTH QUARTER ENDED 2016 22 FEBRUARY 2017 MSM Malaysia Holdings Berhad Analyst Briefing Q4 2016 22/2/2017 1 CONTENTS 01 02 03 04 05 Group Financial Highlights Performance Review
RESULTS 3RD QUARTER AND NINE MONTHS OF 2017/18 1 APRIL 2017 TO 31 DECEMBER 2017
 RESULTS 3RD QUARTER AND NINE MONTHS OF 1 APRIL 2017 TO 31 DECEMBER 2017 8 February 2018 Agenda 1. LEM at a Glance François Gabella 2. Highlights and Business Review François Gabella 3. Financial Review