Hyundai Motor Company. Investor Presentation June 2013
|
|
|
- Lindsay Lucas
- 6 years ago
- Views:
Transcription

1 Hyundai Motor Company Investor Presentation June 2013
2 Table of Contents 1. Executive Summary 2. Key Strengths for HMC 3. Future Strategies 4. Market Update by Region Appendix 1

3 1. Executive Summary
4 Executive Summary Current Outstanding Performance Prudent Future Strategies Strong Performance through the Cycle Value Growth Balanced Sales Growth and Diversified Portfolio Structural Improvement in Core Competitiveness Volume Growth Cost Structure Improvement Superior Performance Relative to Peer Groups Green Car 3
5 2. Key Strengths for HMC
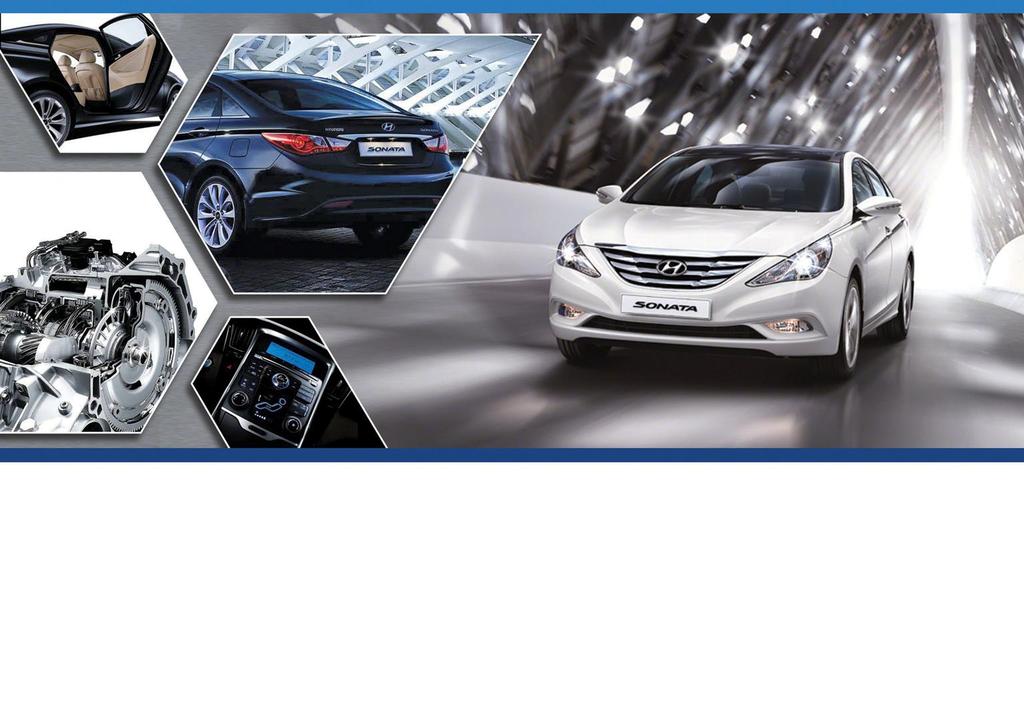
6 1 Strong Performance Through the Cycle Steady Growth in Global Sales 1 (Unit:: 1,000 vehicles) +7.1% and Strengthening Global Market Share 5.7% 2,603 2,654 3,239 3,701 4,099 4, % 5.1% 5.4% 3.9% 4.0% Supported by Relatively Higher Brand value Growth 2 than the Industry and Improving Residual Value of Vehicles 65% 61.7% 24% 19% 7% 9% 11% 6% 9% 7% 9% 8% (7)% (5)% Automaker Value Growth HMC Value Growth 55% 45% 35% 59.8% 59.5% 46.5% 45.8% 39.4% '08 MY '09 MY '10 MY '11 MY '12 MY '13MY 1. Retail sales excluding CKD sales 2. Interbrand Elantra Sonata Santa Fe 5

, sales in")
 -10.")


7 2 Balanced Sales Growth through Global Manufacturing Plants 7 manufacturing plants ( ), 6 R&D facilities ( ), 14 direct sales subsidiaries ( ), sales in more than 190 countries globally Q Q (Unit: 1,000 vehicles) -10.9% +40% +0.5% % EU China US Korea +3.4% +7.9% Middle East and Africa -4.6% India 12 1Q 13 1Q 1,019 1, % LatAm Worldwide US Plant China Plant India Plant Czech Plant Russia Plant Source: Company data (Retail sales excluding CKD sales) Turkey Plant Brazil Plant 6
8 2 Balanced Sales Growth by Diversified Business Portfolio Geographically Diversified Portfolio (%) Marketable Product Mix 2 (%) Hyundai Hyundai VW VW Fiat Fiat Toyota Toyota Honda Honda Domestic North America Europe Asia Others A+B+C D+E+F RV Others Source: Company data for HMC 2012 Global Retail Sales, Competitor information from public filings (2012FY Earnings Results) 1. Others include 38.0% of Brazil sales 2. A+B+C=Compact+Sub-Compact+Mini; D+E+F=Mid-Size+Large+Luxury; RV=SUV+MPV, Others=PUP and others 7
9 Structural Improvement in Core Competitiveness Enhanced Brand Value is leading sales growth and reduce incentive spending. Subsequently, reduction in incentive is resulting ASP increase and repeated Brand Value improvement. Structural Improvement from US Market Structural Improvement Enhanced Brand Value Sales Growth Reduction in Incentives ASP Increase US Market Brand Value ($ in Billion) Sales ( 000) M/S (%) (%) (%pt) Incentive (PNVS, $) (%) ASP (Sonata, $) (%) (14.0) , , , ,019 (1.4) ,649 (34.1) 21, ,005 (39.1) 23, (0.2) 946 (5.9) 22,700 (2.4) Source: Auto data/pin Data, ASP based on actual transaction prices 8
10 3 Increased Resilience to FX Fluctuations HMC has reduced its exposure to FX fluctuations and made efforts to reduce risk from FX fluctuations Portion of Exports from Korea Plant OP Margin & KRW/USD Exchange Rate Trend (Unit: KRW/USD) 1, % 41% 41% 40% 29% 30% 30% 28% , , , % 10.0% 8.8% 52% 59% 59% 60% 71% 70% 70% 72% 3.9% 6.1% Korea Domestic & Overseas Plant Sales Export from Korea Plant HMC OP Margin KRW/USD Avg. HMC has implemented hedging, settlement currency diversification and improving export ASP to mitigate impact from FX Source: Company data * Hyundai OP margin for based on K-GAAP, based on K-IFRS 9
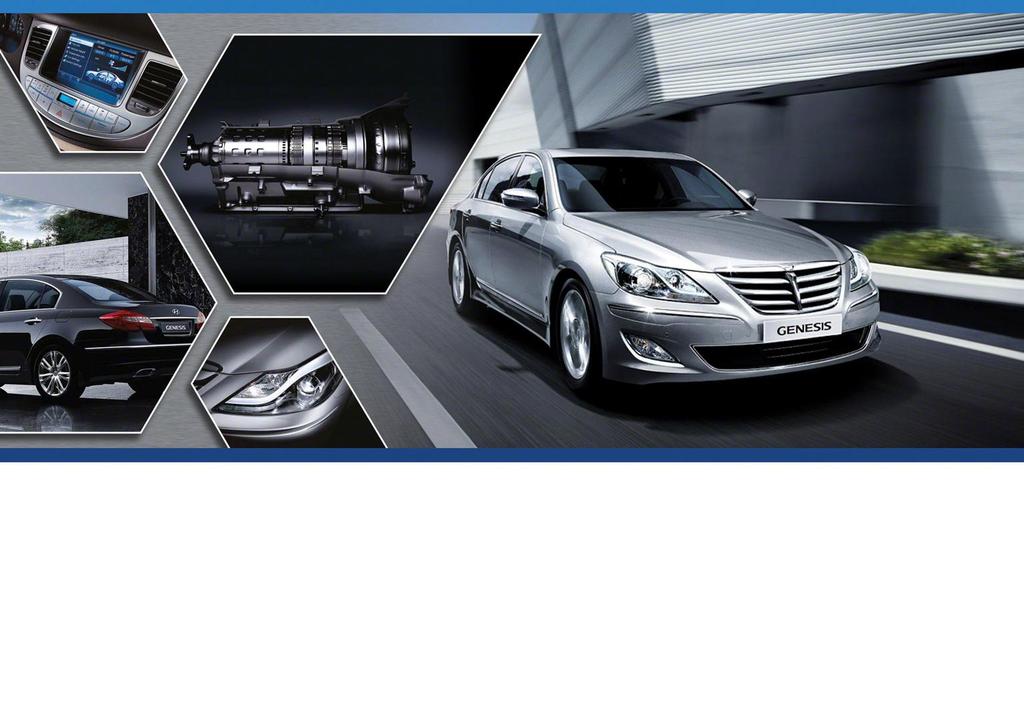
11 3 Brand Enhancement Enhancement in Brand Value Awards and Accolades (Unit: US$ in Millions) ,846 4, % 65 5, % 61 6, % 53 7,500 (Ranks) Date Award Title Region Model(s) Car of the Year Canada Santafe Rank 1 st in VDS mid-size segment U.S. Sonata Future Auto Award 2013 Germany Ix35 FCEV Car of the Year 2013 Brazil HB Car Buyer Car of the Year 2012 U.K. i Highest growth rate among automakers for two consecutive years US Customer Retention Rate +4.0%p %p (Ranks) Company Car of the Year Germany i Car of the Year Russia Solaris Best Auto 2011 Russia Solaris Best Value in America U.S. Accent, Elantra, Coupe and Tucson % 64.0% Car of the Year U.K. i % 47.0% Carmaker of the Year U.K. Hyundai Car of the Year China Sonata N. American Car of the Year U.S. Elantra In US market, Hyundai achieved the highest retention rate among competitors in 2012 Source: Interbrand, JD Power Family Car of the Year Germany ix Car of the Year Russia ix35 10
12 3 Utilization & Inventory High global utilization and low inventory level enables the company to promote value pricing strategy. HMC Global Utilization Trend (Unit: %) HMC Global/US Inventory Trend (Unit: Month of Supply) Jul-10 Oct-10 Jan-11 Apr-11 Jul-11 Oct-11 Jan-12 Apr-12 Jul-12 Oct-12 Overseas Inventory US Inventory Source: Company data/us Autodata 11
13 3 Value Pricing Strategy With value pricing strategy, ASP is keep improving while incentive spending is decreasing. Average Selling Price (ASP) by Export Market (Unit: USD 1,000) US Incentive Trend (Unit: USD) US$15,000 Export ASP CAGR: +6.0% 2,600 2,200 2,427 2, ,800 1, , , LatAm Middle East and Africa Asia Pacific Total Export Hyundai Toyota Honda Source: Company Data, US Autodata, ASP is based on HMC headquarter results 12

% (3.7)% (3.")

14 4 Consistent Profitability Relative to Peers HMC has shown the most consistent operating performance relative to competitors during the past few years. Consolidated Operating Margin Trend 10.3% 10.0% 8.8% 6.1% 4.8% 6.9% 5.5% 5.6% 7.1% 6.0% 6.2% 5.7% 4.9% 5.2% 5.1% 6.3% 2.6% 0.9% 2.1% 1.8% 0.0% (0.2)% (3.7)% (3.0)% Source: Public Filings Note: Based on Consolidated Financials, Calendarized Financials for Japanese Firms * Hyundai Financials for 2009 based on K-GAAP, based on K-IFRS 13
15 3. Future Strategies
16 Sustainable Success Going Forward Key Strategy for Ongoing Growth in Earnings Consistent revenue growth and enhanced profitability to be achieved through structural improvement in product/brand value, balanced capacity expansion and cost structure improvement Value Growth Volume Growth Cost Structure Improvement Green Car Higher ASP and Lower Incentive Driven by Enhanced Product and Brand Value Balanced Capacity Expansion and New Model Launch Higher Cost Competitiveness from Vertical Integration Develop Independent and Distinctive Technology 15
17 1 Value Growth Product Competitiveness Elantra, Sonata, and Santa Fe are experiencing high demand with better specification. Specification Comparison Elantra (Compact Sedan) Specification Hyundai Elantra ( 11) Toyota Corolla ( 09) Honda Civic ( 12) Displacement 1.8L 1.8L 1.8L Max. Power 148@6, @6, @6,300 Mileage 28mpg / 38mpg 26mpg / 34mpg 28mpg / 39mpg Sonata (Mid-size Sedan) Specification Hyundai Sonata ( 10) Toyota Camry ( 12) Nissan Altima ( 13) Displacement 2.4L 2.5L 2.4L Max. Power 198@6, @6, @6,000 Mileage 24mpg / 35mpg 25mpg / 35mpg 27mpg / 38mpg Santa Fe (Compact CUV) Specification Hyundai Santa Fe ( 13) Toyota RAV4 ( 13) Chevrolet Equinox ( 10) Displacement 2.4L 2.5L 2.4L Max. Power 190@6, @6, @6,700 Mileage 21mpg / 29mpg 22mpg / 28mpg 22mpg / 32mpg Source: Company Data 16
18 Value Growth - Higher ASP Transaction price of major models in US market has improved with structural improvement. Transaction Price Trend in US Market Compact Sedan (Unit: USD 1,000) Mid-size Sedan Compact CUV Cyl, 2WD Elantra Corolla Civic Sonata Camry Accord Santa Fe RAV4 Equinox Source: PIN data (Annual average transaction price in US market) 17
19 2 Volume Growth HMC s global sales will be increased with capacity expansion and by maintaining high utilization rate. Capacity Expansion and Sales Plan Production Capacity Expansion Sales Plan by Plants (Unit: 1,000 Vehicles) (P) (P) Chg (%) Korea 1,820 1,870 1,870 1,911 1, US China (BHMC) India Turkey Czech Russia Brazil China (CHMC) Overseas 2,050 2,550 2,780 2,499 2, Total 3,870 4,420 4,650 4,410 4, Source: Company data * Above sales figures are based on shipment ** BHMC : Beijing-Hyundai Motor Company / CHMC : Sichuan-Hyundai Motor Company 18
20 3 Cost Structure Improvement (Platform Integration) Platform integration will reduce development cost and realize greater economies of scale per platform. Platform Integration Integration Schedule Reduction of Model Development Time (P) Integrated Platforms Total No. of Platforms Total No. of Models Avg. of 40 months 19 months No. of Models per Type of Platform Mass Production Niche Market Increasing portion of models with integrated platform (P) Old 38% New 62% Old 25% New 75% Old 19% New 81% Small Mid-size Large Coupe Frame SUV LCV Source: Company Data 19

21 4 Green Car HMC independently developed and obtained distinctive technology on HEV system. Developing Green Cars: HEV Hybrid Vehicle Strategy Hybrid Vehicle A Fast Second Company - strategy to quickly become a # 2 player by competing with industry leading players Gradual expansion of HEV applied automotives (mid-size, SUV, heavy vehicles) Sonata HEV Displacement: 2.4l Max. Power: 206 hp Enhancing fuel efficiency Mileage: 34 / 40 mpg Focusing on HEV system improvement and obtaining distinctive components technology Commercial production: 2011 (US & Korea) HEV Performance Comparison Specification Sonata HEV Camry HEV Altima HEV System Power 206 hp 200 hp 198 hp Battery Li-PB 34kW Ni-MH 33kW Ni-MH 30kW Mileage (City/Highway) 36mpg / 40mpg 43mpg / 39mpg 35mpg / 33mpg Motor 30kW (40.2hp) 105kW (141hp) 105kW (141hp) System Parallel System Power Split System Power Split System Source: Company data 20

22 4 Green Car HMC has been chosen to participate in European FCEV demonstration program together with Daimler. Developing Green Cars: FCEV Fuel Cell Electric Vehicle FCEV Vehicle Assuring FCEV Leading Maker position by demonstration program Commenced production of 1,000 vehicles from 2013 to 2015 Mass production technology in process through independently developed FCEV Stack Technology Tucson ix FCEV Max. distance: 650 km Max. speed: 160 km/h Fuel Efficiency: 31km/l Commercial production: TBD Development Roadmap Assessment of Light-duty FCEV Manufacturers Phase 1 (~2006) Develop Stack Technology Phase 2 (2007~2011) Improve Performance Phase 3 (2012~) Commence Small Production Santa Fe FCEV Tucson FCEV Fuel Cell Electric Bus Tucson FCEV (2 nd Gen.) Mohave FCEV Fuel Cell Electric Bus (2 nd Gen.) Tucson ix FCEV Daimler Honda Toyota HMC GM Nissan Ford Source: Company data, Pike Research (August 10, 2011) 21

23 4. Market Update by Region
24 Korea Sales and M/S Trend (Retail Sales) (Unit: 1,000 vehicles) Market Strategy 1,464 1,474 1,411 1,490 New Model Launch Maxcruse_Santa Fe Long body (Feb 2013) : Enhance sales volume and model mix with diversifying SUV model 45.0% 46.4% 47.3% 47.1% Genesis (2H 2013) : Targeting luxury market with all new model to improve profitability and brand Q Industry M/S Q Small PC Med + Large PC RV CV Corresponding Measures on Increase of Imported Vehicle Enhanced Credibility Test drive for comparison with imported model Develop options for domestic customers Improve Premium Image Diversify product line up and Power train Upgrade and expand sales/ service network Expand Diesel Line-up Enhasing Diesel Line-up like Avante and Grandeur in domestic market to improve competitiveness Source: KAMA, Company data 23

25 United States Sales and M/S Trend (Retail Sales) (Unit: 1,000 vehicles) 11,590 12,778 14,492 15,250 Market Strategy Face Lift Model Launch Equus (March 2013) / Elantra (2H 2012): Enhance Premium segment volume to improve brand image and keep strong sales trend in non-premium segment by Face lift model 4.6% 5.1% 4.9% 4.7% Premium PC Sales Q Industry M/S Q Source: KAMA, Company data Small PC Med + Large PC RV 24
 : Launch Eco friendly model to enhance")

26 China Sales and M/S Trend (Retail Sales) (Unit: 1,000 vehicles) Market Strategy New Model Launch Mistra CF (2H 2013) : Expand model line-up with customized model to Improve customer profile and brand perception Sonata HEV (2H 2013) : Launch Eco friendly model to enhance brand image Dealer Enhancement Plan (P) Number of Dealers Q Small PC Mid-size PC SUV Focus on improving customer services and brand image Source: KAMA, Company data 25

 : Improve sales volumn by launching A seg model under economic downturn period")
 Newly")
27 Europe Sales and M/S Trend (Retail Sales) (Unit: 1,000 vehicles) 13,768 13, % 2.9% 12,528 12, % 3.2% Q Industry M/S 444 Market Strategy Strategy to overcome the economic crisis Focus on qualitative growth over quantitative growth 5 major plan for qualitative growth Brand enhancement / improve product competitiveness / penetrate true fleet market / improve dealer network / strengthen services New Model Launch i10 (2H 2013) : Improve sales volumn by launching A seg model under economic downturn period Santa Fe Long body (2H 2013) : Enhancing SUV Line-up to improve sales and brand Expand Direct Distribution Coverage Indirect 57% Direct 43% Indirect 31% Direct 69% 97 Direct distribution coverage As of 2011: UK / Spain / Italy / Norway / Poland / Czech (including Slovakia) Newly established in 2012: Germany / France Source: Company data, ACEA 26
 i10 (2H 2013) Entrance to the Indian compact low market Compete with Maruti Alto 2010 2011 2012 2013 1Q Specification Comparison Industry M/S")
28 India Sales and M/S Trend (Retail Sales) (Unit: 1,000 vehicles) 2,309 2,430 2, % 15.4% 14.7% 3, % Market Strategy New Model Launch Santa fe (2H 2013) i10 (2H 2013) Entrance to the Indian compact low market Compete with Maruti Alto Q Specification Comparison Industry M/S Hyundai Eon Maruti Alto Displacement 800cc 800cc Max. Power 56ps / 5,500rpm 47ps / 6,200rpm Mileage 21.1km/l 19.7km/l MSRP U$ 5,500 ~ 7,800 U$ 5,100 ~ 6, Q Domestic Export Source: Source: SIAM, Company data 27
29 Other Emerging Markets Achieving consistent sales volume growth through the years. Africa-middle East and LatAm Sales Breakdown by Major Emerging Markets Sales Volume (000 s) and CAGR (%) Africa-ME +20% Asia-Pacific 3.8% LatAm 6.1% Turkey 1.1% Africa-Middle East 11.2% Korea 15.2% LatAm Chindia 28.3% Europe 15.2% N. Am. 19.1% % 268 Source: Company Data, 2012 HMC Global Retail Sales (excludes CKD sales)
30 Appendix
31 Balance Sheet (K-IFRS Consolidated) (KRW in Billions) Q Change Assets 121, ,050 3,512 Current Assets 54,848 55, Cash and Cash Equivalents 1 19,143 19, Liabilities 73,620 75,344 1,723 Current Liabilities 32,836 33, Short and Long-term Debt 45,207 46, Provision 7,009 7, Equity 47,918 49,706 1,789 Current Ratio(%) % % Debt/Equity (%) 94.3 % 92.6 % Net Debt 26,064 26,143 Source: Company filings (K-IFRS Consolidated) 1. Cash and Cash Equivalents = Cash + Short-term Financial Instruments 30
32 Income Statement (K-IFRS Consolidated) (KRW in Billions) Q Q Growth Revenue 20,165 21, % Gross Profit 4,640 4, % Margin (%) 23.0 % 22.0 % SG&A 2,548 2, % Portion (%) 12.6 % 13.3 % Operating Profit 2,092 1, % Margin (%) 10.4 % 8.7 % Recurring Profit 3,150 2, % Margin (%) 15.6 % 12.8 % Net Income 2,453 2, % Margin (%) 12.2 % 9.8 % Depreciation Amortization EBITDA 1 2,899 2,502 Source: Company filings (K-IFRS Consolidated) 1. EBITDA = Operating Profit + Depreciation + Amortization 31
33 Financial Summary by Division (KRW in Billions) Q Q Growth Sales Revenue 20,165 21, % Automotive 17,249 17, % Finance 2,082 2, % Other 834 1, % Operating Profit 2,092 1, % Automotive 1,905 1, % Finance % Other % Consolidation Adjustment % Source: Company filings (K-IFRS Consolidated) 32
Hyundai Motor Company. Investor Presentation October 2015
 Hyundai Motor Company Investor Presentation October 2015 Table of Contents 1. Executive Summary 2. Key Strengths for HMC 3. Future Strategies 4. Market Update by Region Appendix 1 1. Executive Summary
Investor Presentation March 2017
 Investor Presentation March 2017 Cautionary Statement with Respect to Forward-Looking Statements In the presentation that follows and in related comments by Hyundai Motor s management, our use of the words
Investor Presentation February 2017
 Investor Presentation February 2017 Cautionary Statement with Respect to Forward-Looking Statements In the presentation that follows and in related comments by Hyundai Motor s management, our use of the
Investor Presentation February 2018
 Investor Presentation February 2018 Cautionary Statement with Respect to Forward-Looking Statements In the presentation that follows and in related comments by Hyundai Motor s management, our use of the
Investor Presentation May 2018
 Investor Presentation May 2018 Cautionary Statement with Respect to Forward-Looking Statements In the presentation that follows and in related comments by Hyundai Motor s management, our use of the words
FISCAL YEAR ENDING MARCH 2012 FIRST HALF FINANCIAL RESULTS
 FISCAL YEAR ENDING MARCH 2012 FIRST HALF FINANCIAL RESULTS Mazda Motor Corporation November 2, 2011 New Mazda CX-5 (European specifications) 1 PRESENTATION OUTLINE Highlights Fiscal Year Ending March 2012
FISCAL YEAR MARCH 2014 FINANCIAL RESULTS
 FISCAL YEAR MARCH 214 FINANCIAL RESULTS Mazda CX-5 Mazda Atenza Mazda Motor Corporation April 25, 214 New Mazda Axela 1 PRESENTATION OUTLINE Highlights Fiscal Year March 214 Results Fiscal Year March 215
FISCAL YEAR MARCH 2015 FIRST HALF FINANCIAL RESULTS. New Mazda Demio
 FISCAL YEAR MARCH 2015 FIRST HALF FINANCIAL RESULTS New Mazda Demio Mazda Motor Corporation October 31, 2014 1 PRESENTATION OUTLINE Highlights Fiscal Year March 2015 First Half Results Fiscal Year March
FISCAL YEAR MARCH 2014 FIRST HALF FINANCIAL RESULTS. New Mazda Axela (Overseas name: New Mazda3)
") FISCAL YEAR MARCH 2014 FIRST HALF FINANCIAL RESULTS New Mazda Axela (Overseas name: New Mazda3) Mazda Motor Corporation October 31, 2013 1 PRESENTATION OUTLINE Highlights Fiscal Year March 2014 First Half
FISCAL YEAR MARCH 2014 FIRST HALF FINANCIAL RESULTS New Mazda Axela (Overseas name: New Mazda3) Mazda Motor Corporation October 31, 2013 1 PRESENTATION OUTLINE Highlights Fiscal Year March 2014 First Half
2018 Annual Business Result
 2018 Annual Business Result 2018 Annual business result is prepared for investors consideration only before completion of independent auditors review. Therefore, parts of contents on this material could
TOFAŞ RESULTS WEBCAST PRESENTATION
 TOFAŞ 31.12.2017 RESULTS WEBCAST PRESENTATION 02.02.2018 AGENDA Highlights Turkish Automotive Industry Production Domestic Market Developments Tofaş Domestic Market Performance Export Markets & Tofaş Performance
H Business Result
 H1 2016 Business Result H1 2016 business result is prepared for investors consideration only before completion of independent auditors review. Therefore, parts of contents on this material could be changeable
FISCAL YEAR MARCH 2015 FIRST QUARTER FINANCIAL RESULTS. Mazda Roadster 25 th Anniversary Model
 FISCAL YEAR MARCH 2015 FIRST QUARTER FINANCIAL RESULTS Mazda Roadster 25 th Anniversary Model Mazda Motor Corporation July 31, 2014 1 PRESENTATION OUTLINE Highlights Fiscal Year March 2015 First Quarter
TOFAŞ Q ANALYST PRESENTATION
 TOFAŞ Q1 2016 ANALYST PRESENTATION 03.05.2016 1 2016 Q1 AGENDA Highlights Turkish Automotive Industry Production & Capacity Utilization Domestic Market Developments Tofaş Domestic Market Performance Export
Conférence d Automne - Cheuvreux. Paris, September 26 th, 2011
 Conférence d Automne - Cheuvreux Paris, September 26 th, 2011 This presentation may contain forward-looking statements. Such forward-looking statements do not constitute forecasts regarding the Company
TOFAŞ RESULTS WEBCAST PRESENTATION
 TOFAŞ 31.12.2016 RESULTS WEBCAST PRESENTATION 02.02.2017 1 WEBCAST AGENDA Highlights Turkish Automotive Industry Production Domestic Market Developments Tofaş Domestic Market Performance Export Markets
FISCAL YEAR MARCH 2018 FIRST HALF FINANCIAL RESULTS
 FISCAL YEAR MARCH 2018 FIRST HALF FINANCIAL RESULTS PRESENTATION OUTLINE Highlights Fiscal Year March 2018 First Half Results Fiscal Year March 2018 Full Year Forecast Progress of Key Initiatives/ Business
Q Business Result
 Q3 2018 Business Result Q3 2018 business result is prepared for investors consideration only before completion of independent auditors review. Therefore, parts of contents on this material could be changeable
FISCAL YEAR MARCH 2018 FIRST QUARTER FINANCIAL RESULTS
 FISCAL YEAR MARCH 2018 FIRST QUARTER FINANCIAL RESULTS PRESENTATION OUTLINE Highlights Fiscal Year March 2018 First Quarter Results Fiscal Year March 2018 Full Year Forecast Structural Reform Stage 2 Progress
Record CY 2016 EPS-diluted-adjusted of $6.12, an increase of $1.10 Y-O-Y. Q EPS-diluted-adjusted of $1.28, a decrease of $0.11 Y-O-Y.
 1 2 3 Q4 2016 global deliveries up 0.1 million units year-over-year (Y-O-Y), a 3.3% increase. Volume gains primarily in North America and China, offset by reductions in International Operations (excluding
2Q06 Results. Investor Relations
 2Q06 Results Investor Relations Content 1. 2Q06 Key Results 2. Summarized Income Statement 3. Balance Sheet as of Jun. 2006 4. Outlook for 2006 5. Result & Outlook By Division Appendix : 2Q06 Results Breakdown
H Business Result
 H1 2017 Business Result H1 2017 business result is prepared for investors consideration only before completion of independent auditors review. Therefore, parts of contents on this material could be changeable
FISCAL YEAR MARCH 2015 THIRD QUARTER FINANCIAL RESULTS. Updated Mazda CX-5 (Japanese specification model)
") FISCAL YEAR MARCH 2015 THIRD QUARTER FINANCIAL RESULTS Updated Mazda CX-5 (Japanese specification model) Mazda Motor Corporation February 4, 2015 1 PRESENTATION OUTLINE Highlights Fiscal Year March 2015
FISCAL YEAR MARCH 2015 THIRD QUARTER FINANCIAL RESULTS Updated Mazda CX-5 (Japanese specification model) Mazda Motor Corporation February 4, 2015 1 PRESENTATION OUTLINE Highlights Fiscal Year March 2015
FISCAL YEAR ENDED MARCH 2011 FINANCIAL RESULTS
 FISCAL YEAR ENDED MARCH 211 FINANCIAL RESULTS Mazda Motor Corporation April 28, 211 Mazda MINAGI 1 PRESENTATION OUTLINE Highlights Fiscal Year Ended March 211 Results In Summary Question & Answer Session
February Annual Results February 13, 2008
 February 2008 1 Annual Results February 13, 2008 AGENDA AGENDA 2007 Highlights 2007 Financial Results x Competitiveness Sales and products dynamic International 2008 Outlook February 2008 2 2007: performance
FY2012 third-quarter financial results
 FY2012 third-quarter financial results Nissan Motor Co., LTD. February 8, 2013 Key performance indicators: financial results (billion yen) Net revenue 6,698.4 6,755.2 Operating profit 427.8 Net income
1 Copyright(C) 2012 Isuzu Motors Limited All rights reserved
 2012 Isuzu Motors Limited All rights reserved") FY2012 Financial Results May 10, 2012 1 Copyright(C) 2012 Isuzu Motors Limited All rights reserved Contents Ⅰ. President and Representative Director : Susumu Hosoi FY2012 Overview Ⅱ. Director Director
FY2012 Financial Results May 10, 2012 1 Copyright(C) 2012 Isuzu Motors Limited All rights reserved Contents Ⅰ. President and Representative Director : Susumu Hosoi FY2012 Overview Ⅱ. Director Director
Q RESULTS. 24 th April 2018
 Q1 2018 RESULTS 24 th April 2018 DISCLAIMER This presentation does not constitute an offer to sell, or a solicitation of an offer to buy, PEUGEOT SA ( Company ) shares. This presentation may contain forward-looking
FISCAL YEAR MARCH 2015 FINANCIAL RESULTS. New Mazda CX-3 (Japanese specification model)
") FISCAL YEAR MARCH 2015 FINANCIAL RESULTS New Mazda CX-3 (Japanese specification model) Mazda Motor Corporation April 24, 2015 1 PRESENTATION OUTLINE Highlights Fiscal Year March 2015 Results Fiscal Year
FISCAL YEAR MARCH 2015 FINANCIAL RESULTS New Mazda CX-3 (Japanese specification model) Mazda Motor Corporation April 24, 2015 1 PRESENTATION OUTLINE Highlights Fiscal Year March 2015 Results Fiscal Year
282m 75% +575m. Net sales Operating income before non-recurring items. Operating margin before non-recurring items. Net Loss.
 First-Half 2009 Financial Highlights Net sales Operating income before non-recurring items Operating margin before non-recurring items Net Loss Net debt-to-equity ratio Free cash flow** 7,134m 282m 4.0%
EXANE BNP PARIBAS 13th European Seminar June 8, 2011
 EXANE BNP PARIBAS 13th European Seminar June 8, 2011 This presentation may contain forward-looking statements. Such forward-looking statements do not constitute forecasts regarding the Company s results
FISCAL YEAR MARCH 2018 THIRD QUARTER FINANCIAL RESULTS
 FISCAL YEAR MARCH 2018 THIRD QUARTER FINANCIAL RESULTS PRESENTATION OUTLINE Highlights Fiscal Year March 2018 Nine Month Results Fiscal Year March 2018 Full Year Forecast Progress of Key Initiatives 1
2015 Interim Results. Levallois, July 23 th, 2015
 2015 Interim Results Levallois, July 23 th, 2015 CONTENTS H1 2015 Highlights 2015 Interim Results Outlook H1 2015 Highlights DATE Improvement in all metrics 4 H1 2015 Key metrics Economic Sales * : 2,945
FY17 RESULTS BUSINESS UPDATES FY18 OUTLOOK. Nissan Motor Co., Ltd. May 14 th, 2018
 Nissan Motor Co., Ltd. May 14 th, 2018 RESULTS BUSINESS UPDATES FY18 OUTLOOK www.nissan-global.com Copyright NISSAN MOTOR CO., LTD. All rights reserved. 2 GLOBAL 91.81 5.08 TIV * 1 vs. 93.52 GLOBAL +1.9%
Automotive Market: Where Do We Go From Here?
 Automotive Market: Where Do We Go From Here? June, 3 rd 211 Federal Reserve Bank of Chicago Eighteenth Annual Automotive Outlook Symposium Jeff Schuster Executive Director, Forecasting and Analysis jeff.schuster@jdpa.com
2003 fourth quarter and full-year results
 Dinesh Paliwal Member of Group Executive Committee, Head of Automation Technologies Division 2003 fourth quarter and full-year results Automation Technologies Copyright 2003 ABB. All rights reserved. -
RENAULT GROUP SOCIETE GENERALE CONFERENCE
 RENAULT GROUP SOCIETE GENERALE CONFERENCE DOMINIQUE THORMANN, EVP, CFO & RCI Banque CEO NOVEMBER 30th, 2011 DISCLAIMER Information contained within this document may contain forward looking statements.
AUTUMN CONFERENCE CHEUVREUX Paris. Cheuvreux Conference - Paris
 AUTUMN CONFERENCE CHEUVREUX Paris September 25 juillet 20 th, 2012 1 This presentation does not constitute an offer to sell, or a solicitation of an offer to buy, PEUGEOT SA ( Company ) shares. This presentation
Aftermarket Trends: What will Drive Future Aftermarket Repair Opportunities in North America?
 Aftermarket Trends: What will Drive Future Aftermarket Repair Opportunities in North America? Mark Seng Global Aftermarket Practice Leader July 29, 2014 - Vehicles - Powertrains - Technology & How the
2015 Business Result
 2015 Business Result 본자료는 2015 년실적에대한외부감사인의회계검토가완료되지않은상태에서투자자여러분의편의를위하여작성된자료입니다. 따라서본자료의일부내용은회계검토과정에서변경될수있음을양지하시기바랍니다. 2015 business result is prepared for investors consideration only before completion
This presentation may contain statements that are forward looking. These statements are based on current expectations and assumptions that are
 This presentation may contain statements that are forward looking. These statements are based on current expectations and assumptions that are subject to risks and uncertainties, which may cause actual
Q Sales and Revenues. April 22, 2009
 1 Q1 2009 Sales and Revenues 1 April 22, 2009 KEY HIGHLIGHTS Q1 revenues drop 24.9% in line with markets and inventory reduction policy Substantial decrease in inventories (-21.4% vs Q1-08 ) Market share
FISCAL YEAR END MARCH 2013 FIRST HALF FINANCIAL RESULTS. New Mazda6 (Atenza)
") FISCAL YEAR END MARCH 2013 FIRST HALF FINANCIAL RESULTS New Mazda6 (Atenza) Mazda Motor Corporation October 31, 2012 1 PRESENTATION OUTLINE Highlights Fiscal Year March 2013 First Half Results Fiscal Year
FISCAL YEAR END MARCH 2013 FIRST HALF FINANCIAL RESULTS New Mazda6 (Atenza) Mazda Motor Corporation October 31, 2012 1 PRESENTATION OUTLINE Highlights Fiscal Year March 2013 First Half Results Fiscal Year
THREE MONTHS REPORT, JAN MARCH 2016
 THREE MONTHS REPORT, JAN MARCH 2016 TELEPHONE CONFERENCE 26 APRIL, 2016, AT 14:30 CET TOMMY ANDERSSON, PRESIDENT AND CEO HELENA WENNERSTRÖM, EVP AND CFO TO PARTICIPATE, PLEASE CALL 5 MINUTES BEFORE THE
2010 1Q Investor Meeting. May 2010
 2010 1Q Investor Meeting May 2010 This presentation contains preliminary figures which may be materially different from the final figures. While the statements in this presentation represent our current
FY 2006 Third Quarter Review
 FY 26 Third Quarter Review February 2, 27 Nissan Motor Co., Ltd 1 Agenda Third quarter news update Sales performance Financial results FY6 Outlook Sustainable growth 2 Third quarter news update Oct 1)
FISCAL YEAR END MARCH 2013 FIRST QUARTER FINANCIAL RESULTS
 FISCAL YEAR END MARCH 213 FIRST QUARTER FINANCIAL RESULTS New MAZDA CX-5 Mazda Motor Corporation July 31, 212 1 PRESENTATION OUTLINE Highlights Fiscal Year End March 213 Results Update of Structural Reform
Mazda Motor Corporation FISCAL YEAR MARCH 2016 FIRST HALF FINANCIAL RESULTS (Speech Outline)
") (For your information) November 5, 2015 Mazda Motor Corporation FISCAL YEAR MARCH 2016 FIRST HALF FINANCIAL RESULTS (Speech Outline) Representative Director Executive Vice President Akira Marumoto 1. HIGHLIGHTS
(For your information) November 5, 2015 Mazda Motor Corporation FISCAL YEAR MARCH 2016 FIRST HALF FINANCIAL RESULTS (Speech Outline) Representative Director Executive Vice President Akira Marumoto 1. HIGHLIGHTS
Kia Motors Corporation Investor Presentation
 Kia Motors Corporation Investor Presentation February 2018 Table of Contents 1. 2018 Business Plan 3 2. Strategy for Sustainable Growth 11 3. Financial & Fundamentals 19 Appendix : 2017 Business Results
Third quarter AB Volvo
 Third quarter 2013 Third quarter 2013 TRUCKS EUROPE Excellent reception of the new products decision to optimize manufacturing Highlights in Commercial launch of the new product ranges Strong order situation
1 st Half 2018 Results. August 1 st, 2018
 1 st Half 2018 Results August 1 st, 2018 H1 HIGHLIGHTS & CATEGORY SPOTLIGHTS Gonzalve BICH 2 First Half 2018 Key Messages Challenging market and business environment Continued investment in targeted Brand
Jaguar Land Rover Results For the quarter ended 30 June August 2015
 Jaguar Land Rover Results For the quarter ended 30 June 2015 7 August 2015 1 Disclaimer Statements in this presentation describing the objectives, projections, estimates and expectations of Jaguar Land
2017 Q3 REVENUE. October 25 th, 2017
 2017 Q3 REVENUE October 25 th, 2017 DISCLAIMER This presentation does not constitute an offer to sell, or a solicitation of an offer to buy, PEUGEOT SA ( Company ) shares. This presentation may contain
Gabelli Automotive Symposium October 30, Adriane Brown President and CEO Honeywell Transportation Systems
 Gabelli Automotive Symposium October 30, 2007 Adriane Brown President and CEO Honeywell Transportation Systems Forward Looking Statements This report contains forward-looking statements within the meaning
FY17 RESULTS BUSINESS UPDATES FY18 OUTLOOK. Nissan Motor Co., Ltd. May 14 th, 2018
 Nissan Motor Co., Ltd. May 14 th, 2018 RESULTS BUSINESS UPDATES FY18 OUTLOOK www.nissan-global.com Copyright NISSAN MOTOR CO., LTD. All rights reserved. 2 GLOBAL 91.81 5.08 TIV * 1 vs. 93.52 GLOBAL +1.9%
Check against delivery
 Axel Strotbek Member of the Board of Management of AUDI AG Finance and Organization Speech at the Annual Press Conference Ingolstadt, March 11, 2014 Check against delivery Ladies and gentlemen, I also
Ssangyong Motor Company, South Korea
 Ssangyong Motor Company, South Korea Contents I. SYMC Overview II. Maximizing resource utilization III. YTD September 2015 IV. Way Forward 1 SYMC Overview SYMC Product Range SYMC Products (Segment-wise)
This presentation may contain statements that are forward looking. These statements are based on current expectations and assumptions that are
 This presentation may contain statements that are forward looking. These statements are based on current expectations and assumptions that are subject to risks and uncertainties, which may cause actual
I remind you that our presentation is available on our website. We can start from the first 2 slides that show Piaggio Group First
 CONFERENCE CALL 2009 1 st HALF RESULTS Good afternoon and welcome to everybody. I remind you that our presentation is available on our website. We can start from the first 2 slides that show Piaggio Group
JAGUAR LAND ROVER RESULTS FOR THE THREE MONTHS ENDED 31 DECEMBER th FEBRUARY 2017
 JAGUAR LAND ROVER RESULTS FOR THE THREE MONTHS ENDED 31 DECEMBER 2016 14 th FEBRUARY 2017 DISCLAIMER Statements in this presentation describing the objectives, projections, estimates and expectations of
FY2015 First Quarter Financial Results. SUZUKI MOTOR CORPORATION 3 August 2015
 First Quarter Financial Results SUZUKI MOTOR CORPORATION 3 August 2015 Consolidated: Financial Summary Page2 Increased net sales and operating income/ordinary income Decreased net income attributable to
Interim results June 30, 2003
 1 Interim results June 30, 2003 2 In units W orldwide sales at June 30 (cars and light commercial vehicles) > Worldwide sales at June 30, 2003: 1,689,200 cars and light commercial vehicles, versus 1,656,900
FY2012. H1 Financial Results. November 8, Copyright(C) 2011 Isuzu Motors Limited All rights reserved
 2011 Isuzu Motors Limited All rights reserved") FY2012 H1 Financial Results November 8, 2011 1 Copyright(C) 2011 Isuzu Motors Limited All rights reserved Ⅰ. President and Representative Director : Susumu Hosoi :FY2012 H1 Financial Summary Outline Ⅱ.
FY2012 H1 Financial Results November 8, 2011 1 Copyright(C) 2011 Isuzu Motors Limited All rights reserved Ⅰ. President and Representative Director : Susumu Hosoi :FY2012 H1 Financial Summary Outline Ⅱ.
This presentation may contain statements that are forward looking. These statements are based on current expectations and assumptions that are
 This presentation may contain statements that are forward looking. These statements are based on current expectations and assumptions that are subject to risks and uncertainties, which may cause actual
Q3 & 9M 2018 Results Presentation. October 24 th, 2018
 Q3 & 9M 2018 Results Presentation October 24 th, 2018 Q3 & 9M HIGHLIGHTS & CATEGORY SPOTLIGHTS Gonzalve BICH 3Q and 9M 2018 Results Presentation 2 9 Months 2018 Key Messages Continued challenging trading
Conference Call H Düsseldorf August 4, 2016
 R H E I N M E TA L L A G T H E T EC H N O LO GY G RO U P FO R S EC U R I T Y A N D M O B I L I T Y Conference Call Düsseldorf August 4, 2016 RHEINMETALL AG 2016 Rheinmetall Group Highlights Increased sales,
II. New Mid-term Business Plan (Apr to Mar. 2011)
") II. New Mid-term Business Plan (Apr. 2008 to Mar. 2011) 1. Corporate Philosophy and Basic Concept of MBP 2. Business Environment Surrounding Isuzu 3. Positioning of New Mid-term Business Plan 4. Market
II. New Mid-term Business Plan (Apr. 2008 to Mar. 2011) 1. Corporate Philosophy and Basic Concept of MBP 2. Business Environment Surrounding Isuzu 3. Positioning of New Mid-term Business Plan 4. Market
Investor Presentation. March 2017
 Investor Presentation March 2017 Disclaimer During this presentation management may discuss certain forwardlooking statements concerning Nemak s future performance that should be considered as good faith
FY2008 3Q Financial Results Apr. Dec. 07 / Oct. Dec. 07. FY2008 3Q Financial Results
 FY2008 3Q Financial Results FY2008 3Q Financial Results Apr. Dec. 07 / Oct. Dec. 07 February 7, 2008 1 Copyright(C) 2008 Isuzu Motors Limited All rights reserved 1. FY2008 3Q Highlight Director: MASANORI
Automotive Aftermarket Giorgio Brusco
 Automotive Aftermarket Giorgio Brusco Vice President Automotive Aftermarket Europe Agenda The global business today Recent progress in automotive Future growth drivers Summary 2 Worldwide Automotive Aftermarket:
2007 3Q Investor Meeting. November 2007
 2007 3Q Investor Meeting November 2007 Company Overview Cumulative 3Q 2007 Results Result By Division Appendix Company Overview Overview Doosan Infracore is the largest machinery company in Korea and also
1959 March Production commences at Yulon Motor Co., Ltd. in Taiwan, the Company s first overseas KD factory.
 Corporate History 1980 July Nissan Motor Manufacturing Corporation U.S.A. is established. 1933 1940 1935 April The first car manufactured by a fully integrated assembly system rolls off the line at the
Roadshow Presentation
 Roadshow Presentation June 2, Wilfried Trepels, CFO 1 SAF-HOLLAND - Components Fifth Wheels Kingpins Suspensions Landing Gear Axle Systems 2 SAF-HOLLAND - Business Units Trailer Systems Powered Vehicle
FY2018 Financial Results
 FY2018 Financial Results May 14, 2018 ISUZU MOTORS LIMITED 1 Copyright(C) 2018 Isuzu Motors Limited All rights reserved Contents Ⅰ. President and Representative Director : Masanori Katayama FY2018 and
Global Motorcycle Market Research Report 2018
 Report Information More information from: https://www.wiseguyreports.com/reports/3271957-global-motorcycle-market-research-report-2018 Global Motorcycle Market Research Report 2018 Report / Search Code:
FY H1 Financial Results
 FY2011 1 H1 Financial Results November 8, 2010 1 Copyright(C) 2010 Isuzu Motors Limited All rights reserved Contents Ⅰ. President and Representative Director : Susumu Hosoi :FY2011 H1 Financial Summary
INDUSTRIALL GLOBAL UNION FCA-CNH NETWORK MEETING March 2017 Detroit, US
 INDUSTRIALL GLOBAL UNION FCA-CNH NETWORK MEETING 14-16 March 2017 Detroit, US IG Metall Situation in the automotive industry 2016 2016 overview IG Metall The world automarket of passenger cars has increased
FY2014 2nd Quarter Business Results. Yamaha Motor Co., Ltd. August 5, 2014
 FY 2nd Quarter Business Results Yamaha Motor Co., Ltd. August 5, Forecast Consolidated Results Agenda FY 2nd Quarter Business Results Outline: Hiroyuki Yanagi President, CEO and Representative Director
Bernstein Strategic Decisions Conference 2018
 Bernstein Strategic Decisions Conference 2018 Forward-Looking Statements Certain statements in this presentation, other than statements of historical fact, including estimates, projections, statements
FISCAL YEAR END MARCH 2012 FINANCIAL RESULTS. Mazda TAKERI
 FISCAL YEAR END MARCH 212 FINANCIAL RESULTS Mazda TAKERI Mazda Motor Corporation April 27, 212 1 PRESENTATION OUTLINE Highlights FY End March 212 Results FY End March 213 Forecast Summary Progress Toward
Q REVENUE October 19 th, 2017
 Q3 2017 REVENUE October 19 th, 2017 Disclaimer By reading the following presentation slides, you further agree to be bound by the following limitations and qualifications: This presentation is for information
Meeting Materials for FY2011
 Meeting Materials for FY2011 (Year ended March 31, 2012) May 17, 2012 Masao Usui Representative Director, President Executive Officer KYB Corporation Meeting Materials for FY2011 May 17, 2012, KYB Corporation
Earnings conference call
 Earnings conference call Full year 2017 Åke Bengtsson, President & CEO Andreas Ekberg, Acting CFO February 14, 2018 1 Agenda Business Summary Market Update Sales Financials Way forward 2 Business Summary
Half Year Results. "Technical perfection, automotive passion" 23 July 2002
 Half Year Results "Technical perfection, automotive passion" 23 July 2002 Presentation outline Faurecia in brief 1 st half year: major events 1 st half year: results 2 nd half year: perspectives 2 Presentation
Earnings conference call Q4 & FY 2016
 Earnings conference call Q4 & FY 2016 Bo Annvik, CEO / Åke Bengtsson, CFO February 10, 2016 1 Agenda Business Highlights Market Update Sales Financials Way forward 2 Business Summary FY 2016 A year with
Q3 Results November 16, 2006 Analyst Presentation
 Q3 Results 2006 November 16, 2006 Analyst Presentation Group Sales (in million Euro) Total Sales 2,395 +3.3% (+2.4%)* 2,474 Split per Business Group (YTD) Specialty Products 7% Q3 797 +1.0% (+2.5%)* 805
Q Financial Results
 Q3 2018 Financial Results 1 Forward-looking statement The statements on the future in this presentation, including expected sales and earnings, are associated with risks and uncertainties and may be affected
Mazda Motor Corporation June 17, 2011
 FY ENDING MARCH 2012 FINANCIAL FORECAST New MAZDA Demio 13-SKYACTIV Mazda Motor Corporation June 17, 2011 1 PRESENTATION OUTLINE FY ending March 2012 Forecast Updates of Framework for Medium- and Long-term
First in Mind First in Choice. Capital Markets Day 2006 Gunnar Brock, President and CEO
 First in Mind First in Choice Capital Markets Day 26 Gunnar Brock, President and CEO 1 December 4, 26 www.atlascopco.com Atlas Copco in a Snapshot Continuing operations A world leading provider of industrial
FY2017 Third Quarter Financial Results. SUZUKI MOTOR CORPORATION 5 February 2018
 Third Quarter Financial Results SUZUKI MOTOR CORPORATION 5 February 2018 Third Quarter Highlights Page2 Third Quarter Results Consolidated Financial Results Higher earnings and sales, record-high sales
London - December 4, 2009
 Jean-Martial Breuil Vice President, Operations Central Brand Management Investor Presentation London - December 4, 2009 INVESTOR RELATIONS James Palmer: + 33 6 74 94 49 66 james.palmer@mpsa.com Jean-Hugues
Nissan s emerging market strategy and Japan s monozukuri. December 1, Toshiyuki Shiga, COO Nissan Motor Co., Ltd.
 Nissan s emerging market strategy and Japan s monozukuri December 1, 2011 Toshiyuki Shiga, COO Nissan Motor Co., Ltd. 1 POWER Brand & sales power 8 Global market share by FY16 (%) 8 Sustainable COP (%)
As a note, this presentation was released as the dates shown and reflected management views as of these dates. All information in this presentation
 February 2004 1 As a note, this presentation was released as the dates shown and reflected management views as of these dates. All information in this presentation regarding the Company s financial results
HONDA CANADA FINANCE INC. AUTO FINANCE FORUM February 13, 2014 First Canadian Place, 68 th Floor, York Room Honda Fit
 HONDA CANADA FINANCE INC. AUTO FINANCE FORUM February 13, 2014 First Canadian Place, 68 th Floor, York Room 2015 Honda Fit 1 Caution with Respect to Forward-Looking Statements: These slides contain forward-looking
GROUPE RENAULT NATIXIS CONFERENCE INDUSTRIALS PLENARY SESSION
 GROUPE RENAULT NATIXIS CONFERENCE INDUSTRIALS PLENARY SESSION DISCLAIMER Information contained within this document may contain forward looking statements. Although the Company considers that such information
Indian PV Product and Market Analysis ACG. All rights reserved
 Our Global Clients (East Africa) India will be second largest Car Market by 23 Germany USA Largest EV Car market, 4% market share in 216 Japan Indian and China are having around 4% market share in Global
FY16 results. Business updates. FY17 outlook. Nissan Motor Co., Ltd. May 11 th, 2017
 Nissan Motor Co., Ltd. May 11 th, 2017 results Business updates FY17 outlook www.nissan-global.com Copyright NISSAN MOTOR CO., LTD. All rights reserved. 2 (TSE REPORT BASIS CHINA JV EQUITY BASIS) NET REVENUE
Q Analyst Teleconference. 9 August 2018
 9 August 218 Disclaimer This presentation contains forward-looking statements that reflect the Company management s current views with respect to certain future events. Although it is believed that the
2016 Q3 REVENUE October 26 th, 2016
 2016 Q3 REVENUE October 26 th, 2016 DISCLAIMER This presentation does not constitute an offer to sell, or a solicitation of an offer to buy, PEUGEOT SA ( Company ) shares. This presentation may contain
Third Quarter 2018 Performance and Business Update. October 24, 2018
 Third Quarter 2018 Performance and Business Update October 24, 2018 1 Important Notice Please read this management presentation together with the Company s press release issued earlier today announcing