PREFACE TABLES FIGURES. Figure 1.--Volume Trends in u.s. Agricultural Exports... 2 Figure 2.--Volume Trends in u.s. Agricultural Exports and Imports 4
|
|
|
- Wilfred Merritt
- 6 years ago
- Views:
Transcription
1 \ Exports
2 PREFACE This report supersedes "Quantity Indexes of US Agricultural Exports_and Imports," FAS-M-76, Foreign Agricultural Service, January 1'960 It revises the earlier quantity indexes to reflect a more recent base period and to reweight the commodities according to more recent prices The new base period provides a representative period for agricultural trade relatively free from unusual circumstances The publication was prepared by Dewain H Rahe, Assistant Chief, Catherine Cograve, and Joseph R Corley, Trade Statistics and Analysis Branch, Foreign Development and Trade Division, Economic Re~earch Service CONTENTS Page Export Highlights 1 Import Highlights 5 Nature of Revision, 7 Construction of Index 7 Base Period, 8 Selection of Commodity Classifications 8 Adjustments for Seasonal Variations 9 Comparison with Previous Indexes 9 TABLES Table 1--us agricultural exports Quantity indexes of principal commodity groups, fiscal years Table 2--US agricultural imports Quantity indexes of principal commodity groups, fiscal years Table 3--US agricultural exports Quantity indexes of principal commodity groups, calendar years Table 4--us agricultural exports Quantity indexes of grains, feeds, vegetable oils, and oilseeds, calendar years Table 5--us agricultural exports Quantity indexes of grains, feeds, vegetable oils, and oilseeds, fiscal years Table 6--us agricultural exports Quantity indexes of principal commodity groups, seasonally adjusted, monthly, Table 7--us agricultural exports Quantity indexes of principal commodity groups, not seasonally adjusteu, monthly, Table 8--us agricultural imports Quantity indexes of principal commodity groups, calendar years Table 9--us agricultural imports Quantity indexes of principal commodity groups, seasonally adjusted, monthly, Table 10--us agricultural imports Quantity indexes of principal commodity groups, not seasonally adjusted, monthly, FIGURES Figure 1--Volume Trends in us Agricultural Exports 2 Figure 2--Volume Trends in us Agricultural Exports and Imports 4 Washington DC February 1969
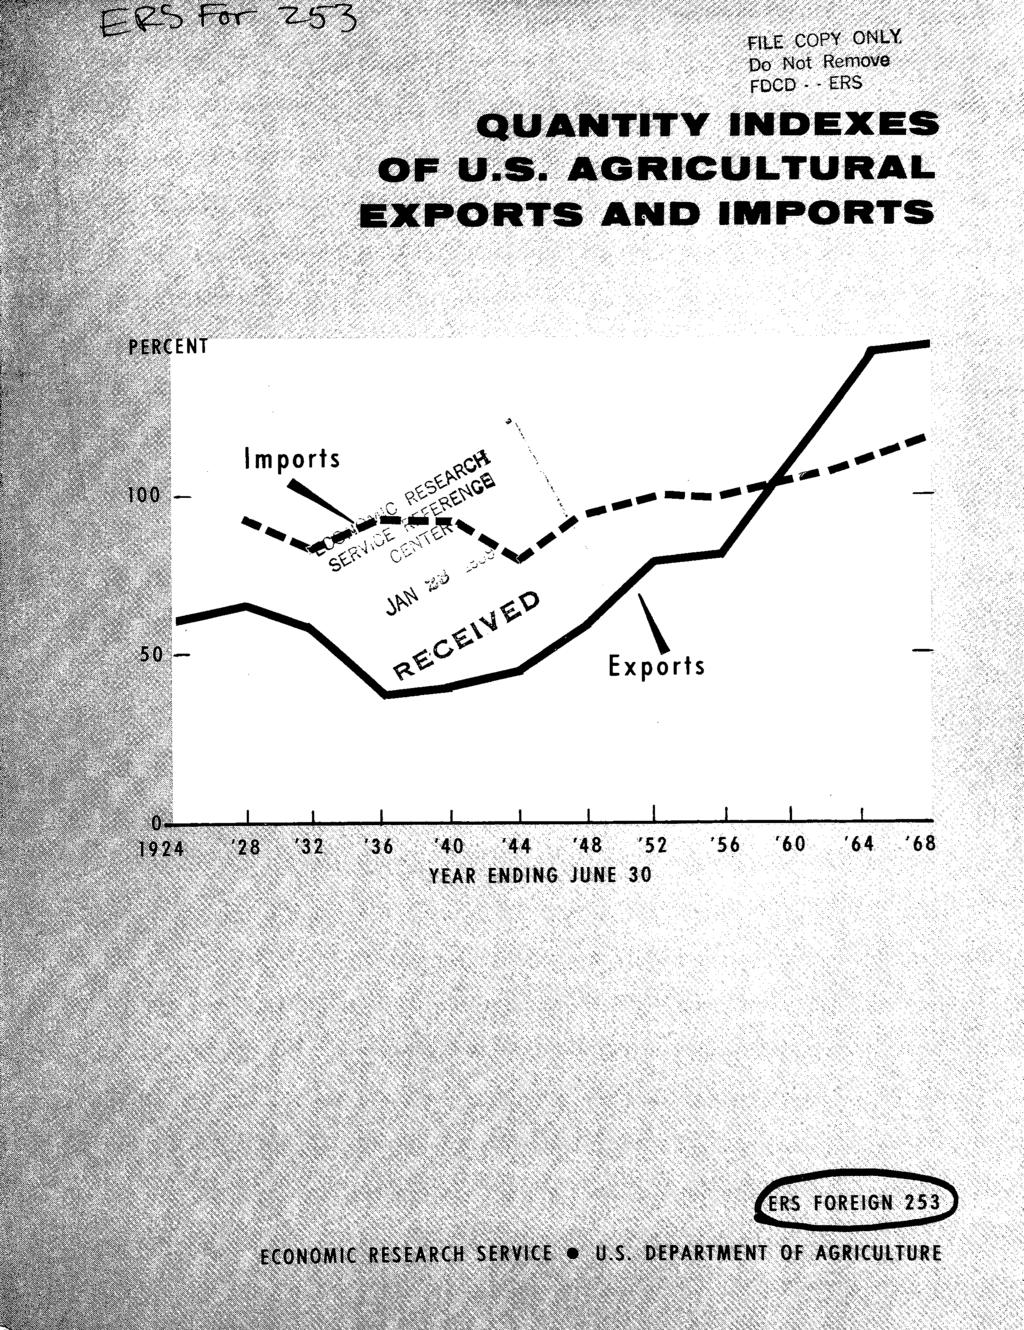
3 QUANTITY INDEXES OF US AGRICULTURAL EXPORTS AND IMPORTS Trade Statistics and Analysis Branch Foreign Development and Trade Division Export Highlights The volume of US agricultural exports has expanded sharply in recent years, especially since the middle 1950's The quantity index in fiscal 1968 (year ending June 30) equaled 148 (calendar years = 100) This was the third highest level on record, 6 percent below the alltime record of 157 in 1965/66 and 3 percent below the 152 in 1966/67 This e~pansion of US agricultural exports started in the early years of World War II following the adoption of the lend-lease program It was further stimulated by the adoption of Public Law 480 (the Agricultural Trade Development and Assistance Act of 1954) Exports under Government-financed programs since the inception of Public Law 480 have averaged about $15 billion a year The tremendous increase in us exports in recent years has been accounted for by commercial sales for dollars, which increased from $2,309 million in 1954/55 to an alltime high of $5,188 million in 1966/67 From the Civil War era to 18/, agricultural exports expanded almost continuously The steady and rapid expansion of agricultural production, stimulated by industrialization in both the United States and abroad, brought about a sevenfold increase in agricultural exports During this period, the United States imported capital from Western Europe to develop the industries, railroads, and other sectors or the infrastructure of the country This capital was repaid in large part by shipments of agricultural commodities to Western Europe, while European agriculture remained rather stagnant Beginning with the turn of the century and continuing to the late 10's, the us export volume fluctuated but remained at a fairly constant level The quantity index for farm product exports ranged from a low of 46 in 19/10 to a high of 85 in 1918/19, 5 percent above the previous peak in 1914/15 A substantial portion of the increase from 1910 to 1919 reflected purchases due to World War I The downward trend in US agricultural exports dating from the late 10's to early 1940's was brought about largely by a movement in Western Europe for greater self-sufficiency in agricultural production and by the accompanying trade restrictions After World War II, agricultural exports again started an upward trend, due to US assistance to many European countries for rehabilitation As these countries recovered from the war, they again became commercial markets for us agricultural products Cotton exports fell sharply during World Wars I and II and have since generally shown a downtrend Increased competition from foreign suppliers and
4 VOLUME TRENDS IN US AGRICULTURAL EXPORTS PERCENT (Index Numbers of Quantity, =100) N ~----~ ~ AV '85 15 '25 '45 YEAR ENDING JUNE 30 '65 '66 '68 US DEPARTMENT OF AGRICULTURE NEG ERS ( 1) ECONOMIC RESEARCH SERVICE Figure 1

5 the sharp increase in the production of manmade fibers have influenced this decline Exports of wheat and feed grains have shown sharp increases since World War II In line with agricultural exports in general, exports of grains dropped sharply between the late 10's and 1930's due to the self-sufficiency policies in Europe In addition, a prolonged drought in the United States resulted in the United States importing large quantities of wheat in the 1930's Following the immediate expansion of US exports after World War II to meet Europe's and Asia's postwar needs, us wheat exports continued to increase substantially under Public Law 480, more recently known as the food-for-freedom program In addition, demand increased sharply for wheat and rice by developing countries, such as India, Pakistan, the Philippines, Taiwan, Korea, Brazil, and other Asian, Latin American, and African countries In the past, many of these countries were net exporters of grains After World War II, they became deficit countries as population expanded rapidly and food production lagged because of lack of innovations in agricultural practices A substantial part of the increase in population stemmed from increased longevity as better medical facilities became available to developing countries Tobacco exports trended upward after the Civil War, although yearly fluctuations became wider with the start of World War I and the imposition of trade restrictions by m~jor importing countries Lack of foreign exchange resulted in policies that encouraged tobacco production in many other countries For example, production increased sharply in Rhodesia after World War II when the United Kingdom encouraged production in the Commonwealth to reduce the dollar outflow for imports of US tobacco Exports of fruits and vegetables increased until 19, after which they fluctuated erratically until the post-world War II period The sharp expansion in the early 1950's reflects the improved standards of living in Western Europe, Canada, and Japan and the improved foreign exchange position of leading importers which permitted the relaxation of import controls The United States has been a substantial supplier of fruits and vegetables when production in other major consuming countries has been sharply reduced In recent years, however, many of these countries have increased their own production of fruits and vegetables, thereby reducing the need to import from the United States; for instance, production has increased substantially in Western European countries Many US food-processing companies have recently established foreign plants to avoid trade restrictions, such as tariffs, quotas, and health and sanitary requirements, and to obtain a larger share of the market Thus, demand for American-grown products has been reduced In addition, many of the developing countries have emphasized production of fruits and vegetables to obtain larger amounts of foreign exchange to help finance their overall economic development plans US exports of most animal products increased sharply following World War II These exports were often encouraged because of large domestic supplies; for example, in some years the exports of dairy products were largely under Government-financed programs However, the United States has maintained an upward trend in commercial exports of many animal products, such as tallow, hides and skins, and variety meats These products are in relatively large 3
6 PERCENT VOLUME TRENDS IN US AGRICULTURAL EXPORTS AND IMPORTS (Index Numbers of Quantity, =1 00) TOTAL EXPORTS 0 ~~~~~~~~~~~~~~~~~~~ 200~ ~ ~ ~ TOTAL IMPORTS 0 ~~~~~~~~~~~~~~~~~~~ 200~ ~ ~ ~ 0 ~~~~~~~~~~~~~~~~~~~ 200~ ~ ~ ~ 0 ~~~~~~~~~~~~~~~~~~~ YEAR ENDING JUNE 30 U, S DEPARTMENT OF AGRICULTURE NEG ERS (I) ECONOMIC RESEARCH SERVICE Figure 2 4

7 supply in the United States at attractive prices European countries and other developing and industrial countries find these products an economic supplement to their own production of animal products us exports of hides and skins have shown a substantial increase But, in 1967/68, they declined because of increased competition from other major suppliers and from greater use of leather substitutes in the industrial countries of Western Europe and Japan Import Highlights Since 1950, overall agricultural imports have remained relatively constant except for variations during periods of crisis which affected international trade For instance, imports of agricultural products jumped sharply in 1951 and 1952 (Korean crisis) and then declined in 1953/54 to a level not too different from the years prior to 1950/51 From 1953/54 through 1967/68, us agricultural imports averaged just over $40 billion and ranged from a low of $36 billion in 1960/61 to a high of $45 billion in 1965/66 and 1966/67 and $47 billion in 1967/68 The quantity index ranged from a low of 85 in 1954/55 to a high of 119 in 1967/68 The United States, like many other countries, regulates imports to keep out animal and plant pests and diseases, weeds, and adulterated foodstuffs, as well as to protect farm incomes Import quotas or other restrictions also help t9 regulate the flow of agricultural imports that might otherwise interfere with the stability of domestic farm prices, or upset the market for domestically produced goods The executive branch may issue import restrictions or impose quotas or fees as permitted under Section 22 of the Agricultural AdJustment Act, as amended However, these restrictions are subject to subsequent investigation by the Tariff Commission Commodities currently controlled under section 22 are wheat and wheat products, cotton and certain cotton wastes, cotton fibers which have been processed but not spun, certain dairy products, and peanuts Under Public Law , quotas may be imposed to regulate imports of certain meats Should these meat imports exceed 110 percent of a base impor~ quantity, the President may proclaim import quotas; so far, such regulation has not been needed Many of the products which the United States imports from tropical countries, however, have little or no duties placed upon them Such products include coffee, certain spices, fresh bananas, and unprocessed jute, sisal, and other tropical vegetable fibers Under other statutes, nontariff restrictions may be imposed Imports of ruminants, swine, and fresh, chilled, or frozen meats are prohibited from countries certified by the Secretary of Agriculture as not free of footand-mouth disease or rinderpest Plant Quarantine regulations restrict imports of plants or their products or soils that may carry plant pests into the United States- Fluctuations have occurred in the impormof various commodities Increased imports of animal and v~getable products raised the total imports of supplementary items to 61 percent of total agricultural imports in 1967/68, up from 44 percent in the period Expanding incomes and demand for time-saving food preparations have encouraged imports of meats used in manu- 5
8 facturing prepared products, such as ready-to-cook hamburgers, luncheon meats and ready-to-serve meat products Imports of fresh fruits and vegetables having a seasonal nature were increased to provide the consumer with a yearround selection of many fresh fruits and vegetables which would not otherwise be available In total, the index of animal and animal product imports has shown a rising trend from a low of 70 in 1956/57 to 159 in 1967/68 In 1966/67, dairy product imports showed the highest increase from previous years although from 1960/61 through 1965/66 they were relatively stable However, they declined again in 1967/68 Hide and skin imports have almost been consistently lower than the base period ( ), ranging from in 1959/60to 74 in 1967/68 Imports of meat and meat products rose from 110 in 1960/61 to 213 in 1967/68, mainly due to larger imports of beef and veal Fresh beef imports, which totaled $19 million in 1961/62, were up to $360 million in 1967/68 The relative stability of the value of dairy product imports was disrupted by an increase of $40 million from 1965/66 to 1966/67 This increase was in commodities not subject to the regulations under Section 22 of the Agricultural Adjustment Act Colby cheese rose from 20 million pounds in 1965/66 to 76 million in 1966/67 and butterfat-sugar mixtures rose from 61 million pounds to 140 million Imports of all cheeses represented over half of the total increase in dairy product imports As a result of this sharp rise, President Johnson issued a proclamation on June 30, 1967, under Section 22 of the Agricultural Adjustment Act, as amended, to extend import quotas to several dairy products not previously controlled The new quota covered butterfatsugar mixtures, Colby and other American-type cheeses, and frozen cream These new quotas were aimed at reducing dairy product imports to about 1 billion pounds of milk equivalent annually Among the other major supplementary import items, grains and feeds have declined some sinrel958~9 Imports of vegetable oils and oilseeds increased slightly, and sugar and unmanufactured tobacco imports remained relatively stable although somewhat higher than the average for the base period The index for imports of vegetable oils and oilseeds rose to 128 in 1967/68, 17 percentage points higher than in 1961/62 Although the United States is a net exporter of oilseeds and products, there is a demand for oils with special properties and characteristics required in certain food processes and other industrial uses During the period since 1960/61, imports of copra declined somewhat However, this decline was offset mainly by larger imports of cocoa butter, coconut oil, olive oil, and palm oil Sugar imports accounted for a large share of total supplementary imports The index of sugar imports for the period 1960/61 through 1967/68 changed moderately, ranging from a low of 83 in 1963/64 to a high of in 1967/68 Sugar imports are regulated and allocated by shares to foreign producing countries to protect the sugar price, while equitably dealing with the many suppliers wishing to sell in the US market The United States imports sugar mainly from the Philippines and Latin American countries 6
9 Coffee is the largest import item and accounts for over half the total complementary imports In addition, cocoa contributes largely to the remaining complementary imports The index of coffee, cocoa, and tea imports remained relatively constant from 1960/61 through 1967/68, averaging about 112 during the 8-year period Imports of bananas, which were small compared with imports of coffee, cocoa, rubber, and wool in , increased quite substantially during and more than doubled from 1960/61 to 1967/68 Thus, the index for banana imports shows a substantial increase from the average us imports of bananas reached a record level in 1966/67, being stimulated by lower import prices as new banana plantings became available in Central America The United States accounts for about two-fifths of the world banana imports Equador, Honduras, Panama, and Costa Rica are the principal suppliers of bananas to the United States Improved technology and marketing techniques have helped to expand world banana exports The transition from stem delivery to box packaging and shipping has contributed to better condition of the fruit after delivery and has permitted wider distribution Nature of Revision This report updates the previous quantity indexes of US agricultural trade Among other uses, a quantity index provides a quantitative measure of the magnitude of current US trade compared with earlier periods The current index changes the base period to from The indexes, published as a monthly series since 1957, are also adjusted for seasonal variation since 1957 The current indexes are published in "Foreign Agricultural Trade of the United States" Those on a monthly basis, both adjusted and unadjusted for seasonal variation, appear in the monthly issues, and those on an annual basis appear in the calendar year and fiscal year supplements Construction of Index "Foreign Crops and Markets," Bureau of Agricultural Economics, September 3, 14, page 231, describes the construction of the first index numbers of agricultural exports "New Quantity Indexes of Foreign Trade of the United States in Agr~cultural Products," Office of Foreign Agricultural Relations, April 1941, contains revisions of export indexes and the first index numbers of us agricultural imports This was updated and revised in "Quantity Indexes of US Agricultural Exports and Imports," FAS-M-76, Foreign Agricultural Service, January 1960 The current indexes, as well as the previous ones with which these are linked, were compiled by the weighted aggregate method expressed in the formula I=~Q1P 0 in which Q1 is the number of units of each commodity ex- ~QoPo 7
10 ported or imported during the period for which the index is computed; P 0 is the average unit value of the respective commodity during the 3 years , computed from quantity and value figures; and Q0 is the average number of units of the respective commodity exported or imported annually or monthly during the 3 years Base Period The base period of the index is , the standard base for all indexes in the us Government It represents a period of agricultural trade that was relatively free from unusual circumstances, such as wars or depressions, that would seriously affect the index numbers The calendar year base was used for both the calendar year and the fiscal year index numbers so that the weighting of these two series would be similar In addition, it permits the use of monthly indexes to develop either a calendar year or a fiscal year index These index numbers were linked with previously calculated fiscal year quantity indexes beginning in 1865/66 for exports and in 14/25 for imports and with calendar year indexes beginning in 14 for both exports and imports Selection of Commodity Classifications The export index was constructed from the agricultural commodities classi~ fication included in schedule B of the US Bureau of the Census, effective from 1957 through 1959 In all, the export index contained 332 numbers out of a total 446 agricultural schedule B codes They accounted for about 93 percent of all export trade in 1967/68 The index of agricultural imports was based on 417 classifications in the Tariff Schedule of the United States Annotated (TSUSA) which accounted for percent of all imports in 1967/68 The change of the import classification from schedule A in the Bureau of the Census to TSUSA in 1963 resulted in considerable reweighting and calculating of these indexes The commodity grouping and method of weighting inqividual items were set up in such a way that adjustments can be made for changes in groupings or commodity codes without affecting the comparability of the index In selecting the commodities for inclusion in the index, an effort was made to obtain a list of practical length without excluding any important items Relatively important items are judged by dollar values during the base period and the availability of quantity statistics Another criterion in choosing the commodities was the homogeneity of the Bureau of the Census classifications An effort was made to avoid classifications that included large subclasses differing greatly in price or in trade trends In order to provide a more useful series of indexes, agricultural export indexes were broken down into several subindexes by major commodity group In the yearly series, separate subindexes were calculated for each of the groups shown in the tables In the monthly export series, the various animal subgroups were combined into a single index for animals and animal products 8
11 In the new import index, the commodity groupings were adjusted slightly to allow for changes in classification and to provide for a more logical combination of commodities according to their importance during the base period The division of agricultural imports into supplementary and complementary commodities was continued from previous indexes All agricultural commodities similar to those produced in the United States and interchangeable in use to any significant extent are supplementary The complementary group includes all other imported agricultural commodities; coffee, cocoa beans, tea, rubber, raw silk, wool for carpets, spices, and bananas accounted for percent of the total complementary products in the base period Adjustments for Seasonal Variations The average quantities for calendar years were calculated by month for each commodity and commodity group in both export and import indexes and were adjusted for seasonal variations By eliminating the seasonal variations, these adjustments bring out the underlying movements of the series The resulting seasonally adjusted data combine trend-cycle and erratic movements The erratic movements usually dominate in 1- and 2-month comparisons of the seasonally adjusted figures, but the underlying trend becomes apparent in comparisons made over longer spans, usually 3 or 4 months The indexes were adjusted independently using the Bureau of the Census Method II, Seasonal Adjustment Program l/ A stable seasonality existed in the indexes of both exports and imports of agricultural commodities The test for the existence of stable seasonality is computed from the ratio of the variants between months to the residual variants; if this F ratio is above a given tabled value, stable seasonality is indicated More detail on the seasonal variations and the various components is available in the Trade Statistics and Analysis Branch of the US Department of Agriculture for inspection upon request Comparison with Previous Indexes The export indexes from 1865/66 to date were compiled on a fiscal year basis, since foreign trade data prior to 1914 are available only on a fiscal year basis Although calendar year numbers are available since 1914, the index was not constructed for calendar years earlier than 14 The fiscal year indexes of agricultural exports from 1865/66 through 1913/14 were based upon the volume of 29 major commodities in trade during the base period These 29 commodities accounted fot 75 percent of the total volume of trade during In 14, the index was recomputed from 1910 through 14, using 44 commodities that accounted for about percent of ll Technical Paper No 15, The X-11 Variant of the Seasonal Method II, Seasonal Adjustment Program, US Bur Census, Nov
12 all exports and linked to the old index These indexes were continued to 1940 but in 1941 were revised back to 14, using calendar years as the base period and including 74 commodity classifications which accounted for 96 percent of the total trade in the new base period Because of the declining importance during the 1930's of dairy products and several meat products, the 1941 revision did not show these groupings separately Consequently, it was possible to show continuous trends in trade from 1865/66 to date for only the more important commodities -- cotton, grains, tobacco, and total animal products A continuous comparable series on exports of fruits and vegetables is available from 19 to date and for exports of vegetable oils and oilseeds since 14 10
13 Table 1--us agricultural exports Quantity indexes of principal commodity groups, fiscal years (Calendar year~ = 100) Animal products Year Poultry ending Total Dairy and Animal Meats and ; Cotton Tobacco, GrainsV~getable Fruits June 3 o 11 Total products poultry fats meat and unmanu- and o~ls and and 11 products 2/ products linters factured feeds oilseeds vegetables _ / u See footnotes at end of table Continued--
14 Table 1--US agricultural exports Quantity indexes of principal commodity groups, fiscal years Continued (Calendar years = 100) Animal products Y ear Poultry M ea t s an d Cotton Tobacco, Grains vegetable Fruits Total T 1 Dalry and Anlmal and unmanu- and!oils and and endlng I ota 1 meat une 30 1 products pou try fats roducts linters factured feeds Ollseeds vegetables J ]j products 1/ p 2; 2/ 2/ 2/ ~----~------~------~----~ ~ i See footnotes at end of table Continued--
15 Table 1--us agricultural exports Quantity indexes of principal commodity groups, fiscal years Continued (Calendar years = 100) Animal 2roducts Year Poultry T b G Vegetable Fruits d Total Dairy d A 1 Meats and Cotton o acco, ra~ns 1 d d en ~ng an n~ma meat and unmanu- and o~ s an an June Total products poultry fats d 1 f t d f d o~lseeds vegetables d t Jj 2; pro ucos ~nters pro uc s _ ac ure ee s ll ll 21 2/ w See footnotes at end of table Continued--
16 Table 1--us agricultural exports Quantity indexes of principal commodity groups, fiscal years Continued (Calendar years = 100) Animal products Poultry Vegetable Fruits Year Total D d A 1 Meats and Cotton Tobacco, Gra~ns 1 d d d a~ry an n~ma d d o~ s an an en ~ng I meat an unmanu- an 30 1 Total products poultry fats d 1 f d f d o~lseeds vegetables June - Z/ d t Z/ pro ucts ~nters _ pro uc s _ Z/ acture ee s _ Z/ _ Z/ 2/ ; ; ~ ~ 1950 ; ; i ; U so Ub J/ Based on 332classifications (commodity groups and total index include commodities shipped as food for relief or charity by~viduals anapr1vate agencies starting- fg4~75u)- l7-notcalcu1ated prior to first year shown
17 Table z--us agricultural imports Quantity indexes of principal commodity groups, fiscal years ~Calendar xearsl = 1002 Supplementary 11 Complementary 11 Animal products Sugar, Rubber Year ending Total H'd Meats Woo~ GrainsVegetablemolasse~Tobacco, Cocoa, and June 30 1/ Total Total Dairy 1 esand meatexcl free and oils and and unmanu- Total co!fee, allied - 3/ products ~~d products in bond feeds oilseeds sirups factured an 31 tea gums - s 1ns 3/ 4/ 5/ - 3/ Vt ' See footnotes at end of table Continued--
18 Table 2--us agricultural imports Quantity indexes of principal commodity groups, fiscal years Continued (Calendar yea~l = 100) Supplementary ~/ Complementary ~/ Year ending Total Animal products Sugar, Rubber June 30 1/ Hides= Meats Woo~ GrainsVegetablemolasse~Tobacco, Cocoa, and - Total Total Dairy and and meatexcl free and oils and and unmanu- Total coffee,allied 3/ productsskinsproducts in bond feeds oilseeds sirups factured and tea gums - 3/ 4/ 5/ 3/ 3/ ~ \ / Based on 417 classifications Z/ Supplementary agricultural imports consist of all imports similar to agricultural commodities produced commercially in the United States, together with all other agricultural imports interchangeable to any significant extent with such US commodities Complementary imports include all others, about percent of which consists of rubber, coffee, tea, cocoa beans, raw silk, wool for carpets, bananas, and spices 3/ Not calculated prior to 1947/48 4/ includes wool (ordinarily dutiable) imported free as an act of international courtesy 11 Prior to 1930/3~ includes molasses~ beginning in 1947/48, includes molasses and sirups
19 Table 3--us agricultural exports Quantity indexes of principal commodity groups, calendar years (Calendar years = 100) Anima 1 products Poultry Meats and Cotton Tobacco, =era ins =vegetable Fruits Total Dairy and Animal meat and unmanu- and!oils and and Year 11 Total products poultry fats products linters factured feeds!oilseeds vegetables - 21 products / ' ~_ See footnotes at end of table Continued -
20 Table 3--us agricultural exports Quantity indexes of principal commodity groups, calendar years Continued (Calendar years = 100) Animal products Poultry Meats and Cotton Tobacco, Grains =vegetable! Fruits Total Dairy and Animal meat and unmanu- and!oils and and Year _ 1 I Total pro d ucts poultry fats products linters facture d f ee d s o il see d s vegeta bl es ' / products ' / ' / 2/ ~-~-=~~ - - ~-=- ~ ~ ~ ~ / Based on 332 classifications (commodity groups and total index include commodities shipped as food for relief or-charity by individuals and private agencies starting 1949) 11 Not calculated prior to
21 Table 4--us agricultural exports Quantity indexes of grains, feeds, vegetable oils, and oilseeds, calendar years Year Feed grains ~Calendar l'ears = 100~ Cottonseed Wheat Oil cake and Rice and and Soybeans flour meal soybean oils Table 5--us agricultural exports Quantity indexes of grains, feeds, vegetable oils, and oilseeds, fiscal years ~Calendar l'ears = 100~ Wheat Oil cake Cottonseed Year ending Feed and Rice and and Soybeans June 30 grains flour meal soybean oils '
22 Table 6--us &gricultural exports Quantity indexes of principal commodity groups, seasonally adjusted, monthly, (Monthly averages = 100} Cotton Total Animal Tobacco, Grains Vegetable Fruits Year and month and unmanu- and oils and and Other ]) products linters factured feeds oil seeds vegetables January February March April May June July August ~ September October November December January February March April May June July August September October November December See footnote at end of table Continued--
23 Table 6--us agricultural exports Quantity indexes of principal commodity groups, seasonally adjusted, monthly, Continued (Monthly averages, = 100) Total Animal Cotton Tobacco, Grains Vegetable Fruits Year and month l/ roducts and unmanu- and oils and and Other - p linters factured feeds oilseeds vegetables 1959 January February March April May Q9 96 June July August ~ September October November December January February March April May June July August September October November December See footnote at end of table Continued--
24 Table 6--us agricultural exports Quantity indexes of principal commodity groups, seasonally adjusted, monthly, Continued Year and month! (Monthly averages = 100) Total Cotton Tobacco, Grains Vegetable Fruits Animal linters factured feeds oilseeds vegetables ll products and unmanu- and oils and and Other 1961 January February March April May June July August N September N October November December January February March April ll'4 May June July August September October November December See footnote at end of table Continued--
25 Table 6--us agricultural exports Quantity indexes of principal commodity groups ~sonall7 adjusted, monthly, Continued ' Year and month! (Monthly averages = 100} Cotton Tobacco, Grains Vegetable Fruits Total Animal ll and unmanu- and oils and and Other products linters factured feeds oilseeds vegetables 1963 January February March April May June July August N September UJ October November December January February March April May June July August September October November December See footnote at end of table Continued--
26 Table 6--US agricultural exports Quantity indexes of principal commodity groups, seasonally adjusted, monthly, Continued Year and month (Monthly averages = 100} Total Cotton Animal Tobacco, Grains Vegetable Fruits and unmanu- and oils and and Other ll products linters factured feeds oilseeds vegetables 1965 January February March April May June July August N September ~ October November December January February March Apri May June July August September October November December See footnote at end of table Continued--
27 Table 6--US agricultural exports Quantity indexes of principal commodity groups, seasonally adjusted, monthly, Continued (Monthly averages, = 100) Year and month Total Animal 11 products Cotton and linters Tobacco, unmanufactured Grains and feeds Vegetable Fruits oils and and oilseeds vegetables Other N VI 1967 January February March April ~y June July August September October November December " January 164 February 164 March 150 April 151 May 13 7 June 135 July 149 August 161 September 143 October / Based on 332 classifications (commodity groups and total index include commodities shipped as food fo; relief or charity by individuals and private agencies)
28 Table 7--us agricultural exports Quantity indexes of principal commodity groups) not seasonally adjusted, monthly, N 0\ Year and month 1957 January February t1a reb April ~y June July August September October November December Total Animal 1/ ~ products (Monthly averages, = 100) Cotton and linters Tobacco, Grains unmanu- and factured feeds Vegetable Fruits oils and and oilseeds vegetables -- ~ 1958 January February March April May June July August September October November December ' See footnote at end of table Other Continued--
29 N Year and month Table 7 --us agricultural exports Quantity indexes of principal commodity groups, not seasonally adjusted~ monthly, Continued 1959 January February March April May June July August September October November December 1960 January February March April May June July August September October November December (Monthly averages, = 100) Cotton Tobacco, Grains Vegetable Fruits Total Animal and unmanulinters factured feeds oilseeds vegetables and oils and and!/ groducts - ~ ~ ~ ~~ " l Other See footnote at end of table Continued--
30 Table 7--us agricultural exports Quantity indexes of principal commodity groups, not seasonally adjusted, monthly, Continued (Monthly averages~ = 100} Cotton Tobacco, Grains Vegetable Fruits Year and month Total Animal and unmanu- and oils and and Other l/ produc,ts linters factured feeds oilseeds vegetables 1961 January February March April May June July, August N September October November December January February March April May June July August September October November December See footnote at end of table Continued--
31 N Table 7--us agricultural exports Quantity indexes of principal commodity groups, not seasonally adjusted, monthly, Continued ~onthl~ averages = 100) Cotton! Tobacco, Grains Vegetable Fruits Year and month Total Animal and unmanu- and oils and and Other!/ products linters factured feeds oilseeds vegetables 1963 January February March April May June July August ID September October November December January February March April 'May June July August September October November December See footnote at end of table Continued--
32 Table 7 --us agricultural exports Quantity indexes of principal commodity groups, not seasonally adjusted, monthly, Continued (Month1~ averages = 100) Cotton Tobacco, Grains Vegetable Fruits Year and month Total Anima~ and unmanu- and oils and and Other - 1/ products linters factured feeds oi1seeds vegetables 1965 January February March April May June July August w 0 September October November December January February March April 'May June July August September October November December See footnote at end of table Continued--
Oilseeds and Products
 Oilseeds and Products Oilseeds compete with major grains for area. As a result, weather impacts soybeans, rapeseed, and sunflowerseed similarly to grain and other crops grown in the same regions. The same
FAPRI Food and Agricultural Policy Research Institute
 26 WORLD OUTLOOK Presentation Food and Agricultural Policy Research Institute Global Macroeconomic Overview Sustained and widespread real economic growth for the decade averaging 3.1%. Industrialized countries
THIS REPORT CONTAINS ASSESSMENTS OF COMMODITY AND TRADE ISSUES MADE BY USDA STAFF AND NOT NECESSARILY STATEMENTS OF OFFICIAL U.S.
 THIS REPORT CONTAINS ASSESSMENTS OF COMMODITY AND TRADE ISSUES MADE BY USDA STAFF AND NOT NECESSARILY STATEMENTS OF OFFICIAL U.S. GOVERNMENT POLICY Required Report - public distribution Date: GAIN Report
CHARTS AND PRICE PROJECTIONS
 CHARTS AND PRICE PROJECTIONS 18 / Charts and Price Projections: FAPRI 27 Agricultural Outlook Average Annual GDP Growth Percent Change 9 8 7 6 4 3 2 1 26-216 Canada China EU NMS EU- India Japan Latin America
Growing Soybean Oil Price Raises Oil s Contribution to Total Soybean Value
 United States Department of Agriculture Foreign Agricultural Service Circular Series FOP 10-07 October 2007 Growing Soybean Oil Price Raises Oil s Contribution to Total Soybean Value Relative Share Value:
Coconut Oil Prices Spike
 United States Department of Agriculture Foreign Agricultural Service Coconut Oil Prices Spike Coconut oil prices have surged over the past year in contrast to the general downward trend in other vegetable
Weak Real to Boost Brazil s Soybean Exports in 2016
 United States Department of Agriculture Foreign Agricultural Service October 2015 Weak Real to Boost Brazil s Soybean Exports in 2016 Brazil s exchange rate is having a significant impact on domestic and
CHARTS AND PRICE PROJECTIONS
 CHARTS AND PRICE PROJECTIONS 18 / Charts and Price Projections: FAPRI 28 Agricultural Outlook Average Annual GDP Growth, 27-217 Percent Change 1 8 8.4 7.92 6 4 4.44 3.67 4.6 4.34 2 2.37 2.17 1.38 2.44
Indian Soybean Meal Exports Unlikely to Recover in 2015/16
 United States Department of Agriculture Foreign Agricultural Service November 2015 Indian Soybean Meal Exports Unlikely to Recover in Though once a significant regional exporter of soybean meal, India
Soybean Trade Growth: A Story of Brazil, the United States, and China
 United States Department of Agriculture Foreign Agricultural Service October 2017 Soybean Trade Growth: A Story of Brazil, the United States, and China 12-Month Soybean Export Growth Year Ending September
Sharp Decline in Vegetable Oil Stocks Leads to Steeply Higher Prices
 United States Department of Agriculture Foreign Agricultural Service Circular Series FOP 1-11 Sharp Decline in Vegetable Oil Leads to Steeply Higher Prices Commodity prices have been on an upward trend
Oilseeds and Products
 Oilseeds and Products Oilseeds compete with major grains for area. As a result, weather impacts soybeans, rapeseed, and sunflowerseed similarly to the grain and other crops grown in the same regions. The
Sunflower Oil Imports Increase for Ration Card Program
 THIS REPORT CONTAINS ASSESSMENTS OF COMMODITY AND TRADE ISSUES MADE BY USDA STAFF AND NOT NECESSARILY STATEMENTS OF OFFICIAL U.S. GOVERNMENT POLICY Required Report - public distribution Date: GAIN Report
Pakistan Oilseed Processors Seize Opportunity to Crush Soybeans
 United States Department of Agriculture Foreign Agricultural Service December 2015 Pakistan Oilseed Processors Seize Opportunity to Crush Soybeans Pakistan, long an importer of soybean meal, is transitioning
U.S. Soybean Exports Forecast to Reach Record
 United States Department of Agriculture Foreign Agricultural Service July 2017 U.S. Soybean Exports Forecast to Reach Record 60 Accumulated Exports by Week Total Commitments of Soybeans as of End of June
Corn Outlook. David Miller Director of Research & Commodity Services Iowa Farm Bureau Federation December 2013
 Corn Outlook David Miller Director of Research & Commodity Services Iowa Farm Bureau Federation December 2013 Source: USDA-WAOB U.S. Corn Supply & Usage U.S. Corn Supply & Usage Comments With the largest
Prospects for EU agricultural markets and income
 European Commission, DG Agriculture and Rural Development December 2014 http://ec.europa.eu/agriculture/markets-and-prices/medium-term-outlook/index_en.htm Baseline assumptions on key macroeconomic variable,
Baseline Update for International Livestock Markets
 Baseline Update for International Livestock Markets September 2018 FAPRI-MU Report #04-18 www.fapri.missouri.edu Published by the Food and Agricultural Policy Research Institute (FAPRI) at the University
Drought in South America to Limit Soybean Exports
 United States Department of Agriculture Foreign Agricultural Service Circular Series FOP 2-09 ruary 2009 Drought in South America to Limit Soybean Exports Million Tons 16 14 12 10 8 6 4 2 Annual Change
QUARTERLY REVIEW OF BUSINESS CONDITIONS: MOTOR VEHICLE MANUFACTURING INDUSTRY / AUTOMOTIVE SECTOR: 4 TH QUARTER 2016
 NATIONAL ASSOCIATION OF AUTOMOBILE MANUFACTURERS OF SOUTH AFRICA GROUND FLOOR, BUILDING F ALENTI OFFICE PARK 457 WITHERITE ROAD, THE WILLOWS, X82 PRETORIA PO BOX 40611, ARCADIA 0007 TELEPHONE: (012) 807-0152
China s Global Peanut Export Share Declines
 United States Department of Agriculture Foreign Agricultural Service Circular Series FOP 07-13 China s Global Peanut Export Share Declines U.S. 10% Others 19% Argentina 17% U.S. 11% Others 16% Argentina
Share of Brazil s Soybean Exports to China Spikes in August
 United States Department of Agriculture Foreign Agricultural Service September 2018 Share of Brazil s Soybean Exports to China Spikes in August Monthly Share of Brazil's Soybean Exports to China 85% 75%
China s Rapeseed Meal Imports Rise as Seed Imports Decline
 United States Department of Agriculture Foreign Agricultural Service February 2017 China s Rapeseed Meal Rise as Seed Decline Trend in China Rapeseed 12-Month Moving Totals Trend In China Rapeseed Meal
Devaluation Energizes Argentine Soybean Crush
 United States Department of Agriculture Foreign Agricultural Service March 2016 Devaluation Energizes Argentine Soybean Crush Argentina Quarterly Soybean Crush Volume Exchange Rate* and Constant Dollar
Argentine Exporters Switch to Soybean Oil as Biodiesel Exports Fall
 United States Department of Agriculture Foreign Agricultural Service Circular Series FOP 08-13 Argentine Exporters Switch to Soybean Oil as Biodiesel Exports Fall Argentina s soybean oil exports have surged
FED ER AL RESERVE statistical release
 FED ER AL RESERVE statistical release -! ' (3.17 (419) For release at 9:15 a.m. (EDT) April 16, INDUSTRIAL PRODUCTION AND CAPACITY UTILIZATION Industrial production decreased 0.3 percent in March following
USDA Projections of Bioenergy-Related Corn and Soyoil Use for
 USDA Projections of Bioenergy-Related Corn and Soyoil Use for 2010-2019 Daniel M. O Brien, Extension Agricultural Economist K-State Research and Extension The United States Department of Agriculture released
U.S. Soybean Prices Fall as Buyers Focus Turns to South America
 United States Department of Agriculture Foreign Agricultural Service Circular Series FOP 2-10 ruary 2010 U.S. Soybean Prices Fall as Buyers Focus Turns to South America $11.00 Daily U.S. Soybean Cash Price
ECONOMIC BULLETIN - No. 42, MARCH Statistical tables
 ECONOMIC BULLETIN - No. 42, MARCH 2006 APPENDIX Appendix Statistical tables The world economy Table a1 Gross domestic product a2 Industrial production a3 Consumer prices a4 External current account a5
AGRICULTURAL DATA BOOK
 /FJ;t;:E'~y ONlY. pjjcc.n t Remove FDCO, ERS.....,. ~ MAY 1967 jp.,.n 19 1_'j'O'O ~\"~e:.o THE FXREAST AND OCEANA AGRCULTURAL DATA BOOK US. DEPARTMENT OF AGRCULTURE ECONOMC RESEARCH SERVCE Washington,D.C.
India. Oilseeds and Products Update. February 2012
 THIS REPORT CONTAINS ASSESSMENTS OF COMMODITY AND TRADE ISSUES MADE BY STAFF AND NOT NECESSARILY STATEMENTS OF OFFICIAL U.S. GOVERNMENT POLICY Required Report - public distribution India Oilseeds and Products
China Soybean Imports Stagnant Despite Record Consumption as Production Rebounds
 United States Department of Agriculture Foreign Agricultural Service Circular Series FOP 9-08 tember 2008 China Soybean Stagnant Despite Record Consumption as Rebounds Million Tons 60 50 40 30 20 10 0
Item
 332 Key Indicators of Developing Asian and Pacific Countries 333 001 POPULATION million; as of 1 July 47.72 48.71 49.68 50.64 51.58 52.51 53.43 54.33 55.21 55.84 56.57 57.29 58.01 58.71 59.40 60.00 60.60
316 / World Biofuels: FAPRI 2009 Agricultural Outlook. World Ethanol
 WORLD BIOFUELS 316 / World Biofuels: FAPRI 2009 Agricultural Outlook World The world ethanol price increased 13.7% in 2008, to $1.76 per gallon. It is projected to decrease by almost 16%, to $1.48 per
EMBARGOED UNTIL RELEASE AT 8:30 A.M. EST, WEDNESDAY, JANUARY 30, 2013 GROSS DOMESTIC PRODUCT: FOURTH QUARTER AND ANNUAL 2012 (ADVANCE ESTIMATE)
") NEWS RELEASE EMBARGOED UNTIL RELEASE AT 8:30 A.M. EST, WEDNESDAY, JANUARY 30, 2013 Lisa Mataloni: (202) 606-5304 (GDP) gdpniwd@bea.gov Recorded message: (202) 606-5306 BEA 13-02 GROSS DOMESTIC PRODUCT:
NEWS RELEASE EMBARGOED UNTIL RELEASE AT 8:30 A.M. EST, WEDNESDAY, JANUARY 30, 2013 Lisa Mataloni: (202) 606-5304 (GDP) gdpniwd@bea.gov Recorded message: (202) 606-5306 BEA 13-02 GROSS DOMESTIC PRODUCT:
2016/17 Global Olive Oil Production Down But Prices Stabilize
 United States Department of Agriculture Foreign Agricultural Service November 2016 Global Olive Oil Down But Prices Stabilize Global Olive Oil and Stocks 4000 3500 5000 Extra Virgin Olive Oil Prices Stabilizing
Manitoba Economic Highlights
 Economic Overview Real Gross Domestic Product The Manitoba Bureau of Statistics estimates that Manitoba s real GDP grew 1.9% in 2016, above the national average of 1.4%. Manitoba s real GDP is expected
Oil Crops Outlook Economic Research Service October 12, 2012 U.S. Department of Agriculture
 Oil Crops Outlook Economic Research Service October 12, 2012 U.S. Department of Agriculture OCS-12j text Approved by the World Agricultural Outlook Board Advancing Soybean Harvest Eases Near-term Prices
280 / World Cotton: FAPRI 2005 Agricultural Outlook. World Cotton
 WORLD COTTON 280 / World Cotton: FAPRI 2005 Agricultural Outlook World Cotton The 2004/05 crop can be characterized simply as record breaking. A record 35.8 mha of cotton were harvested, producing a record
Palm and Soy Oil Use Expands at Expense of Other Oils
 United States Department of Agriculture Foreign Agricultural Service September 2015 Revised on September 15, 2015 Palm and Soy Oil Use Expands at Expense of Other Oils As global demand for vegetable oil
Soybean and Oilseed Meal Import Prospects Higher as Severe Weather Damages EU Crops
 Million Tons Million Tons Million Tons United States Department of Agriculture Foreign Agricultural Service August 2018 Soybean and Oilseed Meal Import Prospects Higher as Severe Weather Damages EU Crops
Consumer Price Index
 Series No.: SDT : 23-382 KINGDOM OF Consumer Price Index Statistical Bulletin SEPTEMBER 2018 Website: E-mail : Statistics Department P.O. Box 149 Nuku alofa Kingdom of Tonga www.spc.int/prism/tonga/ dept@stats.gov.to
Soybean Oil Prices Diverge on Different Supply Situations
 United States Department of Agriculture Foreign Agricultural Service Circular Series FOP 10-09 October 2009 Soybean Oil Prices Diverge on Different Supply Situations Soybean Oil Price ($/ton) $900 $850
THIS REPORT CONTAINS ASSESSMENTS OF COMMODITY AND TRADE ISSUES MADE BY USDA STAFF AND NOT NECESSARILY STATEMENTS OF OFFICIAL U.S.
 THIS REPORT CONTAINS ASSESSMENTS OF COMMODITY AND TRADE ISSUES MADE BY STAFF AND NOT NECESSARILY STATEMENTS OF OFFICIAL U.S. GOVERNMENT POLICY Required Report - public distribution Indonesia Oilseeds and
Growing Fuel Use Limits Exports of Soybean Oil by South America
 United States Department of Agriculture Foreign Agricultural Service Circular Series FOP 11-09 ember 2009 Growing Fuel Use Limits of Soybean Oil by South America 2006/07 Soybean Oil Distribution Soybean
EMBARGOED UNTIL RELEASE AT 8:30 A.M. EST, THURSDAY, JANUARY 30, 2014 GROSS DOMESTIC PRODUCT: FOURTH QUARTER AND ANNUAL 2013 (ADVANCE ESTIMATE)
") NEWS RELEASE EMBARGOED UNTIL RELEASE AT 8:30 A.M. EST, THURSDAY, JANUARY 30, 2014 BEA 14-03 Lisa Mataloni: (202) 606-5304 (GDP) gdpniwd@bea.gov Recorded message: (202) 606-5306 GROSS DOMESTIC PRODUCT:
NEWS RELEASE EMBARGOED UNTIL RELEASE AT 8:30 A.M. EST, THURSDAY, JANUARY 30, 2014 BEA 14-03 Lisa Mataloni: (202) 606-5304 (GDP) gdpniwd@bea.gov Recorded message: (202) 606-5306 GROSS DOMESTIC PRODUCT:
India Soybean Meal Exports: Revised and Rebounding
 United States Department of Agriculture Foreign Agricultural Service January 2017 India Soybean Meal Exports: Revised and Rebounding India Soybean Meal Exports Forecast to Rise in 8.0 Data Series Comparison
EMBARGOED UNTIL RELEASE AT 8:30 A.M. EST, FRIDAY, JANUARY 30, 2015 GROSS DOMESTIC PRODUCT: FOURTH QUARTER AND ANNUAL 2014 (ADVANCE ESTIMATE)
") NEWS RELEASE EMBARGOED UNTIL RELEASE AT 8:30 A.M. EST, FRIDAY, JANUARY 30, 2015 Lisa Mataloni: (202) 606-5304 (GDP) gdpniwd@bea.gov Jeannine Aversa: (202) 606-2649 (News Media) BEA 15-04 GROSS DOMESTIC
NEWS RELEASE EMBARGOED UNTIL RELEASE AT 8:30 A.M. EST, FRIDAY, JANUARY 30, 2015 Lisa Mataloni: (202) 606-5304 (GDP) gdpniwd@bea.gov Jeannine Aversa: (202) 606-2649 (News Media) BEA 15-04 GROSS DOMESTIC
STATISTICAL TABLES RELATING TO INCOME, EMPLOYMENT, AND PRODUCTION
 A P P E N D I X B STATISTICAL TABLES RELATING TO INCOME, EMPLOYMENT, AND PRODUCTION C O N T E N T S NATIONAL INCOME OR EXPENDITURE Page B 1. Gross domestic product, 1960 2009... 328 B 2. Real gross domestic
Business potential and challenges from the private sector perspective
 Business potential and challenges from the private sector perspective The Argentine crushing industry can be an efficient ally of the Chinese low cost meat producers, combining strengths in favor of the
Lingering Effects of Truckers Strike Impact Planting Plans
 THIS REPORT CONTAINS ASSESSMENTS OF COMMODITY AND TRADE ISSUES MADE BY USDA STAFF AND NOT NECESSARILY STATEMENTS OF OFFICIAL U.S. GOVERNMENT POLICY Required Report - public distribution Brazil Post: Brasilia
As China s Soybean Oil Imports Fall, Production Expands
 United States Department of Agriculture Foreign Agricultural Service Circular Series FOP 10-10 October 2010 As China s Soybean Oil Fall, Expands 12 10 Million Metric Tons 8 6 4 2 0 2006/07 2007/08 China
N ational Economic Trends
 DECEMBER 1994 National Economic Trends is published monthly by the Research and Public Information Division. Single-copy subscriptions are available free of charge by writing Research and Public Information,,
Brazil s Soybean Oil Exports Squeezed by Rising Biodiesel Demand
 United States Department of Agriculture Foreign Agricultural Service Circular Series FOP 6-09 e 2009 Brazil s Soybean Oil Exports Squeezed by Rising Biodiesel Demand Soybean Oil Exports and Industrial
U.S. Census Bureau News Joint Release U.S. Department of Housing and Urban Development
 Raemeka Mayo or Stephen Cooper Economic Indicators Division (301) 763-5160 FOR IMMEDIATE RELEASE TUESDAY, MAY 17, 2016 AT 8:30 A.M. EDT NEW RESIDENTIAL CONSTRUCTION IN APRIL 2016 The U.S. Census Bureau
Mid-term Outlook for World Agricultural Markets
 Mid-term Outlook for World Agricultural Markets Jacinto Fabiosa Co-Director, (515) 294-6183 jfabiosa@iastate.edu Food and Agricultural Policy Research Institute The Question of Interest? In 27 we asked,
China Tariffs Driving U.S. Soybean Exports To the European Union to a 30-Year High
 United States Department of Agriculture Foreign Agricultural Service March 2019 China Tariffs Driving U.S. Soybean Exports To the European Union to a 30-Year High 12-MONTH MOVING TOTAL U.S. SOYBEAN EXPORTS
China 2017/18 Soybean Imports Soar on Appetite for Pork, Aquaculture, and Dairy
 United States Department of Agriculture Foreign Agricultural Service June 2017 China Soybean Soar on Appetite for Pork, Aquaculture, and Dairy China: Booming Farmed Aquaculture Production China: Record
External Market Factors Impacting US Soybean Meal
 External Market Factors Impacting US Soybean Meal USSEC Luncheon International Production and Processing Expo January 3, 213 Atlanta, GA Paul Smolen Presentation Objectives Examine the economic drivers
Appendix B STATISTICAL TABLES RELATING TO INCOME, EMPLOYMENT, AND PRODUCTION
 Appendix B STATISTICAL TABLES RELATING TO INCOME, EMPLOYMENT, AND PRODUCTION C O N T E N T S Page NATIONAL INCOME OR EXPENDITURE: B. Gross domestic product, 959 005... 80 B. Real gross domestic product,
China is Key to Slow Pace of U.S. Soybean Exports
 United States Department of Agriculture Foreign Agricultural Service January 2018 China is Key to Slow Pace of U.S. Soybean Exports U.S. and Brazil Soybean Exports by Destination (Accumulated Exports:
Bangladesh: A Growing Market for U.S. Soybeans
 United States Department of Agriculture Foreign Agricultural Service December 2017 Bangladesh: A Growing Market for U.S. Soybeans 100% 310 3 Meal Equivalent Share 90% 80% 70% 60% 50% 40% 30% 20% 10% Animal
Gross Domestic Product: Third Quarter 2016 (Third Estimate) Corporate Profits: Third Quarter 2016 (Revised Estimate)
 Corporate Profits: Third Quarter 2016 (Revised Estimate)") EMBARGOED UNTIL RELEASE AT 8:30 A.M. EST, THURSDAY, DECEMBER 22, 2016 BEA 16-71 Technical: Lisa Mataloni (GDP) (301) 278-9083 gdpniwd@bea.gov Kate Pinard (Corporate Profits) (301) 278-9417 cpniwd@bea.gov
EMBARGOED UNTIL RELEASE AT 8:30 A.M. EST, THURSDAY, DECEMBER 22, 2016 BEA 16-71 Technical: Lisa Mataloni (GDP) (301) 278-9083 gdpniwd@bea.gov Kate Pinard (Corporate Profits) (301) 278-9417 cpniwd@bea.gov
Citrus: World Markets and Trade
 United States Department of Agriculture Foreign Agricultural Service y 2018 Citrus: World Markets and Trade Oranges Global orange production for is forecast to tumble 6.0 million metric tons (tons) from
EMBARGOED UNTIL RELEASE AT 8:30 A.M. EST, TUESDAY, DECEMBER 23, 2014
 NEWS RELEASE EMBARGOED UNTIL RELEASE AT 8:30 A.M. EST, TUESDAY, DECEMBER 23, 2014 Lisa Mataloni: (202) 606-5304 (GDP) gdpniwd@bea.gov BEA 14-65 Kate Shoemaker: (202) 606-5564 (Profits) cpniwd@bea.gov Jeannine
Early-Season U.S. Soybean Meal Sales Surge
 United States Department of Agriculture Foreign Agricultural Service November 2014 Early-Season U.S. Soybean Meal Sales Surge U.S. soybean meal export commitments (accumulated exports plus outstanding
Rising Coconut Oil Prices Foreshadow Tight Supplies in 2007
 United States Department of Agriculture Foreign Agricultural Service Circular Series FOP 2-07 ruary 2007 Rising Coconut Oil Prices Foreshadow Tight Supplies in 2007 800 Coconut Oil Price: CIF Rotterdam
Contents of Paper. 06-Jan-17 SIGNIFICANCE OF COMMODITIES SECTOR TO MALAYSIAN ECONOMY, WITH EMPHASIS ON OIL PALM
 SIGNIFICANCE OF COMMODITIES SECTOR TO MALAYSIAN ECONOMY, WITH EMPHASIS ON OIL PALM Ahmad Fauzi, Puasa Deputy Director Malaysian Institute of Economic Research (MIER) 17 January 2017 Contents of Paper World
Record U.S. Peanut Exports on Strong Shipments to China and Vietnam
 United States Department of Agriculture Foreign Agricultural Service September 2016 Record U.S. Peanut Exports on Strong Shipments to China and Vietnam Thousand Metric Tons 800 700 600 500 400 300 200
Gross Domestic Product: Third Quarter 2016 (Advance Estimate)
") EMBARGOED UNTIL RELEASE AT 8:30 A.M. EDT, FRIDAY, OCTOBER 28, 2016 BEA 16-57 Technical: Lisa Mataloni (GDP) (301) 278-9083 gdpniwd@bea.gov Media: Jeannine Aversa (301) 278-9003 Jeannine.Aversa@bea.gov
EMBARGOED UNTIL RELEASE AT 8:30 A.M. EDT, FRIDAY, OCTOBER 28, 2016 BEA 16-57 Technical: Lisa Mataloni (GDP) (301) 278-9083 gdpniwd@bea.gov Media: Jeannine Aversa (301) 278-9003 Jeannine.Aversa@bea.gov
2014 U.S. ETHANOL EXPORTS AND IMPORTS STATISTICAL SUMMARY
 2014 U.S. ETHANOL EXPORTS AND IMPORTS STATISTICAL SUMMARY Copyright 2015 Renewable Fuels Association. All Rights Reserved 2014 U.S. ETHANOL EXPORTS Annual U.S. Ethanol Exports, 2005-2014 1,200 1,193 1,000
Explosive Growth in Vegetable Oil Demand Exacerbates Chinese Supply Deficit, Reliance on Imports. Imports
 United States Department of Agriculture Foreign Agricultural Service Circular Series FOP 12-07 ember 2007 Million tons 35 Explosive Growth in Vegetable Oil Demand Exacerbates Chinese Supply Deficit, Reliance
Fats and Oils: Oilseed Crushings, Production, Consumption and Stocks
 ISSN: 2379-9862 Fats and Oils: Oilseed Crushings, Production, and Released September 1, 2017, by the National Agricultural Statistics Service (NASS), Agricultural Statistics Board, United States Department
Monthly Report on the Corporate Goods Price Index ( Preliminary Figures for October 2014 )
") Research and Statistics Department Bank of Japan Report on the Corporate Goods Price The fell 0.8 percent from the previous. The index excluding extra charges for summer electricity fell 0.6 percent from
Research and Statistics Department Bank of Japan Report on the Corporate Goods Price The fell 0.8 percent from the previous. The index excluding extra charges for summer electricity fell 0.6 percent from
Monthly bulletin. November Monthly bulletin VDMA. Economic and Statistic Affairs
 November 2017 Economic and Statistic Affairs Incoming orders in Germany Mechanical engineering Volume index 2015 = 100 140 130 120 110 100 90 80 70 60 Domestic Foreign 2008 2009 2010 2011 2012 2013 2014
CONSUMER TIRE REPORT APRIL Consumer Tires
 Consumer Tires President Obama announced in September of 2009 the imposition of special safeguard relief for the domestic passenger car and light truck tire industry and its workers who had been seriously
Algeria. Grain and Feed Update. Wheat update
 THIS REPORT CONTAINS ASSESSMENTS OF COMMODITY AND TRADE ISSUES MADE BY USDA STAFF AND NOT NECESSARILY STATEMENTS OF OFFICIAL U.S. GOVERNMENT POLICY Required Report - public distribution Grain and Feed
MONTHLY NEW RESIDENTIAL CONSTRUCTION, APRIL 2017
 FOR RELEASE AT 8:30 AM EDT, TUESDAY, MAY 16, MONTHLY NEW RESIDENTIAL CONSTRUCTION, APRIL Release Number: CB17-75 May 16, - The U.S. Census Bureau and the U.S. Department of Housing and Urban Development
Drought Forecast to Reduce Australian Rapeseed Exports in 2007
 United States Department of Agriculture Foreign Agricultural Service Circular Series FOP 11-06 November 2006 Drought Forecast to Reduce Australian Rapeseed Exports in 2007 1800 1600 1400 1200 1000 800
DATA BOOK AND OCEANIA ./,.~"AGRICULTURAL. for THE FAR EAST. The ]969. FILE COPY ONLY Do Not Remove FDCD ERS ( ' " '
![DATA BOOK AND OCEANIA ./,.~AGRICULTURAL. for THE FAR EAST. The ]969. FILE COPY ONLY Do Not Remove FDCD ERS ( ' '](/thumbs/90/101411856.jpg "DATA BOOK AND OCEANIA ./,.~AGRICULTURAL. for THE FAR EAST. The ]969. FILE COPY ONLY Do Not Remove FDCD ERS ( ' '") ~ ~s -\--- zlfi- lud~ - The ]969./,.~"AGRICULTURAL DATA BOOK FILE COPY ONLY Do Not Remove FDCD ERS ( ' " ' ' ', -.- for THE FAR EAST AND OCEANIA U. S. DEPARTMENT OF. AGRICULTURE ECONOMIC RESEARCH SERVICE
~ ~s -\--- zlfi- lud~ - The ]969./,.~"AGRICULTURAL DATA BOOK FILE COPY ONLY Do Not Remove FDCD ERS ( ' " ' ' ', -.- for THE FAR EAST AND OCEANIA U. S. DEPARTMENT OF. AGRICULTURE ECONOMIC RESEARCH SERVICE
QUARTERLY REVIEW OF BUSINESS CONDITIONS: NEW MOTOR VEHICLE MANUFACTURING INDUSTRY / AUTOMOTIVE SECTOR: 2 ND QUARTER 2017
 NATIONAL ASSOCIATION OF AUTOMOBILE MANUFACTURERS OF SOUTH AFRICA GROUND FLOOR, BUILDING F ALENTI OFFICE PARK 457 WITHERITE ROAD, THE WILLOWS, X82 PRETORIA PO BOX 40611, ARCADIA 0007 TELEPHONE: (012) 807-0152
Annual Report on National Accounts for 2015 (Benchmark Year Revision of 2011) Summary (Flow Accounts)
 Summary (Flow Accounts)") Annual Report on National Accounts for 2015 (Benchmark Year Revision of 2011) Summary (Flow Accounts) I. Overview of Benchmark Year Revision of 2011 P 2 II. Expenditure Series P 3 III. Income Series P
Annual Report on National Accounts for 2015 (Benchmark Year Revision of 2011) Summary (Flow Accounts) I. Overview of Benchmark Year Revision of 2011 P 2 II. Expenditure Series P 3 III. Income Series P
NATIONAL ASSOCIATION OF AUTOMOBILE MANUFACTURERS OF SOUTH AFRICA
 NATIONAL ASSOCIATION OF AUTOMOBILE MANUFACTURERS OF SOUTH AFRICA GROUND FLOOR, BUILDING F ALENTI OFFICE PARK 457 WITHERITE ROAD, THE WILLOWS, X82 PRETORIA PO BOX 40611, ARCADIA 0007 TELEPHONE: (012) 807-0152
CURRENT AGRICULTURAL INDUSTRIAL REPORTS
 CURRENT AGRICULTURAL INDUSTRIAL REPORTS USDA Agricultural Outlook Forum Troy Joshua, Chief Environmental, Economics, and Demographics Branch 2/20/2015 10:26 AM 1 Objectives Discuss the history of the Current
Fats and Oils: Oilseed Crushings, Production, Consumption and Stocks
 ISSN: 2379-9862 Fats and Oils: Oilseed Crushings, Production, and Released August 1, 2017, by the National Agricultural Statistics Service (NASS), Agricultural Statistics Board, United States Department
Solomon Islands Government. Statistical Bulletin: 19 /2011. HONIARA CONSUMER PRICE INDEX (November 2011)
") Solomon Islands Government Statistical Bulletin: 19 /2011 HONIARA CONSUMER PRICE INDEX (November 2011) Solomon Islands National Statistics Office Ministry of Finance & Treasury PO Box G6 Honiara Enquiries:
Solomon Islands Government Statistical Bulletin: 19 /2011 HONIARA CONSUMER PRICE INDEX (November 2011) Solomon Islands National Statistics Office Ministry of Finance & Treasury PO Box G6 Honiara Enquiries:
An Economic Analysis of Legislation for a Renewable Fuels Requirement for Highway Motor Fuels
 An Economic Analysis of Legislation for a Renewable Fuels Requirement for Highway Motor Fuels John M. Urbanchuk Executive Vice President AUS Consultants November 2001 EXECUTIVE SUMMARY Congress is considering
EUROPEAN COMMISSION DIRECTORATE-GENERAL FOR ECONOMIC AND FINANCIAL AFFAIRS BUSINESS AND CONSUMER SURVEY RESULTS. April 2011
 EUROPEAN COMMISSION DIRECTORATE-GENERAL FOR ECONOMIC AND FINANCIAL AFFAIRS BUSINESS AND CONSUMER SURVEY RESULTS April 2011 From February 2011 onwards, business surveys are presented exclusively in accordance
Fats and Oils: Oilseed Crushings, Production, Consumption and Stocks
 ISSN: 23799862 Fats and Oils: Oilseed Crushings, Production, and Released February 1, 2018, by the National Agricultural Statistics Service (NASS), Agricultural Statistics Board, United States Department
The Russian building market
 The Russian building market Despite remaining in recession, the Russian economy began to show the first signs of improvement in 2016 (GDP -0.6% following the sharp -3.7% downturn in 2015). According to
Oil Crops Outlook. Mark Ash and Erik Dohlman. Soybean Prices Benefit from a Strong Vegetable Oil Market
 United States Department of Agriculture Electronic Outlook Report from the Economic Research Service Oil Crops Outlook www.ers.usda.gov OCS-06k Dec. 12, 2006 Mark Ash and Erik Dohlman Soybean Prices Benefit
EDF Group 2006 sales : 58.9 billion, up 15.4 %
 Paris, February 14, 2007 EDF Group 2006 sales : 58.9 billion, up 15.4 % EDF Group s consolidated sales amounted to 58.9 billion in 2006, up 15.4 % on 2005. Organic growth 1 stood at 11 % (mainly broken
Strong Brazilian Soybean Sales Expected to Slow Rebound in Argentine Exports
 United States Department of Agriculture Foreign Agricultural Service December 2018 Strong Brazilian Soybean Sales Expected to Slow Rebound in Argentine Exports Oct. 1 - Nov. 30 Brazil Soybean Exports (Million
Fats and Oils: Oilseed Crushings, Production, Consumption and Stocks
 ISSN: 2379-9862 Fats and Oils: Oilseed Crushings, Production, and Released November 1, 2018, by the National Agricultural Statistics Service (NASS), Agricultural Statistics Board, United States Department
Economic and Commodity Market Outlook
 Economic and Commodity Market Outlook August 12, 2016 By Robert Coats, Ph.D. Professor Economics Department of Agricultural Economics and Agribusiness Division of Agriculture University of Arkansas System
THIS REPORT CONTAINS ASSESSMENTS OF COMMODITY AND TRADE ISSUES MADE BY USDA STAFF AND NOT NECESSARILY STATEMENTS OF OFFICIAL U.S.
 THIS REPORT CONTAINS ASSESSMENTS OF COMMODITY AND TRADE ISSUES MADE BY USDA STAFF AND NOT NECESSARILY STATEMENTS OF OFFICIAL U.S. GOVERNMENT POLICY Required Report - public distribution Oilseeds and Products
Wheat Marketing Situation
 Wheat Marketing Situation Prepared by: Darrell L. Hanavan Executive Director Colorado Wheat Administrative Committee If you would like to receive an email when this report is updated, email gmostek@coloradowheat.org
RELATIONSHIP BETWEEN STEEL IMPORTS AND U.S. STEEL INDUSTRY CAPACITY UTILIZATION
 RELATIONSHIP BETWEEN STEEL IMPORTS AND U.S. STEEL INDUSTRY CAPACITY UTILIZATION Prepared by: Martin Associates www.martinassoc.net 941 Wheatland Ave., Suite 203 Lancaster, PA 17603 April 18, 2018 Justification
Solomon Islands Government. Statistical Bulletin: 11/2011. HONIARA CONSUMER PRICE INDEX (June 2011)
") Solomon Islands Government Statistical Bulletin: 11/2011 HONIARA CONSUMER PRICE INDEX (June 2011) Solomon Islands National Statistics Office Ministry of Finance & Treasury PO Box G6 Honiara Enquiries:
Solomon Islands Government Statistical Bulletin: 11/2011 HONIARA CONSUMER PRICE INDEX (June 2011) Solomon Islands National Statistics Office Ministry of Finance & Treasury PO Box G6 Honiara Enquiries:
Monthly Hog Market Update United States Hog Production
 This information is provided as a resource by Saskatchewan Agriculture staff All prices are in Canadian dollars unless otherwise noted. Please use this information at your own risk. Monthly Hog Market