LOS ANGELES :F~R'E DEPARTMENT
|
|
|
- Leonard Tucker
- 6 years ago
- Views:
Transcription
1 &.>i)? 4,c.$- '85p LOS ANGELES :F~R'E DEPARTMENT DOUGLAS L. BARRY FlRE CHIEF March 17,2009 BOARD OF FlRE COMMISSIONERS FILE NO. *'w& TO: FROM: Board of Fire Commissioners Douglas L. Barry, Fire Chief D ~'0 SUBJECT: FlRE DEPARTMENT STATISTICS FOR FOURTH QUARTER 2008 FOR INFORMATION ONLY: - Approved - Approved wlcorrections - Withdrawn - Denied - Received & Filed - Other For Information Only Attached is a statistical summary of Fire Department emergency incidents, responses and response times during the three-month period of October, November and December The information is derived from the field data that Department members have entered into the National Field Incident Reporting System (NFIRS), and the dispatch records and field status entries into the Fire Command and Control System. The attached report is provided for your review and interest. Board report prepared by William N. Wells, Captain Il-Paramedic, Planning Section. Attachment


2 J. J-I'
3 QUARTERLY STATISTICAL REPORTS The following statistical reports are provided for your information: Daily Emergency lncidents Dispatched EMS lncidents EMS Dispatch Categories EMS Transports Average Daily Fire lncidents Resource Workload Analysis Engine Company Monthly Workload Light Force Monthly Workload Paramedic Ambulance Monthly Workload Paramedic Ambulance Daily Workload BLS Ambulance Monthly Workload BLS Ambulance Daily Workload Battalion Chief Workload EMS Battalion Captain Workload Average Time Spent on each Response Quarterly lncidents and Responses List Quarterly lncidents and Responses Charts EMS lncidents Chart Hospital Transports Response Times by Division and Citywide: First Unit on scene Structure Fires First Unit on scene ALS High-Risk incidents First ALS Unit on scene ALS High-Risk incidents First ALS Ambulance on scene ALS High-Risk incidents First Unit on scene BLS lncidents First Unit on scene other Fires Response Time percentages of first resources on scene (4 pages) Prepared by Captain Wells, LAFD Planning Section on
4 LOS ANGELES FlRE DEPARTMENT DAILY EMERGENCY INCIDENTS 998 INCIDENTS PER DAY EMS INCIDENTS 82 % 815 PER DAY STRUCTURE FIRES 1 % 12 PER DAY OTHER FIRES 4% 36 PER DAY FIRE ALARMS 7% 72 PER DAY RESCUES I % 13 PER DAY HAZARDS a./, 9 PER DAY OTHER NQN-EMS 4% 41 PER DAY
5 DISPATCHED EMS IIMCIIDIENTS ALS - HIGH RISK ALS - EMERGENCY BLS - EMERGENCY BLS - NON-EMERGENCY 7,953 INCIDENTS 39,796 INCIDENTS 18,000 INCIDENTS 9,202 INCIDENTS ALS - HR 86 PER DAY 11 % OF EMS INCIDENTS ALS - E 433 PER DAY 53 % OF EMS INCIDENTS BLS - E 196 PER DAY 24 % OF EMS INCIDENTS BLS - NE 100 PER DAY 12 % OF EMS INCIDENTS 815 EMS INCIDENTS PER DAY ALS INCIDENTS 519 PER DAY 64 % ALS BLS INCIDENTS 296 PER DAY 36 % BLS
6 EMS DISPATCH CATEGORIES ABDOMINAL PAlN I PROBLEMS ALLERGIES I ENVENOMATIONS ANIMAL BITES I ATTACKS ASSAULT I SEXUAL ASSAULT BACK PAlN (Non-Traumatic) BREATHING PROBLEMS BURNS I EXPLOSION CARBON MONOXIDE / INHALATION CARDIAC I RESP. ARREST I DEATH CHEST PAlN CHOKING CONVULSIONS I SEIZURES DIABETIC PROBLEMS DROWNING I DIVING ACCIDENT ELECTROCUTION I LIGHTNING EYE PROBLEMS I INJURIES FALLS HEADACHE HEART PROBLEMS / A.I.C.D. HEAT I COLD EXPOSURE HEMORRHAGE I LACERATIONS INDUSTRIAL ACCIDENTS OVERDOSE I POISONING PREGNANCY / CHILDBIRTH PSYCHIATRIC I SUICIDE AlTEMPT SICK PERSON STAB I GUNSHOT I PENE. TRAUMA STROKE (CVA) TRAFFIC / TRANSP. ACCIDENTS TRAUMATIC INJURIES UNCONSCIOUS I FAINTING UNKNOWN PROBLEM INTERFACILITY I PALLIATIVE CARE 2,390 incidents 422 Incidents 204 incidents 3,979 incidents 485 incidents 9,831 incidents 109 incidents 16 incidents 1,477 incidents 5,504 incidents 41 0 incidents 3,399 incidents 2,177 incidents 3 incidents 24 incidents 1 15 incidents 6,571 incidents 464 incidents 1,012 incidents 32 incidents 1,874 incidents 3 incidents 1,824 incidents 650 incidents 716 incidents 6,020 incidents 903 incidents 1,163 incidents 8,522 incidents 2,214 incidents 6,363 incidents 5,846 incidents 40 incidents 26.0 per day 4.6 per day 2.2 per day 43.3 per day 5.3 per day per day 1.2 per day 0.2 per day 16.1 per day 59.8 per day 4.5 per day 36.9 per day 23.7 per day 0.1 per day 0.3 per day 1.3 per day 71.4 per day 5.0 per day 11.0 per day 0.3 per day 20.4 per day 0.1 per day 19.8 per day 7.1 per day 7.8 per day 65.4 per day 9.8 per day 12.6 per day 92.6 per day 24.1 per day 69.2 per day 63.5 per day 0.4 per dav TOTAL EMS INCIDENTS 74,951 incidents 815 per day 100 %
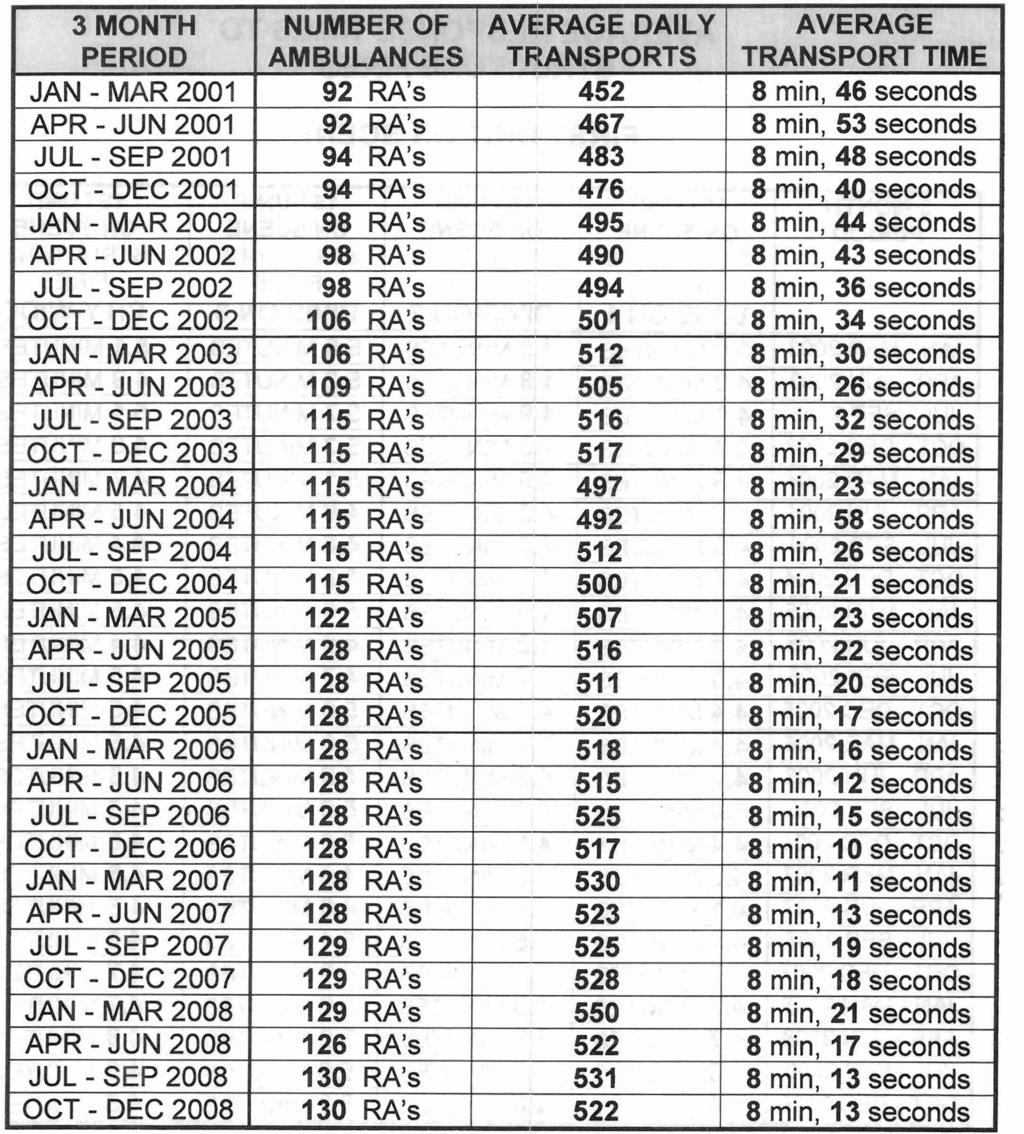
7 EMS TRANSPORTS ALS - HR 7,953 INCIDENTS 63 % RESULT IN TSP ALS - E 39,796 INCIDENTS 73 % RESULT IN TSP BLS - E 18,000 INCIDENTS 46 % RESULT IN TSP BLS - NE 9,202 INCIDENTS 54 % RESULT IN TSP 63 % OF EMS INCIDENTS ALS - HR 5,052 TRANSPORTS 55 PER DAY ALS - E 29,272 TRANSPORTS 318 PER DAY BLS - E 8,365 TRANSPORTS 91 PER DAY BLS - NE 5,077 TRANSPORTS 55 PER DAY NON-EMS 237 TRANSPORTS 3 PER DAY 522 TRANSPORTS PER DAY ALS INCIDENT TRANSPORTS 376 PER DAY 72 % ALS BLS INCIDENT TRANSPORTS 146 PER DAY 28 % BLS 6


8 AVERAGE DAILY FIRE INCIDENTS IENT I r Struc Fi Repc Smo~e - I nla Be Ring.. rina., Smoke - Detector Wa Flc Auto Fire Rubbish Fire All other fire incidents 4th QTR st QTR nd QTR rd QTR th QTR
9 RESOURCE WORKI-OAD ANALYSIS The Fire Department's Strategic Plan for Fire Facilities and Resource Deployment is a plan designed for the management of Fire Department facility modifications and resource deployment necessary to accomplish the Fire Department's mission to the Year The Strategic Plan contains criteria for the deployment of resources. Workload is one criterion, along with response times, simultaneously occurring incidents, and land use. In an effort to maximize performance and minimize response times, control of resource workload is very important. In April 1988, the City Administrative Office (CAO) completed a Management Audit of the Fire Department Paramedic Service. The Audit reviewed the Fire Department's entire EMS system. Based on this analysis, the CAO recommended maximum emergency response workloads for Paramedic rescue ambulance resources. Further, the Fire Department presented workload guidelines for other Fire Department resources that were accepted by the CAO. The recommendations were intended to prevent the degradation of medical services caused by excessive workloads. The maximum recommended workloads are as follows: Engine (Single-Engine Station) Engine (Task Force Station) Paramedic Rescue Ambulance BLS (EMT) Rescue Ambulance 240 maximum responses per month (240 monthly = 7.8 per shift) 300 maximum responses per month (300 monthly = 9.8 per shift) 350 maximum responses per month (350 monthly = 11.4 per shift) 420 maximum responses per month (420 monthly = 13.7 per shift) Based on the number of responses during October, November and December of 2008, the following Department resources are exceeding the workload guidelines: Engine companies at single-engine stations (13): Engines 6, 7, 13, 21, 34,41, 46, 52, 57, 65, 82, 91, 102 Engine or Light Force companies at task force stations (5): Engines 9, 209, 39, 64, Light Force 64 Paramedic Rescue Ambulances (5): Rescues 33,46, 257,64,66 BLS Rescue Ambulances (4): Rescue 81 1, 833,857, 864 With the addition of 33 Paramedic RA's since January 2001, the number of Paramedic RA's exceeding the workload guidelines has been reduced from 22 to just 3.


10 ENGINE COMPANY MONTHLY WORKLOAD AVERAGE OF MONTHLY RESPONSES PREVIOUS QUARTER WAS 190 DECREASE OF 3.3 %
11 LIGHT FORCE MONTHLY WORKLOAD LF Responses LF LF LF LF LF LF LF LF LF LF LF TK LF LF LF LF LF LF LF LF LF 90 I 24 tf LF LF LF Responses LF LF LF LF LF LF 2 'I01 LF LF 4 88 LF 5 84 LF LF LF LF LF LF LF LF 1 72 LF LF LF LF LF 47 4'6 LF AVERAGE OF 131 MONTHLY RESPONSES PREVIOUS QUARTER WAS 137 DECREASE OF 4.5 %


12 PARAMEDIC AMBULANCE MONTHLY WORKLOAD PREVIOUS QUARTER WAS 229 DECREASE OF 0.8 %

13 PARAMEDIC IRA DAILY WORKLOAD AVERAGE OF 7.41 DAILY RESPONSES PREVIOUS QUARTER WAS 7.47 DECREASE OF 0.8 %
14 BLS AMBULANCE MONTHLY WORKLOAD RA Responses RA RA V-24 hours RA RA RA RA RA RA RA RA RA RA RA RA RA RA RA RA RA RA RA Responses RA RA RA RA V-12 hours RA RA 841 -V 145 V-12 hours RA V-12 hours RA RA RA RA RA RA RA RA RA RA RA RA AVERAGE OF 252 MOMTHC-Y RESPONSES PREVIOUS QUARTER WAS 250 INCREASE OF 0.7 %


15 BLS RA DAILY WORKLOAD RA Responses RA RA V-24 hours RA RA RA RA RA RA RA RA RA RA RA RA RA RA RA RA RA RA Responses V-12 hours V-I2 hours 4.7 V-12 hours I AVERAGE OF 8.21 DAILY RESPONSES PREVIOUS QUARTER WAS 8.16 INCREASE OF 01.7 %
16 LOS ANGELES FlRE DEPARTMENT BATTALION BATT 13 BATT 12 BATT 10 BATT 3 BATT 18 BATT 14 BATT 17 BATT 11 BAT 5 BATT 1 BATT 9 BATT 7 BATT 15 BATT 4 BATT 6 BAT 2 RESPONSES TOTAL DAILY EMS FlRE & NON-EMS EMERGENCY HOURS TOTALS: 3, ,436 1, AVERAGE OF 2.04 DAILY RESPONSES (1 2% Increase) AVERAGE OF 35 MINUTES PER RESPONSE (15% Increase) AVERAGE OF 71 MINUTES PER SHIFT PER BATTALION (29% Increase)
17 LOS ANGELES FlRE DEPARTMENT EMS BATTALION CAPTAIN WORKLOAD RESPONSES BATTALION TOTAL ALS EMS EMS BLS EMS 45 FlRE & NON-EMS 226 EMERGENCY HOURS EMS EMS EMS EMS EMS EMS EMS EMS EMS EMS EMS EMS EMS EMS EMS TOTALS: 5,117 2,283 AVERAGE OF 3.48 DAILY RESPONSES (1% Increase) AVERAGE OF 34 MINUTES PER RESPONSE (15% Increase) AVERAGE OF 119 MINUTES PER SHIFT PER BATTALION (1 6% Increase)
18 AVERAGE TIME SPENT ON EACH REiSPONSE DIVISION CHIEF BATTALION CHIEF EMS BATTALION CAPTAIN BLS LIGHT FORCE BLS ENGINE ASSESSMENT LIGHT FORCE ASSESSMENT ENGINE BLS RA PARAMEDIC RA AIR AMBULANCE FIREBOAT HAZ-MAT SQUAD AIRPORT CRASH RESCUE EMERGENCY AIR URBAN SEARCH & RESCUE ARSON INVESTIGATOR BRUSHPATROL REHAB AIR TENDER 93 MINUTES 35 MINUTES 34 MINUTES 21 MINUTES 23 MINUTES 22 MINUTES 23 MINUTES 29 MINUTES 35 MINUTES 101 MINUTES 28 MINUTES 30 MINUTES 41 MINUTES 58 MINUTES 67 MINUTES 105 MINUTES 399 MINUTES 478 MINUTES


NTH PERIODS")


19 3-MONTH PERIODS 2006, 2007 & L I - j I QI- 42- Q3- Q4- Q1- Q2- Q3- Q4- Q1- Q2- Q3- Q )NTH PERIODS 6,2007 & 2008 QI- Q2- Q3- Q4- Q1- Q2- Q3-04- Q1- Q2- Q
20 Quarter Q1-99 Q2-99 Q3-99 Q4-99 Q1-00 Q2-00 Q3-00 Q4-00 Q1-01 Q2-01 Q3-01 Q4-0 1 Q1-02 Q2-02 Q3-02 Q4-02 Q1-03 Q2-03 Q3-03 Q4-03 Q1-04 Q2-04 Q3-04 Q4-04 Q1-05 Q2-05 Q3-05 Q4-05 Q1-06 Q2-06 Q3-06 Q4-06 Q 1-07 Q2-07 Q3-07 Q4-07 Q1-08 Q2-08 Q3-08 Q4-08 LOS ANGELES FIRE DEPARTMENT INCIDENTS AND RESPONSES Compared to Compared to Average One Year One Year Units Incidents Prior Responses Prior Responding 75, , , , , , ,887 82, , , ,977 3% 146,505 6% ,303 6% 150,302 9% ,506 6% 157,OI 3 10% ,327 81,541-1% 616, ,788 4% ,573 5% 157,390 7% ,162 5% 160,582 7% ,604 5% 164,840 5% ,449 84,110 3% 645, , % ,780 4% 163,914 4% ,239 1% 162,418 1% ,686 1% 166,113 1% ,202 85,497 2% 665, ,239 7% ,592 2% 175,898 7% ,771 2% 174,553 7% ,980 4% 183,150 10% ,526 90,183 5% 716, ,555 5% , % 175, % ,771 same 173, % , % 179, % ,758 87, % 707, , % , % 178, % , % 177, % ,492 same 179, % ,458 89, % 719, , % , % 181, % , % 182, % , % 197, % ,663 90, %. 751, , % , % 188, % , % 181, % , % 190, % ,864 91, % 748, , % , % 191, % , % 183, % , % 179, % ,259 91, % 731, , % 1.93


21 3-MONTH PERIODS QI- Q2- Q Q2- Cl3- Q4- Q1- Q2- Q3- Q n9 507,
22


23 CITY-WIDE AVERAGE RESPONSE TIMES TO STRUCTURE FIRES FIRST UNlT 3 MONTH PERIOD JAN - MAR 2003 APR - JUN 2003 JUL - SEP 2003 OCT - DEC 2003 JAN-MAR2004 APR - JUN 2004 JUL - SEP 2004 OCT - DEC 2004 JAN - hlar 2005 APR - JUN 2005 JUL - SEP 2005 OCT - DEC 2005 JAN - MAR 2006 APR - JUN ST UNIT STPa,UCTV?E FIRES DIVISION MINUTES 4.9 MINUTES 4.9 MINUTES 4.7 MINUTES 4.5MlNUTES 4.6 MINUTES 4.3 MINUTES 4.4 MINUTES 4.4 MINUTES 4.2 MINUTES 4.6 MINUTES 4.4 MINUTES 4.4 MINUTES 4.4 MINUTES 1 ST UNIT STRUC'I-V?E FIRES DIVISION MINUTES 4.8 MINUTES 4.9 MINUTES 4.5 MINUTES 4.5MlNlJTES 4.2 MINUTES 4.3 MINUTES 4.3 MINUTES 4.3 MINUTES 4.2 MINUTES 4.4 MINUTES 4.3 MINUTES 4.4 MINUTES 4.5 MINUTES 1ST UNIT Sa$UCT'V?E FIRES DIVISION MINUTES 5.3 MINUTES 5.1MlNUTES 4.9 MINUTES 4.8 MINUTES 4.8 MINUTES 5.0 MINUTES 4.9 MINUTES 4.7 MINUTES 5.0 MINUTES 5.0 MINUTES 4.8 MINUTES 1ST UNIT ST?UC-?J?E FIRES CITY-WIDE 5.1 MINUTES 4.9 MINUTES 5.1 MINUTES 4.8 MINUTES 4.7 MINUTES 4.5 MINUTES 4.4 MINUTES 4.5 MINUTES 4.5 MINUTES 4.4 MINUTES 4.5 MINUTES 4.5 MINUTES 4.5 MINUTES 4.6 MINUTES
24 CITY-WIDE AVERAGE RESPONSE TIMES TO ALS HIGH-RISK INCIDENTS FIRST UNlT 3 MONTH PERIOD JAN - MAR 2003 APR - JUN 2003 JUL - SEP 2003 OCT - DEC 2003 JAN - MAR 2004 APR - JUN 2004 JUL - SEP 2004 OCT - DEC 2004 JAN - MAR 2005 APR - JUN 2005 JUL - SEP 2005 OCT - DEC 2005 JAN - MAR 2006 APR - JUN 2006 JUL - SEP 2006 OCT - DEC 2006 JAN - MAR 2007 APR - JUN 2007 JUL - SEP 2007 OCT-DEC2007 JAN - MAR 2008 APR - JUN 2008 JUL - SEP 2008 OCT - DEC ST UNIT ALS INCIDENTS DIVISION MINUTES 5.3 MINUTES 5.3 MINUTES 5.2 MINUTES 5.2 MINUTES 5.1 MINUTES 5.2 MINUTES 5.2 MINUTES 5.2 MINUTES 5.2 MINUTES 5.2 MINUTES 5.2 MINUTES 5.2 MINUTES 5.2 MINUTES 5.5MlNUTES 1ST UNIT ON SClENE ALS INCIDENTS DIVISION MINIUTES 5.6 MlNlUTES 5.3 MINUTES 5.3 MINUTES 5.6 MlN UTES 5.8 MINUTES 5.7MlNUTES 5.8 MINUTES 1ST UNIT ALS INCIDENTS DIVISION MINUTES 5.8 MINUTES 5.8 MINUTES 5.8 MINUTES 5.9MlNUTES 6.0 MINUTES 6.0 MINUTES 6.0 MINUTES 1ST UNIT ALS INCIDENTS CITY-WIDE 5.8 MINUTES 5.8 MINUTES 5.8 MINUTES
25 CITY-WIDE AVERAGE RESPONSE TIMES TO ALS HIGH-RISK INCIDENTS FIRST PARAMEDIC UNlT 3 MONTH PERIOD JAN-MAR2003 APR - JUN 2003 JUL - SEP 2003 OCT - DEC 2003 JAN - MAR 2004 APR - JUN 2004 JUL - SEP 2004 OCT - DEC 2004 JAN-MAR2005 APR - JUN 2005 JUL - SEP 2005 OCT - DEC 2005 JAN - L4AR 2006 APR - JUN 2006 JUL - SEP 2006 OCT - DEC 2006 JAN - MAR 2007 APR - JUN 2007 JUL-SEP2007 OCT - DEC 2007 JAN - MAR 2008 APR - JUN 2008 JUL - SEP 2008 OCT - DEC ST ALS UNIT ALS INCIDENTS DIVISION I 6.5MlNUTES 6.1 MINUTES 6.0 MINUTES 6.1 MINUTES 6.IMlNUTES 6.1 MINUTES 6.2 MINUTES 6.1 MINUTES 6.2 MINUTES 6.2 MINUTES 6.6MlNUTES ISTALS UNIT ALS INCIDENTS DIVISION 2 7.OMlNrJTES 6.6MlNUTES 7.1MlNUTES 7.3 MINUTES ISTALS UNIT ALS INCIDENTS DIVISION 3 7.OMlNUTES 6.3MlNUTES 6.2 MINUTES 6.2 MINUTES 6.4MlNUTES 1ST ALS UNIT ALS INCIDENTS CITY-WIDE
26 CITY-WIDE AVERAGE RESPONSE TIMES TO ALS HIGH-RISK INCIDENTS FIRST PARAMEDIC AMBULANCE 3 MONTH PERIOD JAN - MAR 2003 APR - JUN 2003 JUL - SEP 2003 OCT - DEC 2003 JAN - MAR 2004 APR - JUN 2004 JUL - SEP 2004 OCT - DEC 2004 JAN - baar 2005 APR - JUN 2005 JUL - SEP 2005 OCT - DEC 2005 JAN - MAR 2006 APR - JUN 2006 JUL - SEP 2006 OCT - DEC 2006 JAN - MAR 2007 APR - JUN 2007 JUL - SEP 2007 OCT - DEC 2007 JAN - MAR 2008 APR - JUN 2008 JUL - SEP 2008 OCT- DEC ST ALS AMBULANCE ALS INCIDENTS DIVISION I 1ST ALS AMBULANCE ON SCE:NE ALS INCIDENTS DIVISION MlNlJTES 7.2 MlNlJTES 6.9 MlNlJTES 7.1 MlNlJTES 7.1 MlNlJTES 7.1 MlNlJTES 7.1 MlNlJTES 7.2 MlNlJTES 7.4 MINUTES 7.3 MlNlJTES 7.3 MlNlJTES 7.5 MINUTES 1ST ALS AMBULANCE ALS INCIDENTS DIVISION MINUTES 7.9 MINUTES 7.8 MINUTES 7.3 MINUTES 7.3 MINUTES 7.2 MINUTES 7.2 MINUTES 7.2 MINUTES 7.2 MINUTES 7.3 MINUTES 7.2 MINUTES 7.2 MINUTES 7.2 MINUTES 1ST ALS AMBULANCE ALS INCIDENTS CITY-WIDE 7.3 MINUTES 7.3 MINUTES 7.3 MINUTES 7.2 MINUTES 7.2 MINUTES


27 CITY-WIDE AVERAGE RESPONSE TIMES TO BLS INCIDENTS FIRST UNlT 3 MONTH PERIOD JAN-MAR2003 APR - JUN 2003 JUL - SEP 2003 OCT - DEC 2003 JAN - MAR 2004 APR - JUN 2004 JUL - SEP 2004 OCT - DEC 2004 JAN - MAR 2005 APR - JUN 2005 JUL - SEP 2005 OCT - DEC 2005 JAN - IMAR 2006 APR - JUN 2006 JUL - SEP 2006 OCT - DEC 2006 JAN - WlAR 2007 APR - JUN 2007 JUL - SEP 2007 OCT - DEC 2007 JAN - MAR 2008 APR - JUN 2008 JUL - SEP 2008 OCT - DEC ST UNIT BLS INCIDENTS DIVISION 1 6.7MlNUTES 6.1 MINUTES 6.1 MINUTES 6.2 MINUTES 1ST UNIT B LS' INCIDENTS DIVISION 2 7.IMlNlJTES 7.0 MlNlJTES 7.1 MlNlJTES 7.1 MlNlJTES 7.1 MlNlJTES 7.2 MlNlJTES 7.0 MlNlJTES 7.0 MlNlJTES 6.9 MlNlJTES 7.1 MlNlJTES 7.2 MlNlJTES 7.0 MlNlJTES 7.0 MlNlJTES 7.3 MINUTES 1 ST UNIT BLS INCIDENTS DIVISION 3 7.ZMlNUTES 7.2 MINUTES 7.2 MINUTES 7.3 MINUTES 7.2 MINUTES 7.3 MINUTES 7.3 MINUTES 1ST UNIT BLS INCIDENTS CITY-WIDE 7.2 MINUTES
28 LOS ANGELES FlRE DEPARTMENT CIN-WIDE AVERAGE RESPONSE TIMES TO OTHER FlRE INCIDENTS FIRST UNlT 3 MONTH PERIOD JAN - MAR 2003 APR - JUN 2003 JUL - SEP 2003 OCT - DEC 2003 JAN - MAR 2004 APR - JUN 2004 JUL - SEP 2004 OCT - DEC 2004 JAN - MAR 2005 APR - JUN 2005 JUL - SEP 2005 OCT - DEC 2005 JAN - MAR 2006 APR - JUN 2006 JUL - SEP 2006 OCT - DEC 2006 JAN-MAR2007 APR - JUN 2007 JUL - SEP 2007 OCT-DEC2007 JAN-MAR2008 APR-JUN2008 JUL - SEP 2008 OCT - DEC 2008 I ST UNIT OTME? FIRES DIVISION MINUTES 6.1 MINUTES 6.2 MINUTES 6.0 MINUTES 6.1 MINUTES 6.1 MINUTES 5.8 MINUTES 6.0 MINUTES 5.3 MINUTES 5.4MlNUTES 5.7MlNUTES 5.6MlNUTES 5.5MlNUTES 5.8 MINUTES 1 ST UNIT OTHE39 FIRES DIVISION MlNlJTES 6.1 MINUTES 6.0 MINUTES 5.8 MINUTES 5.5MlNUTES 5.7MlNUTES 5.7MlNUTES 5.7MlNUTES 1ST UNIT OTHET FIRES DIVISION MINUTES 6.0 MINUTES 6.2 MINUTES 6.1 MINUTES 6.1 MINUTES 6.2 MINUTES 6.2 MINUTES 6.1 MINUTES 6.1MlNUTES 6.1 MINUTES 6.1 MINUTES 1ST UNIT OTHEA: FIRES CITY-WIDE 6.1 MINUTES 6.2 MINUTES 6.2 MINUTES 6.2 MINUTES 6.2 MINUTES 6.0 MINUTES 6.0 MINUTES 6.0 MINUTES 6.2 MINUTES 5.8 MINUTES 5.8 MINUTES 5.8 MINUTES 5.8 MINUTES
29 RESPONSE TIIMES FOR FIRST RESOURCE ALL EMERGENCY INCIDENTS LESS THAN 5 MINUTES 62% 2%& 48,918 incidents out of 78,663 LESS THAN 6 MINUTES 79% I%& 61,811 incidents out of 78,663 LESS THAN 7 MINUTES 88% I%& 68,951 incidents out of 78,663 I LESS THAN 8 MINUTES 92% I%& 72,745 incidents out of 78,663 LESS THAN 9 MINUTES 95% I%& 74,871 incidents out of 78,663 LESS THAN 10 MINUTES 97% 76,108 incidents out of 78,663 STRUCTURE FIRES LESS THAN I 5MlNUTES 86% 935 incidents out of 1,086 LESS THAN 6 MINUTES 94% 1,016 incidents out of 1,086 LESS THAN 7 MINUTES 97% 1,054 incidents out of 1,086 LESS THAN 8 MINUTES 98% 1,065 incidents out of 1,086 LESS THAN 9 MINUTES 99% 1,072 incidents out of 1,086 LESS THAN 10 MINUTES 99% 1,078 incidents out of 1,086 EMS - ALS HIGH RISK LESS THAN 5 MINUTES 71% I%& 5,483 incidents out of 7,757 LESS THAN 6 MINUTES 85% I%& 6,583 incidents out of 7,757 LESS THAN 7 MINUTES 91% 2%& 7,094 incidents out of 7,757 LESS THAN 8 MINUTES 95% I%& 7,349 incidents out of 7,757 LESS THAN 9 MINUTES 97% I %& 7,497 incidents out of 7,757 LESS THAN 10 MINUTES 98% 1 %& 7,582 incidents out of 7,757 l%?' = 1 % increase (improvement) from previous quarter 2%& = 2% decrease from previous quarter NUMBERS IN RED DO NOT MEET LAFD RESPONSE TlME STANDARD OF 90 %. NUMBERS IN GREEN SURPASS THE LAFD RESPONSE TlME STANDARD OF 90 %.
30 RESPONSE TIMES FOR FIRST RESOURCE EMS - ALS EMERGENCY LESS THAN 5 MINUTES 64% 25,348 incidents out of 39,442 LESS THAN 6 MINUTES 81 % 1 %& 32,144 incidents out of 39,442 LESS THAN 7 MINUTES 91% 35,747 incidents out of 39,442 LESS THAN 8 MINUTES 95% 37,462 incidents out of 39,442 LESS THAN 9 MINUTES 97% 38,312 incidents out of 39,442 LESS THAN 10 MINUTES 98% 38,791 incidents out of 39,442 EMS - BLS EMERGENCY LESS THAN 5 MINUTES 57% 3%& 9,679 incidents out of 16,857 LESS THAN 6 MINUTES 74% 2%& 12,436 incidents out of 16,857 LESS THAN 7 MINUTES 84% 2%& 14,081 incidents out of 16,857 LESS THAN 8 MINUTES 89% 2%& 15,070 incidents out of 16,857 LESS THAN 9 MINUTES 93% 1 %& 15,652 incidents out of 16,857 LESS THAN 10 MINUTES 95% 1 %& 15,978 incidents out of 16,857 LESS THAN 15 MINUTES '99% 16,687 incidents out of 16,857 EMS - BLS NON-EMERGENCY LESS THAN 5 MINUTES 24% 8%& 2,034 incidents out of 8,528 LESS THAN 6 MINUTES 35%12%& 2,982 incidents out of 8,528 LESS THAN 7 MINUTES 47%13%& 4,012 incidents out of 8,528 LESS THAN 8 MINUTES.57%14%& 4,862 incidents out of 8,528 LESS THAN 9 MINUTES 66%?3%& 5,605 incidents out of 8,528 LESS THAN 10 MINUTES 72%~ 2%& 6,176 incidents out of 8,528 LESS THAN 15 MINUTES 93% 4%& 7,968 incidents out of 8,528 ALL EMERGENCY EMS INCIDENTS LESS THAN 5 MINUTES 63% 2%& 40,510 incidents out of 64,056 LESS THAN 6 MINUTES 80% 1 %& 51,163 incidents out of 64,056 LESS THAN 7 MINUTES 89% I%& 56,922 incidents out of 64,056 LESS THAN 8 MINUTES 93% I%& 59,881 incidents out of 64,056 LESS THAN 9 MINUTES 96% 61,461 incidents out of 64,056 LESS THAN 10 MINUTES 97% I%& 62,351 incidents out of 64,056 LESS THAN 15 MINUTES 99% 63,705 incidents out of 64,056 NUMBERS IN RED DO NOT MEET LAFD RESPONSE TIME STANDARD OF 90 %. 29
31 LOS ANGELES FlRE DEPARTMENT RESPONSE TIIMES FOR FIRST RESOURCE OTHER FIRES LESS THAN 5 MINUTES 61 % 2%& 1,828 incidents out of 2,983 LESS THAN 6 MINUTES 75% 3%& 2,250 incidents out of 2,983 LESS THAN 7 MINUTES 84% 2%& 2,508 incidents out of 2,983 LESSTHAN 8MlNUTES 90% 2%& 2,671 incidentsoutof 2,983 LESS THAN 9 MINUTES 93% I%& 2,770 incidents out of 2,983 LESS THAN 10 MINUTES 95% I%& 2,845 incidents out of 2,983 FlRE ALARMS LESS THAN 5 MINUTES 57% 4 3,431 incidents out of 6,057 LESS THAN 6 MINUTES 73% 1 X? 4,414 incidents out of 6,057 LESS THAN 7 MINUTES 83% AX? 5,020 incidents out of 6,057 LESS THAN 8 MINUTES 89% 1 %? 5,364 incidents out of 6,057 LESS THAN 9 MINUTES 92% 5,585 incidents out of 6,057 LESS THAN 10 MINUTES 95% 5,734 incidents out of 6,057 HAZARDS LESS THAN 5 MINUTES 50% 1 ",/o? 355 incidents out of 707 LESS THAN 6 MINUTES 69% 19/0'? 491 incidents out of 707 LESS THAN 7 MINUTES 79% I%& 558 incidents out of 707 LESS THAN 8 MINUTES 85% 2%4 603 incidents out of 707 LESS THAN 9 MINUTES 90% 633 incidents out of 707 LESS THAN 10 MINUTES 91 % 2%& 643 incidents out of 707 RESCUES LESS THAN 5 MINUTES 60% incidents out of 1,059 LESS THAN 6 MINUTES 75% GX? 796 incidents out of 1,059 LESS THAN 7 MINUTES 84% 5%? 886 incidents out of 1,059 LESS THAN 8 MINUTES 90% *4%? 952 incidents out of 1,059 LESS THAN 9 MINUTES 93% 3% 985 incidents out of 1,059 LESS THAN 10 MINUTES 94% 1 %? 1,000 incidents out of 1,059 1 %? = 1 % increase (improvement) from previous quarter 2%& = 2% decrease from previous quarter NUMBERS IN RED DO NOT MEET LAFD RESPONSE TIME STANDARD OF 90 %. 30
32 RESPONSE TIMES FOR FIRST PARAMlEDlC UNlT OF EMS 1NC;IDENTS ALL EMS INCIDENTS WITH A PARAMEDIC UNlT RESPONDING 2 MINUTES OR LESS 3 MINUTES OR LESS 4 MINUTES OR LESS 5 MINUTES OR LESS 6 MINUTES OR LESS 7 MINUTES OR LESS 8 MINUTES OR LESS 9 MINUTES OR LESS 10 MINUTES OR LESS 1 1 MINUTES OR LESS 12 MINUTES OR LESS 13 MINUTES OR LESS 14 MINUTES OR LESS 15 MINUTES OR LESS 8% 2%: 3,734 incidents out of 65,938 17% 1 %& 1 1,364 incidents out of 65,938 37% 2%& 24,618 incidents out of 65,938 58% 1 %& 38,114 incidents out of 65,938 73% 47,869 incidents out of 65,938 82% 1 %& 54,223 incidents out of 65,938 88% 1 %& 58,207 incidents out of 65,938 92% 60,688 incidents out of 65,938 94% 1 %& 62,298 incidents out of 65,938 96% 63,274 incidents out of 65,938 97% 63,954 incidents out of 65,938 98% 64,400 incidents out of 65,938 98% 64,721 incidents out of 65,938 99% 65,013 incidents out of 65,938 2%? = 2% increase (improvement) from previous quarter 1 %& = 1 % decrease from previous quarter NUMBERS IN RED DO NOT MEET LAFD RESPONSE TIME STANDARD OF 90 %.
Commercial-in-Confidence Ashton Old Baths Financial Model - Detailed Cashflow
 Year 0 1 2 3 4 5 6 7 8 9 10 11 12 13 Oct-16 Nov-16 Dec-16 Jan-17 Feb-17 Mar-17 Apr-17 May-17 Jun-17 Jul-17 Aug-17 Sep-17 Oct-17 2,038 2,922 4,089 4,349 6,256 7,124 8,885 8,885 8,885 8,885 8,885 8,885 9,107
Fire and EMS Run Card Form
 Incident Type Dispatch Aerial Brush Engine Tanker Rescue Other (Specify number and apparatus type needed; ie 1-RH, 1-SP) Station Dispatches (List station numbers that should be dispatched; ie Sta44, Sta36)
Fire and EMS Run Card Form
 Incident Type (New Incident Types are in BOLD) Dispatch Aerial Brush Engine Tanker Rescue Other (Specify number and apparatus type needed; ie 1-RH, 1-SP) Station Dispatches (List station numbers that should
Truckee Meadows Fire Protection District Monthly Report
 Truckee Meadows Fire Protection District Monthly Report August 2013 The following report contains non-audited figures based on data extracted from the District s incident reporting system and Washoe County
National Routing Number Administration p-ani Activity and Projected Exhaust Report
 National Routing Number Administration 2016 p-ani Activity and Projected Exhaust Report The ATIS Industry Numbering Committee developed the P-ANI Administration Guidelines, which contain the following
COMPARISON OF FIXED & VARIABLE RATES (25 YEARS) CHARTERED BANK ADMINISTERED INTEREST RATES - PRIME BUSINESS*
 CHARTERED BANK ADMINISTERED INTEREST RATES - PRIME BUSINESS*") COMPARISON OF FIXED & VARIABLE RATES (25 YEARS) 2 Fixed Rates Variable Rates For Internal Use Only. FIXED RATES OF THE PAST 25 YEARS AVERAGE RESIDENTIAL MORTGAGE LENDING RATE - 5 YEAR* (Per cent) Year
COMPARISON OF FIXED & VARIABLE RATES (25 YEARS) 2 Fixed Rates Variable Rates For Internal Use Only. FIXED RATES OF THE PAST 25 YEARS AVERAGE RESIDENTIAL MORTGAGE LENDING RATE - 5 YEAR* (Per cent) Year
COMPARISON OF FIXED & VARIABLE RATES (25 YEARS) CHARTERED BANK ADMINISTERED INTEREST RATES - PRIME BUSINESS*
 CHARTERED BANK ADMINISTERED INTEREST RATES - PRIME BUSINESS*") COMPARISON OF FIXED & VARIABLE RATES (25 YEARS) 2 Fixed Rates Variable Rates FIXED RATES OF THE PAST 25 YEARS AVERAGE RESIDENTIAL MORTGAGE LENDING RATE - 5 YEAR* (Per cent) Year Jan Feb Mar Apr May Jun
COMPARISON OF FIXED & VARIABLE RATES (25 YEARS) 2 Fixed Rates Variable Rates FIXED RATES OF THE PAST 25 YEARS AVERAGE RESIDENTIAL MORTGAGE LENDING RATE - 5 YEAR* (Per cent) Year Jan Feb Mar Apr May Jun
Fire Engine Information
 Fire Engine Information City of Thornton Fire Engine 71 2001 American La France This engine was built entirely by Freightliner/American La France. The National Fire Protection Association (NFPA) and Insurance
Up and Down Months of the Stock Market
 Up and Down Months of the Stock Market 1926-2017 Positive years (66) in the stock market were not good all year long and losing years (24) were not losers throughout the year. Winning years produce losing
2017 Annual Report. EMS Vital Statistics
 2017 Annual Report EMS Vital Statistics 1 Contents: Volunteer Process p. 3 Unit Hour Utilization p. 10 Calls for Service p. 5 Clinical Indicator p.11 Patients & Transports p. 6 Response Times p. 7 8 Ambulance
Total Production by Month (Acre Feet)
") Production by Month (acre-feet) 2008 2009 2010 2011 2012 2013 2014 2015 2016 January 25 339.10 228.90 249.50 297.99 243.06 327.14 247.66 212.37 February 234.00 218.80 212.10 241.52 245.82 279.08 234.16
Production by Month (acre-feet) 2008 2009 2010 2011 2012 2013 2014 2015 2016 January 25 339.10 228.90 249.50 297.99 243.06 327.14 247.66 212.37 February 234.00 218.80 212.10 241.52 245.82 279.08 234.16
Clanton Fire Department Incidents December 12-18, 2018
 December 12-18, 2018 December 12, 2018 3800 Block Old Henry Road-Blood Pressure Check 1600 Block 7 th Street South-Seizure 1000 Block Jasper Dennis Road-Altered Mental Status 400 Block 11 th Street North-Smoke
All Volunteer Service BLS and ALS Emergency Medical Services Special Events (With Bike Team) Vehicle Rescue (Heavy & Light) Technical Rescue
 Vehicle Rescue (Heavy & Light) Technical Rescue") Our Services All Volunteer Service BLS and ALS Emergency Medical Services Special Events (With Bike Team) Vehicle Rescue (Heavy & Light) Technical Rescue High & Low Angle Rope Rescue Trench Collapse Rescue
Our Services All Volunteer Service BLS and ALS Emergency Medical Services Special Events (With Bike Team) Vehicle Rescue (Heavy & Light) Technical Rescue High & Low Angle Rope Rescue Trench Collapse Rescue
Sample Geographic Information System (GIS) Staffing and Response Time Report Virtual County Fire Department GIS Analysis
 Staffing and Response Time Report Virtual County Fire Department GIS Analysis") Sample Geographic Information System (GIS) Staffing and Response Time Report Fire Department GIS Analysis Executive Summary This study examines predicted response times and geographic coverage areas for
Sample Geographic Information System (GIS) Staffing and Response Time Report Fire Department GIS Analysis Executive Summary This study examines predicted response times and geographic coverage areas for
Utah Fatal Crash Summary 2014
 Utah Fatal Crash Summary 1 State of Utah Department of Public Safety Highway Safety Office W Amelia Earhart Dr # Salt Lake City, UT 8116 81-366-6 www.highwaysafety.utah.gov Preliminary Totals as of 1/29/
INTECH JUNE QHSE PERFORMANCE
 INTECH QHSE PERFORMANCE - MONTHLY QHSE PERFORMANCE Goal Zero Days ( worked days without Lost Time Injury (LTI)) 689 This Month Minor Accidents or Incidents This Month Major Accidents or Incidents Last
Santa Cruz County Sheriff s Office. November 2018 Monthly Statistics
 Santa Cruz County Sheriff s Office 2018 Monthly Statistics Report Created by SCSO Crime Analyst Joshua Pastor 12/13/2018 CONTENTS OPERATIONS CORRECTIONS ADMINISTRATION Patrol Report... 5 Proactive Policing..
Electricity Industry Code Minimum Service Standards & Guaranteed Service Levels Quarterly Report July September 2008
 Electricity Industry Code Minimum Service Standards & Guaranteed Service Levels Quarterly Report July September 2008 2 Table of Contents Administrative Data...3 Network Performance...3 Reliability Measures
The Peoples Gas Light and Coke Company
 History of Gas Charges Due to the Operation of Rider 2 (Cents per Therm) Factors for Transportation Customers (Riders FST, SST, P, CFY and AGG) Non- Total Standby Standby Aggregation Commodity Commodity
Year to Date Summary. Average and Median Sale Prices
 A Publication of RMLS, The Source for Real Estate Statistics in Your Community Residential Review: Southwest Washington September 2018 Reporting Period September Residential Highlights Southwest Washington
GAZIFÈRE INC. Prime Rate Forecasting Process 2017 Rate Case
 Overview A consensus forecast is used to estimate the prime rate charged by commercial banks. As the prime rate is subject to competitive pressures faced by individual lenders and is set on an individual
Statistics on Radiation Exposure Doses of Decontamination Workers and Other Items
 Statistics on Radiation Exposure Doses of Decontamination Workers and Other Items 15 April 215 System of registration and management of radiation exposure doses for decontamination and related works Objective
INTECH AUGUST QHSE PERFORMANCE
 INTECH QHSE PERFORMANCE - MONTHLY QHSE PERFORMANCE Goal Zero Days ( worked days without Lost Time Injury (LTI)) 751 This Month Minor Accidents or Incidents 01 This Month Major Accidents or Incidents 00
September 2016 Water Production & Consumption Data
 September 2016 Water Production & Consumption Data September 2016 monthly water production (288.48 AF) was lowest in at least 17 years. Monthly water production has increased slightly each month since
DENVER FIRE DEPARTMENT
 DENVER FRE DEPARTMENT FRE NCDENT REPORTNG SYSTEM ANNUAL STATSTCAL REPORT 2013 PREPARED BYTHE DENVER FRE DEPARTMENT TECHNCAL SERVCES DVSON DENVER FRE DEPARTMENT MSSON STATEMENT The Denver Fire Department
ANNUAL SUMMARY REPORT FY 2005 PERFORMANCE REPORT SUMMARY COMPARATIVE ANALYSIS
 ANNUAL SUMMARY REPORT FY 2005 PERFORMANCE REPORT SUMMARY COMPARATIVE ANALYSIS RAIL OPERATIONS: Rail Passenger injuries increased from 34 in FY04 to 41 in FY05. The Woodley Park collision accounted for
Six Forks Rescue Squad Six Forks EMS
 Six Forks Rescue Squad Six Forks EMS Research notes by Mike Legeros Last updated January 10, 2017 Pre History See main Wake County rescue squad history document. 1970 1979 1976 - Six Forks Rescue created.
ANCR CRU Statistics February 2007 to December 2007
 ANCR CRU Statistics February 2007 to December 2007 o Jan/07 Feb/07* Mar/07 Apr/07 May/07 Jun/07 Jul/07 Aug/07 Sep/07 Oct/07 Nov/07 Dec/07 Total notes data from Perimeter phone system unavailable prior
FOR IMMEDIATE RELEASE
 Article No. 7761 Available on www.roymorgan.com Roy Morgan Unemployment Profile Monday, 8 October 2018 Unemployment down to 9.4% in September off two-year high Australian employment has grown solidly over
NJ Solar Market Update
 NJ Solar Market Update April 16, 20 Renewable Energy Committee Meeting Trenton, NJ Prepared by Charlie Garrison Solar Installed Capacity Data The preliminary installed solar capacity as of 3/31/ is approximately
November 2018 Customer Switching Report for the Electricity and Gas Retail Markets
 An Coimisiún um Rialáil Fóntas Commission for Regulation of Utilities November 2018 Customer Switching Report for the Electricity and Gas Retail Markets Information Paper Reference: CRU18266 Date Published:
Presentation to the Customer Service, Operations and Safety Committee OPERATIONS PERFORMANCE INDICATORS
 Presentation to the Customer Service, Operations and Safety Committee OPERATIONS PERFORMANCE INDICATORS May 19, 2005 Department of Operations 100 95 90 85 80 75 70 65 A B C D RAIL PERFORMANCE INDEX FY
IOWA MOLD TOOLING CO., INC. BOX 189, GARNER, IA TEL: IMT PART NUMBER
 CRANE LOG CALENDAR YEAR CRANE MODEL Daily Inspections Weekly Inspections Monthly Inspections Lubrication Record Maintenance Record Damage & Repair Record Modification Record Reference Specifications CRANE
WIM #37 was operational for the entire month of September Volume was computed using all monthly data.
 SEPTEMBER 2016 WIM Site Location WIM #37 is located on I-94 near Otsego in Wright county. The WIM is located only on the westbound (WB) side of I-94, meaning that all data mentioned in this report pertains
PT4 Pump Station, Turkey
 HEALTH AND SAFETY 9 PT4 Pump Station, Turkey PSG2 employees, Georgia KP 377, Azerbaijan 9 9 HEALTH AND SAFETY All efforts continued this quarter to observe the stringent health and safety targets set by
Austin Police Department. An Analysis of Traffic Fatalities 2015
 Austin Police Department An Analysis of Traffic Fatalities Prepared by the Austin Police Department Research and Planning Unit April Table of Contents Background... Overview... Terminology... Notes about
Washington Metropolitan Area Transit Authority Board Action/Information Summary
 Washington Metropolitan Area Transit Authority Board Action/Information Summary Action Information MEAD Number: 21643 Resolution: Yes No TITLE: Safety & Environmental Quarterly Report PRESENTATION SUMMARY:
COMPILED BY GLASS S. Auction Report - LCV November 2013
 GLASS S Auction Report - LCV November 2013 Contents Market Commentary Page 3 Whole Market Summary Page 8 Average Sales Price Year on Year Page 9 Sales Price Compared to Number of Entries (all ages) Page
2014 Second Quarter and Mid-Year Report
 City of Manassas Police Department 9518 Fairview Ave Manassas, VA 211 214 Second Quarter and Mid-Year Report 213-214 Mid-Year Comparison Summary * Percent changes are calculated for January to June 213
PROGRESS ON BUDGET THEMES AND PERFORMANCE METRICS RECEIVE AND FILE PROGRESS REPORT ON BUDGET THEMES AND PERFORMANCE METRICS
 20 One Gateway Plaza Los Angeles, CA 90012-2952 213-922.2000 Tel metro. net FINANCE, BUDGET AND AUDIT COMMITTEE MARCH 20,2013 SUBJECT: ACTION: PROGRESS ON BUDGET THEMES AND PERFORMANCE METRICS RECEIVE
Inventory Levels - All Prices. Inventory Levels - By Price Range
 Inventory Levels - All Prices Idaho Falls Bonneville Total 7-Apr-17 154 111 265 6-Apr-18 113 91 204-23% Inventory Levels - By Price Range 7-Apr-17 6-Apr-18 0-100,000 36 10 100,001-125,000 13 9 125,001-150,000
AIRSERVICES AUSTRALI A
 AIRSERVICES AUSTRALI A NOISE AND FLIGHT PATH MONITORING SYSTEM BRISBANE QUARTERLY REPORT OCTOBER - DECEMBER 2010 Page 2 Foreword Airservices Australia has established a Noise and Flight Path Monitoring
Mr. John Aitken June 6, 2017 Page 2
 Mr. John Aitken June 6, 2017 Page 2 quarterly period of 2016. Fluctuations in noise exposure from reporting period to reporting period are to be expected due to ongoing changes in aircraft activity levels,
Action Requested From AMWG
 Action Requested From AMWG NONE, These Two Presentations Are For Information Transfer Only The information is derived from a multi-year synthesis research effort related to existing data on flow, sediment-transport
2013 Operations Statistics Report Triangle Expressway Fourth Quarter
 2013 Operations Statistics Report Fourth Quarter 1 S. Wilmington Street Raleigh, C 27601 2012 Annual Operations Last Updated: Report 1 11, 2014 Table of Contents 2013 Fourth Quarter Operations Statistics
SUBJECT: Russell Hill Subway Train Accident Of August 11, 1995 Due Diligence Checklist Update
 MEETING DATE: August 31, 2005 SUBJECT: Russell Hill Subway Train Accident Of August 11, 1995 Due Diligence Checklist Update RECOMMENDATION It is recommended that the Commission: i) Receive for information
Florida Courts E-Filing Authority Board. Service Desk Report December 2018
 Florida Courts E-Filing Authority Board Service Desk Report December 218 Customer Service Incidents December 218 Status October 218 November 218 December 218 Incidents Received 3,779 2,632 2,376 Incidents
Standard Operating Procedure Ottawa Fire Service. Extrication Vehicle Extrication Procedures - Revised
 Classification P SP 02.1-2002 Special and Technical Operations - Extrication Vehicle Extrication Procedures - Revised Subject Authority Policy Fire Chief s (OFS) shall respond specially trained and equipped
VEHICLE / PEDESTRIAN COLLISIONS
 Info item No. 1 Crosswalk Safety Advisory Committee March 31, 2016 VEHICLE / PEDESTRIAN COLLISIONS HRM: January December 20 DISCLAIMER: All figures presented in this report reflect the information held
Life & fire safety program and station tour to a group of local residents on 4/10, 9-10 AM
 ORANGE COUNTY FIRE AUTHORITY- City of Santa Ana Fire Services- Division 6, Battalion 9 David Cavazos, City Manager Roman Reyna, OCFA Board of Directors Angelica Amezcua, OCFA Board of Directors-Alternate
NJ Solar Market Update As of 6/30/15
 NJ Solar Market Update As of 6/30/ Prepared by Charlie Garrison July 17, 20 SOLAR INSTALLED CAPACITY DATA The preliminary installed solar capacity as of 6/30/ is approximately 1,500.7 MW. Approximately
M onthly arket. Jan Table of Contents. Monthly Highlights
 Table of Contents Market Inventory...2 www.gaar.com Monthly Highlights January 2014 had a 12.29% increase in the number of homes sales when compared to same time last year. The average sale price of single-family
Investigation Report Worker Fatally Injured Struck by Motor Coach December 9, 2015
 Investigation Report Worker Fatally Injured Struck by Motor Coach December 9, 2015 Report No-F-OHS-098342-4D1EC October 2016 Page 1 of 6 The contents of this report This document reports s investigation
TRAFFIC VOLUME TRENDS July 2002
 TRAFFIC VOLUME TRENDS July 2002 Travel on all roads and streets changed by +2.3 percent for July 2002 as compared to July 2001. Estimated Vehicle-Miles of Travel by Region - July 2002 - (in Billions) West
2013 / 2014 Revenue Comparison: OCTOBER
 CAR RENTAL GROSS REVENUES 2013 / Revenue Comparison: OCTOBER COMPANY 2013 incr./decr. % change Advantage 1,049,117.25 1,679,547.68 630,430.43 60.1% Alamo/National 5,448,360.80 8,262,318.28 2,813,957.48
2015 Second Quarter and Mid-Year Report
 City of Manassas Police Department 9518 Fairview Ave Manassas, VA 211 215 Second Quarter and Mid-Year Report 214-215 Mid-Year Comparison Summary * Percent changes are calculated for January to June 214
STAFF REPORT. Consideration of Request Submitted by Athens Services for Rate Adjustment SUMMARY
 City of San Gabriel STAFF REPORT Date: To: From: Subject: June 16, 2015 Steven A. Preston, City Manager /\. Thomas C. Marston, Finance Directo~ Consideration of Request Submitted by Athens Services for
The Use of GPS to Optimize the Mobile Fleet. We provide the right equipment at the right place and the right time.
 The Use of GPS to Optimize the Mobile Fleet Overview Background/Need Implementation/Projected Savings FOBs Using the Data Expansion to Division of Maintenance Ongoing Processes Background/Need Current
STATISTICS BOTSWANA ELECTRICITY GENERATION & DISTRIBUTION 2016/2 STATS BRIEF, FIRST QUARTER Copyrights Statistics Botswana 2016
 2016/2 ELECTRICITY GENERATION & DISTRIBUTION STATS BRIEF, FIRST QUARTER 2016 Copyrights Statistics Botswana 2016 Statistics Botswana. Private Bag 0024 Botswana Tel: (267) 367 1300. Fax: (267) 395 2201.
FOR IMMEDIATE RELEASE
 Article No. 7353 Available on www.roymorgan.com Roy Morgan Unemployment Profile Wednesday, 11 October 2017 2.498 million Australians (18.9%) now unemployed or under-employed In September 1.202 million
US Rt. 12/20/45 at US Rt. 20 <Westbound and Southbound>
 US Rt. 12/20/45 at US Rt. 20 Village of Stone Park, Illinois R L R F o l l o w - U p E v a l u a t i o n R e p o r t Reference No: 016-43280 December 2010 Table of Contents
RIDERSHIP TRENDS. March 2017
 RIDERSHIP TRENDS March 2017 Prepared by the Division of Strategic Capital Planning May 2017 Table of Contents Executive Summary...1 Ridership...3 Estimated Passenger Trips by Line...3 Estimated Passenger
Predict Future Failures From Your Maintenance Records
 Predict Future Failures From Your Maintenance Records Presented by: Paul Barringer, P.E. Barringer & Associates, Inc. Reliability, Engineering, and Manufacturing Consultants Humble, Texas 77347, USA Phone:
Construction Sector Indices
 STATISTICAL RELEASE UGANDA BUREAU OF STATISTICS January to April 212 Construction Sector Indices HIGHLIGHTS Annual Changes show that the prices for the Whole Construction Sector (covering material prices,
Regulation Update. Operating Committee September 12, PJM 2017
 Regulation Update Operating Committee September 12, 2017 Regulation Market Clearing Price *Data up to Aug 22 2 Mileage Ratio Mileage Ratio has increased since the new signal implementation Larger Utilization
Local Market Update 2012 Year In Review
 Northwest Area Home Sales for the Year 2012 Sales of single-family homes reported in Toledo and the surrounding area by the Toledo Board of REALTORS totaled 6,793. This was an increase of 6% compared to
January-March 2017 Customer Switching Report for the Electricity and Gas Retail Markets
 January- Customer Switching Report for the Electricity and Gas Retail Markets DOCUMENT TYPE: REFERENCE: Information Note CER/17102 DATE PUBLISHED: QUERIES TO: 28th April 2017 gkelly@cer.ie The Commission
Units of Instruction MISD Pacing Guide Days Date Range Test Date
 MISD Pacing Guide Date Range Test Date Introduction: Processes of Investigations (1 day) Aug. 21 Unit 01: Matter (12 days) Aug. 22-Sept. 7 Sep. 10 Unit 02: Atomic Structure and the Periodic Table (15 days)
FOR IMMEDIATE RELEASE
 Article No. 7433 Available on www.roymorgan.com Roy Morgan Unemployment Profile Friday, 12 January 2018 2.6m Australians unemployed or under-employed in December The latest data for the Roy Morgan employment
RIDERSHIP TRENDS. April 2018
 RIDERSHIP TRENDS April Prepared by the Division of Strategic Capital Planning June Table of Contents Executive Summary...1 Ridership...3 Estimated Passenger Trips by Line...3 Estimated Passenger Trips
Washington Metropolitan Area Transit Authority Board Action/Information Summary
 Washington Metropolitan Area Transit Authority Board Action/Information Summary Action Information MEAD Number: Resolution: Yes No TITLE: Safety Report PURPOSE: To present to the Board of Directors a report
ENVIRONMENTAL & ENGINEERING SERVICES DEPARTMENT
 CITY OF LONDON ENVIRONMENTAL & ENGINEERING SERVICES DEPARTMENT WASTEWATER TREATMENT OPERATIONS VAUXHALL WASTEWATER TREATMENT PLANT 2013 ANNUAL REPORT FEBRUARY 2014 Vauxhall Wastewater Treatment Plant 2013
Motorcyclist Deaths Jan Jul. 2018
 Motorcyclist Deaths Jan. 2008 Jul. 2018 This report summarizes all accidental deaths of motorcyclists in traffic-related motor vehicle incidents (MVIs) between January 1, 2008 and July 30, 2018. Inclusion
FOR IMMEDIATE RELEASE
 Article No. 7137 Available on www.roymorgan.com Roy Morgan Unemployment Profile Wednesday, 8 February 2017 Over 12 million Australians have jobs for the first time including over 8 million full-time jobs,
Energy Conservation Efforts
 Hennepin County Property Services Energy Conservation Efforts MEPC Presentation September 2010 HENNEPIN COUNTY PROPERTY SERVICES DEPARTMENT MONTHLY ENERGY COSTS $1,200,000 $1,000,000 Cold 2009 October
Florida s Turnpike Enterprise. Incident Management Program for All Levels & Specialty Towing & Roadside Repair (STARR)
") Florida s Turnpike Enterprise Incident Management Program for All Levels & Specialty Towing & Roadside Repair (STARR) Florida s Turnpike System Largest Toll System in Florida 460 Centerline Miles 2 Million
Florida s Turnpike Enterprise Incident Management Program for All Levels & Specialty Towing & Roadside Repair (STARR) Florida s Turnpike System Largest Toll System in Florida 460 Centerline Miles 2 Million
2014 Year End Report
 North Mankato Police Department 2014 Year End Report Table of Contents General Information... 2 Statistics at a Glance... 3 Personal Crime Statistics... 4 Property Crime Statistics... 5-6 Other Crime Statistics...
Milton Fire-Rescue Capital Improvement Plan
 Milton Fire-Rescue 2019-2024 Capital Improvement Plan Capital Overview 2 Fire Stations 3 Engines 1 Ladder Truck 2 Ambulances 1 Forestry 2 Staff Vehicles 3 Sets of Extrication Tools 2 Thermal Imagers 2
Category V. Criterion 5H: Hazardous Materials (Hazmat)
") Category V Criterion 5H: Hazardous Materials (Hazmat) The agency operates an adequate, effective, efficient, and safe hazardous materials program directed toward protecting the community from the hazards
Category V Criterion 5H: Hazardous Materials (Hazmat) The agency operates an adequate, effective, efficient, and safe hazardous materials program directed toward protecting the community from the hazards
Florida Courts E-Filing Authority Board. Service Desk Report October 2018
 Florida Courts E-Filing Authority Board Service Desk Report October 218 Customer Service Incidents October 218 Status August 218 September 218 October 218 Incidents Received 3,157 2,685 3,779 Incidents
FOR IMMEDIATE RELEASE
 Article No. 7845 Available on www.roymorgan.com Roy Morgan Unemployment Profile Friday, 18 January 2019 Unemployment in December is 9.7% and under-employment is 8.8% FOR IMMEDIATE RELEASE Australian unemployment
Electric Vehicle Program
 Cause No. 43960 INDIANAPOLIS POWER & LIGHT COMPANY Electric Vehicle Program Year 3 2013 Report May 2, 2014 Contents Background... 2 Project Objectives... 3 Current Status... 3 Significant Milestones...
CITY OF ROMULUS FEE SCHEDULE
 No.:17-152 BUILDING PLAN REVIEW BUILDING Includes all residential over 2 family - Hotels, Apartments, Condo / Loft Developments, etc. New Building Plan Review - Initial Plan Review - Addition / Remodel
INTRADEPARTMENTAL CORRESPONDENCE. The Honorable Board of Police Commissioners
 INTRADEPARTMENTAL CORRESPONDENCE July 25, 2011 16.2 TO: The Honorable Board of Police Commissioners FROM: Chief of Police SUBJECT: TRANSPORTATION COMMITTEE REPORT RELATIVE TO CITY VEHICLES PARKING ALONGSIDE
Public Complaints Key Indicators (PCKI) - Public Complaints Data November 2017 (covering period November 2016 to October 2017) Version 1 Summary
 - Public Complaints Data November 2017 (covering period November 2016 to October 2017) Version 1 Summary") Freedom of Information Act Publication Scheme Protective Marking Publication Scheme Y Y/N Title Public Complaints Key Indicators (PCKI) - Public Complaints Data November 2017 (covering period November
Freedom of Information Act Publication Scheme Protective Marking Publication Scheme Y Y/N Title Public Complaints Key Indicators (PCKI) - Public Complaints Data November 2017 (covering period November
Business Plan We will reflect the National Treasure in which we live
 Business Plan 2017 We will reflect the National Treasure in which we live Fire Departments depend on equipment and personnel to accomplish their tasks. Those tasks vary from each agency but the City of
RAPID INTERVENTION TEAM STANDARD OPERATING PROCEDURES
 RAPID INTERVENTION TEAM STANDARD OPERATING PROCEDURES RAPID INTERVENTION TEAM (R.I.T.) STANDARD OPERATING PROCEDURES I. R.I.T. PURPOSE (also referred to as F.A.S.T. Team) 1. Eliminate hazards that may
Price Category Breakdown - February 2010
 SINGLE FAMILY RESIDENTIAL BREAKDOWN ruary 21 ruary Sales and Average Price Increase Annually TORONTO - Wednesday, March 3, 21 7.3 % 24.6 % 1.8 % 7.3%.2%.1 % Greater Toronto REALTORS reported 7,291 sales
Research and Statistics Department FOR RELEASE 8:50 A.M. Tuesday, December 25, 2018
 Bank of Japan Research and Statistics Department FOR RELEASE 8:50 A.M. Tuesday, December 25, 2018 Report on the Services Producer Price ( Preliminary Figures for November 2018 ) The Services Producer Price
Design Criteria Data
 SPOKANE WA Latitude = 47.63 N WMO No. 72785 Longitude =117.5 W Elevation = 2366 feet Period of Record = 1973 to 1996 Average Pressure = 27.5 inches Hg Design Criteria Data Mean Coincident (Average) Values
November 2017 Customer Switching Report for the Electricity and Gas Retail Markets
 An Coimisiún um Rialáil Fóntas Commission for Regulation of Utilities November 2017 Customer Switching Report for the Electricity and Gas Retail Markets Information Paper Reference: CRU18011 Date Published:
Design Criteria Data
 BIRMINGHAM AL Latitude = 33.57 N WMO No. 72228 Longitude = 86.75 W Elevation = 63 feet Period of Record = 1973 to 1996 Average Pressure = 29.36 inches Hg Design Criteria Data Mean Coincident (Average)
Milton Fire-Rescue Capital Improvement Plan
 Milton Fire-Rescue 2018-2023 Capital Improvement Plan Capital Overview 2 Fire Stations 3 Engines 1 Ladder Truck 2 Ambulances 1 Forestry 2 Staff Vehicles 3 Sets of Extrication Tools 2 Thermal Imagers 2
19 AUTHORIZED SIGNATURE: Chief Robert Tutko
 TWP 31-B BRUSH FIRE ENTIRE DISTRICT 03/01/14 ALARM BRUSH SPECIAL CHANGE OF - BAT FULL - ENGINE (STA 1) AMBULANCE (STA 1) ALARM BRUSH SPECIAL CHANGE OF BOX NW ROCKDALE ROMEOVILLE OAK FOREST NW REHAB ENGINE
Design Criteria Data
 OKLAHOMA CITY OK Latitude = 35.4 N WMO No. 72353 Longitude = 97.6 W Elevation = 133 feet Period of Record = 1973 to 1996 Average Pressure = 28.62 inches Hg Design Criteria Data Mean Coincident (Average)
WIM #31 US 2, MP 8.0 EAST GRAND FORKS, MN JANUARY 2015 MONTHLY REPORT
 WIM #31 US 2, MP 8.0 EAST GRAND FORKS, MN JANUARY 2015 MONTHLY REPORT WIM #31 EAST GRAND FORKS MONTHLY REPORT - JANUARY 2015 WIM Site Location WIM #31 is located on US 2 at mile post 8.0, southeast of
RE: Advice Schedule 45 Public DC Fast Charger Delivery Service Optional Transitional Rate REPLACEMENT PAGES
 January 31, 2017 VIA ELECTRONIC FILING Public Utility Commission of Oregon 201 High Street SE, Suite 100 Salem, OR 97301-3398 Attn: Filing Center RE: Advice 16-020 Schedule 45 Public DC Fast Charger Delivery
Design Criteria Data
 MEDFORD/JACKSON CO. OR Latitude = 42.37 N WMO No. 72597 Longitude =122.8 W Elevation = 1329 feet Period of Record = 1973 to 1996 Average Pressure = 28.61 inches Hg Design Criteria Data Mean Coincident
Customer Service, Operations and Security Committee. Information Item III-A. January 12, 2017
 Customer Service, Operations and Security Committee Information Item III-A January 12, 2017 Train Reliability Program Page 4 of 19 Washington Metropolitan Area Transit Authority Board Action/Information
AAMVA. Reducing Suspended Drivers. June 2, 2015 Presenter: Julie Knittle WA Department of Licensing
 AAMVA Reducing Suspended Drivers June 2, 2015 Presenter: Julie Knittle WA Department of Licensing Overview Suspending driving privileges used for decades to address poor driving behavior Impact on reducing