FOR IMMEDIATE RELEASE
|
|
|
- Jeremy Griffin Griffith
- 5 years ago
- Views:
Transcription
 split evenly between full-time and part-time")

 were unemployed in September, an increase of 54,000 on a year ago (up 0.3%); In addition 1,127,000 Australians (8.")
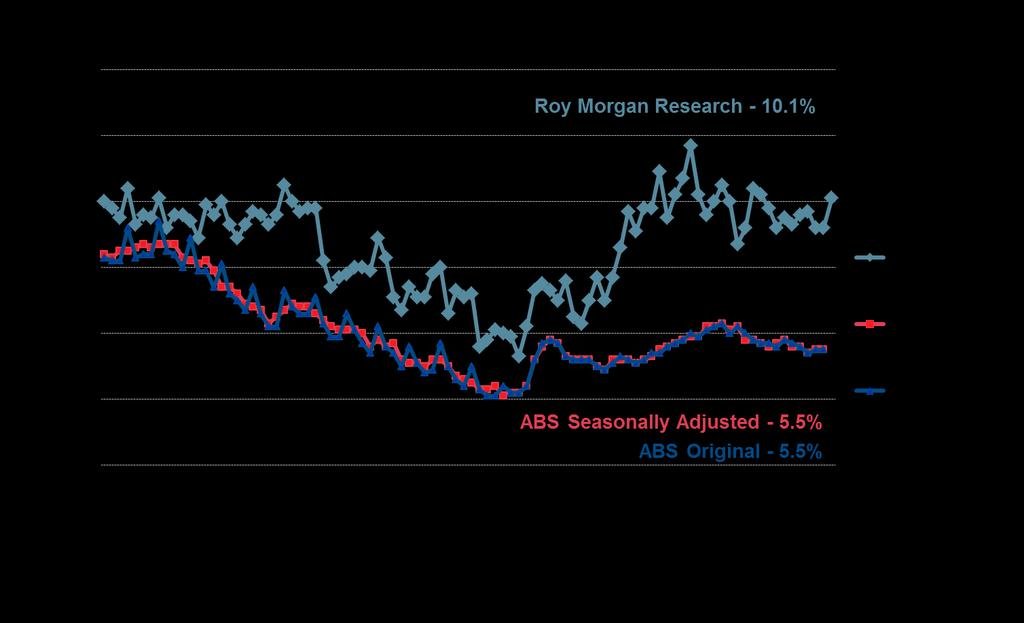
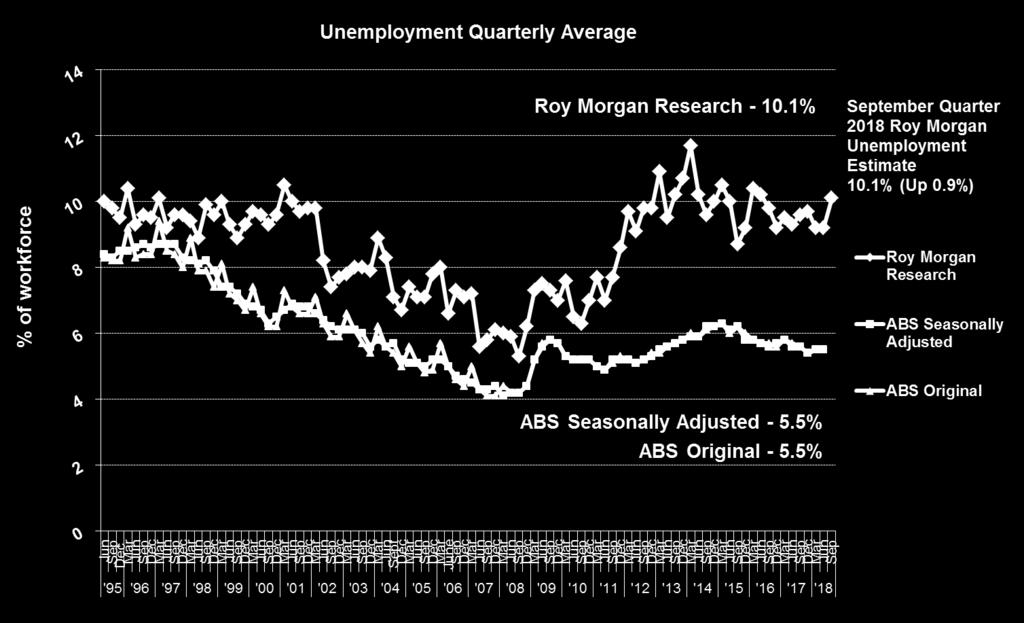
1 Article No Available on Roy Morgan Unemployment Profile Monday, 8 October 2018 Unemployment down to 9.4% in September off two-year high Australian employment has grown solidly over the past year with nearly 200,000 jobs created (about 15,000 per month) split evenly between full-time and part-time employment: The latest data for the Roy Morgan employment series for September shows: The workforce which comprises employed and unemployed Australians is now 13,420,000, up 246,000 on a year ago; 12,164,000 Australians were employed in September, up 192,000 over the past year; The increase in employment was driven by equivalent increases in full-time employment which was up 97,000 to 7,694,000 and part-time employment which increased 95,000 to a record high 4,470,000; 1,256,000 Australians (9.4% of the workforce) were unemployed in September, an increase of 54,000 on a year ago (up 0.3%); In addition 1,127,000 Australians (8.4% of the workforce) were under-employed, working part-time and looking for more work, a fall of 169,000 in a year (down 1.4%); In total 2,383,000 Australians (17.8% of the workforce) were either unemployed or under-employed in September, a fall of 115,000 in a year (down 1.1%); Roy Morgan s real unemployment figure of 9.4% for September is significantly higher than the current ABS estimate for August 2018 of 5.3%. Source: Roy Morgan Single Source October 2005 September Average monthly interviews 4,000. For further information: Contact Office Mobile Gary Morgan: Michele Levine:
2 Michele Levine, CEO Roy Morgan, says the Australian economy has created almost 200,000 jobs over the last year however many of these are part-time jobs with part-time employment hitting a new record high of nearly 4.5 million in September: The Australian economy has grown strongly over the last year with nearly 200,000 jobs created at a rate of just over 15,000 new jobs per month. However there were almost as many part-time jobs (+95,000) as full-time jobs (+97,000) created. As a consequence part-time employment in Australia has hit a new record high of nearly 4.5 million in September. In addition to the new jobs created a further 54,000 Australians entering the workforce were unable to find a job and became unemployed. Now 1.3 million Australians are unemployed in September equivalent to 9.4% of the workforce and up 0.3% on a year ago. A further 1.1 million Australians (8.4% of the workforce) are under-employed meaning a total of 2.4 million Australians (17.8% of the workforce) are unemployed and looking for work or employed parttime and looking for more work (under-employed). unemployment and under-employment in Australia has now exceeded 2 million for three straight years since September As we ve noted previously the persistent high level of unemployment and under-employment in Australia isn t because jobs aren t being created, it s because the workforce continues to grow at a faster rate than the growth in employment. Not only is the expanding Australian workforce not providing enough jobs to reduce unemployment but the long-term trend of an increasing casualisation of the Australian workforce is continuing. Three years ago in September 2015 of the 11.7 million Australians employed over two-thirds (or 67.4%) were employed full-time compared to less than a third (32.6%) that were employed part-time. Analysing the breakdown of employment in September 2018 shows of the 12.2 million Australians employed now 63.3% are employed full-time (down 4.1% points on three years ago) while 36.7% are now employed part-time (up 4.1% points). This increasing rate of part-time employment directly impacts on under-employment which has increased by nearly 200,000 since September 2015 while the fast growing workforce has added another 200,000 Australians unable to find jobs who are now unemployed. This Roy Morgan survey on Australia s unemployment and under-employed * is based on weekly faceto-face interviews of 600,483 Australians aged 14 and over between January 2007 September 2018 and includes 4,172 face-to-face interviews in September *The under-employed are those people who are in part-time work or consultants who are looking for more work. (Unfortunately the ABS does not release this figure in their monthly unemployment survey results). Margin of Error The margin of error to be allowed for in any estimate depends mainly on the number of interviews on which it is based. The following table gives indications of the likely range within which estimates would be 95% likely to fall, expressed as the number of percentage points above or below the actual estimate. The figures are approximate and for general guidance only, and assume a simple random sample. Allowance for design effects (such as stratification and weighting) should be made as appropriate. Sample Size % Estimate 40%-60% 25% or 75% 10% or 90% 5% or 95% 5,000 ±1.4 ±1.2 ±0.8 ±0.6 50,000 ±0.4 ±0.4 ±0.3 ±0.2
3 Roy Morgan Unemployed and Under-employed * Estimates Unemployed or Unemployed looking for Underemployed * Unemployed Under-employed * Full-time Part-time % 000 % % Jan-Mar , , , Apr-Jun , , , Jul-Sep , , , Oct-Dec , , , Jan-Mar , , , Apr-Jun , , , Jul-Sep , , , Months August , , , September , , , October , , , November , , , December , , , January , , , February , , , March , , , April , , , May , , , June , , , July , , , August , , , September , , , *Workforce includes those employed and those looking for work the unemployed. ROY MORGAN MEASURES REAL UNEMPLOYMENT IN AUSTRALIA NOT THE PERCEPTION OF UNEMPLOYMENT JUNE 8, 2012 The Roy Morgan Unemployment estimate is obtained by surveying an Australia-wide cross section by face-to-face interviews. A person is classified as unemployed if they are looking for work, no matter when. The results are not seasonally adjusted and provide an accurate measure of monthly unemployment estimates in Australia. The Australian Bureau of Statistics Unemployment estimates are obtained by mostly telephone interviews. Households selected for the ABS Survey are interviewed each month for eight months, with one-eighth of the sample being replaced each month. The first interview is conducted face-to-face. Subsequent interviews are then conducted by telephone. The ABS classifies a person as unemployed if, when surveyed, they have been actively looking for work in the four weeks up to the end of the reference week and if they were available for work in the reference week. The ABS classifies a person as employed if, when surveyed, a person worked for one hour or more during the reference week for pay, profit, commission or payment in kind, or even if a person worked for one hour or more without pay in a family business or on a farm. The Australian Bureau of Statistics Unemployment estimates are also seasonally adjusted. For these reasons the Australian Bureau of Statistics Unemployment estimates are different from the Roy Morgan Unemployment estimate. Gary Morgan's concerns regarding the ABS Unemployment estimate is clearly outlined in his letter to the Australian Financial Review, which was not published.


4 Roy Morgan Research vs. ABS Unemployment Estimates
5 The Roy Morgan Unemployment Estimate The ABS Unemployment Estimates % of Work Force % of Work Force Unemployed Looking For Work Unemployed Looking For Work* Original Adjusted* 1999 ( 000) ( 000) % % ( 000) ( 000) % % % % Jan. 1, Feb March 818 (920) 8.9 (10.0) 696 (699) 7.8 (8.1) 7.4 (7.4) April May June 866 (847) 9.5 (9.3) 680 (696) 6.9 (7.2) 7.2 (7.4) July Aug Sep. 831 (827) 8.9 (8.9) 703 (682) 7.4 (7.0) 7.4 (7.2) Oct Nov Dec. 862 (853) 9.4 (9.3) 672 (662) 6.9 (6.7) 7.0 (6.9) 2000 Jan Feb March 868 (901) 9.4 (9.7) 700 (666) 7.3 (7.4) 6.9 (6.8) April May June 826 (888) 8.9 (9.6) 609 (637) 6.3 (6.6) 6.6 (6.7) July Aug Sep. 869 (865) 9.4 (9.3) 614 (616) 6.4 (6.2) 6.3 (6.3) Oct Nov Dec. 953 (900) 10.2 (9.6) 643 (632) 6.5 (6.2) 6.6 (6.5) 2001 Jan Feb March 989 (977) 10.6 (10.5) 662 (661) 7.2 (7.3) 6.5 (6.7) April May June 908 (942) 9.7 (10.0) 681 (676) 6.7 (6.8) 6.9 (6.9) July Aug Sep. 1,006 (920) 10.7 (9.7) 672 (645) 6.8 (6.6) 6.7 (6.5) Oct Nov Dec. 1,003 (935) 10.5 (9.8) 665 (674) 6.6 (6.6) 6.7 (6.8) 2002 Jan. 1, Feb March 841 (947) 8.9 (9.8) 622 (656) 6.7 (7.1) 6.3 (6.6) April May June 794 (783) 8.3 (8.2) 644 (629) 6.3 (6.3) 6.5 (6.4) July Aug Sep. 703 (715) 7.3 (7.4) 617 (616) 6.2 (5.9) 6.2 (6.2) Oct Nov Dec. 730 (731) 7.7 (7.7) 628 (615) 6.1 (5.9) 6.2 (6.1) Average calculated for previous three months; *Seasonally adjusted figures.
6 The Roy Morgan Unemployment Estimate The ABS Unemployment Estimates % of Work Force % of Work Force Unemployed Looking For Work Unemployed Looking For Work* Original Adjusted* 2003 ( 000) ( 000) % % ( 000) ( 000) % % % % Jan Feb March 769 (750) 8.0 (7.8) 626 (619) 6.5 (6.6) 6.2 (6.1) April May June 764 (766) 8.0 (8.0) 620 (619) 5.9 (6.1) 6.1 (6.1) July Aug Sep. 761 (776) 7.8 (8.0) 590 (602) 5.8 (5.7) 5.8 (6.0) Oct Nov Dec. 863 (781) 8.8 (7.9) 575 (575) 5.6 (5.4) 5.6 (5.6) 2004 Jan Feb March 892 (899) 8.8 (8.9) 574 (584) 5.9 (6.2) 5.6 (5.8) April May June 826 (819) 8.5 (8.3) 575 (570) 5.5 (5.6) 5.6 (5.6) July Aug Sep. 698 (711) 7.1 (7.1) 572 (578) 5.5 (5.4) 5.6 (5.7) Oct Nov Dec. 688 (671) 6.8 (6.7) 527 (536) 5.0 (5.0) 5.1 (5.2) 2005 Jan Feb March 753 (748) 7.5 (7.4) 540 (535) 5.4 (5.6) 5.2 (5.1) April May June 669 (734) 6.5 (7.1) 527 (536) 4.9 (5.1) 5.0 (5.1) July Aug Sep. 681 (726) 6.7 (7.1) 539 (531) 5.1 (4.8) 5.1 (5.0) Oct Nov Dec. 864 (802) 8.5 (7.8) 546 (544) 5.1 (4.9) (5.2) Jan Feb March 815 (847) 7.7 (8.0) 532 (558) 5.3 (5.7) 5.0 (5.2) April May June 659 (702) 6.2 (6.6) 529 (531) 4.8 (5.0) 4.9 (5.0) July Aug Sep. 803 (767) 7.6 (7.3) 513 (517) 4.8 (4.6) 4.8 (4.8) Oct Nov Dec. 712 (752) 6.7 (7.1) 502 (499) 4.5 (4.4) 4.6 (4.6) Average calculated for previous three months; *Seasonally adjusted figures.
7 The Roy Morgan Unemployment Estimate The ABS Unemployment Estimates % of Work Force % of Work Force Unemployed Looking For Work Unemployed Looking For Work* Original Adjusted* 2007 ( 000) ( 000) % % ( 000) ( 000) % % % % Jan Feb March 636 (757) 6.3 (7.2) 485 (493) 4.7 (5.0) 4.5 (4.5) April May June 579 (596) 5.5 (5.6) 472 (470) 4.2 (4.3) 4.3 (4.3) July Aug Sep. 658 (614) 6.2 (5.8) 461 (467) 4.2 (4.1) 4.2 (4.3) Oct Nov Dec. 740 (647) 7.0 (6.1) 468 (482) 4.2 (4.1) (4.4) Jan Feb March 651 (646) 6.1 (6.0) 455 (451) 4.1 (4.4) 4.1 (4.1) April May June 629 (632) 5.8 (5.9) 476 (477) 4.3 (4.2) 4.3 (4.2) July Aug Sep. 538 (584) 4.9 (5.3) 478 (472) 4.3 (4.2) 4.3 (4.2) Oct Nov Dec. 700 (674) 6.4 (6.2) 501 (495) 4.4 (4.4) (4.4) Jan Feb March 775 (809) 7.0 (7.3) 651 (595) 5.4 (5.0) 5.7 (5.2) April May June 862 (829) 7.8 (7.5) 669 (645) 5.8 (5.7) 5.8 (5.6) July Aug Sep. 775 (825) 6.9 (7.3) 659 (662) 5.8 (5.8) 5.7 (5.8) Oct Nov Dec. 773 (787) 6.8 (7.0) 639 (654) 5.6 (5.7) (5.7) Jan Feb March 836 (873) 7.4 (7.6) 619 (616) 5.3 (5.3) 5.3 (5.3) April May June 682 (749) 5.9 (6.5) 598 (609) 5.2 (5.2) 5.1 (5.2) July Aug Sep. 756 (737) 6.5 (6.3) 611 (617) 5.1 (5.2) 5.1 (5.2) Oct Nov Dec. 903 (826) 7.7 (7.0) 599 (625) 5.1 (5.2) 5.0 (5.2) Average calculated for previous three months; *Seasonally adjusted figures.
8 The Roy Morgan Unemployment Estimate The ABS Unemployment Estimates Looking For Work % of Work Force Unemployed Looking For Work* % of Work Force Unemployed Original Adjusted* 2011 ( 000) ( 000) % % ( 000) ( 000) % % % % Jan Feb March 863 (913) 7.4 (7.7) 593 (601) 4.9 (5.0) 4.9 (5.0) April May June 846 (837) 7.0 (7.0) 591 (589) 4.9 (4.9) 4.9 (4.9) July Aug Sep. 919 (914) 7.7 (7.7) 634 (628) 5.2 (5.1) 5.2 (5.2) Oct. 1, Nov. 1, Dec. 1,034 (1,035) 8.6 (8.6) 630 (632) 5.3 (5.3) (5.2) Jan. 1, Feb. 1, March 1,120 (1,192) 9.3 (9.7) 629 (625) 5.2 (5.2) 5.2 (5.2) April 1, May June 1,169 (1,105) 9.7 (9.1) 631 (617) 5.1 (5.1) 5.2 (5.1) July 1, Aug. 1, Sep. 1,214 (1,197) 10.0 (9.8) 663 (640) 5.3 (5.2) 5.4 (5.2) Oct. 1, Nov. 1, Dec. 1,175 (1,189) 9.6 (9.8) 656 (649) 5.4 (5.4) (5.3) Jan. 1, Feb. 1, March 1,369 (1,352) 10.8 (10.9) 687 (669) 5.5 (5.4) 5.6 (5.5) April 1, May 1, June 1,205 (1,176) 9.7 (9.5) 709 (692) 5.7 (5.6) 5.7 (5.6) July 1, Aug. 1, Sep. 1,297 (1,272) 10.4 (10.2) 697 (705) 5.7 (5.7) 5.6 (5.7) Oct. 1, Nov. 1, Dec. 1,411 (1,337) 11.2 (10.7) 722 (715) 5.8 (5.8) 5.8 (5.8) 2014 Jan. 1, Feb. 1, March 1,465 (1,488) 11.6 (11.7) 713 (728) 6.0 (6.0) 5.8 (5.9) April 1, May 1, June 1,326 (1,273) 10.6 (10.2) 742 (724) 5.9 (5.9) 6.0 (5.9) July 1, Aug. 1, Sep. 1,208 (1,179) 9.9 (9.6) 747 (764) 6.0 (6.1) 6.2 (6.2) Oct. 1, Nov. 1, Dec. 1,402 (1,251) 10.9 (10.0) 759 (770) 6.2 (6.2) 6.1 (6.2) Average calculated for previous three months; *Seasonally adjusted figures.
9 The Roy Morgan Unemployment Estimate The ABS Unemployment Estimates Looking For Work % of Work Force Unemployed Looking For Work* % of Work Force Unemployed Original Adjusted* 2015 ( 000) ( 000) % % ( 000) ( 000) % % % % Jan. 1, Feb. 1, March 1,368 (1,327) 10.8 (10.5) 765 (779) 6.2 (6.3) 6.1 (6.3) April 1, May 1, June 1,192 (1,263) 9.3 (10.0) 756 (757) 6.0 (6.0) 6.0 (6.1) July 1, Aug. 1, Sep. 1,058 (1,109) 8.3 (8.7) 772 (783) 6.2 (6.2) 6.2 (6.2) Oct. 1, Nov. 1, Dec. 1,256 (1,184) 9.7 (9.2) 728 (736) 5.8 (6.0) 5.8 (5.8) 2016 Jan. 1, Feb. 1, March 1,422 (1,362) 11.0 (10.4) 723 (739) 5.8 (5.8) 5.7 (5.8) April 1, May 1, June 1,247 (1,317) 9.6 (10.2) 734 (728) 5.7 (5.7) 5.8 (5.7) July 1, Aug. 1, Sep. 1,101 (1,266) 8.5 (9.8) 705 (715) 5.6 (5.7) 5.6 (5.6) Oct. 1, Nov. 1, Dec. 1,186 (1,191) 9.2 (9.2) 741 (724) 5.7 (5.6) 5.8 (5.7) 2017 Jan. 1, Feb. 1, March 1,236 (1,261) 9.3 (9.5) 753 (747) 5.9 (5.8) 5.9 (5.8) April 1, May 1, June 1,200 (1,234) 8.9 (9.3) 728 (724) 5.6 (5.7) 5.6 (5.6) July 1, Aug. 1, Sep. 1,202 (1,254) 9.1 (9.6) 712 (724) 5.5 (5.6) 5.5 (5.6) Oct. 1, Nov. 1, Dec. 1,312 (1,275) 9.8 (9.7) 731 (714) 5.4 (5.4) 5.5 (5.4) 2018 Jan. 1, Feb. 1, March 1,210 (1,246) 8.9 (9.2) 730 (729) 5.6 (5.5) 5.5 (5.5) April 1, May 1, June 1,171 (1,228) 8.7 (9.2) 714 (723) 5.4 (5.5) 5.4 (5.5) July 1, Aug. 1, Sep. 1,256 (1,354) 9.4 (10.1) Oct. Nov. Dec. Average calculated for previous three months; *Seasonally adjusted figures.
10 ABS Employment Estimates Detailed % of workforce unemployed Looking workforce* employed* for work* Original Adjusted* 1999 ( 000) ( 000) ( 000) ( 000) ( 000) ( 000) % % % % Jan Feb March 9399 (9396) 8703 (8697) 696 (699) 7.8 (8.1) 7.4 (7.4) April May June 9455 (9429) 8775 (8733) 680 (696) 6.9 (7.2) 7.2 (7.4) July Aug Sep (9446) 8831 (8814) 703 (682) 7.4 (7.0) 7.4 (7.2) Oct Nov Dec (9550) 8912 (8888) 672 (662) 6.9 (6.7) 7.0 (6.9) 2000 Jan Feb March 9650 (9605) 8950 (8938) 700 (666) 7.3 (7.4) 6.9 (6.8) April May June 9665 (9663) 9056 (9026) 609 (637) 6.3 (6.6) 6.6 (6.7) July Aug Sep (9740) 9111 (9124) 614 (616) 6.4 (6.2) 6.3 (6.3) Oct Nov Dec (9712) 9087 (9080) 643 (632) 6.5 (6.2) 6.6 (6.5) 2001 Jan Feb March 9752 (9752) 9090 (9091) 662 (661) 7.2 (7.3) 6.5 (6.7) April May June 9830 (9816) 9149 (9147) 681 (676) 6.7 (6.8) 6.9 (6.9) July Aug Sep (9835) 9255 (9190) 672 (645) 6.8 (6.6) 6.7 (6.5) Oct Nov Dec (9864) 9199 (9189) 665 (674) 6.6 (6.6) 6.7 (6.8) 2002 Jan Feb March 9927 (9939) 9304 (9283) 622 (656) 6.7 (7.1) 6.3 (6.6) April May June 9962 (9924) 9318 (9294) 643 (628) 6.3 (6.3) 6.5 (6.4) July Aug Sep (9954) 9347 (9338) 617 (616) 6.2 (5.9) 6.2 (6.2) Oct Nov Dec (10035) 9476 (9421) 628 (615) 6.1 (5.9) 6.2 (6.1) Average calculated for previous three months; *Seasonally adjusted figures.
11 ABS Employment Estimates Detailed % of workforce unemployed Looking workforce* employed* for work* Original Adjusted* 2003 ( 000) ( 000) ( 000) ( 000) ( 000) ( 000) % % % % Jan Feb March (10172) 9521 (9554) 626 (619) 6.5 (6.6) 6.2 (6.1) April May June (10135) 9508 (9516) 620 (619) 5.9 (6.1) 6.1 (6.1) July Aug Sep (10125) 9555 (9524) 590 (602) 5.8 (5.7) 5.8 (6.0) Oct Nov Dec (10213) 9666 (9639) 575 (575) 5.6 (5.4) 5.6 (5.6) 2004 Jan Feb March (10178) 9637 (9594) 574 (584) 5.9 (6.2) 5.6 (5.8) April May June (10236) 9646 (9666) 575 (570) 5.5 (5.6) 5.6 (5.6) July Aug Sep (10256) 9717 (9678) 572 (578) 5.5 (5.4) 5.6 (5.7) Oct Nov Dec (10330) 9822 (9794) 527 (536) 5.0 (5.0) 5.1 (5.2) 2005 Jan Feb March (10437) 9948 (9903) 540 (535) 5.4 (5.6) 5.2 (5.1) April May June (10527) (9991) 527 (536) 4.9 (5.1) 5.0 (5.1) July Aug Sep (10573) (10042) 539 (531) 5.1 (4.8) 5.1 (5.0) Oct Nov Dec (10567) (10022) 546 (544) 5.1 (4.9) 5.2 (5.2) 2006 Jan Feb March (10607) (10059) 532 (548) 5.3 (5.7) 5.0 (5.2) April May June (10672) (10141) 529 (531) 4.8 (5.0) 4.9 (5.0) July Aug Sep (10781) (10264) 513 (517) 4.8 (4.6) 4.8 (4.8) Oct Nov Dec (10793) (10294) 502 (499) 4.5 (4.4) 4.6 (4.6) Average calculated for previous three months; *Seasonally adjusted figures.
12 ABS Employment Estimates Detailed % of workforce unemployed Looking workforce* employed* for work* Original Adjusted* 2007 ( 000) ( 000) ( 000) ( 000) ( 000) ( 000) % % % % Jan Feb March (10850) (10358) 485 (493) 4.7 (5.0) 4.5 (4.5) April May June (10913) (10443) 472 (470) 4.2 (4.3) 4.3 (4.3) July Aug Sep (10975) (10508) 461 (467) 4.2 (4.1) 4.2 (4.3) Oct Nov Dec (11056) (10574) 468 (482) 4.2 (4.1) 4.2 (4.4) 2008 Jan Feb March (11112) (10660) 455 (451) 4.1 (4.4) 4.1 (4.1) April May June (11181) (10704) 476 (477) 4.3 (4.2) 4.3 (4.2) July Aug Sep (11211) (10739) 478 (472) 4.3 (4.2) 4.3 (4.2) Oct Nov Dec (11240) (10745) 501 (495) 4.4 (4.4) 4.5 (4.4) 2009 Jan Feb March (11369) (10774) 651 (595) 5.4 (5.0) 5.7 (5.2) April May June (11428) (10785) 663 (643) 5.8 (5.7) 5.8 (5.6) July Aug Sep (11450) (10788) 659 (662) 5.8 (5.8) 5.7 (5.8) Oct Nov Dec (11523) (10869) 639 (654) 5.6 (5.7) 5.5 (5.7) 2010 Jan Feb March (11591) (10975) 619 (616) 5.3 (5.3) 5.3 (5.3) April May June (11670) (11061) 598 (609) 5.2 (5.2) 5.1 (5.2) July Aug Sep (11895) (11278) 611 (617) 5.1 (5.2) 5.1 (5.2) Oct Nov Dec (12021) (11397) 599 (625) 5.1 (5.2) 5.0 (5.2) Average calculated for previous three months; *Seasonally adjusted figures.
13 ABS Employment Estimates Detailed % of workforce unemployed Looking workforce* employed* for work* Original Adjusted* 2011 ( 000) ( 000) ( 000) ( 000) ( 000) ( 000) % % % % Jan Feb March (12038) (11437) 593 (601) 4.9 (5.0) 4.9 (5.0) April May June (12033) (11444) 581 (586) 4.9 (4.9) 4.9 (4.9) July Aug Sep (12072) (11445) 634 (628) 5.2 (5.1) 5.2 (5.2) Oct Nov Dec (12079) (11447) 630 (632) 5.3 (5.3) 5.2 (5.2) 2012 Jan Feb March (12091) (11466) 629 (625) 5.2 (5.2) 5.2 (5.2) April May June (12131) (11513) 631 (617) 5.1 (5.1) 5.2 (5.1) July Aug Sep (12148) (11508) 663 (640) 5.3 (5.2) 5.4 (5.2) Oct Nov Dec (12185) (11536) 656 (649) 5.4 (5.4) 5.4 (5.3) 2013 Jan Feb March (12259) (11590) 687 (669) 5.5 (5.4) 5.6 (5.5) April May June (12358) (11665) 709 (692) 5.7 (5.6) 5.7 (5.6) July Aug Sep (12351) (11645) 697 (705) 5.7 (5.7) 5.6 (5.7) Oct Nov Dec (12357) (11643) 722 (715) 5.8 (5.8) 5.8 (5.8) 2014 Jan Feb March (12228) (11556) 713 (728) 6.0 (6.0) 5.8 (5.9) April May June (12296) (11572) 742 (724) 5.9 (5.9) 6.0 (5.9) July Aug Sep (12388) (11624) 747 (764) 6.0 (6.1) 6.2 (6.2) Oct Nov Dec (12406) (11636) 759 (770) 6.2 (6.2) 6.1 (6.2) Average calculated for previous three months; *Seasonally adjusted figures.
14 ABS Employment Estimates Detailed % of workforce unemployed Looking workforce* employed* for work* Original Adjusted* 2015 ( 000) ( 000) ( 000) ( 000) ( 000) ( 000) % % % % Jan Feb March (12459) (11680) 765 (779) 6.2 (6.3) 6.1 (6.3) April May June (12508) (11751) 756 (757) 6.0 (6.0) 6.0 (6.1) July Aug Sep (12551) (11768) 772 (785) 6.2 (6.2) 6.2 (6.2) Oct Nov Dec (12616) (11880) 728 (736) 5.8 (6.0) 5.8 (5.8) 2016 Jan Feb March (12635) (11,896) 723 (739) 5.8 (5.8) 5.7 (5.8) April May June (12657) (11929) 734 (728) 5.7 (5.7) 5.8 (5.7) July Aug Sep (12674) (11960) 705 (715) 5.6 (5.7) 5.6 (5.6) Oct Nov Dec (12690) (11966) 741 (724) 5.7 (5.6) 5.8 (5.7) 2017 Jan Feb March (12761) (12015) 753 (747) 5.9 (5.8) 5.9 (5.8) April May June (12864) (12140) 728 (724) 5.6 (5.7) 5.6 (5.6) July Aug Sep (12977) (12253) 712 (724) 5.5 (5.6) 5.5 (5.6) Oct Nov Dec (13094) (12380) 731 (714) 5.4 (5.4) 5.5 (5.4) 2018 Jan Feb March (13202) (12473) 730 (729) 5.6 (5.5) 5.5 (5.5) April May June (13254) (12531) 714 (723) 5.4 (5.5) 5.4 (5.5) July Aug Sep. Oct. Nov. Dec. Average calculated for previous three months; *Seasonally adjusted figures
15 Roy Morgan Employment Estimate Detailed Workforce Employed % of workforce Unemployed Looking for work Quarterly Full-time Part-time Quarterly Full-time Part-time Unemployed Quarterly For work Quarterly Full-time Part-time 1999 ( 000) ( 000) ( 000) ( 000) ( 000) ( 000) ( 000) ( 000) % % ( 000) ( 000) ( 000) % ( 000) % Jan , Feb March 9175 (9204) (8284) (10.0) 818 (920) April May June 9110 (9078) (8231) (9.3) 866 (847) July Aug Sep (9277) (8450) (8.9) 831 (827) Oct Nov Dec (9178) (8325) (9.3) 862 (853) Jan Feb March 9226 (9270) (8369) (9.7) 867 (901) April May June 9277 (9237) (8349) (9.6) 826 (888) July Aug Sep (9335) (8470) (9.3) 869 (865) Oct Nov Dec (9335) (8435) (9.6) 953 (900) Jan Feb March 9320 (9336) (8359) (10.5) 989 (977) April May June 9344 (9377) (8435) (10.0) 908 (942) July Aug Sep (9475) (8555) (9.7) 1,006 (920) Oct Nov Dec (9578) (8643) (9.8) 1,003 (935) Average calculated for previous three months.
16 Roy Morgan Employment Estimate Detailed Workforce Employed % of workforce Unemployed Looking for work Quarterly Full-time Part-time Quarterly Full-time Part-time Unemployed Quarterly For work Quarterly Full-time Part-time 2002 ( 000) ( 000) ( 000) ( 000) ( 000) ( 000) ( 000) ( 000) % % ( 000) ( 000) ( 000) % ( 000) % Jan , Feb March 9470 (9696) (8749) (9.8) 841 (947) April May June 9563 (9604) (8821) (8.2) 794 (783) July Aug Sep (9654) (8939) (7.4) 703 (715) Oct Nov Dec (9555) (8824) (7.7) 730 (731) Jan Feb March 9565 (9609) (8859) (7.8) 769 (750) April May June 9551 (9612) (8846) (8.0) 764 (766) July Aug Sep (9719) (8943) (8.0) 761 (776) Oct Nov Dec (9880) (9099) (7.9) 863 (781) Jan Feb March (10080) (9181) (8.9) 892 (899) April May June 9701 (9898) (9079) (8.3) 826 (819) July Aug Sep (9969) (9258) (7.1) 698 (711) Oct Nov Dec (10028) (9357) (6.7) 688 (671) Average calculated for previous three months.
17 Roy Morgan Employment Estimate Detailed Workforce Employed % of workforce Unemployed Looking for work Quarterly Full-time Part-time Quarterly Full-time Part-time Unemployed Quarterly For work Quarterly Full-time Part-time 2005 ( 000) ( 000) ( 000) ( 000) ( 000) ( 000) ( 000) ( 000) % % ( 000) ( 000) ( 000) % ( 000) % Jan Feb March (10149) (9402) (7.4) 753 (747) April May June (10294) (9560) (7.1) 669 (734) July Aug Sep (10220) (9494) (7.1) 681 (726) Oct Nov Dec (10258) (9457) (7.8) 864 (802) Jan Feb March (10553) (9706) (8.0) 815 (847) April May June (10568) (9866) (6.6) 659 (702) July Aug Sep (10471) (9704) (7.3) 803 (767) Oct Nov Dec (10544) (9792) (7.1) 712 (752) Jan Feb March (10485) (9728) (7.2) 636 (757) April May June (10704) (10108) (5.6) 579 (596) July Aug Sep (10671) (10057) (5.8) 658 (614) Oct Nov Dec (10672) (10025) (6.1) 740 (647) Average calculated for previous three months.
18 Roy Morgan Employment Estimate Detailed Workforce Employed % of workforce Unemployed Looking for work Quarterly Full-time Part-time Quarterly Full-time Part-time Unemployed Quarterly For work Quarterly Full-time Part-time 2008 ( 000) ( 000) ( 000) ( 000) ( 000) ( 000) ( 000) ( 000) % % ( 000) ( 000) ( 000) % ( 000) % Jan Feb March (10696) (10050) (6.0) 651 (646) April May June (10758) (10127) (5.9) 629 (632) July Aug Sep (10955) (10371) (5.3) 538 (584) Oct Nov Dec (10933) (10259) (6.2) 700 (674) Jan Feb March (11078) (10269) (7.3) 775 (809) April May June (11124) (10295) (7.5) 862 (829) July Aug Sep (11291) (10466) (7.3) 775 (825) Oct Nov Dec (11324) (10537) (7.0) 773 (787) Jan Feb March (11471) (10598) (7.6) 836 (873) April May June (11533) (10785) (6.5) 682 (749) July Aug Sep (11656) (10919) (6.3) 756 (737) Oct Nov Dec (11829) (11003) (7.0) 903 (826) Average calculated for previous three months.
19 Roy Morgan Employment Estimate Detailed Workforce Employed % of workforce Unemployed Looking for work Quarterly Full-time Part-time Quarterly Full-time Part-time Unemployed Quarterly For work Quarterly Full-time Part-time 2011 ( 000) ( 000) ( 000) ( 000) ( 000) ( 000) ( 000) ( 000) % % ( 000) ( 000) ( 000) % ( 000) % Jan Feb March (11802) (10889) (7.7) 863 (913) April May June (11913) (11076) (7.0) 846 (837) July Aug Sep (11810) (10896) (7.7) 919 (914) Oct , Nov , Dec (12036) (11002) (8.6) 1,034 (1,035) Jan , Feb , March (12249) (11057) (9.7) 1,120 (1,192) April , May June (12177) (11072) (9.1) 1,169 (1,105) July , Aug , Sep (12183) (10986) (9.8) 1,214 (1,197) Oct , Nov , Dec (12095) (10913) (9.8) 1,175 (1,189) Jan , Feb , March (12431) (11079) (10.9) 1,369 (1,352) April , May , June (12406) (11230) (9.5) 1,205 (1,176) July , Aug , Sep (12469) (11197) (10.2) 1,297 (1,272) Oct , Nov , Dec (12518) (11181) (10.7) 1,411 (1,337) Average calculated for previous three months.
20 Roy Morgan Employment Estimate Detailed Workforce Employed % of workforce Unemployed Looking for work Quarterly Full-time Part-time Quarterly Full-time Part-time Unemployed Quarterly For work Quarterly Full-time Part-time 2014 ( 000) ( 000) ( 000) ( 000) ( 000) ( 000) ( 000) ( 000) % % ( 000) ( 000) ( 000) % ( 000) % Jan , Feb , March (12671) (11183) (11.7) 1,465 (1,488) April , May , June (12454) (11181) (10.2) 1,326 (1,273) July , Aug , Sep (12265) (11086) (9.6) 1,208 (1,179) Oct , Nov , Dec (12522) (11271) (10.0) 1,402 (1,251) Jan , Feb , March (12608) (11280) (10.5) 1,368 (1,327) April , May , June (12624) (11361) (10.0) 1,192 (1,263) July , Aug , Sep (12729) (11620) (8.7) 1,058 (1,109) Oct , Nov , Dec (12875) (11691) (9.2) 1,256 (1,184) Jan , Feb , March (13072) (11709) (10.4) 1,422 (1,362) April , May , June (12861) (11544) (10.2) 1,247 (1,317) July , Aug , Sep (12931) (11665) (9.8) 1,101 (1,266) Oct , Nov , Dec (12929) (11739) (9.2) 1,186 (1,191) Average calculated for previous three months.
21 Roy Morgan Employment Estimate Detailed Workforce Employed % of workforce Unemployed Looking for work Quarterly Full-time Part-time Quarterly Full-time Part-time Unemployed Quarterly For work Quarterly Full-time Part-time 2017 ( 000) ( 000) ( 000) ( 000) ( 000) ( 000) ( 000) ( 000) % % ( 000) ( 000) ( 000) % ( 000) % Jan , Feb , March (13324) (12063) (9.5) 1,236 (1,261) April , May , June (13246) (12012) (9.3) 1,200 (1,234) July , Aug , Sep (13091) (11837) (9.6) 1,202 (1,254) Oct , Nov , Dec (13192) (11917) (9.7) 1,312 (1,275) Jan , Feb , March (13526) (12279) (9.2) 1,210 (1,246) April , May , June (13345) (12117) (9.2) 1,171 (1,228) July , Aug , Sep (13395) (12042) (10.1) 1,256 (1,354) Oct. Nov. Dec Jan. Feb. March April May June July Aug. Sep. Oct. Nov. Dec. Average calculated for previous three months.
FOR IMMEDIATE RELEASE
 Article No. 7845 Available on www.roymorgan.com Roy Morgan Unemployment Profile Friday, 18 January 2019 Unemployment in December is 9.7% and under-employment is 8.8% FOR IMMEDIATE RELEASE Australian unemployment
FOR IMMEDIATE RELEASE
 Article No. 7353 Available on www.roymorgan.com Roy Morgan Unemployment Profile Wednesday, 11 October 2017 2.498 million Australians (18.9%) now unemployed or under-employed In September 1.202 million
FOR IMMEDIATE RELEASE
 Article No. 6928 Available on www.roymorgan.com Roy Morgan Unemployment Profile Wednesday, 17 August 2016 Australian real unemployment jumps to 10.5% (up 0.9%) in July during post-election uncertainty
FOR IMMEDIATE RELEASE
 Article No. 5842 Available on www.roymorgan.com Roy Morgan Unemployment Profile Thursday, 2 October 2014 Unemployment climbs to 9.9% in September as full-time work lowest since October 2011; 2.2 million
FOR IMMEDIATE RELEASE
 Article No. 7433 Available on www.roymorgan.com Roy Morgan Unemployment Profile Friday, 12 January 2018 2.6m Australians unemployed or under-employed in December The latest data for the Roy Morgan employment
FOR IMMEDIATE RELEASE
 Article No. 7137 Available on www.roymorgan.com Roy Morgan Unemployment Profile Wednesday, 8 February 2017 Over 12 million Australians have jobs for the first time including over 8 million full-time jobs,
Commercial-in-Confidence Ashton Old Baths Financial Model - Detailed Cashflow
 Year 0 1 2 3 4 5 6 7 8 9 10 11 12 13 Oct-16 Nov-16 Dec-16 Jan-17 Feb-17 Mar-17 Apr-17 May-17 Jun-17 Jul-17 Aug-17 Sep-17 Oct-17 2,038 2,922 4,089 4,349 6,256 7,124 8,885 8,885 8,885 8,885 8,885 8,885 9,107
Total Production by Month (Acre Feet)
") Production by Month (acre-feet) 2008 2009 2010 2011 2012 2013 2014 2015 2016 January 25 339.10 228.90 249.50 297.99 243.06 327.14 247.66 212.37 February 234.00 218.80 212.10 241.52 245.82 279.08 234.16
Production by Month (acre-feet) 2008 2009 2010 2011 2012 2013 2014 2015 2016 January 25 339.10 228.90 249.50 297.99 243.06 327.14 247.66 212.37 February 234.00 218.80 212.10 241.52 245.82 279.08 234.16
COMPARISON OF FIXED & VARIABLE RATES (25 YEARS) CHARTERED BANK ADMINISTERED INTEREST RATES - PRIME BUSINESS*
 CHARTERED BANK ADMINISTERED INTEREST RATES - PRIME BUSINESS*") COMPARISON OF FIXED & VARIABLE RATES (25 YEARS) 2 Fixed Rates Variable Rates For Internal Use Only. FIXED RATES OF THE PAST 25 YEARS AVERAGE RESIDENTIAL MORTGAGE LENDING RATE - 5 YEAR* (Per cent) Year
COMPARISON OF FIXED & VARIABLE RATES (25 YEARS) 2 Fixed Rates Variable Rates For Internal Use Only. FIXED RATES OF THE PAST 25 YEARS AVERAGE RESIDENTIAL MORTGAGE LENDING RATE - 5 YEAR* (Per cent) Year
COMPARISON OF FIXED & VARIABLE RATES (25 YEARS) CHARTERED BANK ADMINISTERED INTEREST RATES - PRIME BUSINESS*
 CHARTERED BANK ADMINISTERED INTEREST RATES - PRIME BUSINESS*") COMPARISON OF FIXED & VARIABLE RATES (25 YEARS) 2 Fixed Rates Variable Rates FIXED RATES OF THE PAST 25 YEARS AVERAGE RESIDENTIAL MORTGAGE LENDING RATE - 5 YEAR* (Per cent) Year Jan Feb Mar Apr May Jun
COMPARISON OF FIXED & VARIABLE RATES (25 YEARS) 2 Fixed Rates Variable Rates FIXED RATES OF THE PAST 25 YEARS AVERAGE RESIDENTIAL MORTGAGE LENDING RATE - 5 YEAR* (Per cent) Year Jan Feb Mar Apr May Jun
September 2016 Water Production & Consumption Data
 September 2016 Water Production & Consumption Data September 2016 monthly water production (288.48 AF) was lowest in at least 17 years. Monthly water production has increased slightly each month since
August ATR Monthly Report
 August ATR Monthly Report Minnesota Department of Transportation Office of Transportation Data and Analysis August 2011 Introduction The purpose of this report is to examine monthly traffic trends on
WIM #37 was operational for the entire month of September Volume was computed using all monthly data.
 SEPTEMBER 2016 WIM Site Location WIM #37 is located on I-94 near Otsego in Wright county. The WIM is located only on the westbound (WB) side of I-94, meaning that all data mentioned in this report pertains
September 2014 Data Release
 September 214 Data Release Fannie Mae s consumer attitudinal survey polls the adult U.S. general population to assess their attitudes about homeownership, renting a home, the economy, and household finances.
ANCR CRU Statistics February 2007 to December 2007
 ANCR CRU Statistics February 2007 to December 2007 o Jan/07 Feb/07* Mar/07 Apr/07 May/07 Jun/07 Jul/07 Aug/07 Sep/07 Oct/07 Nov/07 Dec/07 Total notes data from Perimeter phone system unavailable prior
Up and Down Months of the Stock Market
 Up and Down Months of the Stock Market 1926-2017 Positive years (66) in the stock market were not good all year long and losing years (24) were not losers throughout the year. Winning years produce losing
April 2014 Data Release
 April 214 Data Release Fannie Mae s consumer attitudinal survey polls the adult U.S. general population to assess their attitudes about homeownership, renting a home, the economy, and household finances.
May ATR Monthly Report
 May ATR Monthly Report Minnesota Department of Transportation Office of Transportation Data and Analysis May 2011 Introduction The purpose of this report is to examine monthly traffic trends on Minnesota
COMPILED BY GLASS S. Auction Report - LCV November 2013
 GLASS S Auction Report - LCV November 2013 Contents Market Commentary Page 3 Whole Market Summary Page 8 Average Sales Price Year on Year Page 9 Sales Price Compared to Number of Entries (all ages) Page
GAZIFÈRE INC. Prime Rate Forecasting Process 2017 Rate Case
 Overview A consensus forecast is used to estimate the prime rate charged by commercial banks. As the prime rate is subject to competitive pressures faced by individual lenders and is set on an individual
Inventory Levels - All Prices. Inventory Levels - By Price Range
 Inventory Levels - All Prices Idaho Falls Bonneville Total 3-Mar-17 152 108 260 2-Mar-18 109 78 187-28% Inventory Levels - By Price Range 3-Mar-17 2-Mar-18 0-100,000 41 6 100,001-125,000 19 8 125,001-150,000
Inventory Levels - All Prices. Inventory Levels - By Price Range
 Inventory Levels - All Prices Idaho Falls Bonneville Total 7-Apr-17 154 111 265 6-Apr-18 113 91 204-23% Inventory Levels - By Price Range 7-Apr-17 6-Apr-18 0-100,000 36 10 100,001-125,000 13 9 125,001-150,000
Presented by Eric Englert Puget Sound Energy September 11, 2002
 Results from PSE s First Year of Time of Use Program Presented by Eric Englert Puget Sound Energy September 11, 2002 Puget Sound Energy Overview 973,489 Total Electric Customers 908,949 are AMR Capable
Inventory Levels - All Prices. Inventory Levels - By Price Range
 Inventory Levels - All Prices Idaho Falls Bonneville Total 3-Nov-17 198 128 326 2-Nov-18 155 134 289-11% Inventory Levels - By Price Range 3-Nov-17 2-Nov-18 0-100,000 17 11 100,001-125,000 15 9 125,001-150,000
Macroeconomic Outlook. Presented by Dr. Bruce A. Scherr Chairman of the Board Chief Executive Officer Emeritus
 Macroeconomic Outlook Presented by Dr. Bruce A. Scherr Chairman of the Board Chief Executive Officer Emeritus Waterways Symposium Cincinnati, OH November 15-17, 2016 Topics Energy Macro Implications Inflation
TABLE C-43. Manufacturers' new and unfilled orders, {Amounts in millions of dollars] Nondurable. Capital goods. Total. goods.
![TABLE C-43. Manufacturers' new and unfilled orders, {Amounts in millions of dollars] Nondurable. Capital goods. Total. goods.](/thumbs/93/112603708.jpg "TABLE C-43. Manufacturers' new and unfilled orders, {Amounts in millions of dollars] Nondurable. Capital goods. Total. goods.") TABLE C-43. Manufacturers' new and unfilled orders, -74 {Amounts in millions of dollars] New orders t, I960. 27, 559 26, 903 30,672 30,115 31,086 33,005 35,322 37,952 41, 803 45, 944 46,763 50, 243 53,
TABLE C-43. Manufacturers' new and unfilled orders, -74 {Amounts in millions of dollars] New orders t, I960. 27, 559 26, 903 30,672 30,115 31,086 33,005 35,322 37,952 41, 803 45, 944 46,763 50, 243 53,
The Peoples Gas Light and Coke Company
 History of Gas Charges Due to the Operation of Rider 2 (Cents per Therm) Factors for Transportation Customers (Riders FST, SST, P, CFY and AGG) Non- Total Standby Standby Aggregation Commodity Commodity
increase of over four per cent compared to the average of $409,058 reported in January 2010.
 SINGLE FAMILY RESIDENTIAL BREAKDOWN uary 211 26.8 % 1.7 % 7.%.4%.1 % Good Start to 211 TORONTO - February 4, 211 Greater Toronto REALTORS reported 4,337 transactions through the TorontoMLS system in uary
M onthly arket. Jan Table of Contents. Monthly Highlights
 Table of Contents Market Inventory...2 www.gaar.com Monthly Highlights January 2014 had a 12.29% increase in the number of homes sales when compared to same time last year. The average sale price of single-family
Construction Sector Indices
 STATISTICAL RELEASE UGANDA BUREAU OF STATISTICS January to April 212 Construction Sector Indices HIGHLIGHTS Annual Changes show that the prices for the Whole Construction Sector (covering material prices,
Black Employm ent an d Unemploymen t Decembe r 2013 Page 1
 January 10, 2014 DATA BRIEF: Black Employment and Unemployment in December 2013 The unemployment rate for Blacks was 11.9% last month. This is according to the latest report on the nation s employment
ENERGY SLIDESHOW. Federal Reserve Bank of Dallas
 ENERGY SLIDESHOW Updated: January 16, 2019 ENERGY PRICES www.dallasfed.org/research/energy Brent & WTI & Crude Brent Oil Crude Oil Dollars per barrel 140 120 100 Brent (Jan 11 = $58.64) WTI (Jan 11 = $50.78)
Date Event or Holiday :Sun, 2:Mon North Orchard Delong Preschool North Orchard Delong Preschool
 2018 6 1 1:Sun, 2:Mon 2018-2019 Date Event or Holiday Aug 16 Board Meeting 6pm Aug 23 Open House June 2018 July 2018 August 2018 Sep 06 Board Meeting 6pm Su M Tu W Th F Sa Su M Tu W Th F Sa Su M Tu W Th
Black Employm ent an d Unemploymen t July Page 1
 August 3, 2012 DATA BRIEF: Black Employment and Unemployment in July 2012 The unemployment rate for Blacks was 14.1% last month. This is according to the latest report on the nation s employment situation
CEO PROGRAM September 2018
 CEO PROGRAM September 2018 1 Sept 17th: ALL! CEO High Orientation (Kiva 6pm 7:30pm) 2 3 4 5 6 7 8 Sept 18th: ALL! CEO Orientation (Kiva 6pm 7:30pm) 9 10 11 12 13 14 15 *Parents please drop off/pick up
University of Michigan Eco-Driving Index (EDI) Latest data: October 2017
 Latest data: October 2017") University of Michigan Eco-Driving Index () http://www.ecodrivingindex.org Latest data: October 2017 Developed and issued monthly by Michael Sivak and Brandon Schoettle Sustainable Worldwide Transportation
University of Michigan Eco-Driving Index () http://www.ecodrivingindex.org Latest data: October 2017 Developed and issued monthly by Michael Sivak and Brandon Schoettle Sustainable Worldwide Transportation
October 23, September year. in 1Q confidence in our. exacerbated by the. 0.3 percent. outpu. (over) Index of Sales. Mar 12.
 Index of Sales. Mar 12.") October 23, 20122 REPORT ON BUSINESSS TRENDS September 20122 Industry Performance Reverts to Pace off GDP in Broad Economy Index of Sales September 2011 - September 2012 140 130 125 127 125 120 114 117
October 23, 20122 REPORT ON BUSINESSS TRENDS September 20122 Industry Performance Reverts to Pace off GDP in Broad Economy Index of Sales September 2011 - September 2012 140 130 125 127 125 120 114 117
Black Employm ent an d Unemploymen t Au gust Page 1
 September 7, 2012 DATA BRIEF: Black Employment and Unemployment in August 2012 The unemployment rate for Blacks was 14.1% last month. This is according to the latest report on the nation s employment situation
Unemployment Rates - November 2011
 December 2, 2011 DATA BRIEF: Black Employment and Unemployment in November 2011 The unemployment rate for Blacks was 15.5% last month. This is according to the latest report on the nation s employment
TECHNICAL SERVICE BULLETIN
 TECHNICAL SERVICE BULLETIN To: Minuteman Dealers and Customers From: Minuteman Technical Support Date: 1/12/2011 Subject: TSB for the KIT # K-FRSPEEDSWT. For the FR17115, FR17220, FR20115 and FR20220 models.
MONTHLY NEW RESIDENTIAL CONSTRUCTION, FEBRUARY 2017
 FOR RELEASE AT 8:30 AM EDT, THURSDAY, MARCH 16, MONTHLY NEW RESIDENTIAL CONSTRUCTION, FEBRUARY Release Number: CB17-38 March 16, - The U.S. Census Bureau and the U.S. Department of Housing and Urban Development
Meter Insights for Downtown Store
 Meter Insights for Downtown Store Commodity: Analysis Period: Prepared for: Report Date: Electricity 1 December 2013-31 December 2014 Arlington Mills 12 February 2015 Electricity use over the analysis
January During JANUARY. Sunday Monday Tuesday Wednesday Thursday Friday Saturday 1 Dec Feb 2011
 January 2011 1 Dec 2010 Feb 2011 During JANUARY Happy New Year! -- Appoint Company Nominating Committee 1 2 3 4 -- Camp report to Company - Jan 155 6 7 8 9 10 11 6 7 8 9 10 11 12 12 13 14 15 16 17 18 13
MONTHLY NEW RESIDENTIAL CONSTRUCTION, JULY 2017
 FOR RELEASE AT 8:30 AM EDT, WEDNESDAY, AUGUST 16, MONTHLY NEW RESIDENTIAL CONSTRUCTION, JULY Release Number: CB17-133 August 16, - The U.S. Census Bureau and the U.S. Department of Housing and Urban Development
Electricity Industry Code Minimum Service Standards & Guaranteed Service Levels Quarterly Report July September 2008
 Electricity Industry Code Minimum Service Standards & Guaranteed Service Levels Quarterly Report July September 2008 2 Table of Contents Administrative Data...3 Network Performance...3 Reliability Measures
ANCR CRU Statistics Februa.. to December 2007
 ANCR CRU Statistics Februa.. to December 2007 Jan/07 Feb/07* Mar/07 Apr/07 May/07 Jun/07 Jul/07 Aug/07 Sep/07 Oct/07 Nov/07 Dec/07 Total notes Answered dato from Perimeter phone system unavailable prior
Price Category Breakdown - February 2010
 SINGLE FAMILY RESIDENTIAL BREAKDOWN ruary 21 ruary Sales and Average Price Increase Annually TORONTO - Wednesday, March 3, 21 7.3 % 24.6 % 1.8 % 7.3%.2%.1 % Greater Toronto REALTORS reported 7,291 sales
MONTHLY NEW RESIDENTIAL SALES, AUGUST 2017
 FOR RELEASE AT 10:00 AM EDT, TUESDAY, SEPTEMBER 26, MONTHLY NEW RESIDENTIAL SALES, AUGUST Release Number: CB17-161 Notice: For information on the impact of Hurricanes Harvey and Irma on the compilation
MONTHLY NEW RESIDENTIAL CONSTRUCTION, APRIL 2017
 FOR RELEASE AT 8:30 AM EDT, TUESDAY, MAY 16, MONTHLY NEW RESIDENTIAL CONSTRUCTION, APRIL Release Number: CB17-75 May 16, - The U.S. Census Bureau and the U.S. Department of Housing and Urban Development
Quarterly Hogs and Pigs
 Washington, D.C. Quarterly Hogs and Pigs Released March 26, 2010, by the National Agricultural Statistics Service (NASS),, U.S. Department of Agriculture. For information on call Nick Streff at 202-720-3,
MONTHLY NEW RESIDENTIAL CONSTRUCTION, NOVEMBER 2017
 FOR RELEASE AT 8:30 AM EST, TUESDAY, DECEMBER 19, MONTHLY NEW RESIDENTIAL CONSTRUCTION, NOVEMBER Release Number: CB17-206 December 19, - The U.S. Census Bureau and the U.S. Department of Housing and Urban
MEDIA PACK 2019 MAGAZINE WINDOWS DOORS CONSERVATORIES GLASS FABRICATORS DISTRIBUTORS INSTALLERS. October 2018 Issue
 MEDIA PACK 2019 WINDOWS DOORS CONSERVATORIES GLASS FABRICATORS DISTRIBUTORS INSTALLERS CLEARZINE CLEARVIEW-UK.COM MAGAZINE 733 ALUMINIUM WINDOW & DOOR FABRICATORS MAGAZINE DISTRIBUTION 12,606 2,356 14,889
Monthly Hog Market Update United States Hog Production
 This information is provided as a resource by Saskatchewan Agriculture staff All prices are in Canadian dollars unless otherwise noted. Please use this information at your own risk. Monthly Hog Market
March 2013 Euro area unemployment rate at 12.1% EU27 at 10.9%
 STAT/13/70 30 April 2013 March 2013 Euro area unemployment rate at 12.1% at 10.9% The euro area 1 (EA17) seasonally-adjusted 2 unemployment rate 3 was 12.1% in March 2013, up from 12.0% in February 4.
Year to Date Summary. Average and Median Sale Prices
 A Publication of RMLS, The Source for Real Estate Statistics in Your Community Residential Review: Southwest Washington September 2018 Reporting Period September Residential Highlights Southwest Washington
Black Employm ent an d Unemploymen t Ap ril Page 1
 May 6, 2012 DATA BRIEF: Black Employment and Unemployment in April 2012 The unemployment rate for Blacks was 13.0% last month. This is according to the latest report on the nation s employment situation
ENERGY SLIDESHOW. Federal Reserve Bank of Dallas
 ENERGY SLIDESHOW Updated: March 13, 2018 ENERGY PRICES www.dallasfed.org/research/energy Brent & WTI & Crude Brent Oil Crude Oil Dollars per barrel 140 Brent (Mar 9 = $65.12) WTI (Mar 9 = $61.65) 120 100
TENTH DISTRICT MANUFACTURING SURVEY REBOUNDED MODERATELY Federal Reserve Bank of Kansas City Releases January Manufacturing Survey
 FOR RELEASE Thursday, January 23, 2014 EMBARGOED FOR 10 A.M. CENTRAL TIME CONTACT: Bill Medley 816-881-2556 Bill.Medley@kc.frb.org TENTH DISTRICT MANUFACTURING SURVEY REBOUNDED MODERATELY Federal Reserve
[Amounts in millions of dollars] Nondurable. Total. goods. equipment 34,415 30,717 24,506 8,868 9,566 8,981
![[Amounts in millions of dollars] Nondurable. Total. goods. equipment 34,415 30,717 24,506 8,868 9,566 8,981](/thumbs/92/109418289.jpg "[Amounts in millions of dollars] Nondurable. Total. goods. equipment 34,415 30,717 24,506 8,868 9,566 8,981") 1970 TABLE C-44. Manufacturers 1 new and unfilled orders, 1947-69 Unfilled orders2 Unfilled orders-shipments Machinery and equipment 1947.. 1948.. 1949.. 23,53.3 3 3 4 3 1961 * 31,085 15,698 17,026 18,522
1970 TABLE C-44. Manufacturers 1 new and unfilled orders, 1947-69 Unfilled orders2 Unfilled orders-shipments Machinery and equipment 1947.. 1948.. 1949.. 23,53.3 3 3 4 3 1961 * 31,085 15,698 17,026 18,522
Presentation to the Customer Service, Operations and Safety Committee OPERATIONS PERFORMANCE INDICATORS
 Presentation to the Customer Service, Operations and Safety Committee OPERATIONS PERFORMANCE INDICATORS May 19, 2005 Department of Operations 100 95 90 85 80 75 70 65 A B C D RAIL PERFORMANCE INDEX FY
MONTHLY NEW RESIDENTIAL SALES, APRIL 2017
 FOR RELEASE AT 10:00 AM EDT, TUESDAY, MAY 23, MONTHLY NEW RESIDENTIAL SALES, APRIL Release Number: CB17-80 May 23, - The U.S. Census Bureau and the U.S. Department of Housing and Urban Development jointly
Wheat Marketing Situation
 Wheat Marketing Situation Prepared by: Darrell L. Hanavan Executive Director Colorado Wheat Administrative Committee If you would like to receive an email when this report is updated, email gmostek@coloradowheat.org
RIDERSHIP TRENDS. April 2018
 RIDERSHIP TRENDS April Prepared by the Division of Strategic Capital Planning June Table of Contents Executive Summary...1 Ridership...3 Estimated Passenger Trips by Line...3 Estimated Passenger Trips
MONTHLY NEW RESIDENTIAL CONSTRUCTION, AUGUST 2017
 FOR RELEASE AT 8:30 AM EDT, TUESDAY, SEPTEMBER 19, MONTHLY NEW RESIDENTIAL CONSTRUCTION, AUGUST Release Number: CB17-158 Notice: For information on the impact of Hurricanes Harvey and Irma on the compilation
Local Market Update 2012 Year In Review
 Northwest Area Home Sales for the Year 2012 Sales of single-family homes reported in Toledo and the surrounding area by the Toledo Board of REALTORS totaled 6,793. This was an increase of 6% compared to
OECD unemployment rate stable at 5.4% in March 2018
 OECD unemployment rate stable at.4% in March 2018 The OECD unemployment rate remained stable at.4% in March 2018. Across the OECD area, 34 million people were unemployed, 1.4 million more than in April
August 2018 MLS Statistical Report
 January February March April May June July August Septem October Novem Decem August 218 MLS Statistical Report Total Sales Overall, sales are down 3%; however, total volume sold is up 7% and Median Sale
1. Trends in the current fiscal year and previous fiscal year 3. Business overview 2. Secular trends in first quarter financial results
 FY2/19 (March 2018~May 2018) Fact Book 1. Trends in the current fiscal year and previous fiscal year 3. Business overview (1) Performance overview P. 1 (1) No. of students at the end of month P. 6 (2)
November 2018 Customer Switching Report for the Electricity and Gas Retail Markets
 An Coimisiún um Rialáil Fóntas Commission for Regulation of Utilities November 2018 Customer Switching Report for the Electricity and Gas Retail Markets Information Paper Reference: CRU18266 Date Published:
Unemployment Rates January 2011
 February 4, 2011 DATA BRIEF: Black Employment and Unemployment in January 2011 by Sylvia Allegretto, Ary Amerikaner, and Steven Pitts The unemployment rate for Blacks was 15.7% last month. This is according
Bulk Storage Containers
 UCSB AST SPCC SELF-INSPECTION CHECKLIST Year: Responsible Department: Tank Location: Tank ID: Bulk Storage Containers Total tank capacity: Petroleum type and amount: Secondary containment type: (diesel,
Units of Instruction MISD Pacing Guide Days Date Range Test Date
 MISD Pacing Guide Date Range Test Date Introduction: Processes of Investigations (1 day) Aug. 21 Unit 01: Matter (12 days) Aug. 22-Sept. 7 Sep. 10 Unit 02: Atomic Structure and the Periodic Table (15 days)
NZPork Monthly Import Report
 NZPork Monthly Import Report IW Barugh and EJ Neumann December 10, 2017 1 Data summary for October 2017 Data from January 2000 through October 2017 was downloaded from the Statistics NZ website (http://www.stats.govt.
CREDIT UNION ESTIMATES
 MONTHLY CREDIT UNION ESTIMATES Prepared March 4, 2019 by Credit Union National Association Economics and Statistics Department cuna.org/mcue Loans Credit union loans outstanding grew 0.3% in January, compared
CREDIT UNION ESTIMATES
 MONTHLY CREDIT UNION ESTIMATES Prepared March 2, 2018 by Credit Union National Association Economics and Statistics Department cuna.org/mcue Loans Credit union loans outstanding grew 0.7% in, compared
TABLE C-42. Sales and inventories in manufacturing and trade, [Amounts in millions of dollars] Manufacturing. Inventories Ratio 3.
![TABLE C-42. Sales and inventories in manufacturing and trade, [Amounts in millions of dollars] Manufacturing. Inventories Ratio 3.](/thumbs/80/81413912.jpg "TABLE C-42. Sales and inventories in manufacturing and trade, [Amounts in millions of dollars] Manufacturing. Inventories Ratio 3.") 1970 TABLE C-4. and inventories in manufacturing, 1947-69 Inyentories i 1947 1948 1949 1950 1951 195 1953 1954 1955 1956 1957 1958 1959 35,60 54,33 5,507 59,8 70,4 7,377,1 89,05 86,9 1.4 16,16 1,714,59
1970 TABLE C-4. and inventories in manufacturing, 1947-69 Inyentories i 1947 1948 1949 1950 1951 195 1953 1954 1955 1956 1957 1958 1959 35,60 54,33 5,507 59,8 70,4 7,377,1 89,05 86,9 1.4 16,16 1,714,59
IOWA MOLD TOOLING CO., INC. BOX 189, GARNER, IA TEL: IMT PART NUMBER
 CRANE LOG CALENDAR YEAR CRANE MODEL Daily Inspections Weekly Inspections Monthly Inspections Lubrication Record Maintenance Record Damage & Repair Record Modification Record Reference Specifications CRANE
CREDIT UNION ESTIMATES
 MONTHLY CREDIT UNION ESTIMATES Prepared February 1, 2018 by Credit Union National Association Economics and Statistics Department cuna.org/mcue Loans Credit union loans outstanding grew 1.0% in, compared
up the formulas. You can copy/paste the formulas for the days within the same October 2017 Jan 1, 2 & 5 Student Christmas Break April 2018
 School Year Calendar Template 2013-2014 Vertex42 LLC INSTRUCTIONS Year: 2017 Beginning Month: 8 Start day: 1 1:Sunday, 2:Monday «Choose the year and beginning month Note: If you choose Monday as the start
M o n. a t i s t i c s. M o n t h l y NOVEMBER 2009
 M o n t h l y M o n t S h l t y a t i s t i c s NOVEMBER 29 For Immediate Release December 7, 29 CONTACT: Kimberly Clifton, President (52) 954-8 Wes Wiggins Vice President, MLS (52) 82-8792 Cheri Meadows
LOCAL CLIMATOLOGICAL DATA
 ILLINOIS STATE WATER SURVEY DIVISION URBANA, ILLINOIS ISWS MP-21 Archive SWS0964 Illinois State Water Survey LOCAL CLIMATOLOGICAL DATA FDR HILLSBORO, IL. 1901-1962 LOCAL CLIMATOLOGICAL DATA 1901-1962 HILLSBORO
RIDERSHIP TRENDS. July 2018
 RIDERSHIP TRENDS July Prepared by the Division of Strategic Capital Planning September Table of Contents Executive Summary...1 Ridership...3 Estimated Passenger Trips by Line...3 Estimated Passenger Trips
CREDIT UNION ESTIMATES
 MONTHLY CREDIT UNION ESTIMATES Prepared January 2, 2019 by Credit Union National Association Economics and Statistics Department cuna.org/mcue Loans Credit union loans outstanding grew 0.6% in, compared
Unemployment Rates August 2010
 September 3, 2010 DATA BRIEF: Black Employment and Unemployment in August 2010 by Sylvia Allegretto, Ary Amerikaner, and Steven Pitts The unemployment rate for Blacks was 16.3% last month. This is according
Euro area unemployment rate at 10.5%
 3/2016-7 January 2016 November 2015 Euro area unemployment rate at 10.5% EU28 at 9.1% The euro area (EA19) seasonally-adjusted unemployment rate was 10.5% in November 2015, down from 10.6% in October 2015,
Hospitality & Tourism Management January 2015 Calendar Sunday Monday Tuesday Wednesday Thursday Friday Saturday 1 2 3
 Jan-14 Week 1 Week 2 January 2015 Calendar 1 2 3 New Year's Day - 4 5 6 7 8 9 10 New Intake-L4 (EFTH) Assign-Presentation L4 Assign-Presentation L5 Last Exam Reg- CTH Assign Marking Assign Marking Module-
MONTHLY NEW RESIDENTIAL SALES, SEPTEMBER 2018
 FOR RELEASE AT 10:00 AM EDT, WEDNESDAY, OCTOBER 24, MONTHLY NEW RESIDENTIAL SALES, SEPTEMBER Release Number: CB18 160 October 24, The U.S. Census Bureau and the U.S. Department of Housing and Urban Development
CREDIT UNION ESTIMATES
 MONTHLY CREDIT UNION ESTIMATES Prepared September 28, 2018 by Credit Union National Association Economics and Statistics Department cuna.org/mcue Loans Credit union loans outstanding grew 1.0% in, compared
Digitized for FRASER Federal Reserve Bank of St. Louis. Per cent. P Total reported (000) ^D-)>oCL
 ^D-)>oCL") statistical FEDERAL release RESERVE ^D-)>oCL For immedia < t4 6 relea I s February 13, 1968 AUTOM3BILE LOANS BY MAJOR SALES FINANCE COMPANIES IN THE FOURTH QlJARTP^HE PROPORTION OF 3 YEAR NEW CAR CONTRACTS
statistical FEDERAL release RESERVE ^D-)>oCL For immedia < t4 6 relea I s February 13, 1968 AUTOM3BILE LOANS BY MAJOR SALES FINANCE COMPANIES IN THE FOURTH QlJARTP^HE PROPORTION OF 3 YEAR NEW CAR CONTRACTS
WIM #29 was operational for the entire month of October Volume was computed using all monthly data.
 OCTOBER 2015 WIM Site Location WIM #29 is located on US 53 near Cotton in St Louis county. System Operation WIM #29 was operational for the entire month of October 2015. Volume was computed using all monthly
CREDIT UNION ESTIMATES
 MONTHLY CREDIT UNION ESTIMATES Prepared September 4, 2018 by Credit Union National Association Economics and Statistics Department cuna.org/mcue Loans Credit union loans outstanding grew 1.1% in, compared
CREDIT UNION ESTIMATES
 MONTHLY CREDIT UNION ESTIMATES Prepared November 1, 2017 by Credit Union National Association Economics and Statistics Department cuna.org/mcue Loans Credit union loans outstanding grew 0.7% in, compared
CVRP: Market Projections and Funding Needs
 CVRP: Market Projections and Funding Needs Public Workshop: Update to the 3-Year Plan for LDV & Transportation Equity Investments (4 Dec. 2018, El Monte CA) Brett Williams, PhD Senior Principal Advisor,
Multiple Listing Service
 For Immediate Release: January 7, 21 CONTACT: Dan Santa Maria MLS President (52) 795-1492 Wes Wiggins Vice President, MLS (52) 382-8792 Cheri Meadows Senior Vice President, TAR (52) 327-4218 For Tucson
CREDIT UNION ESTIMATES
 MONTHLY CREDIT UNION ESTIMATES Prepared May 1, 2018 by Credit Union National Association Economics and Statistics Department cuna.org/mcue Loans Credit union loans outstanding grew 1.1% in, compared to
NJ Solar Market Update As of 6/30/15
 NJ Solar Market Update As of 6/30/ Prepared by Charlie Garrison July 17, 20 SOLAR INSTALLED CAPACITY DATA The preliminary installed solar capacity as of 6/30/ is approximately 1,500.7 MW. Approximately
FY2/18 2Q(March 2017~August 2018)
") FY2/18 2Q(March 2017~August 2018) Fact Book 1. Trends in the current fiscal year and previous fiscal year 3. Business overview (1) Performance overview P.1 (1) No. of students at the end of month P.7 (2)
FY2/18 2Q(March 2017~August 2018) Fact Book 1. Trends in the current fiscal year and previous fiscal year 3. Business overview (1) Performance overview P.1 (1) No. of students at the end of month P.7 (2)
Operational Overview. Operational Forum, 24 th March 2010
 Operational Overview Operational Forum, 24 th March 21 Weather Weather February 21 The cold weather continued throughout February with all but one day being colder than the 17-year seasonal normal CWV.
NJ Solar Market Update As of 2/29/16
 NJ Solar Market Update As of 2/29/16 Prepared by Charlie Garrison March 24, 2016 SOLAR INSTALLED CAPACITY DATA The installed solar capacity as of 2/29/16 is approximately 1,644.3 MW. Approximately 20.3
Used Vehicle Supply: Future Outlook and the Impact on Used Vehicle Prices
 Used Vehicle Supply: Future Outlook and the Impact on Used Vehicle Prices AT A GLANCE When to expect an increase in used supply Recent trends in new vehicle sales Changes in used supply by vehicle segment