Palliser Airshed Society
|
|
|
- Abraham Bradley
- 5 years ago
- Views:
Transcription

1 Palliser Airshed Society Ambient Air Monitoring Network Summary March 2004 Prepared By: TABLE OF CONTENTS Airshed Zone Association March PASZA Ambient Air Report...2 Figure 1. PAS Crescent Heights O 3 Monthly Trend...7 Figure 2. PAS Crescent Heights NO and NO X Monthly Trends...11 Figure 3. PAS Crescent Heights NO 2 Monthly Trends...13 Figure 4. PAS Crescent Heights THC Monthly Trends...15 Figure 5. PAS Crescent Heights PM 2.5 Monthly Trends...17 Figure 6. PAS Crescent Heights Relative Humidity Monthly Trends...19 Figure 7. PAS Crescent Heights Temperature Monthly Trends...21 Figure 8. PAS Crescent Heights Solar Radiation Monthly Trends...23 Figure 9. PAS Crescent Heights Monthly Wind Rose...27
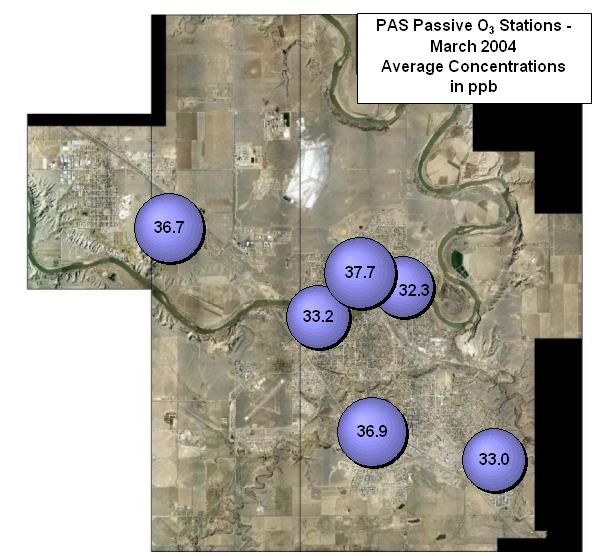
2 Alberta Environment Enforcement and Monitoring Division 11 th Floor, Oxbridge Place th Street Edmonton, Alberta, T5K 2J6 March 29, 2004 Attention: Director of Monitoring and Evaluation RE: Palliser Airshed Society (PAS) Ambient Air Monitoring Report March 2004 Enclosed is the PAS Ambient Monitoring Report for the month of March Continuous Monitoring Crescent Heights Included in this report are the, monthly sampling table, detailed hourly average reports and multipoint calibration reports of all instruments. The measured ambient air quality was within the Provincial and Federal guidelines with no exceedences recorded. Operational time of all instruments were below 90% due to a continued downtime from the previous month. Alberta Environment was informed (reference# ), and a letter was submitted within seven days of notification and is attached as a reference. There were no significant events leading to emergency response for the month of March. The following is a summary of the monthly averages found during this month of sampling: Monthly average concentrations of NO 2 was 8.3 ppb Monthly average concentrations for O 3 was 33.6 ppb Monthly average concentrations for THC was 2.21 ppm Monthly average concentrations for PM 2.5 was 1.0 µg/m 3 Passive Monitoring Six Stations throughout the PAS zone: There were no damaged or missing samples for the month and no exceedances of the Provincial Air Quality guidelines Monthly average concentrations for SO 2 passives ranged from 0.2 ppb to 0.4 ppb Monthly average concentrations for NO 2 passives ranged from 4.1 ppb to 8.1 ppb Monthly average concentrations for O 3 passives ranged from 32.3 ppb to 37.7 ppb If you have any questions, please contact the Focus office at Gary Cross Kevin McCullum Gary Cross C.E.T. AQM Technical Manager Kevin McCullum, M.Sc.,P.Eng. Environmental AQM Engineer
3 April 30, 2004 Standards & Approvals Division Alberta Environment 4 th Floor, Oxbridge Place Street Edmonton, Alberta T5K 2J6 ATTENTION: RE: Director Ambient Air Monitoring Contravention Report A contravention was recently reported by Focus on behalf of the Palliser Airshed Society (PAS) of less than ninety (90%) percent data collection for the month of February and March at the Medicine Hat Ambient Air monitoring station, reference number The cause of the contravention was missing data from the Data Acquisition System (DAS) as caused by initial start-up problems relating mainly to internet connectivity issues and computer viruses. Daily data remote inspection was not available until March 9 th hindering the ability to review station data collection. As a result of these issues and proactive improvement of data collection procedures the following actions have and will be taken: 1. A firewall and virus protection has been installed on the site PC to protect from internet intrusions. 2. An uninterruptible power supply (UPS) system will be installed to insure the DAS and station computer (PC) are less affected by power modulations or loss. 3. A back-up digital chart recorder will be installed to act as a secondary data collection source and all collected data will be archived regularly onsite. 4. Data remote queries are now available to ensure routine central archived data collection is occurring without irregularities. The listed action items are to ensure that data will not be lost in the future for reasons related to computer or power problems Sincerely, Gary Cross C.E.T. AQM Technical Manager GC/mm
4 March 2004 Monthly Overall Summary Report Ambient Air Quality Data April 30, 2004 Mar-2004 PAS - AMBIENT AIR QUALITY DATA Maximum Recorded Values 1-hr 24-hr Pollutant Guidelines Station Monthly Exceedence Conc Day WSPD WDIR Conc Day Operational (units) 1-hr 24-hr Average 1-hr 24-hr (km/hr ) (Sector) Time (%) NO (ppb) Crescent Heights Mar SW 10.9 Mar-11 79% NO 2 (ppb) Crescent Heights Mar SW 17.0 Mar-11 79% NO X (ppb) Crescent Heights Mar SW 27.6 Mar-11 79% O 3 (ppb) 82 Crescent Heights Mar SE 43.6 Mar-19 79% THC (ppm) Crescent Heights Mar SSW 2.40 Mar-23 79% PM 2.5 (µg/m 3 ) 30 a Crescent Heights Mar SW 3.3 Mar-31 67% RH (%) Crescent Heights % SR (W/m 2 ) Crescent Heights % Temp ( o C) Crescent Heights % WSPD v (km/hr) Crescent Heights % WSPD s (km/hr) Crescent Heights % WDIR (Deg) Crescent Heights WSW* 79% Note: a the 24-hr Canada Wide Standard level is considered as an absolute value * Wind Direction is the predominate direction for the Month
5 Continuous Monitoring Ambient Air Compliance Network Crescent Heights Station General Station Issues Missing data resulting from problems with communications to the central data archive amounted to less than 90% uptime. As data can now be viewed by the technicians on a daily basis, data retrieval problems can be identified and addressed immediately. Alarms will be established to alert the on call personnel if this happens in the future. Parameter Make Model Units Notes Ozone Teledyne - API 400E ppb - no operational problems observed Nitrogen Dioxide Teledyne - API 200E ppb - no operational problems observed Total Hydrocarbons Bendix 400A ppm - no operational problems observed PM 2.5 R&P TEOM 1400ab ug/m3 - no operational problems observed Wind Speed Met One 010C KPH - no operational problems observed Wind Direction Met One 020C Deg - no operational problems observed Ambient Temperature Met One 083D DegC - no operational problems observed Relative Humidity Met One 083D % - no operational problems observed Solar Radiation Met One W/m2 - no operational problems observed Data Acquisition System Titan Logix AP1000 N/A some communications problems and a computer virus resulted in data loss from March 1 to March 7. See the attached contravention letter for more information (reference #147009)
6 Station: Crescent Heights Station Owner: Palliser Airshed Society Parameter : Ozone (O 3 ) Guideline Limit: Alberta Environment: 1-hr ppm 24-hr na ppm 1-hr 82 ppb 24-hr na ppb Sampling Dates: March 1, 2004 to April 1, 2004 Summary Status Characters Number of 1-hr Exceedances: 0 C Calibration A AIC - Zero / Span Check Number of 24-hr Exceedances: 0 S Instrument out of Service R Alarm Maximum 1-hr Average: 57 ppb 28-Mar 15:00 16:00 * < 75% Data X Filter Exchange Maximum 24-hr Average: 44 ppb 19-Mar N Excessive Instrument Drift M Equipment Maintenance F DACS Off-Line E Exceedance AIC Time: 25 hrs Operational Time: 558 hrs Calibration Time: 2 hrs AMD Operational Uptime: 78.6% Percentile Average Geomean ppb - ppb Day Mountain Standard Time Hour Start Hour End 0:00 1:00 1:00 2:00 2:00 3:00 3:00 4:00 4:00 5:00 5:00 6:00 6:00 7:00 7:00 8:00 8:00 9:00 9:00 10:00 10:00 11:00 11:00 12:00 12:00 13:00 13:00 14:00 14:00 15:00 15:00 16:00 16:00 17:00 17:00 18:00 18:00 19:00 19:00 20:00 20:00 21:00 21:00 22:00 22:00 23:00 23:00 0:00 24-hour Average Daily Maximum 1-Mar-04 F F F F F F F F F F F F F F F F F F F F F F F F * Mar-04 F F F F F F F F F F F F F F F F F F F F F F F F * Mar-04 F F F F F F F F F F F F F F F F F F F F F F F F * Mar-04 F F F F F F F F F F F F F F F F F F F F F F F F * Mar-04 F F F F F F F F F F F F F F F F F F F F F F F F * Mar-04 F F F F F F F F F F F F F F F F F F F F F F F F * Mar-04 F F F F F F F F F F F F F F A * Mar A Mar C C Mar A Mar A Mar A Mar A Mar A Mar A Mar A Mar A Mar A Mar A Mar A Mar A Mar A Mar A Mar A Mar A M Mar A Mar A Mar A Mar-04 A A Mar A Mar A Hourly Avg * * * * * Hourly Max
7 April 30, 2004 AENV Guideline 82 ppb Ozone (O3) Concentration in ppb 3/1/2004 3/2/2004 3/3/2004 3/4/2004 3/5/2004 3/6/2004 3/7/2004 3/9/2004 3/10/2004 3/11/2004 3/12/2004 3/13/2004 3/14/2004 3/15/2004 3/16/2004 3/17/2004 3/18/2004 3/19/2004 3/20/2004 3/21/2004 3/22/2004 3/23/2004 3/24/2004 3/25/2004 3/26/2004 3/8/2004 3/27/2004 3/28/2004 3/29/2004 3/30/2004 3/31/2004 4/1/2004 Figure 1. PAS Crescent Heights O3 Monthly Trend
8 Station: Crescent Heights Station Owner: Palliser Airshed Society Parameter : Ozone (O 3 ) 8-hr Running Average Guideline Limit: Canada Wide Standard 8-hr ppm 8-hr 65 ppb Sampling Dates: March 1, 2004 to April 1, 2004 Summary Status Characters Number of 8-hr Exceedances: 0 C Calibration A AIC - Zero / Span Check S Instrument out of Service R Alarm Maximum 8-hr Average: 53.0 ppb 28-Mar 18:00 19:00 * < 75% Data X Filter Exchange N Excessive Instrument Drift M Equipment Maintenance F DACS Off-Line E Exceedance Percentile Average Geomean ppb - ppb Day Mountain Standard Time Hour Start Hour End 0:00 1:00 1:00 2:00 2:00 3:00 3:00 4:00 4:00 5:00 5:00 6:00 6:00 7:00 7:00 8:00 8:00 9:00 9:00 10:00 10:00 11:00 11:00 12:00 12:00 13:00 13:00 14:00 14:00 15:00 15:00 16:00 16:00 17:00 17:00 18:00 18:00 19:00 19:00 20:00 20:00 21:00 21:00 22:00 22:00 23:00 23:00 0:00 24-hour Average Daily Maximum 1-Mar-04 F F F F F F F F F F F F F F F F F F F F F F F F * Mar-04 F F F F F F F F F F F F F F F F F F F F F F F F * Mar-04 F F F F F F F F F F F F F F F F F F F F F F F F * Mar-04 F F F F F F F F F F F F F F F F F F F F F F F F * Mar-04 F F F F F F F F F F F F F F F F F F F F F F F F * Mar-04 F F F F F F F F F F F F F F F F F F F F F F F F * Mar-04 F F F F F F F F F F F F F F * Mar Mar Mar Mar Mar Mar Mar Mar Mar Mar Mar Mar Mar Mar Mar Mar Mar Mar Mar Mar Mar Mar Mar Mar Hourly Avg Hourly Max
9 Station: Crescent Heights Station Owner: Palliser Airshed Society Parameter : Nitrogen Oxide (NO) Guideline Limit: Alberta Environment: 1-hr na ppm 24-hr na ppm 1-hr na ppb 24-hr na ppb Sampling Dates: March 1, 2004 to April 1, 2004 Summary Status Characters Number of 1-hr Exceedances: 0 C Calibration A AIC - Zero / Span Check Number of 24-hr Exceedances: 0 S Instrument out of Service R Alarm Maximum 1-hr Average: 127 ppb 28-Mar 23:00 0:00 * < 75% Data X Filter Exchange Maximum 24-hr Average: 11 ppb 11-Mar N Excessive Instrument Drift M Equipment Maintenance F DACS Off-Line E Exceedance AIC Time: 25 hrs Operational Time: 554 hrs Calibration Time: 6 hrs AMD Operational Uptime: 78.6% Percentile Average Geomean ppb - ppb Day Mountain Standard Time Hour Start Hour End 0:00 1:00 1:00 2:00 2:00 3:00 3:00 4:00 4:00 5:00 5:00 6:00 6:00 7:00 7:00 8:00 8:00 9:00 9:00 10:00 10:00 11:00 11:00 12:00 12:00 13:00 13:00 14:00 14:00 15:00 15:00 16:00 16:00 17:00 17:00 18:00 18:00 19:00 19:00 20:00 20:00 21:00 21:00 22:00 22:00 23:00 23:00 0:00 24-hour Average Daily Maximum 1-Mar-04 F F F F F F F F F F F F F F F F F F F F F F F F * Mar-04 F F F F F F F F F F F F F F F F F F F F F F F F * Mar-04 F F F F F F F F F F F F F F F F F F F F F F F F * Mar-04 F F F F F F F F F F F F F F F F F F F F F F F F * Mar-04 F F F F F F F F F F F F F F F F F F F F F F F F * Mar-04 F F F F F F F F F F F F F F F F F F F F F F F F * Mar-04 F F F F F F F F F F F F F F A * Mar A Mar C C C C C C Mar A Mar A Mar A Mar A Mar A Mar A Mar A Mar A Mar A Mar A Mar A Mar A Mar A Mar A Mar A Mar A M Mar A Mar A Mar-04 0 A Mar-04 A A Mar A Mar A Hourly Avg * * * * * * * * * Hourly Max
10 Station: Crescent Heights Station Owner: Palliser Airshed Society Parameter : Oxides of Nitrogen (NO x ) Guideline Limit: Alberta Environment: 1-hr na ppm 24-hr na ppm 1-hr na ppb 24-hr na ppb Sampling Dates: March 1, 2004 to April 1, 2004 Summary Status Characters Number of 1-hr Exceedances: 0 C Calibration A AIC - Zero / Span Check Number of 24-hr Exceedances: 0 S Instrument out of Service R Alarm Maximum 1-hr Average: 174 ppb 28-Mar 23:00 0:00 * < 75% Data X Filter Exchange Maximum 24-hr Average: 28 ppb 11-Mar N Excessive Instrument Drift M Equipment Maintenance F DACS Off-Line E Exceedance AIC Time: 25 hrs Operational Time: 554 hrs Calibration Time: 6 hrs AMD Operational Uptime: 78.6% Percentile Average Geomean ppb - ppb Day Mountain Standard Time Hour Start Hour End 0:00 1:00 1:00 2:00 2:00 3:00 3:00 4:00 4:00 5:00 5:00 6:00 6:00 7:00 7:00 8:00 8:00 9:00 9:00 10:00 10:00 11:00 11:00 12:00 12:00 13:00 13:00 14:00 14:00 15:00 15:00 16:00 16:00 17:00 17:00 18:00 18:00 19:00 19:00 20:00 20:00 21:00 21:00 22:00 22:00 23:00 23:00 0:00 24-hour Average Daily Maximum 1-Mar-04 F F F F F F F F F F F F F F F F F F F F F F F F * Mar-04 F F F F F F F F F F F F F F F F F F F F F F F F * Mar-04 F F F F F F F F F F F F F F F F F F F F F F F F * Mar-04 F F F F F F F F F F F F F F F F F F F F F F F F * Mar-04 F F F F F F F F F F F F F F F F F F F F F F F F * Mar-04 F F F F F F F F F F F F F F F F F F F F F F F F * Mar-04 F F F F F F F F F F F F F F A * Mar A Mar C C C C C C Mar A Mar A Mar A Mar A Mar A Mar A Mar A Mar A Mar A Mar A Mar A Mar A Mar A Mar A Mar A Mar A M Mar A Mar A Mar-04 3 A Mar-04 A A Mar A Mar A Hourly Avg * * * * * * * * * Hourly Max
11 April 30, 2004 NO and NOX Concentration in ppb 3/1/2004 3/2/2004 3/3/2004 3/4/2004 3/5/2004 3/6/2004 3/7/2004 3/8/2004 3/9/2004 3/10/2004 3/11/2004 3/12/2004 3/13/2004 3/14/2004 3/15/2004 3/16/2004 3/17/2004 3/18/2004 3/19/2004 3/20/2004 3/21/2004 3/22/2004 3/23/2004 3/24/2004 3/25/2004 3/26/2004 3/27/2004 3/28/2004 3/29/2004 3/30/2004 3/31/2004 4/1/2004 NO NOx Figure 2. PAS Crescent Heights NO and NOX Monthly Trends
12 Station: Crescent Heights Station Owner: Palliser Airshed Society Parameter : Nitrogen Dioxide (NO 2 ) Guideline Limit: Alberta Environment: 1-hr ppm 24-hr ppm 1-hr 212 ppb 24-hr 106 ppb Sampling Dates: March 1, 2004 to April 1, 2004 Summary Status Characters Number of 1-hr Exceedances: 0 C Calibration A AIC - Zero / Span Check Number of 24-hr Exceedances: 0 S Instrument out of Service R Alarm Maximum 1-hr Average: 47 ppb 28-Mar 23:00 0:00 * < 75% Data X Filter Exchange Maximum 24-hr Average: 17 ppb 11-Mar N Excessive Instrument Drift M Equipment Maintenance F DACS Off-Line E Exceedance AIC Time: 25 hrs Operational Time: 554 hrs Calibration Time: 6 hrs AMD Operational Uptime: 78.6% Percentile Average Geomean ppb - ppb Day Mountain Standard Time Hour Start Hour End 0:00 1:00 1:00 2:00 2:00 3:00 3:00 4:00 4:00 5:00 5:00 6:00 6:00 7:00 7:00 8:00 8:00 9:00 9:00 10:00 10:00 11:00 11:00 12:00 12:00 13:00 13:00 14:00 14:00 15:00 15:00 16:00 16:00 17:00 17:00 18:00 18:00 19:00 19:00 20:00 20:00 21:00 21:00 22:00 22:00 23:00 23:00 0:00 24-hour Average Daily Maximum 1-Mar-04 F F F F F F F F F F F F F F F F F F F F F F F F * Mar-04 F F F F F F F F F F F F F F F F F F F F F F F F * Mar-04 F F F F F F F F F F F F F F F F F F F F F F F F * Mar-04 F F F F F F F F F F F F F F F F F F F F F F F F * Mar-04 F F F F F F F F F F F F F F F F F F F F F F F F * Mar-04 F F F F F F F F F F F F F F F F F F F F F F F F * Mar-04 F F F F F F F F F F F F F F A * Mar A Mar C C C C C C Mar A Mar A Mar A Mar A Mar A Mar A Mar A Mar A Mar A Mar A Mar A Mar A Mar A Mar A Mar A Mar A M Mar A Mar A Mar-04 3 A Mar-04 A A Mar A Mar A Hourly Avg * * * * * * * * * Hourly Max
13 April 30, 2004 AENV Guideline 212 ppb Nitrogen Dioxide (NO2) Concentration in ppb 3/1/2004 3/3/2004 3/4/2004 3/5/2004 3/6/2004 3/7/2004 3/8/2004 3/9/2004 3/10/2004 3/11/2004 3/12/2004 3/13/2004 3/14/2004 3/15/2004 3/16/2004 3/17/2004 3/18/2004 3/19/2004 3/20/2004 3/21/2004 3/22/2004 3/23/2004 3/24/2004 3/25/2004 3/26/2004 3/27/2004 3/2/2004 3/28/2004 3/29/2004 3/30/2004 3/31/2004 4/1/2004 Figure 3. PAS Crescent Heights NO2 Monthly Trends
14 Station: Crescent Heights Station Owner: Palliser Airshed Society Parameter : Total Hydrocarbons (THC) Guideline Limit: Alberta Environment: 1-hr na ppm 24-hr na ppm 1-hr na ppb 24-hr na ppb Sampling Dates: March 1, 2004 to April 1, 2004 Summary Status Characters Number of 1-hr Exceedances: 0 C Calibration A AIC - Zero / Span Check Number of 24-hr Exceedances: 0 S Instrument out of Service R Alarm Maximum 1-hr Average: 3.4 ppm 29-Mar 2:00 3:00 * < 75% Data X Filter Exchange Maximum 24-hr Average: 2.4 ppm 23-Mar N Excessive Instrument Drift M Equipment Maintenance F DACS Off-Line E Exceedance AIC Time: 25 hrs Operational Time: 558 hrs Calibration Time: 2 hrs AMD Operational Uptime: 78.6% Percentile Average Geomean ppm - ppm Day Mountain Standard Time Hour Start Hour End 0:00 1:00 1:00 2:00 2:00 3:00 3:00 4:00 4:00 5:00 5:00 6:00 6:00 7:00 7:00 8:00 8:00 9:00 9:00 10:00 10:00 11:00 11:00 12:00 12:00 13:00 13:00 14:00 14:00 15:00 15:00 16:00 16:00 17:00 17:00 18:00 18:00 19:00 19:00 20:00 20:00 21:00 21:00 22:00 22:00 23:00 23:00 0:00 24-hour Average Daily Maximum 1-Mar-04 F F F F F F F F F F F F F F F F F F F F F F F F * Mar-04 F F F F F F F F F F F F F F F F F F F F F F F F * Mar-04 F F F F F F F F F F F F F F F F F F F F F F F F * Mar-04 F F F F F F F F F F F F F F F F F F F F F F F F * Mar-04 F F F F F F F F F F F F F F F F F F F F F F F F * Mar-04 F F F F F F F F F F F F F F F F F F F F F F F F * Mar-04 F F F F F F F F F F F F F F A * Mar A Mar C C Mar A Mar A Mar A Mar A Mar A Mar A Mar A Mar A Mar A Mar A Mar A Mar A Mar A Mar A Mar A Mar A M Mar A Mar A Mar A Mar-04 A A Mar A Mar A Hourly Avg * * * * * Hourly Max
15 April 30, 2004 Total Hydrocarbons (THC) Concentration in ppb 3/1/2004 3/2/2004 3/3/2004 3/4/2004 3/5/2004 3/6/2004 3/7/2004 3/8/2004 3/9/2004 3/10/2004 3/11/2004 3/12/2004 3/13/2004 3/14/2004 3/15/2004 3/16/2004 3/17/2004 3/18/2004 3/19/2004 3/20/2004 3/21/2004 3/22/2004 3/23/2004 3/24/2004 3/25/2004 3/26/2004 3/27/2004 3/28/2004 3/29/2004 3/30/2004 3/31/2004 4/1/2004 Figure 4. PAS Crescent Heights THC Monthly Trends
16 Station: Crescent Heights Station Owner: Palliser Airshed Society Parameter : Particulate Matter (PM 2.5 ) Guideline Limit: Canada Wide Standard 1-hr - µg/m 3 24-hr 30 µg/m 3 (considered as an absolute value) Sampling Dates: March 1, 2004 to April 1, 2004 Summary Status Characters Number of 1-hr Exceedances: 0 C Calibration A AIC - Zero / Span Check Number of 24-hr Exceedances: 0 S Instrument out of Service R Alarm Maximum 1-hr Average: 11.9 µg/m 3 28-Mar 23:00 0:00 * < 75% Data X Filter Exchange Maximum 24-hr Average: 3.3 µg/m 3 31-Mar N Excessive Instrument Drift M Equipment Maintenance F DACS Off-Line E Exceedance AIC Time: 0 hrs Operational Time: 498 hrs Calibration Time: 4 hrs AMD Operational Uptime: 67.5% Percentile Average Geomean µg/m 3 - µg/m 3 Day Mountain Standard Time Hour Start Hour End 0:00 1:00 1:00 2:00 2:00 3:00 3:00 4:00 4:00 5:00 5:00 6:00 6:00 7:00 7:00 8:00 8:00 9:00 9:00 10:00 10:00 11:00 11:00 12:00 12:00 13:00 13:00 14:00 14:00 15:00 15:00 16:00 16:00 17:00 17:00 18:00 18:00 19:00 19:00 20:00 20:00 21:00 21:00 22:00 22:00 23:00 23:00 0:00 24-hour Average Daily Maximum 1-Mar-04 F F F F F F F F F F F F F F F F F F F F F F F F * Mar-04 F F F F F F F F F F F F F F F F F F F F F F F F * Mar-04 F F F F F F F F F F F F F F F F F F F F F F F F * Mar-04 F F F F F F F F F F F F F F F F F F F F F F F F * Mar-04 F F F F F F F F F F F F F F F F F F F F F F F F * Mar-04 F F F F F F F F F F F F F F F F F F F F F F F F * Mar-04 F F F F F F F F F F F F F F * Mar N N N 0 N N Mar-04 N N N N N N N N 0 C C C C 0 0 N 0 N 0 * Mar N N Mar-04 0 N 0 N Mar-04 0 N N N N N Mar N Mar N 0 0 N N Mar N N N 0 0 N Mar N N N N 1 N Mar N 0 N Mar N N N N N N N * Mar N 0 N Mar Mar N N N 0 N Mar N N Mar Mar N N 0 0 N N N Mar M N Mar-04 N N N 0 N N N N N N N 0 N * Mar N N N N 0 0 N 0 N Mar N N 0 0 N 0 N Mar N Mar Mar N Hourly Avg * * * * * * * * * * * * * * * 0.7 * * * 1.2 * * Hourly Max
17 April 30, 2004 PM2.5 Mass Concentration in µg/m 3 3/1/2004 3/2/2004 3/3/2004 3/4/2004 3/5/2004 3/6/2004 3/7/2004 3/8/2004 3/9/2004 3/10/2004 3/11/2004 3/12/2004 3/13/2004 3/14/2004 3/15/2004 3/16/2004 3/17/2004 3/18/2004 3/19/2004 3/20/2004 3/21/2004 3/22/2004 3/23/2004 3/24/2004 3/25/2004 3/26/2004 3/27/2004 3/28/2004 3/29/2004 3/30/2004 3/31/2004 4/1/2004 Figure 5. PAS Crescent Heights PM2.5 Monthly Trends
18 Station: Crescent Heights Station Owner: Palliser Airshed Society Parameter : Relative Humidity (%) Guideline Limit: Sampling Dates: March 1, 2004 to April 1, 2004 Summary Status Characters Number of 1-hr Exceedances: 0 C Calibration A AIC - Zero / Span Check Number of 24-hr Exceedances: 0 S Instrument out of Service R Alarm Maximum 1-hr Average: 92.3 % 13-Mar 5:00 6:00 * < 75% Data X Filter Exchange Maximum 24-hr Average: 75.4 % 13-Mar N Excessive Instrument Drift M Equipment Maintenance F DACS Off-Line E Exceedance AIC Time: 0 hrs Operational Time: 577 hrs Calibration Time: 0 hrs AMD Operational Uptime: 77.6% Percentile Average Geomean % - % Day Mountain Standard Time Hour Start Hour End 0:00 1:00 1:00 2:00 2:00 3:00 3:00 4:00 4:00 5:00 5:00 6:00 6:00 7:00 7:00 8:00 8:00 9:00 9:00 10:00 10:00 11:00 11:00 12:00 12:00 13:00 13:00 14:00 14:00 15:00 15:00 16:00 16:00 17:00 17:00 18:00 18:00 19:00 19:00 20:00 20:00 21:00 21:00 22:00 22:00 23:00 23:00 0:00 24-hour Average Daily Maximum 1-Mar-04 F F F F F F F F F F F F F F F F F F F F F F F F * 0 2-Mar-04 F F F F F F F F F F F F F F F F F F F F F F F F * 0 3-Mar-04 F F F F F F F F F F F F F F F F F F F F F F F F * 0 4-Mar-04 F F F F F F F F F F F F F F F F F F F F F F F F * 0 5-Mar-04 F F F F F F F F F F F F F F F F F F F F F F F F * 0 6-Mar-04 F F F F F F F F F F F F F F F F F F F F F F F F * 0 7-Mar-04 F F F F F F F F F F F F F F * 58 8-Mar N Mar Mar Mar N N N Mar N N N Mar Mar Mar Mar Mar Mar Mar Mar Mar Mar Mar Mar Mar N M Mar Mar Mar Mar Mar Mar Hourly Avg 67 * * * 67 * 54 * Hourly Max
19 April 30, 2004 Relative Humidity in % 3/1/2004 3/2/2004 3/3/2004 3/4/2004 3/5/2004 3/6/2004 3/7/2004 3/8/2004 3/9/2004 3/10/2004 3/11/2004 3/12/2004 3/13/2004 3/14/2004 3/15/2004 3/16/2004 3/17/2004 3/18/2004 3/19/2004 3/20/2004 3/21/2004 3/22/2004 3/23/2004 3/24/2004 3/25/2004 3/26/2004 3/27/2004 3/28/2004 3/29/2004 3/30/2004 3/31/2004 4/1/2004 Figure 6. PAS Crescent Heights Relative Humidity Monthly Trends
20 Station: Crescent Heights Station Owner: Palliser Airshed Society Parameter : Temperature ( o C) Guideline Limit: Sampling Dates: March 1, 2004 to April 1, 2004 Summary Status Characters Number of 1-hr Exceedances: 0 C Calibration A AIC - Zero / Span Check Number of 24-hr Exceedances: 0 S Instrument out of Service R Alarm Maximum 1-hr Average: 26.0 o C 30-Mar 16:00 17:00 * < 75% Data X Filter Exchange Maximum 24-hr Average: 18.0 o C 30-Mar N Excessive Instrument Drift M Equipment Maintenance F DACS Off-Line E Exceedance AIC Time: 0 hrs Operational Time: 577 hrs Calibration Time: 0 hrs AMD Operational Uptime: 77.6% Percentile Average Geomean o C - o C Day Mountain Standard Time Hour Start Hour End 0:00 1:00 1:00 2:00 2:00 3:00 3:00 4:00 4:00 5:00 5:00 6:00 6:00 7:00 7:00 8:00 8:00 9:00 9:00 10:00 10:00 11:00 11:00 12:00 12:00 13:00 13:00 14:00 14:00 15:00 15:00 16:00 16:00 17:00 17:00 18:00 18:00 19:00 19:00 20:00 20:00 21:00 21:00 22:00 22:00 23:00 23:00 0:00 24-hour Average Daily Maximum 1-Mar-04 F F F F F F F F F F F F F F F F F F F F F F F F * Mar-04 F F F F F F F F F F F F F F F F F F F F F F F F * Mar-04 F F F F F F F F F F F F F F F F F F F F F F F F * Mar-04 F F F F F F F F F F F F F F F F F F F F F F F F * Mar-04 F F F F F F F F F F F F F F F F F F F F F F F F * Mar-04 F F F F F F F F F F F F F F F F F F F F F F F F * Mar-04 F F F F F F F F F F F F F F * Mar N Mar Mar Mar N N N Mar-04-1 N N N Mar Mar Mar Mar Mar Mar Mar Mar Mar Mar Mar Mar Mar N M Mar Mar Mar Mar Mar Mar Hourly Avg 2.8 * * * 2.6 * 6.5 * Hourly Max
21 April 30, 2004 Temperature in o C 3/1/2004 3/2/2004 3/3/2004 3/4/2004 3/5/2004 3/6/2004 3/7/2004 3/8/2004 3/9/2004 3/10/2004 3/11/2004 3/12/2004 3/13/2004 3/14/2004 3/15/2004 3/16/2004 3/17/2004 3/18/2004 3/19/2004 3/20/2004 3/21/2004 3/22/2004 3/23/2004 3/24/2004 3/25/2004 3/26/2004 3/27/2004 3/28/2004 3/29/2004 3/30/2004 3/31/2004 4/1/2004 Figure 7. PAS Crescent Heights Temperature Monthly Trends
22 Station: Crescent Heights Station Owner: Palliser Airshed Society Parameter : Solar Radiation (W/m 2 ) Guideline Limit: Sampling Dates: March 1, 2004 to April 1, 2004 Summary Status Characters Number of 1-hr Exceedances: 0 C Calibration A AIC - Zero / Span Check Number of 24-hr Exceedances: 0 S Instrument out of Service R Alarm Maximum 1-hr Average: W/m 2 30-Mar 12:00 13:00 * < 75% Data X Filter Exchange Maximum 24-hr Average: W/m 2 30-Mar N Excessive Instrument Drift M Equipment Maintenance F DACS Off-Line E Exceedance AIC Time: 0 hrs Operational Time: 585 hrs Calibration Time: 0 hrs AMD Operational Uptime: 78.6% Percentile Average Geomean W/m 2 - W/m 2 Day Mountain Standard Time Hour Start Hour End 0:00 1:00 1:00 2:00 2:00 3:00 3:00 4:00 4:00 5:00 5:00 6:00 6:00 7:00 7:00 8:00 8:00 9:00 9:00 10:00 10:00 11:00 11:00 12:00 12:00 13:00 13:00 14:00 14:00 15:00 15:00 16:00 16:00 17:00 17:00 18:00 18:00 19:00 19:00 20:00 20:00 21:00 21:00 22:00 22:00 23:00 23:00 0:00 24-hour Average Daily Maximum 1-Mar-04 F F F F F F F F F F F F F F F F F F F F F F F F * 0 2-Mar-04 F F F F F F F F F F F F F F F F F F F F F F F F * 0 3-Mar-04 F F F F F F F F F F F F F F F F F F F F F F F F * 0 4-Mar-04 F F F F F F F F F F F F F F F F F F F F F F F F * 0 5-Mar-04 F F F F F F F F F F F F F F F F F F F F F F F F * 0 6-Mar-04 F F F F F F F F F F F F F F F F F F F F F F F F * 0 7-Mar-04 F F F F F F F F F F F F F F * Mar Mar Mar Mar Mar Mar Mar Mar Mar Mar Mar Mar Mar Mar Mar Mar Mar Mar M Mar Mar Mar Mar Mar Mar Hourly Avg Hourly Max
23 April 30, 2004 Solar Radiation in W/m 2 3/1/2004 3/2/2004 3/3/2004 3/4/2004 3/5/2004 3/6/2004 3/7/2004 3/8/2004 3/9/2004 3/10/2004 3/11/2004 3/12/2004 3/13/2004 3/14/2004 3/15/2004 3/16/2004 3/17/2004 3/18/2004 3/19/2004 3/20/2004 3/21/2004 3/22/2004 3/23/2004 3/24/2004 3/25/2004 3/26/2004 3/27/2004 3/28/2004 3/29/2004 3/30/2004 3/31/2004 4/1/2004 Figure 8. PAS Crescent Heights Solar Radiation Monthly Trends
24 Station: Crescent Heights Station Owner: Palliser Airshed Society Parameter : Wind Speed (km/hr) Guideline Limit: Sampling Dates: March 1, 2004 to April 1, 2004 Summary Status Characters Number of 1-hr Exceedances: 0 C Calibration A AIC - Zero / Span Check Number of 24-hr Exceedances: 0 S Instrument out of Service R Alarm Maximum 1-hr Average: 36.8 km/hr 25-Mar 0:00 1:00 * < 75% Data X Filter Exchange Maximum 24-hr Average: 24.6 km/hr 9-Mar N Excessive Instrument Drift M Equipment Maintenance F DACS Off-Line E Exceedance Calm Time: 0 hrs 0% calms Operational Time: 585 hrs Calibration Time: 0 hrs AMD Operational Uptime: 78.6% Percentile AverageS AverageV km/hr 5.9 km/hr Day Mountain Standard Time 24-hr 24-hr Daily Hour Start 0:00 1:00 2:00 3:00 4:00 5:00 6:00 7:00 8:00 9:00 10:00 11:00 12:00 13:00 14:00 15:00 16:00 17:00 18:00 19:00 20:00 21:00 22:00 23:00 Scalar Vector Max Hour End 1:00 2:00 3:00 4:00 5:00 6:00 7:00 8:00 9:00 10:00 11:00 12:00 13:00 14:00 15:00 16:00 17:00 18:00 19:00 20:00 21:00 22:00 23:00 0:00 Average Average 1-Mar-04 F F F F F F F F F F F F F F F F F F F F F F F F * * Mar-04 F F F F F F F F F F F F F F F F F F F F F F F F * * Mar-04 F F F F F F F F F F F F F F F F F F F F F F F F * * Mar-04 F F F F F F F F F F F F F F F F F F F F F F F F * * Mar-04 F F F F F F F F F F F F F F F F F F F F F F F F * * Mar-04 F F F F F F F F F F F F F F F F F F F F F F F F * * Mar-04 F F F F F F F F F F F F F F * * Mar Mar Mar Mar Mar Mar Mar Mar Mar Mar Mar Mar Mar Mar Mar Mar Mar Mar M Mar Mar Mar Mar Mar Mar hr Scalar hr Vector Hourly Max
25 Station: Crescent Heights Station Owner: Palliser Airshed Society Parameter : Wind Direction (degrees) Guideline Limit: Sampling Dates: March 1, 2004 to April 1, 2004 Summary Status Characters Number of 1-hr Exceedances: 0 C Calibration A AIC - Zero / Span Check Number of 24-hr Exceedances: 0 S Instrument out of Service R Alarm Maximum 1-hr Average: * < 75% Data X Filter Exchange Maximum 24-hr Average: N Excessive Instrument Drift M Equipment Maintenance F DACS Off-Line E Exceedance Calm Time: 0 hrs 0% calms Operational Time: 585 hrs Calibration Time: 0 hrs AMD Operational Uptime: 78.6% Percentile Average Geomean deg - deg Day Mountain Standard Time Hour Start Hour End 0:00 1:00 1:00 2:00 2:00 3:00 3:00 4:00 4:00 5:00 5:00 6:00 6:00 7:00 7:00 8:00 8:00 9:00 9:00 10:00 10:00 11:00 11:00 12:00 12:00 13:00 13:00 14:00 14:00 15:00 15:00 16:00 16:00 17:00 17:00 18:00 18:00 19:00 19:00 20:00 20:00 21:00 21:00 22:00 22:00 23:00 23:00 0:00 24-hour Average 1-Mar-04 F F F F F F F F F F F F F F F F F F F F F F F F 2-Mar-04 F F F F F F F F F F F F F F F F F F F F F F F F 3-Mar-04 F F F F F F F F F F F F F F F F F F F F F F F F 4-Mar-04 F F F F F F F F F F F F F F F F F F F F F F F F 5-Mar-04 F F F F F F F F F F F F F F F F F F F F F F F F 6-Mar-04 F F F F F F F F F F F F F F F F F F F F F F F F 7-Mar-04 F F F F F F F F F F F F F F Mar Mar Mar Mar Mar Mar Mar Mar Mar Mar Mar Mar Mar Mar Mar Mar Mar Mar M Mar Mar Mar Mar Mar Mar Hourly Avg
26 Station: Crescent Heights Station Owner: Palliser Airshed Society Parameter : Standard Deviation of Wind Direction (degrees) Determined by the Yamartino 15-min interval calculation Sampling Dates: March 1, 2004 to April 1, 2004 Summary Status Characters Number of 1-hr Exceedances: 0 C Calibration A AIC - Zero / Span Check Number of 24-hr Exceedances: 0 S Instrument out of Service R Alarm Maximum 1-hr Average: * < 75% Data X Filter Exchange Maximum 24-hr Average: N Excessive Instrument Drift M Equipment Maintenance F DACS Off-Line E Exceedance Calm Time: 0 hrs 0% calms Operational Time: 586 hrs Calibration Time: 0 hrs AMD Operational Uptime: 78.8% Percentile Average Geomean deg - deg Day Mountain Standard Time Hour Start Hour End 0:00 1:00 1:00 2:00 2:00 3:00 3:00 4:00 4:00 5:00 5:00 6:00 6:00 7:00 7:00 8:00 8:00 9:00 9:00 10:00 10:00 11:00 11:00 12:00 12:00 13:00 13:00 14:00 14:00 15:00 15:00 16:00 16:00 17:00 17:00 18:00 18:00 19:00 19:00 20:00 20:00 21:00 21:00 22:00 22:00 23:00 23:00 0:00 Daily Maximum 1-Mar Mar Mar Mar Mar Mar Mar Mar Mar Mar Mar Mar Mar Mar Mar Mar Mar Mar Mar Mar Mar Mar Mar Mar Mar Mar Mar Mar Mar Mar Mar Hourly Max
27 Wind Rose for the 1-hr Average Meterological Data at the Crescent Heights Site for March 2004 WNW W NW NNW N 18% 16% 14% 12% 10% 8% 6% 4% 2% 0% NNE NE ENE E WSW ESE Wind Speed (km/hr) SW SE > SSW S SSE Figure 9. PAS Crescent Heights Monthly Wind Rose
28 Monthly Summary Concentration Roses March 2004 O 3 Concentration Rose NO 2 Concentration Rose PM 2.5 Concentration Rose
29 Concentration Rose for the 1-hr O 3 Average Concentration Occurrences at the Crescent Heights Site for March 2004 NNW 20% N NNE NW 15% NE WNW 10% 5% ENE W 0% E Concentration (ppb) WSW ESE > SW SSW S SSE SE Frequency Distribution of O 3 in ppb Range Frequency (hrs) 0 < to to to to > 82 0 Total Non-Zero Values 558
30 Concentration Rose for the 1-hr NO 2 Average Concentration Occurrences at the Crescent Heights Site for March 2004 NNW 20% N NNE NW 15% NE WNW 10% 5% ENE W 0% E Concentration (ppb) >212 WSW ESE SW SE SSW S SSE Frequency Distribution of NO 2 in ppb Range Frequency (hrs) 0 < to to to to > Total Non-Zero Values 554
31 Concentration Rose for the 1-hr PM 2.5 Average Concentration Occurrences at the Crescent Heights Site for March 2004 WNW W NW NNW N 16% 14% 12% 10% 8% 6% 4% 2% 0% NNE NE ENE E Concentration (µg/m 3 ) WSW ESE > SW SSW SSE SE S Frequency Distribution of PM 2.5 in µg/m 3 Range Frequency (hrs) 0 < to to to to 50 0 > 50 0 Total Non-Zero Values 498
32 Passive Monitoring Ambient Air Compliance Network April 30, 2004 Pallisar Airshed Society - PAS Passive Stations for March 2004 Station Station Location Number SO 2 O 3 NO 2 Name ppb ppb ppb Easting Northing Elevtion Duplicates 1a Hospital b Hospital Ball Park Monitoring Station Redcliff Southridge Christian School Park Stats: Mean Standard Deviation Minimum Southridge Maximum Monitoring Station Minimum Ball Park Maximum Monitoring Station Minimum Redcliff Maximum Hospital Comparison between Continuous and Passive monitoring (passive #3) SO 2 O 3 NO 2 PAS Station PAS Passive
33
34
Example Airshed. Sample January 2019 Monthly Ambient Air Quality Monitoring Report
 Example Airshed Sample January 219 Monthly Ambient Air Quality Monitoring Report 28 February 219 DISCLAIMER: This sample monthly report is provided as guidance only. The structure, look and layout of monthly
REPORT N O AMBIENT AIR QUALITY MONTHLY REPORT MAY 2017
 REPORT N O 171-00556-00 AMBIENT AIR QUALITY MONTHLY REPORT MAY 2017 MAY 2017 AMBIENT AIR QUALITY MONTHLY REPORT MAY 2017 Lafarge Canada Inc. Project no: 171-00556-00 Date: May 2017 WSP Canada Inc. 150-12791
REPORT N O AMBIENT AIR QUALITY MONTHLY REPORT JUNE 2017
 REPORT N O 171-00556-00 AMBIENT AIR QUALITY MONTHLY REPORT JUNE 2017 JUNE 2017 AMBIENT AIR QUALITY MONTHLY REPORT JUNE 2017 Lafarge Canada Inc. Project no: 171-00556-00 Date: June 2017 WSP Canada Inc.
AMBIENT AIR QUALITY MONTHLY REPORT
 REPORT N O 171-00556-00 AMBIENT AIR QUALITY MONTHLY REPORT DECEMBER 2017 DECEMBER 2017 AMBIENT AIR QUALITY MONTHLY REPORT DECEMBER 2017 Lafarge Canada Inc. Project no: 171-00556-00 Date: December 2017
1 st Quarter Summary of Meteorological and Ambient Air Quality Data Kennecott Utah Copper Monitoring Stations. Prepared for:
 1 st Quarter 2018 Summary of Meteorological and Ambient Air Quality Data Kennecott Utah Copper Monitoring Stations Prepared for: Prepared by: Mr. Bryce C. Bird Director Division of Air Quality 195 North
1st Quarter Summary of Meteorological and Ambient Air Quality Data Kennecott Utah Copper Monitoring Stations
 1st Quarter 2014 Summary of Meteorological and Ambient Air Quality Data Kennecott Utah Copper Monitoring Stations Steven A. Root Digitally signed by Steven A. Root DN: cn=steven A. Root, o=weatherbank,
3 rd Quarter Summary of Meteorological and Ambient Air Quality Data Kennecott Utah Copper Monitoring Stations. Prepared for:
 3 rd Quarter 2018 Summary of Meteorological and Ambient Air Quality Data Kennecott Utah Copper Monitoring Stations Prepared for: Prepared by: Mr. Bryce C. Bird Director Division of Air Quality 195 North
4th Quarter Summary of Meteorological and Ambient Air Quality Data Kennecott Utah Copper Monitoring Stations
 4th Quarter 2016 Summary of Meteorological and Ambient Air Quality Data Kennecott Utah Copper Monitoring Stations Steven Root Digitally signed by Steven Root DN: cn=steven Root, o=weatherbank, Inc., ou,
Georgia Pacific Crossett Operations Hydrogen Sulfide and Meteorological Monitoring Program
 Results you can rely on Georgia Pacific Crossett Operations Hydrogen Sulfide and Meteorological Monitoring Program 6-Month Report for October 1, 2014 through March 31, 2015 TRC Project Number: 222437.0000.0000
4th Quarter Summary of Meteorological and Ambient Air Quality Data Kennecott Utah Copper Monitoring Stations
 4th Quarter 2013 Summary of Meteorological and Ambient Air Quality Data Kennecott Utah Copper Monitoring Stations Steven A. Root Digitally signed by Steven A. Root DN: cn=steven A. Root, o=weatherbank,
Industrial, Commercial and Institutional Boilers at Area Source Facilities (Boiler GACT) Final Reconsidered Rule Requirements Summary
 Final Reconsidered Rule Requirements Summary") Industrial, Commercial and Institutional Boilers at Area Facilities (Boiler GACT) Final Reconsidered Rule Requirements Summary Federal Regulation NESHAP, 40 CFR 63, Subpart JJJJJJ Proposed rule published
Industrial, Commercial and Institutional Boilers at Area Facilities (Boiler GACT) Final Reconsidered Rule Requirements Summary Federal Regulation NESHAP, 40 CFR 63, Subpart JJJJJJ Proposed rule published
The Premcor Refining Group, Inc. Delaware City Refinery 4550 Wrangle Hill Rd. EXHIBIT A Delaware City, DE 19706
 DRAFT Permit: APC-2004/0721-CONSTRUCTION (NSPS) Two Package Boilers The Premcor Refining Group, Inc. Delaware City Refinery 4550 Wrangle Hill Rd. EXHIBIT A Delaware City, DE 19706 ATTENTION: Andrew Kenner
Ambient PM 10 Monitoring Sechelt, B.C Update
 Ministry of Environment LOWER MAINLAND REGION Ambient PM 10 Monitoring Sechelt, B.C. 2004-2005 Update E N V I R O N M E N T A L Q U A L I T Y Library and Archives Canada Cataloguing in Publication Data
PATENTED TECHNOLOGY» PROVEN RESULTS» PAYBACK
 2328 Bellfort Ave. Houston, Texas 77051 Main 713-821-9600 Fax 713-821-9601 EFFECTS OF ENVIROFUELS DFC ON A LAND DRILLING RIG Oil and Gas Land Drilling Rig PUBLIC VERSION Revision Date February 18, 2008
Village Green in Philadelphia
 Village Green in Philadelphia Dennis Sosna Hallie Weiss City of Philadelphia Department of Public Health Air Management Services 2015 MARAMA Monitoring Committee Meeting December 17, 2015 Towson, MD ABSTRACT
ENVIRONMENTAL & ENGINEERING SERVICES DEPARTMENT
 CITY OF LONDON ENVIRONMENTAL & ENGINEERING SERVICES DEPARTMENT WASTEWATER TREATMENT OPERATIONS VAUXHALL WASTEWATER TREATMENT PLANT 2013 ANNUAL REPORT FEBRUARY 2014 Vauxhall Wastewater Treatment Plant 2013
LOCAL CLIMATOLOGICAL DATA Monthly Summary April 2017
 Deg. Days Precip Ty Precip Wind Solar Hu- Adj. to Sea Level mid- ity Avg Res Res Peak 2 Minute 1 fog 2 hvy fog 3 thunder 4 ice plt 5 hail 6 glaze 7 duststm 8 smk, hz 9 blw snw 1 2 3 4A 4B 5 6 7 8 9 11
LOCAL CLIMATOLOGICAL DATA Monthly Summary April 2012
 Deg. Days Precip Ty Precip Wind Solar Hu- Adj. to Sea Level mid- ity Avg Res Res Peak Minute 1 fog 2 hvy fog 3 thunder 4 ice plt 5 hail 6 glaze 7 duststm 8 smk, hz 9 blw snw 1 2 3 4A 4B 5 6 7 8 9 11 12
LOCAL CLIMATOLOGICAL DATA Monthly Summary April 2015
 Deg. Days Precip Ty Precip Wind Solar Hu- Adj. to Sea Level mid- ity Avg Res Res Peak 2 Minute 1 fog 2 hvy fog 3 thunder 4 ice plt 5 hail 6 glaze 7 duststm 8 smk, hz 9 blw snw 1 2 3 4A 4B 5 6 7 8 9 11
RULE 4352 SOLID FUEL FIRED BOILERS, STEAM GENERATORS AND PROCESS HEATERS (Adopted September 14, 1994; Amended October 19, 1995; Amended May 18, 2006)
") RULE 4352 SOLID FUEL FIRED BOILERS, STEAM GENERATORS AND PROCESS HEATERS (Adopted September 14, 1994; Amended October 19, 1995; Amended May 18, 2006) 1.0 Purpose The purpose of this rule is to limit emissions
RULE 4352 SOLID FUEL FIRED BOILERS, STEAM GENERATORS AND PROCESS HEATERS (Adopted September 14, 1994; Amended October 19, 1995; Amended May 18, 2006) 1.0 Purpose The purpose of this rule is to limit emissions
AIR QUALITY PERMIT. Permit No S Effective Date May 26, 2015
 AIR QUALITY PERMIT Permit No. Effective Date May 26, 2015 In accordance with the provisions of the Georgia Air Quality Act, O.C.G.A. Section 12-9-1, et seq and the Rules, Chapter 391-3-1, adopted pursuant
PA RACT 2. Reasonably Available Control Technology. Presented by Suzanne Dibert
 PA RACT 2 Reasonably Available Control Technology Presented by Suzanne Dibert Affected Facilities Facilities with potential emissions that exceed 100 tons per year (tpy) for NOx (nitrogen oxide) and 50
Houston Regional Monitoring. Air Quality Update to RAQPAC
 Air Quality Update to RAQPAC September 27, 2017 Presented by: Steve Hansen Technical Advisory Committee s Purpose is a voluntary industry-funded technical resource dedicated to performing ambient air monitoring
AIR QUALITY PERMIT. Kennesaw State University - Marietta Campus
 AIR QUALITY PERMIT Permit No. Effective Date February 11, 2016 In accordance with the provisions of the Georgia Air Quality Act, O.C.G.A. Section 12-9-1, et seq and the Rules, Chapter 391-3-1, adopted
3.1 Air Pollution Control Officer (APCO): as defined in Rule 1020 (Definitions).
: as defined in Rule 1020 (Definitions).") RULE 4352 SOLID FUEL FIRED BOILERS, STEAM GENERATORS AND PROCESS HEATERS (Adopted September 14, 1994; Amended October 19, 1995; Amended May 18, 2006; Amended December 15, 2011) 1.0 Purpose The purpose
RULE 4352 SOLID FUEL FIRED BOILERS, STEAM GENERATORS AND PROCESS HEATERS (Adopted September 14, 1994; Amended October 19, 1995; Amended May 18, 2006; Amended December 15, 2011) 1.0 Purpose The purpose
Full Compliance Evaluation Report Off-Site Report
 STATE OF NEW HAMPSHIRE DEPARTMENT OF ENVIRONMENTAL SERVICES AIR RESOURCES DIVISION Full Compliance Evaluation Report Off-Site Report CONCORD STEAM CORPORATION 105 ½ PLEASANT STREET CONCORD, NH 03302-1377
AIR QUALITY PERMIT. 7 Foundation Drive Savannah, Georgia (Chatham County)
") AIR QUALITY PERMIT Permit No. Effective Date April 11, 2016 In accordance with the provisions of the Georgia Air Quality Act, O.C.G.A. Section 12-9-1, et seq and the Rules, Chapter 391-3-1, adopted pursuant
AIR QUALITY PERMIT Permit No. Effective Date April 11, 2016 In accordance with the provisions of the Georgia Air Quality Act, O.C.G.A. Section 12-9-1, et seq and the Rules, Chapter 391-3-1, adopted pursuant
Monthly data generated on Wednesday, July 31, 2013 at 13:04 UTC
 MESONET CLIMATOLOGICAL DATA SUMMARY May 2013 Time Zone: Midnight-Midnight CST 1 82 40 63.9 NA 4 0 NA NA NA 0.01 28.18 29.90 N 19.2 46.3 24.90 66.6 71.4 77 66 2 54 36 43.5 NA 20 0 NA NA NA 0.05 28.67 30.42
Design Criteria Data
 MEDFORD/JACKSON CO. OR Latitude = 42.37 N WMO No. 72597 Longitude =122.8 W Elevation = 1329 feet Period of Record = 1973 to 1996 Average Pressure = 28.61 inches Hg Design Criteria Data Mean Coincident
Report on Ambient Air Quality during ODD and EVEN Period, 15
 Report on Ambient Air Quality Data during ODD and EVEN Period, 15 th to 30 th April, 2016 [ In compliance to the order of Hon ble NGT, Principle Bench, New Delhi in Original Application No. 179 of 2016,
Multi-Sector Air Pollutants Regulations (MSAPR) May 2017
 May 2017") Multi-Sector Air Pollutants Regulations (MSAPR) May 2017 Purpose The Multi-Sector Air Pollutants Regulations (MSAPR) came into force on June 17, 2016 This presentation will provide an overview of: MSAPR
Multi-Sector Air Pollutants Regulations (MSAPR) May 2017 Purpose The Multi-Sector Air Pollutants Regulations (MSAPR) came into force on June 17, 2016 This presentation will provide an overview of: MSAPR
Part 70 Operating Permit Amendment
 Part 70 Operating Permit Amendment Effective Date: February 18, 2016 Facility Name: Scherer Steam-Electric Generating Plant Facility Address 10986 Highway 87 Juliette, Georgia 31046, Monroe County Mailing
APPENDIX 6A. Air Quality Monitoring Results
 APPENDIX 6A Air Quality Results Introduction summarises the monitoring data that was used to determine the air quality baseline conditions for the SD2 Project. Air quality monitoring has been carried
PERMIT APPLICATION REVIEW SUMMARY
 PERMIT APPLICATION REVIEW SUMMARY New Hampshire Department of Environmental Services Air Resources Division P.O. Box 95, 29 Hazen Drive Concord, NH 03302-0095 Phone: 603-271-1370 Fax: 603-271-7053 AFS
1 NRG #40 Anem. m/s 2 NRG #40 Anem. m/s 3 NRG #40 Anem. m/s 4 NRG #40 Anem. m/s 5 NRG #40 Anem. m/s 6 NRG #40 Anem. m/s. 30 m. 40 m. 30 m. m/s.
 1 Site Information: Sensor Information: 1 2 3 4 6 7 #0P Wind Vane 8 #0P Wind Vane 9 NRG #1S Temp C BP- Barom. mb 11 No SCM Installed 12 No SCM Installed Summary Report Channel 1 2 3 4 6 7 8 9 Height 0
Design Criteria Data
 PHILADELPHIA PA Latitude = 39.88 N WMO No. 7248 Longitude = 75.25 W Elevation = 3 feet Period of Record = 1973 to 1996 Average Pressure = 29.98 inches Hg Design Criteria Data Mean Coincident (Average)
COUNT, CLASSIFICATION & SPEED SAMPLE REPORTS
 Connected Solutions for Better Traffic Safety Outcomes COUNT, CLASSIFICATION & SPEED SAMPLE REPORTS AllTrafficSolutions.com Why You Need Traffic Data at Your Fingertips As traffic in your municipality
Malaysia to implement Euro 4M in 2015
 June 2012 InFocus Malaysia to implement Euro 4M in 2015 Malaysia had more than 21 million registered cars, motorcycles, trucks, buses and commercial vehicles on its roads last year. According to the Petaling
Design Criteria Data
 OKLAHOMA CITY OK Latitude = 35.4 N WMO No. 72353 Longitude = 97.6 W Elevation = 133 feet Period of Record = 1973 to 1996 Average Pressure = 28.62 inches Hg Design Criteria Data Mean Coincident (Average)
Design Criteria Data
 SPRINGFLD MO Latitude = 37.23 N WMO No. 7244 Longitude = 93.38 W Elevation = 127 feet Period of Record = 1973 to 1996 Average Pressure = 28.66 inches Hg Design Criteria Data Mean Coincident (Average) Values
This is a new permit condition titled, "2D.1111 Subpart ZZZZ, Part 63 (Existing Non-Emergency nonblack start CI > 500 brake HP)"
") This is a new permit condition titled, "2D.1111 Subpart ZZZZ, Part 63 (Existing Non-Emergency nonblack start CI > 500 brake HP)" Note to Permit Writer: This condition is for existing engines (commenced
This is a new permit condition titled, "2D.1111 Subpart ZZZZ, Part 63 (Existing Non-Emergency nonblack start CI > 500 brake HP)" Note to Permit Writer: This condition is for existing engines (commenced
RICE NESHAP Frequently Asked Questions (FAQ)
") RICE NESHAP Frequently Asked Questions (FAQ) What does RICE NESHAP mean? RICE NESHAP is an acronym for Reciprocating Internal Combustion Engines National Emission Standards for Hazardous Air Pollutants.
RICE NESHAP Frequently Asked Questions (FAQ) What does RICE NESHAP mean? RICE NESHAP is an acronym for Reciprocating Internal Combustion Engines National Emission Standards for Hazardous Air Pollutants.
Design Criteria Data
 DES MOINES IA Latitude = 41.53 N WMO No. 72546 Longitude = 93.65 W Elevation = 965 feet Period of Record = 1973 to 1996 Average Pressure = 28.96 inches Hg Design Criteria Data Mean Coincident (Average)
DEP7007CC Compliance Certification
 Commonwealth of Kentucky Natural Resources & Environmental Protection Cabinet Department for Environmental Protection DIVISION FOR AIR QUALITY DEP7007CC Compliance Certification Division Use Only ID# Permit
Design Criteria Data
 LAS VEGAS/MCCARRAN NV Latitude = 36.8 N WMO No. 72386 Longitude =115.1 W Elevation = 2179 feet Period of Record = 1973 to 1996 Average Pressure = 27.67 inches Hg Design Criteria Data Mean Coincident (Average)
Design Criteria Data
 PHOENIX/SKY HARBOR AZ Latitude = 33.43 N WMO No. 72278 Longitude =112. W Elevation = 116 feet Period of Record = 1973 to 1996 Average Pressure = 28.72 inches Hg Design Criteria Data Mean Coincident (Average)
Design Criteria Data
 RENO/CANNON INTL NV Latitude = 39.5 N WMO No. 72488 Longitude =119.7 W Elevation = 44 feet Period of Record = 1973 to 1996 Average Pressure = 25.57 inches Hg Design Criteria Data Mean Coincident (Average)
The Director, Purchasing and Materials Management recommends that:
 STAFF REPORT ACTION REQUIRED Request for Quotation 6902-07-3168 For the supply, delivery and off-loading of Pre-blended Ethanol Unleaded Gasoline, and Pre-blended Bio-diesel and Low Sulphur Diesel Fuels
ELECTRICAL GENERATING STEAM BOILERS, REPLACEMENT UNITS AND NEW UNITS (Adopted 1/18/94; Rev. Adopted & Effective 12/12/95)
") RULE 69. ELECTRICAL GENERATING STEAM BOILERS, REPLACEMENT UNITS AND NEW UNITS (Adopted 1/18/94; Rev. Adopted & Effective 12/12/95) (a) APPLICABILITY (1) Except as provided in Section (b) or otherwise specified
RULE 69. ELECTRICAL GENERATING STEAM BOILERS, REPLACEMENT UNITS AND NEW UNITS (Adopted 1/18/94; Rev. Adopted & Effective 12/12/95) (a) APPLICABILITY (1) Except as provided in Section (b) or otherwise specified
Design Criteria Data
 INDIANAPOLIS IN Latitude = 39.73 N WMO No. 72438 Longitude = 86.27 W Elevation = 87 feet Period of Record = 1973 to 1996 Average Pressure = 29.15 inches Hg Design Criteria Data Mean Coincident (Average)
Design Criteria Data
 COLUMBIA SC Latitude = 33.95 N WMO No. 7231 Longitude = 81.12 W Elevation = 226 feet Period of Record = 1973 to 1996 Average Pressure = 29.8 inches Hg Design Criteria Data Mean Coincident (Average) Values
Design Criteria Data
 DENVER/STAPLETON CO Latitude = 39.75 N WMO No. 72469 Longitude =14.8 W Elevation = 5332 feet Period of Record = 1973 to 1995 Average Pressure = 24.66 inches Hg Design Criteria Data Mean Coincident (Average)
RULE STATIONARY GAS TURBINES Adopted (Amended , ) INDEX
 INDEX") RULE 413 - STATIONARY GAS TURBINES Adopted 04-06-95 (Amended 05-01-97, 03-24-05) INDEX 100 GENERAL 101 PURPOSE 102 APPLICABILITY 110 EXEMPTION - EMERGENCY STANDBY UNITS 111 EXEMPTION - REMOVAL FROM SERVICE
RULE 413 - STATIONARY GAS TURBINES Adopted 04-06-95 (Amended 05-01-97, 03-24-05) INDEX 100 GENERAL 101 PURPOSE 102 APPLICABILITY 110 EXEMPTION - EMERGENCY STANDBY UNITS 111 EXEMPTION - REMOVAL FROM SERVICE
Design Criteria Data
 RAPID CITY SD Latitude = 44.5 N WMO No. 72662 Longitude =3. W Elevation = 3169 feet Period of Record = 1973 to 1996 Average Pressure = 26.67 inches Hg Design Criteria Data Mean Coincident (Average) Values
Design Criteria Data
 PIERRE SD Latitude = 44.38 N WMO No. 726686 Longitude =1.2 W Elevation = 1742 feet Period of Record = 1973 to 1996 Average Pressure = 28.1 inches Hg Design Criteria Data Mean Coincident (Average) Values
Design Criteria Data
 MACON/LEWIS WILSON GA Latitude = 32.7 N WMO No. 72217 Longitude = 83.65 W Elevation = 361 feet Period of Record = 1973 to 1996 Average Pressure = 29.66 inches Hg Design Criteria Data Mean Coincident (Average)
Design Criteria Data
 SPOKANE WA Latitude = 47.63 N WMO No. 72785 Longitude =117.5 W Elevation = 2366 feet Period of Record = 1973 to 1996 Average Pressure = 27.5 inches Hg Design Criteria Data Mean Coincident (Average) Values
Design Criteria Data
 ANCHORAGE AK Latitude = 61.17 N WMO No. 7273 Longitude =15. W Elevation = 131 feet Period of Record = 1973 to 1996 Average Pressure = 29.6 inches Hg Design Criteria Data Mean Coincident (Average) Values
Design Criteria Data
 DAYTON/JAMES M COX OH Latitude = 39.9 N WMO No. 72429 Longitude = 84.2 W Elevation = 14 feet Period of Record = 1973 to 1996 Average Pressure = 28.95 inches Hg Design Criteria Data Mean Coincident (Average)
Design Criteria Data
 LOUISVILLE/STANDIFORD KY Latitude = 38.18 N WMO No. 72423 Longitude = 85.73 W Elevation = 489 feet Period of Record = 1973 to 1996 Average Pressure = 29.49 inches Hg Design Criteria Data Mean Coincident
Design Criteria Data
 JACKSONVILLE FL Latitude = 3.5 N WMO No. 7226 Longitude = 81.7 W Elevation = 3 feet Period of Record = 1973 to 1996 Average Pressure = 3.1 inches Hg Design Criteria Data Mean Coincident (Average) Values
PRODUCT CONFORMITY CERTIFICATE
 PRODUCT CONFORMITY CERTIFICATE This is to certify that the testo 350 portable flue gas analyser Manufactured by: testo AG Testo-Strasse 1 79853 Lenzkirch Germany Has been assessed by Sira Certification
Design Criteria Data
 WASHINGTON/DULLES VA Latitude = 38.95 N WMO No. 7243 Longitude = 77.45 W Elevation = 322 feet Period of Record = 1973 to 1996 Average Pressure = 29.68 inches Hg Design Criteria Data Mean Coincident (Average)
Design Criteria Data
 BIRMINGHAM AL Latitude = 33.57 N WMO No. 72228 Longitude = 86.75 W Elevation = 63 feet Period of Record = 1973 to 1996 Average Pressure = 29.36 inches Hg Design Criteria Data Mean Coincident (Average)
Design Criteria Data
 MIDLAND TX Latitude = 31.95 N WMO No. 72265 Longitude =2. W Elevation = 2861 feet Period of Record = 1973 to 1996 Average Pressure = 27.3 inches Hg Design Criteria Data Mean Coincident (Average) Values
AIR EMISSION PERMIT NO IS ISSUED TO. City of Virginia
 AIR EMISSION PERMIT NO. 13700028-003 IS ISSUED TO City of Virginia 620 South 2nd Street Virginia, St. Louis County, Minnesota 55792 The emission units, control equipment and emission stacks at the stationary
Design Criteria Data
 ALBUQUERQUE NM Latitude = 35.5 N WMO No. 72365 Longitude =16.6 W Elevation = 5315 feet Period of Record = 1967 to 1996 Average Pressure = 24.72 inches Hg Design Criteria Data Mean Coincident (Average)
Alberta s Third Party Auditor Certification Program. Testing Your Knowledge at the Third Party Auditor Interview Stage
 Part One: Alberta s Third Party Auditor Certification Program Testing Your Knowledge at the Third Party Auditor Interview Stage For questions 1 4, circle the correct answer (answers may be found at the
Design Criteria Data
 LANDER/HUNT WY Latitude = 42.82 N WMO No. 72576 Longitude =18.7 W Elevation = 5558 feet Period of Record = 1973 to 1996 Average Pressure = 24.44 inches Hg Design Criteria Data Mean Coincident (Average)
Design Criteria Data
 MINNEAPOLIS-ST PAUL MN Latitude = 44.88 N WMO No. 72658 Longitude = 93.22 W Elevation = 837 feet Period of Record = 1973 to 1996 Average Pressure = 29.7 inches Hg Design Criteria Data Mean Coincident (Average)
Air Quality Mandates Affecting the Caltrans Fleet Caltrans Division of Equipment Sacramento, CA June, 2009
 Air Quality Mandates Affecting the Caltrans Fleet Caltrans Division of Equipment Sacramento, CA June, 2009 Presentation Overview ARB On Road Mandate ARB Off Road Mandate South Coast AQMD Fleet Rules ARB
Design Criteria Data
 CHARLESTON/KANAWHA WV Latitude = 38.37 N WMO No. 72414 Longitude = 81.6 W Elevation = 981 feet Period of Record = 1973 to 1996 Average Pressure = 29. inches Hg Design Criteria Data Mean Coincident (Average)
UNITED STATES ENVIRONMENTAL PROTECTION AGENCY OFFICE OF TRANSPORTATION AND AIR QUALITY ENGINE INTERNATIONAL AIR POLLUTION PREVENTION CERTIFICATE
 UNITED STATES ENVIRONMENTAL PROTECTION AGENCY OFFICE OF TRANSPORTATION AND AIR QUALITY ENGINE INTERNATIONAL AIR POLLUTION PREVENTION CERTIFICATE Manufacturer: Engine Family: Certificate Number: AB VOLVO
Design Criteria Data
 DULUTH MN Latitude = 46.83 N WMO No. 72745 Longitude = 92.18 W Elevation = 1417 feet Period of Record = 1973 to 1996 Average Pressure = 28.43 inches Hg Design Criteria Data Mean Coincident (Average) Values
Confirmation: / 22 March 2013
 Test report: 936/21205333/A of 06 December 2006 Addendum 936/21220762/A of 04 October 2012 Initial certification: 05 March 2013 Date of expiry: 04 March 2018 Publication: BAnz AT 05 March 2013 B10, chapter
Design Criteria Data
 MINOT AFB ND Latitude = 48.42 N WMO No. 727675 Longitude =11.3 W Elevation = 1667 feet Period of Record = 1967 to 1996 Average Pressure = 28.16 inches Hg Design Criteria Data Mean Coincident (Average)
Design Criteria Data
 CHICAGO/O HARE IL Latitude = 41.98 N WMO No. 7253 Longitude = 87.9 W Elevation = 673 feet Period of Record = 1967 to 1996 Average Pressure = 29.27 inches Hg Design Criteria Data Mean Coincident (Average)
PEMS Testing of Porsche Model Year 2018 Vehicles
 PEMS Testing of Porsche Model Year 18 Vehicles Report Pursuant to Paragraph 33.e and Paragraph 33.f of the DOJ and California Third Partial Consent Decree Version: Final Report Date: 11/12/18 Project:
Environmental Assessment for a New Landfill Footprint at the West Carleton Environmental Centre
 Waste Management of Canada Corporation Environmental Assessment for a New Landfill Footprint at the West Carleton Environmental Centre ATMOSPHERIC PARTICULATE MATTER EXISTING CONDITIONS REPORT Prepared
Hamilton Works Community Liaison Committee
 Hamilton Works Community Liaison Committee 26 May 2016 Trevor Harris Andrew Sebestyen 2015 Agenda 1. Welcome and Safety Contact 2. Review and Approval of Agenda 3. Review and Approval of Minutes of 27
Regulatory and Permitting Requirements of Stationary Generators In Delaware
 Regulatory and Permitting Requirements of Stationary Generators In Delaware Delaware - DNREC Air Quality Management February 7, 2006 Mark A. Prettyman and Guadalupe J. Reynolds Outline Regulation No. 1144
ARTICLE AIR POLLUTION CONTROL REGULATIONS AND PROCEDURES
 TABLE OF CONTENTS ARTICLE 2.0000 AIR POLLUTION CONTROL REGULATIONS AND PROCEDURES Section 2.1400 Nitrogen Oxides 2.1401 Definitions... 214-01 2.1402 Applicability... 214-04 2.1403 Compliance Schedules...
United States Stove Company Project # Model: KP60 AKA: AP60, VG60 Type: Pellet-Fired Room Heater May 31, 2018
 United States Stove Company Project # 18-409 AKA: AP60, VG60 Type: Pellet-Fired Room Heater May 31, 2018 ASTM E2779 Standard Test Method for Determining Particulate Matter Emissions from Pellet Heaters
Deriving Background Concentrations of NOx and NO 2 April 2016 Update
 Deriving Background Concentrations of NOx and NO 2 April 2016 Update April 2016 Prepared by: Dr Ben Marner Approved by: Prof. Duncan Laxen 1 Calibration of DEFRA Background Maps 1.1 Background concentrations
2017 Meteorological and Oceanographic Summary for the Bocas del Toro Research Station. Prepared by: Steven Paton
 0 2017 Meteorological and Oceanographic Summary for the Bocas del Toro Research Station Prepared by: Steven Paton 1 Introduction This is the 5 th of a series of yearly reports summarising the past year
Design Criteria Data
 BURLINGTON VT Latitude = 44.47 N WMO No. 72617 Longitude = 73.15 W Elevation = 341 feet Period of Record = 1973 to 1996 Average Pressure = 29.61 inches Hg Design Criteria Data Mean Coincident (Average)
ALLEGHENY COUNTY HEALTH DEPARTMENT AIR QUALITY PROGRAM
 ALLEGHENY COUNTY HEALTH DEPARTMENT AIR QUALITY PROGRAM June 17, 2004 SUBJECT: Review of Application Title V Operating Permit Bellefield Boiler Plant Boundary Street Pittsburgh, PA 15213 RE: Operating Permit
Implementing Vehicle Emission Standards and Equivalent Fuel Quality and the Case of Thailand s Roadmap to Euro 6/VI
 Implementing Vehicle Emission Standards and Equivalent Fuel Quality and the Case of Thailand s Roadmap to Euro 6/VI Dr. Supat Wangwongwatana Faculty of Public Health, Thammasat University Member of the
Design Criteria Data
 HONOLULU/OAHU HI Latitude = 21.35 N WMO No. 91182 Longitude =157.9 W Elevation = 16 feet Period of Record = 1967 to 1996 Average Pressure = 29.96 inches Hg Design Criteria Data Mean Coincident (Average)
Design Criteria Data
 BOSTON/LOGAN MA Latitude = 42.37 N WMO No. 7259 Longitude = 71.3 W Elevation = 3 feet Period of Record = 1967 to 1996 Average Pressure = 29.95 inches Hg Design Criteria Data Mean Coincident (Average) Values
2016 Meteorological and Oceanographic Summary for the Bocas del Toro Research Station. Prepared by: Steven Paton
 0 2016 Meteorological and Oceanographic Summary for the Bocas del Toro Research Station Prepared by: Steven Paton 1 Introduction This is the forth of a series of yearly reports summarising the past year
ANNEX 13. UNIFIED INTERPRETATIONS TO MARPOL ANNEX VI AND THE NO x TECHNICAL CODE
 MARPOL Annex VI Regulation 1 Application Regulation 1 reads as follows: UNIFIED INTERPRETATIONS TO MARPOL ANNEX VI AND THE NO x TECHNICAL CODE The provisions of this Annex shall apply to all ships, except
6/1/2011. NSPS and MACT Standards for Combustion Sources at Utility Authorities What happens when a permit has both federal and state regulations?
 Presented by Richard M. Cestone, PE, CHMM Birdsall Services Group For NJEWA Conference May 9, 2011 What happens when a permit has both federal and state regulations? 1 Facilities get confused with Federal
This rule shall apply to any stationary source which is a major source of regulated air pollutants or of hazardous air pollutants.
 RULE 2530 FEDERALLY ENFORCEABLE POTENTIAL TO EMIT (Adopted June 15, 1995; Amended April 25, 2002; Amended December 18, 2008, but not in effect until June 10, 2010) 1.0 Purpose The purpose of this rule
Global Outlook for Vehicle In Use Emissions. Berlin, October 16, 2000
 Global Outlook for Vehicle In Use Emissions Berlin, October 16, 2000 Overview Serious Air Pollution Problems Remain In Use Emissions Are What Counts Progress Being Made Worldwide Significant Challenges
Design Criteria Data
 NEW YORK/JOHN F KENNEDY NY Latitude = 4.65 N WMO No. 74486 Longitude = 73.78 W Elevation = 23 feet Period of Record = 1973 to 1996 Average Pressure = 29.98 inches Hg Design Criteria Data Mean Coincident
EMISSIONS AND FUEL ECONOMY TEST FINAL REPORT (OAE-APSI-4) Locomotive EMD Engine FITCH FUEL CATALYST
 Locomotive EMD Engine FITCH FUEL CATALYST") Page 1 of 11 EMISSIONS AND FUEL ECONOMY TEST FINAL REPORT (OAE-APSI-4) Locomotive EMD Engine FITCH FUEL CATALYST Prepared by : OceanAir Environmental, LLC PO Box 1318 Somis, CA 93066 (805) 386-1882, Fax
Page 1 of 11 EMISSIONS AND FUEL ECONOMY TEST FINAL REPORT (OAE-APSI-4) Locomotive EMD Engine FITCH FUEL CATALYST Prepared by : OceanAir Environmental, LLC PO Box 1318 Somis, CA 93066 (805) 386-1882, Fax
Euro VI Programme and Emissions Results on European Cycles
 Overview of the AECC Heavy-duty Euro VI Programme and Emissions Results on European Cycles Dr. R. J. Brisley AECC Technical Steering Committee AECC Technical Seminar on Heavy-duty Engine Emissions Brussels,
Mobile Source Committee Update
 OTC/MANE VU Fall Meeting November 15th, 2012 Washington, DC OZONE TRANSPORT COMMISSION Mobile Source Committee Update 1 Overview 1. Mobile Sources Cause 40-60% of the Ozone in the Eastern US 2. State Authority:
EPA TIER 4 AND THE ELECTRIC POWER INDUSTRY. Tim Cresswell Tier 4 Product Definition Manager Electric Power Division
 EPA TIER 4 AND THE ELECTRIC POWER INDUSTRY Tim Cresswell Tier 4 Product Definition Manager Electric Power Division March 2014 INTRODUCTION The initiative to lower diesel engine emissions started with on-highway