The population data in the 2014 annual report tables were compiled by the Population Research Center, Portland State University, 4/22/2015.
|
|
|
- Charity Norton
- 6 years ago
- Views:
Transcription
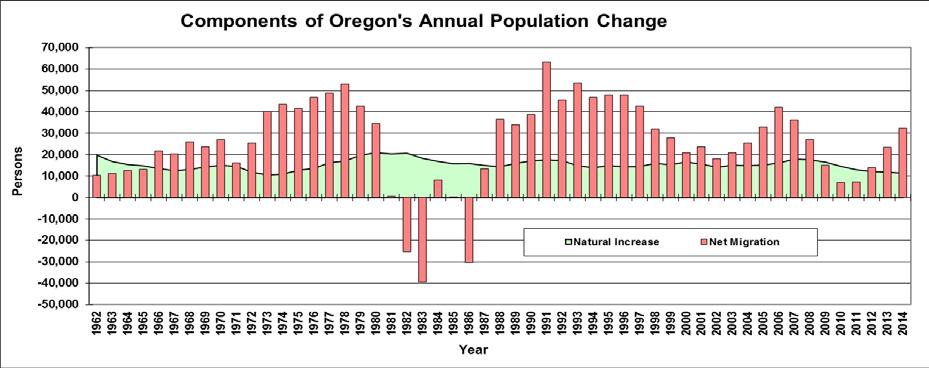
1 The population data in the 2014 annual report tables were compiled by the Research Center, Portland State University, 4/22/2015. The tables in the tabs in this workbook hold the 2014 population estimates produced by the Research Center, Portland State University. The July 1 estimates of total population for counties and cities and towns were certified December 15, Some tables include the U.S. Census Bureau's decennial Census counts and historical population estimates produced by our Center, and other tables include calculations of change since Census Also included are population estimates for broad age groups and 5-year age groups; the estimates for broad age groups were certified December 31, There are footnotes that accompany Tables 1 through 7. Contents of Tabs: Tab Name Table 1: Table 2: Table 3: Table 4: Table Name and description Annual and Components of for Oregon: ; July 1 Estimates and April Census Counts. Annual populations, population change and the components of population change (births, deaths, natural increase, and net migration) are reported for Oregon. Two graphs are included, one displays annual growth rates, and the other shows the magnitude of change due to natural increase (the number of births minus the number of deaths), and net migration (the number of movers in minus the number of movers out). Estimates of Oregon by Area type and Specific Metropolitan Areas: 2000 to estimates are aggregated for incorporated and unincorporated, metropolitan and non-metropolitan areas in Oregon. s are also reported for each of Oregon's eight Metropolitan Statistical Areas, as designated by the U.S. Census Bureau. Components of for Oregon's Counties: April 1, 2010 to July 1, s are reported for Oregon and the 36 counties; population change and the components of population change from 2010 to 2014 are also included. for Oregon and its Counties and Incorporated Cities and Towns: July 1, 2010-July 1, 2014; and Census Counts Annual population estimates from are reported along with April 1 Census counts from Sub-county population estimates are grouped by county; cities that are split between counties are reported in parts respective to their county location. estimates for the county unincorporated areas are also reported; an estimate for the unincorporated area is a residual of the county total and the sum of the cities within that county. Note that Census 2000 includes slight revisions to account for challenges to the census counts in the Count Resolution Program. 1
2 Table 5: Table 6: s for Incorporated Cities Located in More than One County. Annual population estimates for , and 2000 and 2010 Census counts, for city parts by county are reported in this table. Rank of Incorporated Cities and Towns by July 1, 2014 Size. This table displays the rank order of Oregon's incorporated cites and towns by 2014 population size, largest to smallest. Table 7: Table 8: Alphabetical Listing of Oregon's Incorporated Cities and Towns with s for July 1, 2014 and Census 2010, and since Census estimates for 2014 and Census counts for 2010 are reported, along with numerical and percentage change during the time period. Added to Incorporated Cities Due to Annexations: April 1, July 1, This table is a listing of Oregon's cities and towns in alphabetical order with the numbers of persons they have annexed since Census Table 9: Estimates by Age and Sex for Oregon and Its Counties: July 1, estimates for Oregon's counties by 5 -year age group are reported in three tables: 1) total population; 2) male population; and 3) female population. estimates for ages are split into and age groups. Table 10: Estimates by Broad Age Group (<18 Years, Years, & over 64 Years) Estimates for ages 0-17 years, years, and 65 years and older are reported in this table for Oregon and its counties. 2
3 Table 1. and Components of for Oregon: 1960 to 2014 July 1 Estimates and April 1 Census Counts Prepared by Research Center, PSU, April Date Births Deaths Natural Increase Net Migration April 1, ,768,687 July 1, ,798,000 29,313 31,660 14,060 17,600 11,713 July 1, ,828,000 30,000 36,535 16,735 19,800 10,200 July 1, ,856,000 28,000 32,971 16,171 16,800 11,200 July 1, ,884,000 28,000 32,687 17,287 15,400 12,600 July 1, ,912,000 28,000 32,585 17,785 14,800 13,200 July 1, ,947,200 35,200 31,210 17,710 13,500 21,700 July 1, ,980,000 32,800 30,711 18,211 12,500 20,300 July 1, ,018,900 38,900 32,464 19,364 13,100 25,800 July 1, ,057,000 38,100 34,423 20,123 14,300 23,800 April 1, ,091,533 34,533 25,755 14,657 11,099 23,434 July 1, ,099,150 7,617 8,838 4,883 3,956 3,661 July 1, ,129,900 30,750 34,349 19,809 14,540 16,210 July 1, ,167,000 37,100 31,332 19,532 11,800 25,300 July 1, ,217,600 50,600 30,939 20,439 10,500 40,100 July 1, ,271,900 54,300 31,123 20,223 10,900 43,400 July 1, ,326,200 54,300 32,934 20,234 12,700 41,600 July 1, ,386,700 60,500 33,613 20,013 13,600 46,900 July 1, ,451,900 65,200 37,546 21,246 16,300 48,900 July 1, ,521,900 70,000 37,231 20,131 17,100 52,900 July 1, ,584,300 62,400 41,271 21,471 19,800 42,600 April 1, ,633,156 48,856 31,555 15,951 15,604 33,252 July 1, ,639,915 6,759 10,773 5,439 5,334 1,425 July 1, ,660,735 20,820 42,052 21,675 20, July 1, ,656,185-4,550 42,261 21,548 20,713-25,263 July 1, ,635,000-21,185 40,378 22,039 18,339-39,524 July 1, ,660,000 25,000 39,611 22,702 16,909 8,091 July 1, ,675,800 15,800 39,296 23,531 15, July 1, ,661,500-14,300 39,332 23,403 15,929-30,229 July 1, ,690,000 28,500 38,702 23,695 15,007 13,493 July 1, ,741,000 51,000 39,120 24,752 14,368 36,632 July 1, ,791,000 50,000 40,648 24,705 15,943 34,057 April 1, ,842,321 51,321 31,319 18,608 12,711 38,610 July 1, ,847,000 4,679 10,708 6,268 4, July 1, ,927,800 80,800 42,644 25,004 17,640 63,160 July 1, ,990,610 62,810 42,427 25,166 17,261 45,549 July 1, ,059,110 68,500 41,442 26,543 14,899 53,601 July 1, ,119,940 60,830 41,487 27,564 13,923 46,907 July 1, ,182,690 62,750 42,426 27,552 14,874 47,876 July 1, ,245,100 62,410 43,196 28,768 14,428 47,982 July 1, ,302,140 57,040 43,625 29,201 14,424 42,616 July 1, ,350,080 47,940 44,696 28,705 15,991 31,949 July 1, ,393,410 43,330 45,188 29,848 15,340 27,990 April 1, ,421,399 27,989 33,805 21,827 11,978 16,011 July 1, ,431,085 9,686 11,729 7,082 4,647 5,039 July 1, ,470,385 39,300 45,536 29,934 15,602 23,698 July 1, ,502,588 32,203 44,995 30,828 14,167 18,036 July 1, ,538,591 36,003 45,686 30,604 15,082 20,921 3
4 Date Births Deaths Natural Increase Net Migration July 1, ,578,895 40,303 45,599 30,721 14,878 25,425 July 1, ,626,938 48,043 45,892 30,717 15,175 32,868 July 1, ,685,206 58,268 46,946 30,771 16,175 42,093 July 1, ,739,359 54,153 49,404 31,394 18,010 36,143 July 1, ,784,182 44,823 49,658 32,008 17,650 27,173 July 1, ,815,775 31,593 47,958 31,382 16,576 15,017 April 1, ,831,074 15,299 34,364 23,879 10,485 4,814 July 1, 2010rev 3,837,300 6,226 11,892 7,814 4,078 2,148 July 1, ,857,625 20,325 45,381 32,437 12,944 7,381 July 1, 2012* 3,883,735 26,110 44,897 32,814 12,083 14,027 July 1, 2013* 3,919,020 35,285 45,094 33,089 12,005 23,280 July 1, ,962,710 43,690 45,317 34,004 11,313 32,377 * Births and/or Deaths, Natural Increase, and Net Migration are revised from last year's report. Additional Notes: Estimates for July 1, 2000-July 1, 2009 are revised estimates that incorporate Census 2010 (they represent the pattern of migration in the originally certified estimates during the decade adjusted to Census 2010). For full year July to July population change in a year that includes a decennial Census, add together population change reported for April and in July of the same year. 4
5 5
6 Table 2. Estimates of Oregon by Area Type and Specific Metropolitan Areas: 2000 to 2014 Prepared by Research Center, PSU, April Area Type Date State Incorporated Un- incorporated Metropolitan Non-metropolitan April 1, ,421,399 2,280,362 1,141,037 2,617, ,644 April 1, ,831,074 2,669,922 1,161,152 2,978, ,523 July 1, 2010rev 3,837,300 2,673,543 1,163,757 2,983, ,445 July 1, ,857,625 2,684,812 1,172,813 3,002, ,285 July 1, ,883,735 2,696,792 1,186,943 3,026, ,660 July 1, ,919,020 2,716,667 1,202,353 3,258, ,060 July 1, ,962,710 2,744,907 1,217,803 3,299, ,330 Metropolitan Areas Date Portland-Vancouver- Hillsboro Eugene-Springfield Medford Salem Corvallis Bend-Redmond Albany Grants Pass April 1, ,927, , , ,214 78, ,367 April 1, ,226, , , ,738 85, ,733 July 1, 2010rev 2,230, , , ,395 85, ,905 July 1, ,246, , , ,115 85, ,875 July 1, ,266, , , ,120 86, ,140 July 1, ,292, , , ,945 87, , ,665 82,815 July 1, ,326, , , ,885 88, , ,705 83,105 Portland-Vancouver-Hillsboro, OR-WA MSA consists of Clackamas, Columbia, Multnomah, Washington, and Yamhill counties in Oregon; and Clark and Skamania Counties in Washington. estimates for the Washington counties were obtained from Washington Office of Financial Management, which refer to April 1; July 1 populations in Clark and Skamania counties were estimated by PRC by interpolation or extrapolation of the April 1 populations. Portland-Vancouver-Hillsboro MSA was renamed from Portland-Vancouver-Beaverton MSA by the Census Bureau in Feb Eugene-Springfield MSA consists of Lane County. Medford MSA consists of Jackson County. Salem MSA consists of Marion and Polk Counties. Corvallis MSA consists of Benton County. Bend MSA consists of Deschutes County. Bend-Redmond MSA consists of Deschutes County. Bend-Redmond MSA was renamed from Bend MSA by the Census Bureau in Feb Albany MSA consists of Linn County. It was designated as an MSA in Feb by the Census Bureau. Grants Pass MSA consists of Josephine County. It was designated as an MSA in Feb by the Census Bureau.
7 Table 3. Components of for Oregon's Counties: April 1, 2010 to July 1, 2014 Prepared by Research Center, PSU, April July 1, 2014 Estimate April 1, 2010 Census Percent Average Annual since Census Births* Deaths* Natural Increase Net Migration OREGON 3,962,710 3,831, , % 0.79% 192, ,227 52,229 79,407 BAKER 16,325 16, % 0.3% BENTON 88,740 85,579 3, % 0.9% 3,122 2, ,377 CLACKAMAS 391, ,992 15, % 1.0% 16,713 13,022 3,691 11,842 CLATSOP 37,495 37, % 0.3% 1,792 1, COLUMBIA 50,075 49, % 0.3% 2,033 1, COOS 62,900 63, % -0.1% 2,645 3, CROOK 20,780 20, % -0.2% CURRY 22,355 22, % 0.0% 777 1, DESCHUTES 166, ,733 8, % 1.3% 7,237 5,549 1,688 6,979 DOUGLAS 109, ,667 1, % 0.4% 4,594 5,890-1,296 3,014 GILLIAM 1,975 1, % 1.3% GRANT 7,425 7, % -0.1% HARNEY 7,265 7, % -0.5% HOOD RIVER 23,730 22,346 1, % 1.4% 1, JACKSON 208, ,206 5, % 0.6% 9,858 9, ,791 JEFFERSON 22,205 21, % 0.5% 1, JOSEPHINE 83,105 82, % 0.1% 3,456 4,970-1,515 1,907 KLAMATH 66,910 66, % 0.2% 3,380 3, LAKE 7,990 7, % 0.3% LANE 358, ,715 7, % 0.5% 14,973 13,924 1,049 6,041 LINCOLN 46,890 46, % 0.4% 1,851 2, ,418 LINN 119, ,672 3, % 0.6% 6,114 4,874 1,240 1,793 MALHEUR 31,470 31, % 0.1% 1,840 1, MARION 326, ,335 10, % 0.8% 18,626 10,927 7,699 3,116
8 July 1, 2014 Estimate April 1, 2010 Census Percent Average Annual since Census Births* Deaths* Natural Increase Net Migration MORROW 11,525 11, % 0.7% MULTNOMAH 765, ,334 30, % 1.0% 40,335 23,181 17,154 13,287 POLK 77,735 75,403 2, % 0.7% 3,720 2,712 1,008 1,324 SHERMAN 1,785 1, % 0.3% TILLAMOOK 25,480 25, % 0.2% 1,054 1, UMATILLA 78,340 75,889 2, % 0.7% 4,606 2,690 1, UNION 26,485 25, % 0.7% 1,274 1, WALLOWA 7,070 7, % 0.2% WASCO 26,105 25, % 0.8% 1,269 1, WASHINGTON 560, ,710 30, % 1.3% 30,475 12,897 17,577 13,178 WHEELER 1,440 1, % 0.0% YAMHILL 102,525 99,193 3, % 0.8% 4,759 3,506 1,253 2,079 *The numbers of births and deaths in the most recent 2-3 years are revised annually.
9 Table 4. s for Oregon and Its Counties and Incorporated Cities and Towns: July 1, July 1, 2014 estimates; and Census Counts Prepared by Research Center, PSU, April County and Cities July 1 Estimates April 1 Census rev OREGON 3,962,710 3,919,020 3,883,735 3,857,625 3,837,300 3,831,074 3,421,436 2,842,321 BAKER 16,325 16,280 16,210 16,215 16,185 16,134 16,741 15,317 Baker City 9,890 9,890 9,890 9,890 9,830 9,828 9,860 9,140 Greenhorn Haines Halfway Huntington Richland Sumpter Unity Unincorporated 4,833 4,788 4,738 4,743 4,778 4,731 5,154 4,572 BENTON 88,740 87,725 86,785 85,995 85,735 85,579 78,153 70,811 Adair Village Albany (part)* 7,146 6,912 6,764 6,698 6,587 6,463 5, Corvallis 56,535 55,345 55,055 54,520 54,460 54,462 49,322 44,757 Monroe Philomath 4,630 4,625 4,620 4,610 4,590 4,584 3,838 2,983 Unincorporated 18,964 19,378 18,886 18,712 18,643 18,613 18,746 22,054 CLACKAMAS 391, , , , , , , ,850 Barlow Canby 16,010 15,910 15,865 15,830 15,830 15,829 12,790 8,990 Damascus 10,625 10,595 10,585 10,575 10,540 10,539 Not incorporated yet. Estacada 2,935 2,900 2,850 2,850 2,730 2,695 2,371 2,016 Gladstone 11,495 11,495 11,495 11,495 11,495 11,497 11,438 10,152 Happy Valley 16,480 15,575 14,965 14,330 14,100 13,903 4,519 1,519 Johnson City Lake Oswego (part)* 34,538 34,427 34,206 34,165 34,067 34,066 32,989 28,317 Milwaukie 20,485 20,500 20,435 20,400 20,290 20,291 20,490 18,670 Molalla 8,820 8,110 8,110 8,110 8,110 8,108 5,647 3,637 Oregon City 33,760 33,390 32,500 32,220 31,995 31,859 25,754 14,698 Portland (part)* Rivergrove (part)*
10 County and July 1 Estimates April 1 Census Cities rev Sandy 10,170 9,990 9,880 9,780 9,655 9,570 5,385 4,154 Tualatin (part)* 2,903 2,904 2,905 2,869 2,869 2,862 2,664 1,406 West Linn 25,540 25,425 25,370 25,250 25,150 25,109 22,261 16,389 Wilsonville (part)* 19,594 19,187 18,267 17,421 17,385 17,371 13,987 7,096 Unincorporated 176, , , , , , , ,128 CLATSOP 37,495 37,270 37,190 37,145 37,070 37,039 35,630 33,301 Astoria 9,590 9,525 9,555 9,495 9,475 9,477 9,813 10,069 Cannon Beach 1,705 1,705 1,705 1,700 1,695 1,690 1,588 1,221 Gearhart 1,475 1,480 1,475 1,465 1,465 1, ,027 Hammond Merged with Warrenton in Seaside 6,560 6,560 6,550 6,490 6,460 6,457 5,900 5,359 Warrenton 5,175 5,135 5,090 5,050 5,000 4,989 4,096 2,681 Unincorporated 12,990 12,865 12,815 12,945 12,975 12,964 13,238 12,355 COLUMBIA 50,075 49,850 49,680 49,625 49,430 49,351 43,560 37,557 Clatskanie 1,750 1,745 1,740 1,740 1,735 1,737 1,528 1,629 Columbia City 1,945 1,945 1,950 1,950 1,945 1,946 1,571 1,003 Prescott Rainier 1,905 1,900 1,895 1,895 1,895 1,895 1,687 1,674 St. Helens 12,990 12,895 12,920 12,890 12,905 12,883 10,019 7,535 Scappoose 6,700 6,700 6,685 6,665 6,630 6,592 4,976 3,529 Vernonia 2,065 2,065 2,080 2,110 2,155 2,151 2,228 1,808 Unincorporated 22,665 22,545 22,355 22,320 22,110 22,092 21,479 20,316 COOS 62,900 62,860 62,890 62,960 63,035 63,043 62,788 60,273 Bandon 3,105 3,100 3,100 3,085 3,075 3,066 2,833 2,224 Coos Bay 16,315 16,160 16,060 16,010 15,970 15,967 15,372 15,076 Coquille 3,870 3,850 3,870 3,865 3,865 3,866 4,184 4,121 Lakeside 1,705 1,705 1,700 1,695 1,695 1,699 1,421 1,437 Myrtle Point 2,525 2,525 2,515 2,515 2,515 2,514 2,451 2,712 North Bend 9,730 9,720 9,710 9,710 9,695 9,695 9,544 9,614 Powers Unincorporated 24,950 25,105 25,240 25,390 25,530 25,547 26,249 24,407 CROOK 20,780 20,690 20,650 20,855 21,020 20,978 19,184 14,111 Prineville 9,385 9,270 9,245 9,260 9,260 9,253 7,358 5,355 Unincorporated 11,395 11,420 11,405 11,595 11,760 11,725 11,826 8,756 10
11 County and July 1 Estimates April 1 Census Cities rev CURRY 22,355 22,300 22,295 22,335 22,355 22,364 21,137 19,327 Brookings 6,535 6,450 6,370 6,360 6,350 6,336 5,447 4,400 Gold Beach 2,275 2,275 2,280 2,255 2,255 2,253 1,897 1,546 Port Orford 1,135 1,135 1,135 1,135 1,135 1,133 1,153 1,025 Unincorporated 12,410 12,440 12,510 12,585 12,615 12,642 12,640 12,356 DESCHUTES 166, , , , , , ,367 74,958 Bend 79,985 78,280 77,455 76,925 76,740 76,639 52,029 20,447 La Pine 1,670 1,670 1,670 1,670 1,660 1,653 Not incorporated yet. Redmond 26,770 26,590 26,345 26,305 26,225 26,215 13,481 7,165 Sisters 2,190 2,115 2,080 2,055 2,040 2, Unincorporated 55,785 53,870 52,590 51,920 51,240 51,188 48,898 46,638 DOUGLAS 109, , , , , , ,399 94,649 Canyonville 1,910 1,910 1,910 1,885 1,885 1,884 1,293 1,219 Drain 1,160 1,160 1,160 1,155 1,155 1,151 1,021 1,086 Elkton Glendale Myrtle Creek 3,465 3,450 3,445 3,440 3,440 3,439 3,419 3,063 Oakland Reedsport 4,150 4,150 4,145 4,145 4,150 4,154 4,378 4,796 Riddle 1,185 1,185 1,185 1,185 1,185 1,185 1,014 1,143 Roseburg 22,510 22,275 21,920 21,690 21,660 21,181 20,017 17,069 Sutherlin 7,945 7,930 7,905 7,880 7,840 7,810 6,669 5,020 Winston 5,410 5,400 5,385 5,385 5,385 5,379 4,613 3,773 Yoncalla 1,060 1,060 1,060 1,055 1,050 1,047 1, Unincorporated 58,575 58,320 58,085 57,980 57,945 58,441 54,967 54,838 GILLIAM 1,975 1,945 1,900 1,880 1,870 1,871 1,915 1,717 Arlington Condon Lonerock Unincorporated GRANT 7,425 7,435 7,450 7,450 7,460 7,445 7,935 7,853 Canyon City Dayville Granite
12 County and July 1 Estimates April 1 Census Cities rev John Day 1,745 1,745 1,745 1,755 1,750 1,744 1,821 1,857 Long Creek Monument Mt. Vernon Prairie City ,080 1,117 Seneca Unincorporated 2,825 2,835 2,840 2,835 2,855 2,851 3,006 2,928 HARNEY 7,265 7,260 7,315 7,375 7,445 7,422 7,609 7,060 Burns 2,835 2,835 2,835 2,805 2,805 2,806 3,064 2,913 Hines 1,560 1,560 1,565 1,565 1,565 1,563 1,623 1,452 Unincorporated 2,870 2,865 2,915 3,005 3,075 3,053 2,922 2,695 HOOD RIVER 23,730 23,295 22,875 22,625 22,385 22,346 20,411 16,903 Cascade Locks 1,235 1,200 1,190 1,165 1,145 1,144 1, Hood River 7,545 7,460 7,375 7,320 7,180 7,167 5,831 4,632 Unincorporated 14,950 14,635 14,310 14,140 14,060 14,035 13,465 11,341 JACKSON 208, , , , , , , ,389 Ashland 20,340 20,295 20,325 20,255 20,095 20,078 19,522 16,252 Butte Falls Central Point 17,375 17,315 17,275 17,235 17,185 17,169 12,493 7,512 Eagle Point 8,635 8,575 8,550 8,520 8,470 8,469 4,797 3,022 Gold Hill 1,220 1,220 1,220 1,220 1,220 1,220 1, Jacksonville 2,840 2,840 2,815 2,800 2,785 2,785 2,235 1,896 Medford 76,650 75,920 75,545 75,180 74,980 74,907 63,687 47,021 Phoenix 4,580 4,570 4,570 4,550 4,540 4,538 4,060 3,239 Rogue River 2,155 2,145 2,145 2,140 2,135 2,131 1,851 1,759 Shady Cove 3,015 2,920 2,920 2,910 2,905 2,904 2,307 1,351 Talent 6,230 6,170 6,115 6,095 6,070 6,066 5,589 3,274 Unincorporated 64,905 63,910 62,725 62,620 62,530 62,516 63,220 59,831 JEFFERSON 22,205 22,040 21,940 21,845 21,750 21,720 19,009 13,676 Culver 1,380 1,370 1,370 1,370 1,365 1, Madras 6,260 6,255 6,260 6,225 6,050 6,046 5,078 3,443 Metolius Unincorporated 13,865 13,710 13,605 13,540 13,625 13,607 12,400 9,213 12
13 County and July 1 Estimates April 1 Census Cities rev JOSEPHINE 83,105 82,815 82,775 82,820 82,775 82,713 75,726 62,649 Cave Junction 1,905 1,905 1,900 1,885 1,885 1,883 1,363 1,126 Grants Pass 35,060 34,855 34,740 34,660 34,555 34,533 23,003 17,503 Unincorporated 46,140 46,055 46,135 46,275 46,335 46,297 51,360 44,020 KLAMATH 66,910 66,810 66,740 66,580 66,505 66,380 63,775 57,702 Bonanza Chiloquin Klamath Falls 21,500 21,495 21,465 21,120 20,925 20,840 19,460 17,737 Malin Merrill Unincorporated 42,565 42,465 42,425 42,610 42,724 42,742 41,648 37,407 LAKE 7,990 7,940 7,920 7,885 7,890 7,895 7,422 7,186 Lakeview 2,300 2,300 2,300 2,300 2,295 2,294 2,474 2,526 Paisley Unincorporated 5,445 5,395 5,375 5,340 5,350 5,358 4,701 4,310 LANE 358, , , , , , , ,912 Coburg 1,045 1,045 1,045 1,045 1,040 1, Cottage Grove 9,840 9,785 9,770 9,745 9,705 9,686 8,445 7,403 Creswell 5,075 5,020 4,990 5,015 5,030 5,031 3,579 2,431 Dunes City 1,315 1,310 1,305 1,305 1,305 1,303 1,241 1,081 Eugene 160, , , , , , , ,733 Florence 8,565 8,480 8,470 8,470 8,465 8,466 7,263 5,171 Junction City 5,620 5,550 5,445 5,445 5,430 5,392 4,721 3,692 Lowell 1,060 1,060 1,055 1,045 1,045 1, Oakridge 3,220 3,215 3,210 3,205 3,205 3,205 3,172 3,063 Springfield 60,065 59,990 59,840 59,695 59,425 59,403 52,864 44,664 Veneta 4,690 4,635 4,610 4,610 4,565 4,561 2,762 2,519 Westfir Unincorporated 97,280 96,200 95,870 96,310 96,245 96,150 98,908 98,329 LINCOLN 46,890 46,560 46,295 46,155 46,135 46,034 44,479 38,889 Depoe Bay 1,410 1,405 1,400 1,400 1,400 1,398 1, Lincoln City 8,400 8,380 7,965 7,960 7,935 7,930 7,437 5,903 Newport 10,095 10,160 10,150 10,065 10,030 9,989 9,532 8,437 Siletz 1,235 1,235 1,225 1,210 1,210 1,212 1,
14 County and July 1 Estimates April 1 Census Cities rev Toledo 3,485 3,470 3,465 3,485 3,470 3,465 3,472 3,174 Waldport 2,060 2,050 2,040 2,040 2,035 2,033 2,050 1,595 Yachats Unincorporated 19,485 19,145 19,345 19,285 19,365 19,317 19,064 17,385 LINN 119, , , , , , ,069 91,227 Albany (part)* 44,124 43,808 43,946 43,822 43,738 43,695 35,748 29,525 Brownsville 1,680 1,670 1,670 1,670 1,670 1,668 1,449 1,281 Gates (part)* Halsey Harrisburg 3,635 3,630 3,630 3,585 3,565 3,567 2,795 1,939 Idanha (part)* Lebanon 15,740 15,690 15,660 15,565 15,525 15,518 12,950 10,950 Lyons 1,160 1,160 1,160 1,160 1,160 1,161 1, Mill City (part)* 1,549 1,544 1,543 1,539 1,531 1,531 1,225 1,247 Millersburg 1,505 1,430 1,375 1,375 1,345 1, Scio Sodaville Sweet Home 9,060 9,065 9,025 9,005 8,945 8,925 8,016 6,850 Tangent 1,195 1,185 1,180 1,180 1,165 1, Waterloo Unincorporated 37,667 37,098 36,461 36,044 35,807 35,738 36,219 35,400 MALHEUR 31,470 31,440 31,395 31,445 31,345 31,313 31,615 26,038 Adrian Jordan Valley Nyssa 3,285 3,270 3,270 3,270 3,265 3,267 3,163 2,629 Ontario 11,465 11,465 11,415 11,375 11,365 11,366 10,985 9,394 Vale 1,875 1,890 1,890 1,875 1,875 1,874 1,976 1,491 Unincorporated 14,490 14,460 14,460 14,565 14,485 14,448 15,105 12,029 MARION 326, , , , , , , ,483 Aumsville 3,895 3,815 3,700 3,680 3,605 3,584 3,003 1,650 Aurora Detroit Donald Gates (part)* Gervais 2,530 2,520 2,520 2,520 2,510 2,464 2,
15 County and July 1 Estimates April 1 Census Cities rev Hubbard 3,220 3,200 3,185 3,180 3,175 3,173 2,483 1,881 Idanha (part)* Jefferson 3,165 3,150 3,140 3,135 3,115 3,098 2,487 1,805 Keizer 36,985 36,795 36,735 36,715 36,570 36,478 32,203 21,884 Mill City (part)* Mt. Angel 3,395 3,310 3,285 3,285 3,285 3,286 3,121 2,778 St. Paul Salem (part)* 134, , , , , , ,040 94,990 Scotts Mills Silverton 9,460 9,330 9,290 9,265 9,230 9,222 7,414 5,635 Stayton 7,700 7,685 7,660 7,660 7,645 7,644 6,816 5,011 Sublimity 2,760 2,745 2,680 2,680 2,680 2,681 2,148 1,491 Turner 1,900 1,865 1,865 1,860 1,855 1,854 1,199 1,281 Woodburn 24,455 24,330 24,090 24,090 24,085 24,080 20,100 13,404 Unincorporated 88,887 87,369 86,622 85,059 83,642 83,664 79,719 72,919 MORROW 11,525 11,425 11,300 11,270 11,175 11,173 10,995 7,625 Boardman 3,445 3,405 3,235 3,235 3,220 3,220 2,855 1,387 Heppner 1,290 1,290 1,290 1,290 1,290 1,291 1,395 1,412 Ione Irrigon 1,885 1,835 1,830 1,830 1,825 1,826 1, Lexington Unincorporated 4,320 4,310 4,375 4,345 4,270 4,269 4,459 3,548 MULTNOMAH 765, , , , , , , ,887 Fairview 8,935 8,930 8,920 8,920 8,920 8,920 7,561 2,391 Gresham 106, , , , , ,594 90,205 68,249 Lake Oswego (part)* 2,558 2,554 2,554 2,551 2,544 2,544 2,274 2,253 Maywood Park Portland (part)* 599, , , , , , , ,898 Troutdale 16,020 16,015 16,005 16,000 15,980 15,962 13,777 7,852 Wood Village 3,905 3,895 3,890 3,885 3,875 3,878 2,860 2,814 Unincorporated 27,966 28,393 24,798 20,478 17,637 16,199 16,046 62,649 POLK 77,735 77,065 76,625 75,965 75,495 75,403 62,380 49,541 Dallas 14,940 14,800 14,670 14,620 14,590 14,583 12,459 9,422 Falls City Independence 8,605 8,585 8,585 8,600 8,600 8,590 6,035 4,425 15
16 County and July 1 Estimates April 1 Census Cities rev Monmouth 9,620 9,720 9,755 9,720 9,545 9,534 7,741 6,288 Salem (part)* 25,238 24,755 24,478 24,410 24,312 24,239 17,884 12,803 Willamina (part)* Unincorporated 17,534 17,408 17,347 16,825 16,658 16,665 16,579 15,231 SHERMAN 1,785 1,780 1,765 1,765 1,765 1,765 1,934 1,918 Grass Valley Moro Rufus Wasco Unincorporated TILLAMOOK 25,480 25,375 25,305 25,255 25,260 25,250 24,262 21,570 Bay City 1,320 1,310 1,305 1,295 1,290 1,286 1,149 1,027 Garibaldi Manzanita Nehalem Rockaway Beach 1,325 1,325 1,320 1,320 1,315 1,312 1, Tillamook 4,880 4,885 4,880 4,905 4,920 4,935 4,352 4,006 Wheeler Unincorporated 15,865 15,755 15,720 15,660 15,670 15,655 15,437 13,601 UMATILLA 78,340 77,895 77,120 76,580 76,000 75,889 70,548 59,249 Adams Athena 1,125 1,125 1,125 1,125 1,125 1,126 1, Echo Helix Hermiston 17,345 17,240 16,995 16,865 16,795 16,745 13,154 10,047 Milton-Freewater 7,060 7,060 7,050 7,055 7,045 7,050 6,470 5,533 Pendleton 16,700 16,780 16,715 16,625 16,605 16,612 16,354 15,142 Pilot Rock 1,505 1,505 1,505 1,505 1,505 1,502 1,532 1,478 Stanfield 2,115 2,095 2,075 2,055 2,045 2,043 1,979 1,568 Ukiah Umatilla 7,050 7,025 7,015 6,980 6,905 6,906 4,978 3,046 Weston Unincorporated 23,240 22,895 22,470 22,215 21,870 21,819 22,758 19,709 16
17 County and July 1 Estimates April 1 Census Cities rev UNION 26,485 26,325 26,175 25,980 25,810 25,748 24,530 23,598 Cove Elgin 1,725 1,725 1,725 1,725 1,710 1,711 1,654 1,586 Imbler Island City 1,025 1,015 1,015 1,010 1, La Grande 13,150 13,125 13,110 13,095 13,095 13,082 12,327 11,766 North Powder Summerville Union 2,150 2,150 2,145 2,140 2,130 2,121 1,926 1,847 Unincorporated 7,000 6,875 6,745 6,575 6,445 6,413 6,223 6,307 WALLOWA 7,070 7,045 7,015 6,995 7,005 7,008 7,226 6,911 Enterprise 1,940 1,940 1,940 1,940 1,940 1,940 1,895 1,905 Joseph 1,095 1,095 1,090 1,090 1,085 1,081 1,054 1,073 Lostine Wallowa Unincorporated 3,010 2,985 2,960 2,945 2,955 2,966 3,145 2,954 WASCO 26,105 25,810 25,485 25,300 25,235 25,213 23,791 21,683 Antelope Dufur Maupin Mosier Shaniko The Dalles 14,480 14,440 14,440 14,440 13,630 13,620 12,156 11,021 Unincorporated 10,070 9,820 9,495 9,320 10,065 10,056 10,141 9,375 WASHINGTON 560, , , , , , , ,554 Banks 1,775 1,775 1,775 1,775 1,775 1,777 1, Beaverton 93,395 91,935 91,205 90,835 89,925 89,803 76,129 53,307 Cornelius 11,910 11,915 11,915 11,915 11,875 11,869 9,652 6,148 Durham 1,880 1,880 1,365 1,360 1,355 1,351 1, Forest Grove 22,715 22,340 21,460 21,275 21,130 21,083 17,708 13,559 Gaston Hillsboro 95,310 93,340 92,550 92,350 91,970 91,611 70,186 37,598 King City 3,365 3,320 3,225 3,135 3,115 3,111 1,949 2,060 Lake Oswego (part)* North Plains 2,015 2,015 1,990 1,990 1,970 1,947 1,
18 County and July 1 Estimates April 1 Census Cities rev Portland (part)* 1,564 1,558 1,558 1,552 1,547 1,547 1,388 1,197 Rivergrove (part)* Sherwood 18,955 18,575 18,265 18,255 18,205 18,194 11,791 3,093 Tigard 49,140 49,135 48,695 48,415 48,090 48,035 41,223 29,435 Tualatin (part)* 24,022 23,606 23,215 23,251 23,191 23,192 20,127 13,258 Wilsonville (part)* 2,386 2,363 2,248 2,144 2,140 2, Unincorporated 231, , , , , , , ,010 WHEELER 1,440 1,430 1,425 1,435 1,440 1,441 1,547 1,396 Fossil Mitchell Spray Unincorporated YAMHILL 102, , ,550 99,850 99,405 99,193 84,992 65,551 Amity 1,620 1,610 1,610 1,615 1,615 1,614 1,478 1,175 Carlton 2,070 2,065 2,035 2,035 2,015 2,007 1,514 1,289 Dayton 2,570 2,550 2,535 2,530 2,535 2,534 2,119 1,526 Dundee 3,180 3,170 3,175 3,175 3,170 3,162 2,598 1,663 Lafayette 3,825 3,755 3,735 3,740 3,740 3,742 2,586 1,292 McMinnville 32,705 32,510 32,435 32,270 32,240 32,187 26,499 17,894 Newberg 22,765 22,580 22,300 22,230 22,110 22,068 18,064 13,086 Sheridan 6,225 6,180 6,180 6,125 6,125 6,127 5,561 3,979 Willamina (part)* 1,197 1,183 1,180 1,180 1,180 1,180 1,128 1,194 Yamhill 1,050 1,030 1,020 1,020 1,020 1, Unincorporated 25,318 24,767 24,345 23,930 23,655 23,548 22,651 21,586 *City is located and has population in more than one county. Note: Cities/towns that have conducted local enumerations following Census 2010 are: Adams and Bonanza in 2010; Rivergrove and Ukiah in 2011; and Lexington in Please use caution when comparing the population estimates of the unincorporated county areas, and note that the population estimates for the unincorporated areas represent revised estimates rather than estimates resulting from measured direct change during the year. The population for an unincorporated area is a residual of the county total population and the sum of that county's city populations. The unincorporated area population is affected by those cities not submitting to PRC the completed annual form because the population of a city is held constant to the previous year if no recent form data are received. Additionally, cities sending incomplete data will affect the population residual in the unincorporated area, as do city annexations. 18
19 Table 5. s for Incorporated Cities Located in More than One County Prepared by Research Center, PSU, April City and Counties July 1 Estimate April 1 Census rev Albany 51,270 50,720 50,710 50,520 50,325 50,158 40,852 in Benton 7,146 6,912 6,764 6,698 6,587 6,463 5,104 in Linn 44,124 43,808 43,946 43,822 43,738 43,695 35,748 Gates in Linn in Marion Idanha in Linn in Marion Lake Oswego 37,105 36,990 36,770 36,725 36,620 36,619 35,278 in Clackamas 34,538 34,427 34,206 34,165 34,067 34,066 32,989 in Multnomah 2,558 2,554 2,554 2,551 2,544 2,544 2,274 in Washington Mill City 1,875 1,870 1,870 1,865 1,855 1,855 1,537 in Linn 1,549 1,544 1,543 1,539 1,531 1,531 1,225 in Marion Portland 601, , , , , , ,121 in Clackamas in Multnomah 599, , , , , , ,986 in Washington 1,564 1,558 1,558 1,552 1,547 1,547 1,388 Rivergrove* in Clackamas in Washington Salem 159, , , , , , ,924 in Marion 134, , , , , , ,040 in Polk 25,238 24,755 24,466 24,404 24,312 24,239 17,884 Tualatin 26,925 26,510 26,120 26,120 26,060 26,054 22,791 in Clackamas 2,903 2,904 2,905 2,869 2,869 2,862 2,664 in Washington 24,022 23,606 23,215 23,251 23,191 23,192 20,127 Willamina 2,045 2,030 2,025 2,025 2,025 2,025 1,844 in Polk in Yamhill 1,197 1,183 1,180 1,180 1,180 1,180 1,128 Wilsonville 21,980 21,550 20,515 19,565 19,525 19,509 13,991 in Clackamas 19,594 19,187 18,267 17,421 17,385 17,371 13,987 in Washington 2,386 2,363 2,248 2,144 2,140 2,138 4 *A local enumeration was conducted in
20 Table 6. Rank of Incorporated Cities by July 1, 2014 Size Prepared by Research Center, PSU, April City City City City City Portland Astoria 9,590 Dayton 2,570 Athena 1,125 Scotts Mills 365 Eugene Silverton 9,460 Gervais 2,530 Joseph 1,095 Ione 330 Salem Prineville 9,385 Myrtle Point 2,525 Lowell 1,060 Moro 325 Gresham Sweet Home 9,060 Lakeview 2,300 Yoncalla 1,060 Sodaville 310 Hillsboro Fairview 8,935 Gold Beach 2,275 Yamhill 1,050 Imbler 305 Beaverton Molalla 8,820 Sisters 2,190 Coburg 1,045 Halfway 290 Bend Eagle Point 8,635 Rogue River 2,155 Island City 1,025 Nehalem 280 Medford Independence 8,605 Union 2,150 Donald 975 Rufus 280 Springfield Florence 8,565 Stanfield 2,115 Aurora 950 Lexington 255 Corvallis Lincoln City 8,400 Carlton 2,070 Falls City 950 Westfir 255 Albany Sutherlin 7,945 Vernonia 2,065 Oakland 935 Paisley 245 Tigard Stayton 7,700 Waldport 2,060 Halsey 915 Ukiah 245 Lake Oswego Hood River 7,545 Willamina 2,045 Prairie City 910 Waterloo 230 Keizer Milton-Freewater 7,060 North Plains 2,015 Glendale 875 Lostine 215 Grants Pass Umatilla 7,050 Columbia City 1,945 Adair Village 845 Detroit 210 Oregon City Scappoose 6,700 Enterprise 1,940 Merrill 840 Elkton 205 McMinnville Seaside 6,560 Canyonville 1,910 Scio 830 Sumpter 205 Tualatin Brookings 6,535 Cave Junction 1,905 Malin 815 Seneca 200 Redmond Madras 6,260 Rainier 1,905 Wallowa 810 Helix 195 West Linn Talent 6,230 Turner 1,900 Garibaldi 790 Long Creek 195 Woodburn Sheridan 6,225 Irrigon 1,885 Maywood Park 750 Adrian 180 Newberg Junction City 5,620 Durham 1,880 Chiloquin 735 Jordan Valley 175 Forest Grove Winston 5,410 Mill City 1,875 Yachats 720 Richland 175 Roseburg Warrenton 5,175 Vale 1,875 Canyon City 705 Grass Valley 165 Wilsonville Creswell 5,075 Banks 1,775 Echo 705 Spray 160 Klamath Falls Tillamook 4,880 Clatskanie 1,750 Metolius 700 Dayville 150 Milwaukie Veneta 4,690 John Day 1,745 Powers 700 Idanha 140 Ashland Philomath 4,630 Elgin 1,725 Condon 695 Barlow 135 Sherwood Phoenix 4,580 Cannon Beach 1,705 Weston 685 Summerville 135 Central Point Reedsport 4,150 Lakeside 1,705 Gaston 640 Mitchell 130 Hermiston Wood Village 3,905 Brownsville 1,680 Monroe 620 Monument 130 Pendleton Aumsville 3,895 La Pine 1,670 Manzanita 615 Unity 70 Happy Valley Coquille 3,870 Amity 1,620 Arlington 605 Prescott 55 Coos Bay Lafayette 3,825 Hines 1,560 Dufur 605 Antelope 50 Troutdale Harrisburg 3,635 Millersburg 1,505 Johnson City 565 Granite 40 Canby Toledo 3,485 Pilot Rock 1,505 Cove 550 Shaniko 35 Lebanon Myrtle Creek 3,465 Gearhart 1,475 Mt. Vernon 525 Lonerock 20 Dallas Boardman 3,445 Depoe Bay 1,410 Gates 485 Greenhorn 2 The Dalles Mt. Angel 3,395 Culver 1,380 Rivergrove 485 La Grande King City 3,365 Rockaway Beach 1,325 Fossil 475 St. Helens Nyssa 3,285 Bay City 1,320 Bonanza 455 Cornelius Hubbard 3,220 Dunes City 1,315 Huntington 445 Gladstone Oakridge 3,220 Heppner 1,290 North Powder 445 Ontario Dundee 3,180 Cascade Locks 1,235 Mosier 440 Damascus Jefferson 3,165 Siletz 1,235 Butte Falls 430 Sandy Bandon 3,105 Gold Hill 1,220 Maupin 425 Newport Shady Cove 3,015 Tangent 1,195 St. Paul 425 Baker City 9890 Estacada 2,935 Riddle 1,185 Haines 415 Cottage Grove 9840 Jacksonville 2,840 Drain 1,160 Wasco 415 North Bend 9730 Burns 2,835 Lyons 1,160 Wheeler 405 Monmouth 9620 Sublimity 2,760 Port Orford20 1,135 Adams 370
21 Table 7. Alphabetical Listing of Incorporated Cities with for July 1, 2014, Census 2010 and since Census Prepared by Research Center, PSU, April City Estimate July 1, 2014 Census April 1, Percent Estimate July 1, 2014 Census April 1, Percent Adair Village % Dunes City 1,315 1, % Adams % Durham 1,880 1, % Adrian % Eagle Point 8,635 8, % Albany 51,270 50,158 1, % Echo % Amity 1,620 1, % Elgin 1,725 1, % Antelope % Elkton % Arlington % Enterprise 1,940 1, % Ashland 20,340 20, % Estacada 2,935 2, % Astoria 9,590 9, % Eugene 160, ,185 4, % Athena 1,125 1, % Fairview 8,935 8, % Aumsville 3,895 3, % Falls City % Aurora % Florence 8,565 8, % Baker City 9,890 9, % Forest Grove 22,715 21,083 1, % Bandon 3,105 3, % Fossil % Banks 1,775 1, % Garibaldi % Barlow % Gaston % Bay City 1,320 1, % Gates % Beaverton 93,395 89,803 3, % Gearhart 1,475 1, % Bend 79,985 76,639 3, % Gervais 2,530 2, % Boardman 3,445 3, % Gladstone 11,495 11, % Bonanza % Glendale % Brookings 6,535 6, % Gold Beach 2,275 2, % Brownsville 1,680 1, % Gold Hill 1,220 1, % Burns 2,835 2, % Granite % Butte Falls % Grants Pass 35,060 34, % Canby 16,010 15, % Grass Valley % Cannon Beach 1,705 1, % Greenhorn Canyon City % Gresham 106, , % Canyonville 1,910 1, % Haines % Carlton 2,070 2, % Halfway % Cascade Locks 1,235 1, % Halsey % Cave Junction 1,905 1, % Happy Valley 16,480 13,903 2, % Central Point 17,375 17, % Harrisburg 3,635 3, % Chiloquin % Helix % Clatskanie 1,750 1, % Heppner 1,290 1, % Coburg 1,045 1, % Hermiston 17,345 16, % Columbia City 1,945 1, % Hillsboro 95,310 91,611 3, % Condon % Hines 1,560 1, % Coos Bay 16,315 15, % Hood River 7,545 7, % Coquille 3,870 3, % Hubbard 3,220 3, % Cornelius 11,910 11, % Huntington % Corvallis 56,535 54,462 2, % Idanha % Cottage Grove 9,840 9, % Imbler % Cove % Independence 8,605 8, % Creswell 5,075 5, % Ione % Culver 1,380 1, % Irrigon 1,885 1, % Dallas 14,940 14, % Island City 1, % Damascus 10,625 10, % Jacksonville 2,840 2, % Dayton 2,570 2, % Jefferson 3,165 3, % Dayville % John Day 1,745 1, % Depoe Bay 1,410 1, % Johnson City % Detroit % Jordan Valley % Donald % Joseph 1,095 1, % Drain 1,160 1, % Junction City 5,620 5, % Dufur % Keizer 36,985 36, % Dundee 3,180 3, % King City 3,365 3, % City 21
22 Table 7. Alphabetical Listing of Incorporated Cities with for July 1, 2014, Census 2010 and since Census Prepared by Research Center, PSU, April City Estimate July 1, 2014 Census April 1, Percent City Estimate July 1, 2014 Census April 1, Percent Klamath Falls 21,500 20, % Portland 601, ,776 17, % La Grande 13,150 13, % Powers % La Pine 1,670 1, % Prairie City % Lafayette 3,825 3, % Prescott % Lake Oswego 37,105 36, % Prineville 9,385 9, % Lakeside 1,705 1, % Rainier 1,905 1, % Lakeview 2,300 2, % Redmond 26,770 26, % Lebanon 15,740 15, % Reedsport 4,150 4, % Lexington % Richland % Lincoln City 8,400 7, % Riddle 1,185 1, % Lonerock % Rivergrove % Long Creek % Rockaway Beach 1,325 1, % Lostine % Rogue River 2,155 2, % Lowell 1,060 1, % Roseburg 22,510 21,181 1, % Lyons 1,160 1, % Rufus % Madras 6,260 6, % Salem 159, ,637 4, % Malin % Sandy 10,170 9, % Manzanita % Scappoose 6,700 6, % Maupin % Scio % Maywood Park % Scotts Mills % McMinnville 32,705 32, % Seaside 6,560 6, % Medford 76,650 74,907 1, % Seneca % Merrill % Shady Cove 3,015 2, % Metolius % Shaniko % Mill City 1,875 1, % Sheridan 6,225 6, % Millersburg 1,505 1, % Sherwood 18,955 18, % Milton-Freewater 7,060 7, % Siletz 1,235 1, % Milwaukie 20,485 20, % Silverton 9,460 9, % Mitchell % Sisters 2,190 2, % Molalla 8,820 8, % Sodaville % Monmouth 9,620 9, % Spray % Monroe % Springfield 60,065 59, % Monument % St. Helens 12,990 12, % Moro % St. Paul % Mosier % Stanfield 2,115 2, % Mt. Angel 3,395 3, % Stayton 7,700 7, % Mt. Vernon % Sublimity 2,760 2, % Myrtle Creek 3,465 3, % Summerville % Myrtle Point 2,525 2, % Sumpter % Nehalem % Sutherlin 7,945 7, % Newberg 22,765 22, % Sweet Home 9,060 8, % Newport 10,095 9, % Talent 6,230 6, % North Bend 9,730 9, % Tangent 1,195 1, % North Plains 2,015 1, % The Dalles 14,480 13, % North Powder % Tigard 49,140 48,035 1, % Nyssa 3,285 3, % Tillamook 4,880 4, % Oakland % Toledo 3,485 3, % Oakridge 3,220 3, % Troutdale 16,020 15, % Ontario 11,465 11, % Tualatin 26,925 26, % Oregon City 33,760 31,859 1, % Turner 1,900 1, % Paisley % Ukiah % Pendleton 16,700 16, % Umatilla 7,050 6, % Philomath 4,630 4, % Union 2,150 2, % Phoenix 4,580 4, % Unity % Pilot Rock 1,505 1, % Vale 1,875 1, % Port Orford 1,135 1, % Veneta 4,690 4, % 22
23 Table 7. Alphabetical Listing of Incorporated Cities with for July 1, 2014, Census 2010 and since Census Prepared by Research Center, PSU, April City Estimate July 1, 2014 Census April 1, Percent Vernonia 2,065 2, % Waldport 2,060 2, % Wallowa % Warrenton 5,175 4, % Wasco % Waterloo % West Linn 25,540 25, % Westfir % Weston % Wheeler % Willamina 2,045 2, % Wilsonville 21,980 19,509 2, % Winston 5,410 5, % Wood Village 3,905 3, % Woodburn 24,455 24, % Yachats % Yamhill 1,050 1, % Yoncalla 1,060 1, % *A local enumeration was conducted after Census City Estimate July 1, 2014 Census April 1, Percent
24 Table 8. Added to Incorporated Cities Due to Annexations: April 1, July 1, 2014 Prepared by Research Center, PSU, April Adair Village 0 Depoe Bay 0 Independence 1 Myrtle Creek 0 Springfield 15 Adams 0 Detroit 0 Ione 0 Myrtle Point 0 St. Helens 6 Adrian 0 Donald 0 Irrigon 0 Nehalem 0 St. Paul 0 Albany 0 Drain 0 Island City 0 Newberg 3 Stanfield 2 Amity 0 Dufur 0 Jacksonville 0 Newport 0 Stayton 2 Antelope 0 Dundee 0 Jefferson 0 North Bend 0 Sublimity 0 Arlington 0 Dunes City 0 John Day 6 North Plains 0 Summerville 0 Ashland 0 Durham 0 Johnson City 0 North Powder 0 Sumpter 0 Astoria 0 Eagle Point 0 Jordan Valley 0 Nyssa 0 Sutherlin 0 Athena 0 Echo 0 Joseph 0 Oakland 0 Sweet Home 4 Aumsville 4 Elgin 0 Junction City 0 Oakridge 0 Talent 0 Aurora 0 Elkton 0 Keizer 4 Ontario 40 Tangent 0 Baker City 0 Enterprise 0 King City 0 Oregon City 0 The Dalles 811 Bandon 0 Estacada 0 Klamath Falls 2 Paisley 0 Tigard 46 Banks 0 Eugene 6 La Grande 7 Pendleton 0 Tillamook 0 Barlow 0 Fairview 0 La Pine 0 Philomath 2 Toledo 0 Bay City 0 Falls City 0 Lafayette 0 Phoenix 0 Troutdale 0 Beaverton 378 Florence 0 Lake Oswego 11 Pilot Rock 0 Tualatin 2 Bend 0 Forest Grove 262 Lakeside 0 Port Orford 0 Turner 0 Boardman 0 Fossil 0 Lakeview 1 Portland 2 Ukiah 0 Bonanza 0 Garibaldi 0 Lebanon 2 Powers 0 Umatilla 0 Brookings 0 Gaston 0 Lexington 0 Prairie City 0 Union 0 Brownsville 0 Gates 0 Lincoln City 361 Prescott 0 Unity 0 Burns 0 Gearhart 0 Lonerock 0 Prineville 2 Vale 0 Butte Falls 0 Gervais 0 Long Creek 0 Rainier 0 Veneta 0 Canby 4 Gladstone 0 Lostine 0 Redmond 0 Vernonia 0 Cannon Beach 0 Glendale 0 Lowell 0 Reedsport 0 Waldport 0 Canyon City 0 Gold Beach 0 Lyons 0 Richland 7 Wallowa 0 Canyonville 0 Gold Hill 0 Madras 161 Riddle 0 Warrenton 0 Carlton 0 Granite 0 Malin 10 Rivergrove 0 Wasco 0 Cascade Locks 0 Grants Pass 0 Manzanita 0 Rockaway Beach 0 Waterloo 0 Cave Junction 0 Granite 0 Maupin 0 Rogue River 0 West Linn 0 Central Point 0 Grass Valley 0 Maywood Park 0 Roseburg 631 Westfir 0 Chiloquin 0 Greenhorn 0 McMinnville 0 Rufus 0 Weston 0 Clatskanie 0 Gresham 2 Medford 1 Salem 150 Wheeler 0 Coburg 0 Haines 0 Merrill 0 Sandy 0 Willamina 0 Columbia City 0 Halfway 0 Metolius 0 Scappoose 0 Wilsonville 2 Condon 0 Halsey 0 Mill City 0 Scio 0 Winston 4 Coos Bay 0 Happy Valley 38 Millersburg 0 Scotts Mills 0 Wood Village 0 Coquille 0 Harrisburg 0 Milton-Freewater 0 Seaside 0 Woodburn 0 Cornelius 0 Helix 0 Milwaukie 184 Seneca 0 Yachats 0 Corvallis 4 Heppner 0 Mitchell 0 Shady Cove 0 Yamhill 0 Cottage Grove 0 Hermiston 23 Molalla 0 Shaniko 0 Yoncalla 0 Cove 0 Hillsboro 236 Monmouth 0 Sheridan 0 Creswell 2 Hines 0 Monroe 0 Sherwood 0 Culver 0 Hood River 5 Monument 0 Siletz 0 Dallas 23 Hubbard 0 Moro 0 Silverton 0 Damascus 0 Huntington 0 Mosier 0 Sisters 0 Dayton 0 Idanha 0 Mt. Angel 0 Sodaville 0 Dayville 0 Imbler 0 Mt. Vernon 0 Spray 0 24
Table 1. Components of Annual Population Change for Oregon: 1960 to 2005***
 Table 1. Components of Annual Population Change for Oregon: 1960 to 2005*** Date Population Population Change Births Deaths Natural Increase Net Migration April 1, 1960 1,768,687 July 1, 1961 1,798,000
BRANCH AND DISTRICT DATA
 OREGON DEPARTMENT OF HUMAN SERVICES SELF SUFFICIENCY PROGRAMS BRANCH AND DISTRICT DATA APRIL 2011 STATE OF OREGON DEPARTMENT OF HUMAN SERVICES Human Services Building 500 Summer Street NE Salem, OR 97310-1013
,610 7,755 7,590 8,210 9,000 fi 18,829 16,812 18,335 18,273 20,658
 : Commodity Data Sheet All Hay Order from: Economic Information Office Agricultural and Resource Economics Oregon State University 29 Ballard Extension Hall Corvallis, OR 9733 360 Item and Area Oregon
September 15, 2016 NWN OPUC Advice No / UG 324
 ONITA R. KING Rates & Regulatory Affairs Tel: 503.721.2452 Fax: 503.721.2516 email: ork@nwnatural.com September 15, 2016 NWN OPUC Advice No. 16-18 / UG 324 VIA ELECTRONIC FILING Public Utility Commission
Oregon Department of Forestry 2015 AD/Industrial/Equipment Rates
 Oregon Department of Forestry 2015 AD/Industrial/Equipment Rates OBJECTIVE: In addition to the actual control efforts of an incident, the financial considerations and cost effectiveness of that effort
Oregon Smoke Management Annual Report
 Oregon Smoke Management Annual Report OREGON DEPARTMENT OF FORESTRY FIRE PROTECTION DIVISION SMOKE MANAGEMENT AND FUELS General File 1-2-5-910 OREGON SMOKE MANAGEMENT ANNUAL REPORT Prepared By: FIRE PROTECTION
2011 EASTERN OREGON DEER RIFLE SEASONS
 MINAM 60 Minam Unit 160 485 1953 164 164 34 Upper Wallowa Valley #1 660A1 14 21 10 10 71 Upper Wallowa Valley #2 660A2 Not Surveyed Upper Wallowa Valley #3 660A3 15 38 12 12 80 Lostine/Allen Canyon 660B
Child Passenger Safety Senior Checker Update. Ruth Harshfield, Safe Kids Oregon Director February 4, 2015
 Child Passenger Safety Senior Checker Update Ruth Harshfield, Safe Kids Oregon Director February 4, 2015 Webinar Objectives Safe Kids Buckle Up (SKBU) Program Senior Checker Protocol Hot Tips Safe Kids
Total Days Doe 1 Point 2 Point 3 Point 4 + Point
 Estimated 2013 Deer harvest by season/tag and Wildlife Management Unit in Oregon, based on Mandatory Survey Reports. s may be different due to rounding. 100M N Muzzleloader 14 108 559 9 3 10 9 17 39 47
UNITED STATES DEPARTMENT OF AGRICULTURE. Compilation of Statistical Material. Pacific Northwest Federal Milk Marketing Order. Federal Order No.
 UNITED STATES DEPARTMENT OF AGRICULTURE 1930-220th St. SE, Ste. 102 AGRICULTURAL MARKETING SERVICE 10050 N 25th Ave., Ste. 302 Bothell, WA 98021-8471 DAIRY PROGRAMS Phoenix, AZ 85021-1664 Phone: (425)
BEFORE THE PUBLIC UTILITY COMMISSION OF OREGON UM 1452
 ENTERED JAN 222014 BEFORE THE PUBLIC UTILITY COMMISSION OF OREGON UM 1452 In the Matter of PUBLIC UTILITY COMMISSION OF OREGON, ORDER Investigation into Pilot Programs to demonstrate the use and effectiveness
Contact Info. OHSET Judge and Apprentice List
 Phil Armstrong 27071 S. Benjamin Rd Estacada OR 97023 (503) 630-2369 (503) 936-6873 jpa@rconnects.com Chris Bergsengruch 77870 Erickson Dike Rd Clatskane OR 97016 - (503) 704-0692 naughtynag@cni.net Tabatha
2017 Estimated Rifle Buck Deer Harvest by Zone,Wildlife Management Unit and Hunt, based on Mandatory Harvest Survey Reports. Seas Type Zone Unit Name
 Controlled Northwest 1730 10 261 0 113 88 60 271 Alsea W General Deer w/ 119A 57 0 15 0 4 8 3 15 26% McKenzie 119A High Cascade 184 0 28 0 10 4 14 28 15% W General Deer w/ 119A 242 0 38 0 16 14 8 38 Saddle
9th Oregon Super Senior Championship OGA Golf Course Gross Results for Nicklaus Flight Rank Player Name, City, State Overall Rnd 1 Rnd 2 Total Award
 Gross Results for Nicklaus Flight 1 ***Chris Maletis, Portland, OR -5 70 69 139 $175.00 2 **Tom Carlsen, Bend, OR +2 72 74 146 $150.00 3 Carey Watson, Sunriver, OR +3 72 75 147 $100.00 4 Gaylord Davis,
Year Over Year Unemployment Rates Decline Or Hold Steady In All 12 Wisconsin Metro Areas For 58 th Consecutive Month
 Department of Workforce Development Secretary s Office 201 E. Washington Avenue P.O. Box 7946 Madison, WI 53707 Telephone: (608) 266-3131 Fax: (608) 266-1784 Email: sec@dwd.wisconsin.gov Scott Walker,
Wisconsin Local Employment & Unemployment Estimates Released
 Department of Workforce Development Secretary s Office 201 E. Washington Avenue P.O. Box 7946 Madison, WI 53707 Telephone: (608) 266-3131 Fax: (608) 266-1784 Email: sec@dwd.wisconsin.gov Scott Walker,
2002 ANNUAL REPORT OF HAZARDOUS MATERIAL INCIDENTS IN OREGON
 2002 ANNUAL REPORT OF HAZARDOUS MATERIAL INCIDENTS IN OREGON AS REPORTED BY OREGON FIRE SERVICE Department of Oregon State Police Office of State Fire Marshal Hazardous Substance Information System 4760
SEARCH AND RESCUE. Annual Report. for. Oregon Military Department. Oregon Emergency Management
 SEARCH AND RESCUE Annual Report for 2010 Oregon Emergency Management Oregon Military Department TABLE OF CONTENTS SAR Report... 1 Transportation and Work Hours for 2010... 19 Missions per County.... 20
Filmed in Oregon
 Filmed in Oregon 1908-2015 PROJECT (listed by release date) YEAR LOCATION TYPE Grimm* (NBC - Season 5) 2015 Portland Area Series The Librarians (TNT - Season 2) 2015 Portland Area Series Portlandia* (IFC
2004 ANNUAL REPORT OF HAZARDOUS MATERIAL INCIDENTS IN OREGON 4/13/06
 2004 ANNUAL REPORT OF HAZARDOUS MATERIAL INCIDENTS IN OREGON 4/13/06 Oregon State Police Office of State Fire Marshal Hazardous Substance Information System 4760 Portland Road NE Salem OR 97305-1760 503-373-1540,
OREGON STATE FIRE MARSHAL Hazmat Rail Safety HB Chad Hawkins Hazmat Rail Coordinator
 OREGON STATE FIRE MARSHAL Hazmat Rail Safety HB 3225 Chad Hawkins Hazmat Rail Coordinator Oil Train Routes Needs Assessment Survey Does your agency have necessary equipment? Level of Hazmat response to
fuel kits 2 Tool Combo 1/2" Hammer Drill/Driver # Hammer Drill/Driver 1/2" Hammer Drill/Driver (2) Batteries M18 kits
 Batteries M18 kits") Only Pro Competitor Tools Qualify (14.4V or Greater) Eligible Competitive Brands are Limited to Dewalt, Makita, Bosch, Hitachi and Panasonic Eligible Milwaukee Products Include NI-CAD or V18 Kits Trade-In
Only Pro Competitor Tools Qualify (14.4V or Greater) Eligible Competitive Brands are Limited to Dewalt, Makita, Bosch, Hitachi and Panasonic Eligible Milwaukee Products Include NI-CAD or V18 Kits Trade-In
Oregon Compensable Fatality Report
 Oregon Compensable Fatality Report Calendar Year 2002 Research & Analysis Section Oregon Dept. of Consumer & Business Services October 2004 Oregon Compensable Fatality Report Department of Consumer & Business
Industrial & Datacomm Solutions from
 Industrial & Datacomm Solutions from Cable Management Faceplates Jacks Patch Panels Patch Cords Raceway Ring Terminals STOCKED AND READY TO DELIVER! Online at PLATT.com and on Your Phone with the PLATT
Nebraska Historical Populations. Quick Reference Tables
 Nebraska Historical Populations Quick Reference Tables Annual U.S. and Nebraska Population Estimates since 1900 Annual State Components of Population Change since 1920 State Sex by 5-Year Age Group Populations:
House Committee on Transportation Policy Public Hearing HB April 5, 2017
 REPRESENTATIVE RICH VIAL OREGON HOUSE OF REPRESENTATIVES HOUSE DISTRICT 26 House Committee on Transportation Policy Public Hearing HB 3231 April 5, 2017 Background House District 26 Wilsonville Sherwood
Ten-year Plan. Figure 1 and Table 1. Each of the facilities shown in the plan is described in greater depth in the last appendix of this report.
 Ten-year Plan As a result of the analysis completed for the 2009 System Assessment, the follow-up sensitivity studies, analysis completed by the study teams, and individual planning participant studies,
Guide to the 2011 Commercial Vehicle Safety Plan
 Summary of Oregon Truck Safety and Guide to the 2011 Commercial Vehicle Safety Plan Oregon Department of Transportation Motor Carrier Transportation Division Oregon Department of Transportation Motor Carrier
CONGRATULATIONS! Y our involvement is the single most significant investment we have to ensure the trails stay open!
 4 CONGRATULATIONS! You are taking the first step towards having a great OHV experience in Oregon! Oregon s off-highway vehicle (OHV) laws and rules have been created to promote safety and protection for
Project Summary Table
 YCTA FY 019-01 STIF - DRAFT Summary Table ID Time Frame Initial Impl. Year Name Area(s) / Page # STIF & Original Sort Order Committee (10/18/18) within One-Time ning/ Admin Cost (10%) 4 Hold for Future
BUY IN WERNER GOODS* FREE 6' STEPLADDER. * Purchase to be on single invoice. Orders not to be combined. Offer valid through June 24th, 2013.
 UY 500 IN WERNER GOODS* FREE 4' STEPLDDER GET UY 700 IN WERNER GOODS* FREE STEPLDDER GET UY 900 IN WERNER GOODS* FREE STEPLDDER GET * Purchase to be on single invoice. Orders not to be combined. Offer
January Hogan Roseburg, Oregon. sunday monday tuesday wednesday thursday friday saturday. New Year s Day. Martin Luther King, Jr.
 January 2017 1 2 3 4 5 6 7 New Year s Day 8 9 10 11 12 13 14 15 16 17 18 19 20 21 Martin Luther King, Jr. Day 22 23 24 25 26 27 28 29 30 31 Hogan Roseburg, Oregon Lola Portland, Oregon February 2017 1
General Decision Number: OR /06/2013 OR17. Superseded General Decision Number: OR State: Oregon. Construction Type: Residential
 Page 1 of 7 > General Decision Number: OR130017 09/06/2013 OR17 Superseded General Decision Number: OR20120017 State: Oregon Construction Type: Residential County: Multnomah County in Oregon. RESIDENTIAL
North Oregon Coast Area Study. Adam Lint
 North Oregon Coast Area Study Adam Lint PAGE 2 North Oregon Coast System Overview - Clatsop Study Covers: Transmission Switching Stations (Clatsop District): Astoria Lewis and Clark 115 kv Distribution
Process Timeline. Area Bubbles. Legend. Problem Area that have been resolved. Recurring Areas from previous System Assessment.
 Process Timeline Legend Problem Area that have been resolved Recurring Areas from previous System Assessment New Areas Area Bubbles Flows Modeled for One-Year Heavy Winter Peak Conditions Base Case Conditions
Portland Public Schools Enrollment Forecasts, to : Based on October 2016 Enrollments
 Portland State University PDXScholar School District Enrollment Forecast Reports Population Research Center 11-2017 Portland Public Schools Enrollment Forecasts, 2017-18 to 2031-32: Based on October 2016
Four time, Three time, Two time State Champions 2009 Present
 Acuff Justin 12 Sheridan 2015 3A 138 1 Acuff Justin 10 Sheridan 2013 3A 132 1 Acuff Justin 9 Sheridan 2012 3A 120 1 Arnpriester Dillon 12 Glendale 2010 2A1A 160 1 Arnpriester Dillon 11 Glendale 2009 2A/1A
Association of Major Power Customers of BC (AMPC) BCUC Inquiry into the BC MRS Program, Project No:
 BCUC Inquiry into the BC MRS Program, Project No:") C14-8 Association of Major Power Customers of BC (AMPC) BCUC Inquiry into the BC MRS Program, Project No: 3698691 Response to Information Request No.1 of FortisBC April 26, 2013 1.0 Reference: B. General
C14-8 Association of Major Power Customers of BC (AMPC) BCUC Inquiry into the BC MRS Program, Project No: 3698691 Response to Information Request No.1 of FortisBC April 26, 2013 1.0 Reference: B. General
WHEDA. Wisconsin Standard Multifamily Tax Subsidy Project Estimated Maximum Income and Rent Limits. Effective April 1, 2018
 di, WHEDA Wisconsin Standard Multifamily Tax Subsidy Project Estimated Maximum Income and Rent Limits Estimated Maximum Family Income Limits at 30% of HUD Estimated 2018 County Median Income Brown 16,290
Gillette Lost the Most Residents in 2017
 FOR IMMEDIATE RELEASE Thursday, May 24, 2018 Contact: Dr. Wenlin Liu, Chief Economist Gillette Lost the Most Residents in 2017 CHEYENNE Cities that lost the most residents in Wyoming between July 1, 2016
Transmission Planning Report
 Transmission Planning Report Board of Directors Meeting December 15, 2010 1 Overview Study Team Reports Puget Sound Area Study Team Northern Mid-Columbia Study Team Cross Cascades Study Team Centralia
Wisconsin Housing Statistics
 Wisconsin Housing Statistics Monthly Year-to-Date Dec 2018 Dec 2017 % Change Jan-Dec 2018 Jan-Dec 2017 % Change Unit Sales 4,980 5,728-13.1% 82,760 84,594-2.2% Median Price $179,000 $170,000 +5.3% $184,000
Portland General Electric. Electric Service Requirements August 2014 Supplement
 Electric Service Requirements 2014-2015 August 2014 Supplement Copyright 2014. All rights reserved. No part of this publication may be reproduced without prior written permission of. Information in this
TOOLS BEST PRICES 75 $ BUY A GET A SELF FEEDING SPACE BIT KIT BUY A GET A MULTI-HOLE STEP BIT BUY A GET A FREE FREE FREE
 Speed and Simplicity Expires 12/31/12 TOOLS BEST PRICES 75 249 795 #025209 #024993 #025128 BUY A HOLE SAW KIT GET A SELF FEEDING SPACE BIT KIT FREE 37 VALUE! BUY A GET A KNOCKOUT PUNCH KIT MULTI-HOLE STEP
1998 Beaver Freezer Results
 1998 Beaver Freezer Results Age Groups (Overall Female and Male below) Female under 14 1. 24 Molly Malone (Philomath, OR): 01:25:30 new record Female 15-19 1. 81 Honey Robbins (Vancouver, WA): 01:23:00
CLEAN WATER SERVICES TECHNIQUES FOR EVALUATING FORCE MAIN CORROSION PROBLEMS
 CLEAN WATER SERVICES TECHNIQUES FOR EVALUATING FORCE MAIN CORROSION PROBLEMS PNCWA 2012 Annual Conference & Exhibition October 21-24 Boise, ID Presented by: Mike Kebbe, P.E., Clean Water Services Acknowledgements:
Region NC. Page 1 of 6. Total Salt. Total Salt. Salt. Total Salt. Total LM per Anti- Icing. Lane. Total Clear- Total Thaw- Total Sand.
 NC per Hours Hours Mat'l Equip Labor Cost to ADAMS 193.2 95.64 76.0 13 28 14 11 4,318 3,474 844 18.0 0 0 76 1147.0 338.0 $1,676 $440 $340 $2,455 $473,350 0.19 IRON 249.56 163.59 192.0 0 47 16 10 7,308
Region NC. Page 1 of 6. Total Salt. Total Salt. Severity Index. Total Salt. Salt. Total Sand. Total Clear- Total Thaw- Lane.
 Notes: 1) Costs shown in table are estimated and do not include the 4.44% Administrative Costs; 2) Material Costs includes,, and other Deicing and icing Agents; 3) Equipment Costs are based on $60 per
WA Plug-in Electric Vehicle Update through December 2018
 WA Plug-in Electric Vehicle Update through December 2018 For the past several years, WSDOT has provided a semi-annual update on the number of plug-in electric vehicles (PEV) registered in the state. Department
The Partnership For Multiemployer Retirement Security A Business And Labor Initiative
 The Partnership For Multiemployer Retirement Security A Business And Labor Initiative October 31, 2014 U.S. Senator Ron Wyden Chairman, Senate Finance Committee 221 Dirksen Senate Office Bldg. Washington,
The Green Dividend. Cities facilitate less driving, saving money and stimulating the local economy. Joseph Cortright, Impresa September 2007
 The Green Dividend Cities facilitate less driving, saving money and stimulating the local economy Joseph Cortright, Impresa September 2007 Does being green pay? Is conservation just noble self-sacrifice;
Directory of Oregon Soil and Water Conservation Districts (SWCDs) Prepared by the Oregon Department of Agriculture Natural Resources Division
 Prepared by the Oregon Department of Agriculture Natural Resources Division") Directory of Oregon Soil and Water Conservation Districts (SWCDs) Prepared by the Oregon Department of Agriculture Natural Resources Division June 2007 This document is also available online and updated
Directory of Oregon Soil and Water Conservation Districts (SWCDs) Prepared by the Oregon Department of Agriculture Natural Resources Division June 2007 This document is also available online and updated
Contemporary Immigration in Iowa: Hispanics, Language, and Foreign Born
 Contemporary Immigration in Iowa: Hispanics, Language, and Foreign Born Iowa Sandra Charvat Burke Community Vitality Center scburke@iastate.edu www.cvcia.org 2 Contents: Contents and Introduction. p. 2
Case # Defendant(s) Property Address Sale Date Status Credit Bid Attorney/Misc 40 18CV34367 Deveraux 5925 Rombauer Rd., Eugene 3/19/2019 Aldridge
 Property Address Sale Date Status Credit Bid Attorney/Misc 40 18CV34367 Deveraux 5925 Rombauer Rd., Eugene 3/19/2019 Aldridge") Lane County Sheriff's Office Real Property Sales Sales will be held at 10:00 am in the main lobby of the Lane County Sheriff's Office, 125 E. 8th Avenue, Eugene, Oregon. For more information, contact the
Lane County Sheriff's Office Real Property Sales Sales will be held at 10:00 am in the main lobby of the Lane County Sheriff's Office, 125 E. 8th Avenue, Eugene, Oregon. For more information, contact the
Season Totals by Port for All Weeks
 Salmon Fishery Estimates for the Area from Cape Falcon to the Oregon/California Border No. Fish Harvested No. Fish Released Retained Catch Port Per Garibaldi 6,372 2,206 697 1,213 125 0.46 Pacific City
New Home Trends Push Reports. Report Definitions and Samples
 New Home Trends Push Reports Report Definitions and Samples Finished Lot Sales...2 Finished Lot Sales Quarterly Report... 5 Builder Inventory Report... 8 Builder Snapshot...11 Newly Recorded Plats...14
Wisconsin Multifamily Tax Subsidy Project Housing and Economic Recovery Act (HERA Special) Income and Rent Limits
 Income and Rent Limits") Housing and Economic Recovery Act (HERA Special) Income and Rent Limits Income Limits * Housing and Economic Recovery Act (HERA Special) Income Limits for 2013 at 30% Family Size: ONE TWO THREE FOUR FIVE
Housing and Economic Recovery Act (HERA Special) Income and Rent Limits Income Limits * Housing and Economic Recovery Act (HERA Special) Income Limits for 2013 at 30% Family Size: ONE TWO THREE FOUR FIVE
Florida County Detention Facilities Average Inmate Population 2008 Annual Report
 Florida County Detention Facilities Average Inmate Population 2008 Annual Report Walter A. McNeil Secretary Prepared by: Florida Department of Corrections Bureau of Research and Data Analysis 2601 Blair
Population Projections
 College of Liberal Arts and Sciences Bureau of Economic and Business Research Florida Population Studies Bulletin 169, June 2014 by Age, Sex, Race, and Hispanic Origin Population Projections for Florida
HB 2471: Municipal Electric Utility Formation in Oregon
 HB 2471: Municipal Electric Utility Formation in Oregon Oregon municipal utilities provide safe and reliable service to their customers often at a lower cost than investor owned utilities. Examples of
HB 2471: Municipal Electric Utility Formation in Oregon
 HB 2471: Municipal Electric Utility Formation in Oregon Oregon municipal utilities provide safe and reliable service to their customers often at a lower cost than investor owned utilities. Examples of
BLACK KNIGHT HPI REPORT
 CONTENTS 1 OVERVIEW 2 NATIONAL OVERVIEW 3 LARGEST STATES AND METROS 4 MARCH S BIGGEST MOVERS 5 20 LARGEST STATES 6 40 LARGEST METROS 7 ADDITIONAL INFORMATION OVERVIEW Each month, the Data & Analytics division
Population for whom poverty status is determined One race alone All races White Black or African American American Indian/Alaska Native
 Universe: Population for whom poverty is determined All races White Black or African American American Indian/Alaska Native Asian Area Total Number Percent Total Number Percent Total Number Percent Total
Indicators Program. Community and Economic Development. Race and Hispanic Origin in Iowa: Sandra Charvat Burke
 Community and Economic Development Indicators Program Race and Hispanic Origin in Iowa: 1980-2015 Sandra Charvat Burke Findings Although all race groups are estimated to have increased between 2010 and
ACWA Annual Conference 2013 July 25 th Mount Bachelor Village Resort, Bend Oregon
 ACWA Annual Conference 2013 July 25 th Mount Bachelor Village Resort, Bend Oregon The Compelling Case for Natural Gas Rick Wallace Oregon Department of Energy Columbia Willamette Clean Cities Coalition
Jackson, TN MSA 64,640 62,050 2, Johnson City-Kingsport-Bristol, TN-VA CSA 229, ,310 8,
 Labor Force Estimates - United States & Tennessee Release: 1:30 PM CT on 10/25/2018 September, 2018 preliminary Aug. '18 revised Sep. '17 Seasonally Adjusted* Labor Force Employed Unemployed Rate Rate
Population Projections
 College of Liberal Arts and Sciences Bureau of Economic and Business Research Florida Population Studies Bulletin 172, June 2015 Population Projections by Age, Sex, Race, and Hispanic Origin for Florida
Upper Midwest Marketing Area -- F.O. 30 State and County Data* (pool pounds) August 2000
 August 2000") California Butte 6 7 R R Glenn 6 21 15 ** 7,800,306 ** Tehama 6 103 3 1,187,932 Restricted R R California Total 6 18 8,988,238 Illinois Boone 17 7 24 2,977,946 Bureau 17 11 R R Carroll 17 15 22 3,851,694
California Butte 6 7 R R Glenn 6 21 15 ** 7,800,306 ** Tehama 6 103 3 1,187,932 Restricted R R California Total 6 18 8,988,238 Illinois Boone 17 7 24 2,977,946 Bureau 17 11 R R Carroll 17 15 22 3,851,694
Cascades West Area Commission on Transportation Tuesday, August 30, :00-7:00 p.m Queen Ave SE 203 N. Main AGENDA
 Cascades West Area Commission on Transportation Tuesday, August 30, 2016 5:00-7:00 p.m. Meeting held at Videoconference at Cascades West Center OCWCOG Offices 1400 Queen Ave SE 203 N. Main Albany Toledo
2017 PLACERS EXCLUDING SENIORS
 2017 PLACERS EXCLUDING SENIORS Last Name First Name Grade School Year Classification Weight Place Abeyta Michael 11 McMinnville 2017 6A 145 2 Acosta Chris 11 Nyssa 2017 3A 138 3 Adams Cody 10 Jefferson
Cruiz n News. May SAAC Cherry Blossom Poker Run Bob & Jeanetta Lewis Shop Tour Upcoming Events Calendar
 Cruiz n News May 2011 SAAC Cherry Blossom Poker Run Bob & Jeanetta Lewis Shop Tour Upcoming Events Calendar 2010 CLUB OFFICERS President Jeff Foster president@wvsr.org (503) 393-3143 Vice President Warren
Marriages and Dissolutions of Marriage
 Marriages and Dissolutions of Marriage MARRIAGES AND DISSOLUTIONS OF MARRIAGE The number of marriages decreased between 2011 (140,900 marriages) and 2012 (140,467 marriages). This represents a 0.31 percent
NWPPA announces 2015 Excellence in Communication awards
 FOR IMMEDIATE RELEASE September 23, 2015 Contact: Brenda Dunn (brenda@nwppa.org) (360) 816-1453 NWPPA announces 2015 Excellence in Communication awards The 2015 Excellence in Communication winners at last
High Point Individual Performance (STATE)
") High Point Individual Performance (STATE) 424 Janik, Chris NE Corbett 68 1 219 Dewar, Shelby WI Cascade 67 2 830 Benson, Cammi CE Sisters 55 3 250 Dewar, Madelen WI Cascade 52 4 528 Burback, Natalie NE
High Point Individual Performance (STATE) 424 Janik, Chris NE Corbett 68 1 219 Dewar, Shelby WI Cascade 67 2 830 Benson, Cammi CE Sisters 55 3 250 Dewar, Madelen WI Cascade 52 4 528 Burback, Natalie NE
Vital Statistics and Health. Vital Statistics and Health
 Vital Statistics and Health Vital Statistics and Health Kansas Statistical Abstract 2017 Institute for Policy & Social Research ipsr.ku.edu/ksdata/ksah/ September 2018 Registered Live Births, Deaths, Marriages,
TradeName Symbol Suffix MA # Com Name Avg Wage Wage Date Pct 1 Pct 1 Wage Total OJT Com Ac Initials Inside Electrician NECA-IBEW
 TradeName Symbol Suffix MA # Com Name Avg Wage Wage Date Pct 1 Pct 1 Wage Total OJT Com Ac Initials Inside Electrician 159 0 1004 NECA-IBEW ELECTRICAL JATC $38.75 01/01/14 40 $15.50 8000 TLB Ltd Res Electrician
School Districts of Randolph County, IN Demographic Study
 School Districts of Randolph County, IN Demographic Study November 15, 2017 McKibben Demographic Research Jerome McKibben, Ph.D. Rock Hill, SC j.mckibben@mckibbendemographics.com 978-501-7069 Assumptions
Avista BPA, IPCO, PAC Project identified as long term need. Project Committed under Network Open Season. Plan of Service Determined
 Name Region In Ten Year Plan? by Link to More Detail Stage Commitment Need/Driver & Other A1 Bronx-Cabinet 115 kv Rebuild Northeastern Yes 5, 10 ColGrid SA Rebuild/reconductor Bronx-Cabinet 115 kv Avista
Central Oregon Association of REALTORS
 Central Oregon Association of REALTORS 218 Quarter 3 Report www.coar.com 541-382-627 info@coar.com The Central Oregon housing market continued to see home price appreciation across most of the region in
Population Estimates for Missouri Cities Report 1: Fastest Growing Cities Based on Numeric Increase,
 Report 1: Fastest Growing Cities Based on Numeric Increase, 2008-2008 1 Kansas 2,170 0.5 480,129 482,299 40,687 9.2 2 Lee's Summit 1,660 2.0 84,896 86,556 15,838 22.4 3 O'Fallon 1,592 2.1 77,258 78,850
District High Point. North West. North Valley. Southern. Tri River Valley. South Valley. Willamette. Central. North East
 District High Point District North West North Valley Southern Tri River Valley South Valley Willamette Central North East Total 905 823 712 674 635 605 532 512 Sunday, May 13, 2018 2:27:16 PM Overall Results
Energy Crops and Co-Products in the Region --- What does is mean?
 Energy Crops and Co-Products in the Region --- What does is mean? WA/OR Green Pea Association Annual Meeting Elk Lodge Milton-Freewater February 13, 2007 Don Wysocki Extension Soil Scientist Oregon State
Atlas 14 Regionalization
 Atlas 14 Regionalization Methodology Statewide precipitation depth raster data was obtained from NOAA s Atlas 14 Precipitation Frequency Data Server for the 10 year-10 minute, 50 year-30 minute, and 50
WA Plug-in Electric Vehicle Update through December 2017
 WA Plug-in Electric Vehicle Update through December 2017 WSDOT provides an update on the number of plug-in electric vehicles registered in the state twice per year. Department of Licensing provides raw
Hillsdale Academy Directions to Sporting Events
 Hillsdale Academy Directions to Sporting Events ADDISON HIGH SCHOOL 219 N Comstock St., Addison, MI 49220 Phone 517-547-6121 Take State Road EAST out of Hillsdale. Follow State Road until it turns LEFT
BEFORE THE PUBLIC UTILITY COMMISSION OF OREGON PACIFICORP. Exhibit Accompanying Direct Testimony of Eli M. Morris. Letters of Stakeholder Support
 Docket No. UM 1810 Exhibit PAC/101 Witness: Eli M. Morris BEFORE THE PUBLIC UTILITY COMMISSION OF OREGON PACIFICORP Exhibit Accompanying Direct Testimony of Eli M. Morris Letters of Stakeholder Support
DRAFT. Enrollment Projections Report. February 12, 2016
 February 12, 2016 3325 Hilliard Rome Road Hilliard, Ohio 43026 P: 614.798.8828 f: 614.798.8839 www.dejongrichter.com Table of Contents Acknowledgements... 2 Executive Summary... 3 Enrollment Projection
Safe Kids Oregon 2011 State Report
 Safe Kids Oregon 2011 State Report Dear Friends, INSIDE THIS REPORT: Introduction 1 Prevention Activity Statewide 2-4 Motor Vehicle Occupant Pedestrian Bicycle and Wheeled Sports Suffocation Prevention
OSUSBC Womens Current Standings 2018 Women's Corvallis Sorted by Event, Division
 Team, 620 & Up, Handicapped OSUSBC Womens Current Standings 2018 Women's Corvallis Sorted by Event, Division Place Team name Entry Score From Damascus, 1 OR A Horse With No Name 104 2,807 Dundee, 2ORCork
Wyoming Cost of Living Index for the Second Quarter of 2012
 State of Wyoming Department of Administration and Information Economic Analysis Division 2800 Central Avenue Cheyenne, WY 82002-0060 E-mail: ai-ead-info@wyo.gov http://eadiv.state.wy.us Ph. (307) 777-7504
2012 Water Consumption Statistics Report. Water Services Department
 212 Water Consumption Statistics Report Water Services Department Issued: December 213 TABLE OF CONTENTS 212 Water Consumption Statistics Report December 213 212 GVWD Statistics Book - Notes...3 Annual
Female under 14 =============== Hannah Robbins (Vancouver, WA): 1:37:25
: 1:37:25") 1999 Beaver Freezer Results Female under 14 ===== Hannah Robbins (Vancouver, WA): 1:37:25 Female 15-19 == Jodi Lusk (Eugene, OR): 1:12:52 Destiny J. Brown (Salem, OR): 1:19:31 Melissa Hsieh (Corvallis,
1999 Beaver Freezer Results Female under 14 ===== Hannah Robbins (Vancouver, WA): 1:37:25 Female 15-19 == Jodi Lusk (Eugene, OR): 1:12:52 Destiny J. Brown (Salem, OR): 1:19:31 Melissa Hsieh (Corvallis,
Generation Interconnection Impact Study Results for Eurus Energy America Corporation s Eurus Combine Hills I, LLC Power Project.
 Generation Interconnection Impact Study Results for Eurus Energy America Corporation s Eurus Combine Hills I, LLC Power Project April 23, 2003 Introduction Eurus originally requested an interconnection
Food and Transportation Drive Inflation for the Second Quarter of 2011
 State of Wyoming Department of Administration and Information Economic Analysis Division 2800 Central Avenue Cheyenne, WY 82002-0060 E-mail: ai-ead-info@wyo.gov http://eadiv.state.wy.us Ph. (307) 777-7504
2012 Accomplishments. Dedicated to providing safe, efficient and effective operational and logistics support to aerial firefighting resources.
 Dedicated to providing safe, efficient and effective operational and logistics support to aerial firefighting resources. THE PROGRAM The USFS Pacific Northwest Airtanker Base Program consists of the six
Summary of Land Capability Class (LCC) for Iowa counties
 for Iowa counties") Summary of Land Capability Class (LCC) for Iowa counties Compiled from ISPAID 7.3 by Brad Oneal, January 2011 Statewide --* 824293 2.29% 1 3365810 9.37% 2E 6920618 19.26% 2S 536398 1.49% 2W 8673296 24.14%
Summary of Land Capability Class (LCC) for Iowa counties Compiled from ISPAID 7.3 by Brad Oneal, January 2011 Statewide --* 824293 2.29% 1 3365810 9.37% 2E 6920618 19.26% 2S 536398 1.49% 2W 8673296 24.14%
Northwest Communications & Energy Innovations Conference. September 16 19, 2018 Coeur d'alene, Idaho
 Northwest Communications & Energy Innovations Conference September 16 19, 2018 Coeur d'alene, Idaho Conference Sponsors Enhanced sponsor Basic sponsors Thank you to our volunteer judges! Kimberly Bernick,
Kiwanis International
 Page 1 of 11 Missouri-Arkansas 01 Division 1 K01274 Canton MO 21 21 21 21 21 21 21 21 21 21 21 0.00 K02289 Hannibal MO 60 60 59 59 59 59 58 59 62 62 62 3.33 +2 K08858 Hannibal, Early Birds MO 40 42 41
Safe Kids Oregon State Report
 Safe Kids Oregon 2009 State Report INSIDE THIS REPORT: Introduction 3 Programs Across the State 4-6 Motor Vehicle Safety Pedestrian Safety Bicycle & Wheeled Sports Safety Suffocation Prevention Fire Safety
Oregon enforcement changes weight legalization policy
 Quarterly Newsletter of the Oregon Department of Transportation Motor Carrier Transportation Division December 2001 Officers to start requiring excessively overweight trucks to correct back to statute