SEARCH AND RESCUE. Annual Report. for. Oregon Military Department. Oregon Emergency Management
|
|
|
- Gabriel Lynch
- 5 years ago
- Views:
Transcription
1 SEARCH AND RESCUE Annual Report for 2010 Oregon Emergency Management Oregon Military Department
2 TABLE OF CONTENTS SAR Report... 1 Transportation and Work Hours for Missions per County Missions per Month Missions and Operational Missions by Year Operational Missions by County All SAR, Land and Water Missions by Type and by County Missions by Type and by County (without training and civic missions) Mission Breakdown Chart for Mission Breakdown Transportation and Work by County and by Mission Data for Multiple Missions Subject Activity by County Mission Results (SAR Only) Assets Locating Subjects (Searches Only) Assets Locating Subjects (Searches Only) Cell Phone Use (Searches Only) Subject Status by Age (SAR Only) Searches for Females Searches for Males Searches for Male and Female (Solo) Searches for Male and Female (Groups) Subjects 2010 and Average (SAR Only) Subjects Comparison (SAR Only) Oregon Population and SAR Subject Age by County Males Subject Age by County Females Number of Subjects by Age Group (SAR Only) Proportion of Subjects by Age Group (SAR Only) i-
3 Home of Missing Subjects Home of Rescued Subjects Land Use for Rescues (Land and Water) Land Use for Searches (Land and Water) Work Hours (SAR Only) Mission Hours (SAR Only) Hours to Locate a Subject on Land Time to Find a Subject on Land (Alive) Time to Find a Subject on Land (Deceased) Deaths by Age Suicide Rates Aviation Aviation Mishaps and Injuries by Month General Aviation Mishaps by Month Number of Aviation Injuries Percentage of Aviation Injuries Annual Number of General Aviation Mishaps Beacons Annual Number of ELTs ELTs by Month and by County Number of ELTs per Month ELT Location Map ELT Notification Times Percentage of ELTs Occurring per Hour of the Day Assistance Provided to OEM on ELTs ELT Mission Results ELTs vs. Aircraft Mishaps Search and Rescue Coverage County Reports (alphabetical order)...starting on 84 SAR Incident Summary Form (Version 6) with Instructions Contact ii-
4 SEARCH AND RESCUE Annual Report for 2010 Introduction In Oregon, the State assigns SAR incident numbers to all reported events. The requestor files a report of the incident with Oregon Emergency Management (OEM). The information from these incidents is entered into the SAR database and used to generate the statistics in this report. The exception to this is the data on aircraft accidents and injuries. This information comes from the National Transportation Safety Board. Copyright, Reproduction, and Data Use The information in this report is not copyrighted. Reproduction and use of these statistics are free to all users. We only ask that if you use or reproduce the data in this report, please credit the source. Data There are several sources for the data in this report. The primary comes from the County Sheriffs Offices who are the responsible agencies for the majority of the missions in the state. OEM generates its own data while locating missing aircraft and tracking down the source of electronic beacons (ELT and EPIRB) as it is the responsible agency for these events. Individual agencies assisting on a mission usually provide their figures directly to the Incident Commander. If any agency did not report their mission data, its inclusion here is doubtful. In 2010, 93.9% of the reports were sent in; a very good year. Charts and Graphs Each chart and graph in this report is named. By convention, all chart and graph titles in the report are underlined for easier reference. Words in italics identify specific categories within any chart. With few exceptions, numbers in the figures are rounded off to whole numbers. This means that anything under 0.5 is rounded off to 0. Because of this, three entries of 0.25 will each show 0, although their sum will show 1. Following the Overview of 2010 is a description of each chart, graph, and statistics page along with a discussion, if necessary. What s new in the 2010 Report There are changes every year this report comes out. The following is a description of this year s changes. -1-
5 Changes in Charts, Graphs, and data. New charts called Mission Hours and the 3 graphs dealing with the time to find a subject now use logarithmic scales. Total Work Hours was renamed to Work Hours. A new map called All SAR, Land and Water shows the location of every mission. New software was used to create the ELT Location Map which includes more data. Overview of was the third busiest year on record. There were 1,069 missions in 2010 which was 18 missions (1.7%) less than The average number of missions increased to 959 per year was 12% above the average number of missions. Transportation and Work Hours for 2010, page 19 These are the totals for all agencies for the year. This information is derived solely from filed reports entered into the SAR database. Although there were fewer missions than last year, there was a substantial increase in work and transportation. This is probably due to the large number of assisting counties during the year. Specifically: Paid hours + 14 Volunteer hours + 15% Equipment hours + 14% Equipment miles + 26% The total number of incidents does not include the total number of responses. On many occasions, more than one county assists another county on a mission. For this reason, there are always more reports than the number of incidents. In 2010, there were 138 requests for assistance compared to 106 in The chart below shows the number of missions and the number of assists. From this point of view, you can see that 2010 was the busiest year on record. The database has 1,146 incidents including partial data. Partial data usually happens when the county requests State assistance, but sends no report. This creates an entry in the database with some information, but not all of it. At the same time, it generates a missing report for that county. Missing reports are generated anytime a county requests a mission number or is known to assist on a mission, but do not send in a report. There are 73 missing reports (6.0%) for Year Missions ,010 1,127 1,087 1,069 Assists Total 1,028 1,090 1, ,063 1,085 1,091 1,206 1,195 1,207 As in previous years, several counties use the category called Other Transportation to track their use of Privately Owned Vehicles (POV). POV mileage constituted 27% of all -2-
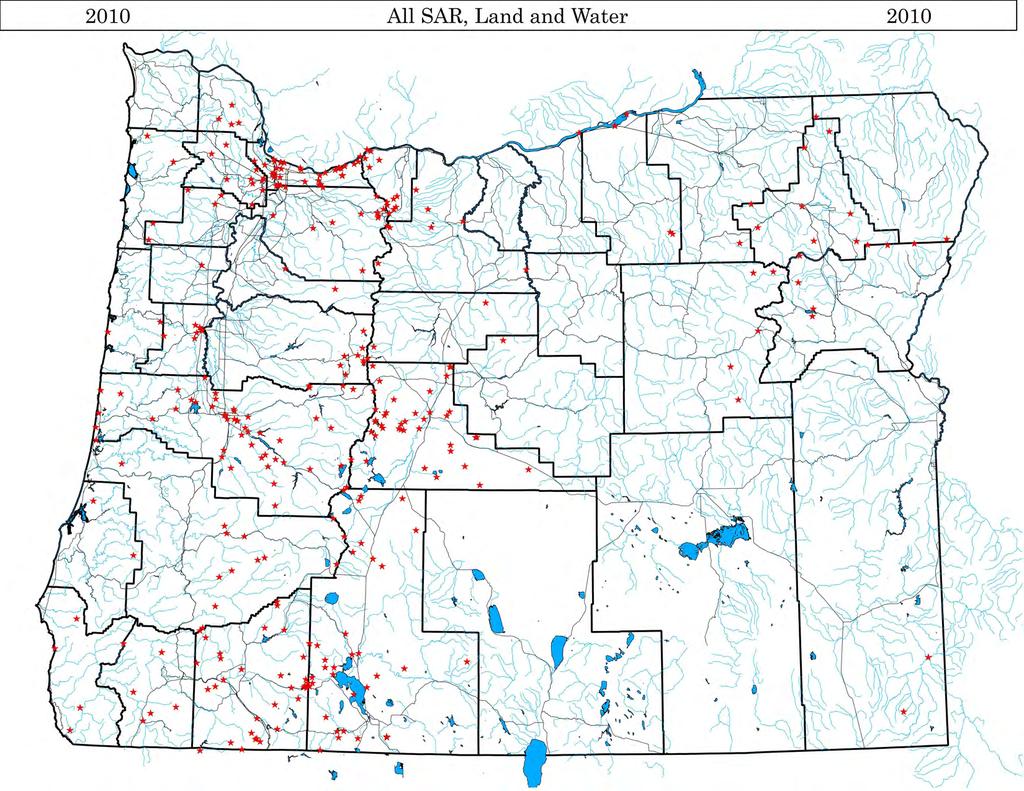
6 vehicle miles. The breakdown for POV miles is as follows: County Miles driven Deschutes 4,405 Douglas 6,938 Jackson 114,716 Missions per County, page 20 This chart shows the number of missions occurring in each county. It includes all types of missions grouped by month of occurrence. The Region block is used when the location of the mission s subject is in more than one county or occurs out of state. These figures do not include every response. This means that when several counties respond to a single incident, the chart shows an entry only for the county requesting the initial incident number. For example, County A calls for an incident number. Later Counties B and C assist the first county. Although three counties responded, the chart shows an entry only for County A in the month it occurred. The bottom line of the chart is a calculation of each month s percentage of the total. So, for example, we can see that 8% of 2010 s missions occurred in May. Missions Per Month, page 21 This chart shows the number of missions in 2010 per month with the average number of missions. From the chart, we can see that aside from January, every month was about e or well above average. April and November set record high number of missions. Missions and Operational Missions by Year, page 22 This chart shows the number of missions and operational missions in The term operational missions is used to describe any SAR incident that is not a training or civic type of mission. Many people want to know how many SAR missions are there in any given year. What they are not interested in is every training event, parade, public education, SAR meeting, et cetera, that occurs. Additionally, training and civic missions are artificially set at 1 each per month per county (with some exceptions). The removal of training and civic missions leaves what most people consider Search and Rescue, i.e., looking for people and objects and assisting those in distress. The number of Operational Missions for 1997 could not be determined. We can see from the chart that 2010 was the third busiest year on record. On the average, there are 815 operational mission per year. The 875 operational missions in 2010 is 7% above normal. Operational Missions by County, page 23 This chart shows the number of operational missions by month for each county in This gives a good view of how busy each county was with unplanned SAR events for the year. All SAR, Land and Water, page 24 This is a new map showing the location of every search and rescue in Oregon in
7 The data for this map comes from the coordinates provided by the Counties. The find coordinates were used for this map unless none were provided, in which case the IPP coordinates were used. There are 337 missions on this map out 653 searches and rescues that occurred in Only the missions where coordinates were provided could be included on this map. Missions by Type and by County, page 25 This is a breakdown of all of 2010 s missions by type. The figures were derived only from reports received. This chart does not show every mutual assist in the database. Abbreviations used in the headings allow enough room to include all the information on a single page. (L) and (W) stand for land and water, respectively. Totals for each county and each type of mission are included. The percentage at the bottom shows what portion of the year s total each mission comprises. Following is a description of each mission. Mult Multiple mission. A special category used when more than one type of mission occurred during the same incident. Each type of mission is not shown on this chart to prevent redundancy. A breakdown of Multiple Missions is found later in this report. Aviation All missing aircraft and reports of crashes. They may or may not involve the county. These include only incidents reported directly to OEM. Therefore, the number is not the same as that reported by the NTSB, found later in this report. Beacons Activations of ELTs and EPIRBs. (PLBs are not included as they are considered a land search or rescue.) May or may not involve the county. M/P Missing Person. This is split into land and water searches. Evid Evidence search. Searches for anything that is not a person. This is also split into land and water categories. Resc Rescue and MEDEVAC, split into land and water. These are missions for people in distress in a known location. Other water Missions involving water that do not fit into any of the previous categories, e.g., vehicle recovery from a body of water. Training Self-explanatory. Body Land and water body recovery. This category describes missions to remove bodies as opposed to a search (or a rescue) resulting in a deceased subject. This is a mission type, not a mission result. Civic Public and municipal events with SAR assistance or representation. E/M Emergency Management. General classification for all disasters, natural hazard responses, and widespread emergencies. The only missions included are those actively involving SAR personnel. False Other Missions launched when the subject was never lost or in distress. Any mission not classifiable in one of the other types. Missions by Type and by County (Without Training and Civic Missions), page 26 This chart is similar to the previous one with the following differences. The time span for this chart is The categories Training and Civic have been removed. This -4-
8 results in looking at only Operational Missions, which changes the percentage of all other missions on the chart. We can now see that Missing People (land) account for 39% of the state s missions. The second busiest mission is Rescues (land), accounting for 16% of all missions. Looking at the counties, we see that Deschutes, Lane, and Clackamas are the busiest counties over the last 14 years. We can also see that Lane County has well over twice the number of water rescues than the next highest county. Mission Breakdown, pages The next two pages show the types of incidents with the total transportation and work accomplished and the percentage each total represents. The additional column titled Total hrs is the sum of paid and volunteer work hours. The column titled Sum shows the total number of each type of mission and the percentage it represents of the total. These are the number of missions only; it does not include the number of counties providing mutual aid. The entire chart is arranged in order from lowest to greatest Sum. From this chart, we can see that missing person (land) accounted for 36% of the missions and 36% of the work performed. Rescue (land) is the second most active mission type. Training came in third and Rescue (water) finished in fourth place. The top 4 missions accounted for 75% of the missions of 2010 and 85% of the work. Chart of Mission Breakdown, page 29 This chart graphs the data from Mission Breakdown. The shaded bars represent the percentage of the number of missions from lowest to greatest. The checkered bars show the percentage of the total work hours. The numbers on the chart reference the 17 mission types. It is easy to see that Training accounts for more work hours than any other mission. Transportation and Work by Mission and by County, pages These three pages are further breakdowns of the previous two charts. The missions are grouped in such a way as to use the fewest pages. While Missions by Type and by County gives only total numbers for each mission type, Transportation and Work by Mission and by County gives the rundown of the totals found on Mission Breakdown. This includes work hours and transportation use by each county with a total number for each mission. The total number of missions includes mutual assist by other counties. There are six headings: transportation hours and miles, paid and volunteer work hours, number of missions, and the ratio of hours per mission. This ratio is meant as an analysis tool. It is a highly variable number, and therefore, only shows generalities. In many cases, a single large mission can significantly change the ratio. Significance as to efficiency or capability cannot be based on this number. Extremes occur every year and must be taken into consideration when comparing missions. Average is based on all the data available in the database. The database s earliest records are from This provides a good way to compare 2010 with what is currently considered normal. Totals for the Average also include counties providing -5-
9 mutual assist. The three biggest mission types are described below. These three types comprise 68% of all the SAR missions in Oregon in All the analysis below includes assisting agencies to the mission. Missing persons (land) accounted for 35% of all the state s SAR mission responses. The 468 responses reflect a 10% increase from last year and 30% over the Average. Rescue (L) moved into in second place in In 2010, there was almost no change (3% decrease) in the number of missions since last year. But this was still 29% above Average. In third place were Training missions with a 23% increase over last year. This was 23% above average. Data for Multiple Missions, page 34 This chart shows the data for a special category of missions. Occasionally, an incident involves two or more types of missions as we categorize them. In all cases, attempts are made to place a mission into a single category that correctly identifies the event. Sometimes, this is not possible. Data from missions with multiple types are not easily incorporated into the other charts due to duplication. To avoid this, the event would have to be classified as a single type of mission, and this is not the case. The only way to include this unique data is by creating this chart. The type of mission involved in the event is at the top and a Yes is in the box to identify whether it occurred. Equipment and personnel data is at the right for each mission. Subject Activity by County, pages The next five pages report the effort by county for each activity. The activities are arranged to allow the least number of pages. Included is the 14-year average for each activity. In 2010, motor vehicle passed hiking as the most popular activity. Motor vehicle use was 41% above average, while hiking was 22% above average. Wandering was 40% above average, and the fourth most popular activity was non-powered boating which was 29% above average. New to this year are the mushroom pickers which moved into fifth place with 43 missions. This is a 58% above average. This puts hunting game in sixth place and was 15% below average. The top five activities comprise 59% of all the reported activities for Many mission types do not have reportable activities. For example, training, evidence, and civic are some of the missions that have no corresponding activity since there are no subjects involved. The table below compares the top categories from 1997 to 2010 with the exception of -6-
10 mushroom pickers who just entered the chart this year Motor vehicle Hiking Wandering Non-powerboat Hunting For those who prefer a more visual representation, below is a graph of the table above Motor Vehicle Hiking Wandering Non-powerboat Hunting Reports on motor vehicle use have an associated block for the intended activities of the subjects involved. Here are the most common uses of motor vehicles involved in SAR: Various recreational Hunting and fishing MVA These events comprise 45% of all activities involving motor vehicles. Various recreational includes 4-wheeling, wandering, hobbyist, driving around, and sightseeing. The remaining 55% includes all other activities involving motor vehicles including 16% whose activities were unknown and 9% where nothing was reported. It should be noted that 20% included people simply driving from one place to another. -7-
11 In 2006, new fields for Drug Use and Mental Status were added to the SAR Incident Summary Form. This is the fifth year with this data. Drug Use Sex Drug Female Alcohol Male Alcohol Female Meth Male Meth Female Opiate 1 Male Opiate 1 Male Marijuana 2 1 Male Ecstasy 1 Male Multiple Female Multiple 1 Total Mental Status State Females Alzheimer Autism 1 2 Mental Handicap Mental Illness Mood Disorder Panic attack 1 Total State Males Alzheimer Autism Mental Handicap Mental Illness Mood Disorder ADHD/ADD 1 1 Brain injury 1 Amnesia 1 Total These charts give some idea of the mental state and drug use of SAR subjects. The label multiple refers to more than one drug used at the same time. Looking at Drug Use, it is obvious that alcohol is, by far, the leading drug used by subjects involved in SAR. There were 79 people in other than normal mental state. Because a person can have more than one mental problem, it is not always easy to determine which one is predominant, if there is one. While hardly scientifically accurate, when provided a list of mental issues, the first one listed (primary) is considered the predominant one. For example, if the report lists a subject as having Alzheimer s syndrome and also a mental illness, Alzheimer s is chosen as the mental state because it is listed primarily. -8-
12 Mission Results (SAR Only), page 49 This pie chart looks at mission results for searches and rescues from 1997 to Keep in mind that there may be many subjects involved on one mission. The data here represents mission results, not individual subject results. The category labeled multiple results is indicative of missions having dissimilar results for different subjects. For example, if one subject was found alive and one was found deceased, then that mission s data would go into multiple results. Therefore, this chart has no duplicated data. From the chart, we can see that 86% of all SAR missions ended with all subjects recovered alive. Assets Locating Subjects (Searches Only), page 41 Here, we look at who actually makes the finds on missing person missions. Rescues are not included since the subjects are not missing. The data for this and the next chart uses subject information, not mission information. This is important since there is often more than one subject per mission. From the chart, we see that in 2010, ground SAR located the majority of subjects. Combined with those who self-recovered, these two categories comprise 63% of all lost subjects. Unfortunately, 5% of the reports left the field blank. Note that although aviation assets are highly regarded by the general public and the media, only 3% of the missing were located by air. Assets Locating Subjects (Searches Only) , page 42 This chart uses the same type of data as the previous one. However, it includes all the data in the database. This comprises 6,168 subjects from 1997 to From this we can see that although 28% of the subjects self-recover, ground SAR is still the most effective way of locating a missing person. Aviation assets account for 4% of the finds. Cell Phone Use (Searches Only) , page 43 This is a graph of the cell phone use from 1997 to The data for this graph uses only cell phone calls made by the subject themselves. If the caller is in the subject s party but is not in distress, then they would not appear in the data. This means that rescue missions are rarely included because there is usually an uninjured party making the call on behalf of the subject. So, only searches are included on this chart. The steady increase in the use of cellular telephones is apparent from the chart. There is no reason to assume that this trend will change anytime soon. Subject Status by Age (SAR Only), page 44 This chart shows the actual number of subjects in distress for This does not include false missions, body recoveries, or disasters. Only searches and rescues are included. Subjects are broken down by age group and condition recovered. The column labeled Unknown is due to the subject s condition left out of the report. The row labeled Unknown is used when the subject s age was left out of the report. The charts titled Number of Subjects by Age Group (SAR Only) and Proportion of Subjects by Age -9-
13 Group (SAR Only) use this data was not as busy as 2009, shown by a slight decrease in the number of people involved in SAR. The 79 fewer people equal an 8% decrease in the number of people in distress. Specifically, there was an 11% decrease for female subjects involved in SAR and an 7% decrease for males. The number of females in distress has finally gone down following an upward 5-year trend. The boxed area at the bottom of the page Subject Status by Age (SAR Only) is the combination of male and female populations. Since last year, there was an increase of 1.7% found alive and a decrease of 0.8% found deceased. These figures are close to last year s, like the number of subjects still missing, which also decreased by 1.1%. Put into words, 2010 was a good year, resulting in more people found alive and less people found dead or still missing. The following table compares 2010 with the average number of SAR subjects. Keep in mind that these figures represent only subjects involved in searches and rescues. The three blocks separate data for males, females, and all subjects. The third line of each block shows the difference between 2010 and the average. MALES Alive Deceased Missing Unknown % 8.9% 2.4% 0.5% % 6.5% 2.3% 0.2% Difference in 2010 Up 2.8% Down 2.4% Down 0.1% Down 0.4% FEMALES Alive Deceased Missing Unknown % 4.6% 1.5% 0.2% % 5.1% 0.7% 0.0% Difference in 2010 Up 0.4% Up 0.5% Down 0.8% Down 0.2% All Subjects Alive Deceased Missing Unknown % 7.7% 2.1% 0.4% % 5.1% 1.8% 0.1% Difference in 2010 Up 4.4% Down 2.6% Down 0.3% Down 0.3% From this we can see that for all subjects, 2010 was a better than average year. Especially among males, a 2.8% increase in the number of subjects found alive is offset by a 2.4% decrease in the number found deceased, and tiny drop in the number still missing. Female subjects in 2010 stayed very close to the average. The following information deals with search results for people who were lost in groups as opposed to those who were lost by themselves. Keep in mind that this data includes only people who were lost; rescues are not included. Groups include two or more people. Using all the data from 1997 to 2010, we get the following charts. -10-
14 Lost Males Alive Deceased Missing Unknown In groups 2,108 (96.2%) 52 (2.4%) 25 (1.1%) 6 (0.3%) Solo 1,852 (78.2%) 357 (15.1%) 133 (5.6%) 25 (1.1%) Lost Females Alive Deceased Missing Unknown In groups 934 (97.6%) 15 (1.6%) 6 (0.6%) 2 (0.2%) Solo 616 (83.6%) 82 (11.1%) 36 (4.9%) 3 (0.4%) Looking at the numbers, we find that there were 6.9 times as many males found deceased when lost by themselves as opposed to being with a group. They were also 5.3 times as many still missing. Among females, there were 5.5 times the number of fatalities among solo females and 6 times the number still missing. The conclusion is obvious and cannot be overemphasized. Do not hike alone; one s chances of surviving are significantly reduced if you are lost and by yourself. Searches for Females, page 45 Searches for Males, page 46 These two charts use all the data from 1997 to They look only at lost subjects; rescues were not included in these data sets. The charts compare subjects lost in groups as opposed to those who were lost solo. Both charts show similar patterns. There is so much similarity in solo males and females, that the next chart compares these data sets. Both males and females show a huge surge in numbers centered around the teen years. While this is most obvious for those in groups, it also occurs among solo individuals. Men and women in groups both show a small spike in numbers in the age group. Among children 4 and younger, there are four times as many boys wandering away and getting lost as girls. This corresponds with studies on human development which show that adolescent males are 5 times more likely to get into accidents than females 1. Searches for Males and Females (Solo), page 47 Data from the previous two charts were combined to compare solo males and females. As mentioned previously, this data does not include rescues. Unlike the previous charts, the actual number of subjects was not used because the difference between male and females was too great. Instead, each age group was compared as a percentage of the whole. So, for example, we can say that females aged represent 3% of all missing females. The chart s graph for males and females are very similar. Both show peaks in the teen years and again in their 30s and 40s. Females show one more spike peaking in the year old age group. Searches for Males and Females (Groups), page 48 This is similar to the previous chart, however, only people lost in groups of 2 or more are included. Again, we see a spike in the numbers of teens followed by a steady decrease in numbers. We also see a small increase in numbers among males aged and 1 Private communication with researchers. -11-
15 another small increase in females aged Subjects 2010 and Average (SAR Only), page 49 This graph shows four lines, two for males and two for females. They represent a comparison of the number of males and females involved in SAR with the average number involved in SAR in 5-year age increments. These subjects include all land and water searches and rescues. The average includes the same type of subjects from 1997 to Subject Comparison (SAR Only), page 50 This chart used all subject data involved in searches and rescues in the database. It compares the percentage of subjects in each age group against the total for their sex. So, we can say that males aged accounted for 6% of all males, while females accounted for 6.8% of all females in the same age group. By looking at the data this way, we can compare males and females on an equivalent level. A couple of unusual features stand out. Since the two graphs are rather closely associated, it implies that males and females are comparable when it comes to being lost or rescued. This is not evident in any other chart due to the much greater number of male subjects over female. There is an interesting change in the trend among females aged 40 to 49. There are more females in the 40 to 49 age groups than there are in the number of female subjects aged 35 to 39. There is no obvious reason for this sudden jump in females 40 to 49. The reason is probably sociological. My theory is that these are the ages when most children are leaving home, providing much more free time to women who traditionally provide the extra work raising a family. In fact, when looking at the chart, the biggest discrepancy between male and female is from the ages of 25 to 50. These 25 years (1 generation) are the primary years to raise a family. Oregon s Population and SAR, page 51 This chart uses the same data as the previous one. Added to it is the population breakdown for Oregon. Again, this looks at the percentage of the total population of each group. For example, you can see from the chart that while females aged make up 6.6% of Oregon s population, they make up 10.3% of the female SAR subjects. Subject Age by County Males, page 52 Subject Age by County Females, page 53 These two charts show the age distribution of all subjects involved in SAR by county. This includes searches, rescues, body recoveries, and false missions. There is duplicated data, as several counties can respond to a single incident. The purpose of these charts is to allow the counties to see the total number of people they were involved with during the year. Number of Subjects by Age Group (SAR Only), page 54 This bar chart graphically shows the information from Subject Status by Age (SAR Only). Keep in mind that people are counted individually, even though they may have -12-
16 been lost and found in groups. For example, most of the 0-9 year old children were with an adult, but the chart separates the subjects ages into groups. Proportion of Subjects by Age Group (SAR Only), page 55 In this instance, the data is the same as the previous chart, but combines males and females to form 100% by age group. This displays the division between the sexes by age group. The overall division is about 30% female and 70% male. Home of Missing Subjects, page 56 This chart attempts to answer the question Where do these people come from? The data for this and the following chart comes from all the subjects in the database, not just from The percentages given reflect all records, not just those where a response was provided. As indicated, 17% of the SAR records have no location specified. For missing subjects, the top five counties are shown. The combined out-of-state subjects account for 11% of missing people. Included are the two states with the highest figures. At the bottom of the chart is a breakdown of the subject s origins. We can see that in-state counties and people from out-of-state account for about 83% of the missing subjects. No location was given for the remainder. Home of Rescued Subjects, page 57 The top five counties are shown. The in-state and out-of-state components add up to 84% of all rescued subjects. No location was provided for 16% of the subjects. The inhabitants of Lane County continue to lead in the number of subjects in need of rescue. Multnomah County comes in second, 8% behind Lane County, although Lane County has less than half of Multnomah County s population. Land Use for Rescues (Land and Water), page 58 All missions begin somewhere. This chart shows the land ownership for all land and water rescues in Land Use for Searches (Land and Water), page 59 This chart shows the land ownership for all missing people on land and in water for Work Hours (SAR Only), page 60 This chart plots the total work hours spent for all land and water SAR missions. On separate plots are the total work hours for paid and volunteer personnel. The chart uses the data for 6,998 missions ordered from maximum number of hours to minimum. Work hours were split into paid and volunteer hours. Missions totaling 0 hours were removed. This left 5,377 missions with volunteer hours and 6,069 missions that had paid hours. The ten biggest missions were not plotted because the scale would prevent the remaining mission data from being easily visible. From the combined missions information we can derive the following: -13-
17 Percent of missions Work Hours 25% 8 work hrs 50% 22 work hrs 75% 68 work hrs This means that 25% of the SAR missions accumulated 8 work hours or less total time. Fifty percent of the missions accumulated 22 work hours or less. Mission Hours (SAR Only) labeled, page 61 This is a new chart which plots the same information as the previous one. Both axis use logarithmic scales. On a logarithmic scale, all the major gridlines are multiples of ten. Seven of the most publicized missions are marked on the chart. The Horman mission is, to date, the biggest with 23,846 SAR hours reported, while the Boehlke mission with 3,198 SAR hours is the 15 th largest. The average number of hours worked for all mission is marked at 92 hours. Time to Find a Subject on Land, page 62 This graph has been plotted on logarithmic axis. Every mission has a notification time and, if the subject is found, a location time. The difference between the times generates the graph on this chart. The data looks only at missing persons on land. Missing people in water are not included due to a small sample and a very different environment. The graph includes both subjects found alive and those found deceased. The chart shows only missions that took less than 10,000 hours (417 days) to locate the subject. This leaves 5 missions off the chart. The graph plots 3,114 missions taken from the entire database, as there is no value in looking at only one year. The y-axis values are the total number of hours in the mission. From the data we can derive: Percent of missions Hours to find 25.0% % % % % 24 From the table above we can see that a quarter of all missing people are found in less than 2 hours and half are found in under 4 hours. Within the first operational period, 81% of all missions are completed, and within the first day, 93% of all missing persons were located. Time to Find A Subject on Land (Alive), page 63 In this case, we look at the time it takes to locate a lost person on land who is alive when found. This year, the chart was changed to a logarithmic scale and all missions are included. From the chart, we can see that about 13% of the subjects are found within an hour. About 80% of the missions are completed after 10 hours and 95% are complete after 22 hours. There are 2,906 missions included in this graph. -14-
18 Time to Find A Subject on Land (Deceased), page 64 The chart looks at the time it takes to locate a missing subject when the subject is found deceased. There are far fewer missions ending this way, as we know from looking at Mission Results. There are only 198 reports included in this graph. Any mission that took more than 56 days to locate has been left off the chart. Looking at the data from these two charts we get the following information. Percent of missions Alive Deceased 25.0% 1.7 hrs 8.3 hrs 50.0% 3.5 hrs 20.7 hrs 75.0% 8.0 hrs 84.8 hrs 84.5% in 12 hrs 34% in 12 hrs 95.9% in 24 hrs 57% in 24 hrs The difficulty in locating an unresponsive subject is obvious. In a 24-hour period, 96% of live subjects have been located, compared to only 57% of the deceased. Deaths by Age, page 65 This graph looks at the age that SAR subjects die. The data is divided into male and female and each point is a percentage of the total number. The data includes the age of death for all subjects involved in searches or rescues between 1997 and This includes 634 males and 129 females. Suicide Rates, page 66 Suicides are unusual in that it is one of the very few SAR missions in which the subject usually does not want to be found. There are four graphs on the chart, two for males and two for females. The bold lines shows the death rate by suicide for SAR related incidents. The dotted lines are the suicide rates for the general population of Oregon. This data comes from publications of the Oregon Department of Human Services, Center for Health Statistics. The SAR suicide data contains 156 males and 63 females. The suicide data from the Oregon has 397 males and 106 females. Aviation, page 67 This page summarizes all aircraft related missions for the state for Aviation Mishaps and Injuries by Month, page 68 The data for this chart came from the National Transportation Safety Board (NTSB). These figures include only general aviation. General Aviation Mishaps by Month, page 69 Data for this chart also comes from the NTSB. This chart is a graph of the in the previous chart Aviation Mishaps and Injuries by Month. Added to those statistics are the average number of mishaps for the last 10 years. From this information, we can see 2010 overall was a relatively average year. -15-
19 Number of Aviation Injuries, page 70 This bar chart gives a historical perspective of aviation injuries. The actual number of injuries in each of the four classifications are shown for the last 10 years along with their average. You can see from the chart that 2010 had fewer than average number of injuries in all categories. In fact, 2010 had the least number of injures ever. Percentage of Aviation Injuries, page 71 This chart displays the same information as Number of Aviation Injuries. Instead of actual numbers for each type of injury, the chart displays all injuries as a percentage of the sum for the year. In this way, it is easy to see the proportion of injuries for any year. In 2010, 11% of the people involved in aviation mishaps were fatalities and another 9% resulted in a serious injury. From the chart, we can see that in the last 10 years, on the average, 62% of all aircraft accidents resulted in no injury, while 27% of all mishaps resulted in a death or serious injury. Annual Number of General Aviation Mishaps, page 72 This is a graph of the number of mishaps per year from 1973 to Since the mid- 1980s the overall trend has been relatively unchanged, although cyclical to some extent. Beacons, page 73 This and the next series of charts refer to missions responding to activated beacon signals. This page shows the sum of all efforts by all agencies involved on these missions. Annual Number of ELTs, page 74 This chart displays the total number of ELT reports each year since saw a continued decrease in the number of beacon activation over This is due to the deactivation of NOAA s SARSAT on MHz in February was the first full year since the deactivation. There were 25 ELT signals in 2010, compared to an average of 125 per year before the deactivation. ELTs by Month and by County, page 75 This chart shows the number of ELTs occurring in each county by month. The county was determined by where the beacon was located or the location of the signal, if the device wasn t found. Region refers to beacons that spanned multiple counties. Only the actual number of ELTs are shown, not the number of responses. Number of ELTs per Month, page 76 This chart graphs the information from the previous page. Superimposed, is the 15- year average number of ELTs had the least number of ELT ever with record low numbers in 7 out of 12 months. ELT Location Map, page had too few ELTs to make it worthwhile to show on a map. Instead this shows all 1,563 ELT activations since 1997 marked by the small diamonds. This map includes -16-
20 county borders and major roads. The small airplanes are the locations of every airfield in the state. ELT Notification Times, page 78 This unusual chart graphically displays the notification time for all ELT incidents for the year. The y-axis shows the time of the day in 1-hour increments. The x-axis displays the months and weeks. February is not displayed because the computer divides the year into 30.4-day months. The 30 th day of the year is in January and the 61 st day is in March. Percentage of ELTs Occurring per Hour of the Day, page 79 By compiling the activation times for the last 15 years, it was possible to graph the frequency of their occurrence. The value at each hour is the percentage of notifications of an ELT activated during that hour. For example, over the last 15 years, 2.5% of all ELTs occurred between 0400 and 0500 hours. The emerging pattern is quite unusual. The causes of the spikes and dips are unknown. Particularly unusual is the sudden climb in the number of ELTs starting at 0700 and the drop in ELTs between 1300 and Assistance Provided to OEM on ELTs, page 80 All ELT activations require a response. From the chart, we can see that OEM required no assistance on 48% of all ELT signals generated in This is due primarily to the fact that so many ELTs disappear shortly after activation. CAP provides the greatest support in finding ELTs with their assistance on 28% of the missions. ELT Mission Results, page 81 This chart shows the results of all the activations in From the chart, we can see that 52% were never found. For all records in the database, 60% are not found and 40% are located. Therefore, 2010 was a bit below average for finding ELTs. Of those located in 2010, 32% were on aircraft. ELTs vs. Aircraft Mishaps, page 82 Since ELTs are associated with aviation, it would make sense to see the correlation between the NTSB reported mishaps and ELTs. As usual, there appears to be no correlation between these two events. Search and Rescue Coverage, page 83 Several people provide support to the State SAR Program. The names listed include the State SAR Coordinator, OEM Staff, and Volunteers to the SAR Program. This chart shows the number of hours OEM personnel spent working on SAR missions and on on-call status. Mission hours are also totaled for each month. At the bottom is the number of missions worked by each coordinator. Because more than one person can be on-call at the same time, the year s total is greater than the number of hours in the year. -17-
21 County Reports (in alphabetical order) The next 36 pages are the compiled annual data as reported by each county. All mission types are included, and some data comes from sources other than the Sheriff s Office. Search and Rescue Incident Summary (Version 7) Since the source of data for this report comes from this form, it seemed appropriate to include a copy with its instructions. On page 120 is the 2-page form required for all State Incident number requests. Once received, the information is carefully reviewed and entered into the SAR database. This provides the bulk of the data in this report. Version 7 is the most current; destroy all previous versions. -18-
22 Transportation and Work Hours for 2010 Paid Hours Volunteer Hours Transportation CAP hrs CAP 282 hrs Helicopter 159 hrs 30 miles BLM 26 hrs BLM hrs Military helicopter 90 hrs miles Explorers hrs Explorers 10,140 hrs Plane 73 hrs miles Jeep club hrs Jeep club 3,435 hrs Military plane 5 hrs miles Fire service 1,870 hrs Fire service 795 hrs Snowmobile 1,019 hrs 3,620 miles Divers 2,233 hrs Divers 2,657 hrs Snow-cat 118 hrs 44 miles Forest Service 381 hrs Forest Service hrs ATV 1,521 hrs 895 miles Mt Rescue 10 hrs Mt Rescue 14,705 hrs 2 hrs miles Ski patrol 92 hrs Ski patrol 19 hrs 4-Wheel drive 1,874 hrs 243,490 miles Law enforcement 13,508 hrs Law enforcement 442 hrs Specialized vehicles 126 hrs 8,916 miles SAR team 7,691 hrs SAR team 80,385 hrs 2-wheel drive 2,015 hrs 62,966 miles Federal agency 236 hrs Federal agency 3 hrs Boat 532 hrs 47 miles Dog team 96 hrs Dog team 8,137 hrs Other 35 hrs 144,019 miles Horse Team hrs Horse Team 4,271 hrs State agency 122 hrs State agency 77 hrs Other 587 hrs Other 13,010 hrs Amateur radio 7,062 hrs Total Paid Hours Total Volunteer Hours Total Transportation Hours Miles 26, ,420 7, ,027 Unbudgeted costs Food $10,663 Fuel $11,582 Lodging $250 Other $8,654 Total Number of Incidents for 2010: 1,069 Total Number of Assists for 2010: 138 Number of Reports in Database for 2010: 1,146 (including partial entries) Number of Missing Reports for 2010: 73 19
23 2010 Missions per County 2010 Jan Feb Mar Apr May Jun Jul Aug Sep Oct Nov Dec Total Baker Benton Clackamas Clatsop Columbia Coos Crook Curry Deschutes Douglas Gilliam 0 Grant Harney Hood River Jackson Jefferson Josephine Klamath Lake Lane Lincoln Linn Malheur Marion Morrow Multnomah Polk REGION Sherman 1 1 Tillamook Umatilla Union Wallowa Wasco Washington Wheeler 0 Yamhill ,069 % of total 5.8% 7.4% 8.1% 7.9% 8.0% 8.9% 12.1% 8.9% 7.7% 7.9% 9.4% 8.0% 100% -20-
24 2010 Missions per Month Missions for 2010 Average Number of Missions Jan Feb Mar Apr May Jun Jul Aug Sep Oct Nov Dec -21-

25 Missions and Operational Missions by Year ,200 1,100 1,127 1,087 1,069 1, , Number of Missions 400 Operational Missions
26 2010 Operational Missions by County 2010 Jan Feb Mar Apr May Jun Jul Aug Sep Oct Nov Dec Sum Baker Benton Clackamas Clatsop Columbia Coos Crook Curry Deschutes Douglas Gilliam 0 Grant Harney Hood river Jackson Jefferson Josephine Klamath Lake Lane Lincoln Linn Malheur Marion Morrow Multnomah Polk Region Sherman 1 1 Tillamook Umatilla Union Wallowa Wasco Washington Wheeler 0 Yamhill Total
27
28 2010 Missions by Type and by County 2010 Mult Aviation Beacon M/P (L) M/P (W) Evid (L) Evid (W) Resc (L) Resc (W) Training Other (W) False Body (W) Body (L) E/M Civic Other TOTAL Baker Benton Clackamas Clatsop Columbia Coos Crook Curry Deschutes Douglas Gilliam 0 Grant Harney Hood River Jackson Jefferson Josephine Klamath Lake 1 1 Lane Lincoln Linn Malheur Marion Morrow Multnomah Polk Region Sherman 0 Tillamook Umatilla Union Wallowa Wasco Washington Wheeler 0 Yamhill TOTAL % of Total 0.8% 0.6% 2.4% 36.4% 2.4% 3.3% 1.3% 16.4% 8.4% 13.6% 1.2% 4.2% 1.1% 0.7% 1.1% 3.3% 2.9% 100% -25-
29 Missions by Type and by County (Without Training and Civic Missions) Mult Aviation Beacon M/P (L) M/P (W) Evid (L) Evid (W) Resc (L) Resc (W) Other (W) False Body (W) Body (L) E/M Other TOTAL Baker Benton Clackamas ,054 Clatsop Columbia Coos Crook Curry Deschutes ,043 Douglas Gilliam Grant Harney Hood River Jackson Jefferson Josephine Klamath Lake Lane ,030 Lincoln Linn Malheur Marion Morrow Multnomah Polk Region Sherman Tillamook Umatilla Union Wallowa Warm Springs Wasco Washington Wheeler Yamhill TOTAL ,550 4, , ,597 % of Total 1.0% 2.3% 14.6% 38.5% 3.4% 3.9% 1.0% 15.7% 6.9% 1.3% 4.7% 1.0% 1.0% 1.4% 3.2% 100% -26-
30 2010 Mission Breakdown 2010 Aviation Trans hrs Trans miles Paid hrs Vol hrs Total hrs Sum Sum 1 3, ,100 6 Percent of total 0.0% 0.7% 0.7% 0.6% 0.6% 0.6% Body Recovery (L) Sum 63 2, Percent of total 0.8% 0.5% 1.0% 0.3% 0.4% 0.7% Multiple Sum 69 2, ,291 8 Percent of total 0.9% 0.6% 1.1% 0.7% 0.7% 0.8% Disaster Sum 24 8, ,944 2, Percent of total 0.3% 1.8% 0.9% 1.3% 1.3% 1.1% Body Recovery (W) Sum 13 1, Percent of total 0.2% 0.2% 1.2% 0.1% 0.3% 1.1% Other (W) Sum Percent of total 0.5% 0.1% 0.5% 0.1% 0.1% 1.2% Evidence (W) Sum Percent of total 0.4% 0.2% 0.8% 0.2% 0.3% 1.3% Missing Person (W) Sum 482 2,325 1, , Percent of total 6.4% 0.5% 4.9% 0.6% 1.3% 2.4% Beacons Sum Percent of total 0.2% 0.1% 0.1% 0.1% 0.1% 2.4% Other Sum 40 7, ,836 4, Percent of total 0.5% 1.7% 1.5% 2.6% 2.5% 2.9% Evidence (L) Sum 5 6, ,827 3, Percent of total 0.1% 1.5% 1.7% 1.9% 1.9% 3.3% Civic Sum , ,228 6, Percent of total 2.1% 8.6% 1.8% 4.3% 3.9% 3.3% -28-
31 2010 Mission Breakdown 2010 False Trans hrs Trans miles Paid hrs Vol hrs Total hrs Sum Sum , ,028 2, Percent of total 2.3% 2.5% 1.9% 1.4% 1.5% 4.2% Rescue (W) Sum 148 3,588 1, , Percent of total 2.0% 0.8% 5.6% 0.2% 1.1% 8.4% Training Sum 3, ,022 4,711 70,555 75, Percent of total 42.5% 27.6% 17.5% 48.5% 43.7% 13.6% Rescue (L) Sum ,585 1,973 4,984 6, Percent of total 8.5% 5.3% 7.3% 3.4% 4.0% 16.4% Missing Person (L) Sum 2, ,268 13,793 48,714 62, Percent of total 32.4% 47.3% 51.4% 33.5% 36.3% 36.4% Grand Total 7, ,027 26, , ,271 1,
32 2010 Mission Breakdown 2010 Aviation Trans hrs Trans miles Paid hrs Vol hrs Total hrs Sum Sum 1 3, ,100 6 Percent of total 0.0% 0.7% 0.7% 0.6% 0.6% 0.6% Body Recovery (L) Sum 63 2, Percent of total 0.8% 0.5% 1.0% 0.3% 0.4% 0.7% Multiple Sum 69 2, ,291 8 Percent of total 0.9% 0.6% 1.1% 0.7% 0.7% 0.8% Disaster Sum 24 8, ,944 2, Percent of total 0.3% 1.8% 0.9% 1.3% 1.3% 1.1% Body Recovery (W) Sum 13 1, Percent of total 0.2% 0.2% 1.2% 0.1% 0.3% 1.1% Other (W) Sum Percent of total 0.5% 0.1% 0.5% 0.1% 0.1% 1.2% Evidence (W) Sum Percent of total 0.4% 0.2% 0.8% 0.2% 0.3% 1.3% Missing Person (W) Sum 482 2,325 1, , Percent of total 6.4% 0.5% 4.9% 0.6% 1.3% 2.4% Beacons Sum Percent of total 0.2% 0.1% 0.1% 0.1% 0.1% 2.4% Other Sum 40 7, ,836 4, Percent of total 0.5% 1.7% 1.5% 2.6% 2.5% 2.9% Evidence (L) Sum 5 6, ,827 3, Percent of total 0.1% 1.5% 1.7% 1.9% 1.9% 3.3% Civic Sum , ,228 6, Percent of total 2.1% 8.6% 1.8% 4.3% 3.9% 3.3% -28-
33 2010 Mission Breakdown 2010 False Trans hrs Trans miles Paid hrs Vol hrs Total hrs Sum Sum , ,028 2, Percent of total 2.3% 2.5% 1.9% 1.4% 1.5% 4.2% Rescue (W) Sum 148 3,588 1, , Percent of total 2.0% 0.8% 5.6% 0.2% 1.1% 8.4% Training Sum 3, ,022 4,711 70,555 75, Percent of total 42.5% 27.6% 17.5% 48.5% 43.7% 13.6% Rescue (L) Sum ,585 1,973 4,984 6, Percent of total 8.5% 5.3% 7.3% 3.4% 4.0% 16.4% Missing Person (L) Sum 2, ,268 13,793 48,714 62, Percent of total 32.4% 47.3% 51.4% 33.5% 36.3% 36.4% Grand Total 7, ,027 26, , ,271 1,
34 2010 Chart of Mission Breakdown % 1 - Aviation 42% 2 - Body Recovery (L) 40% 3 - Multiple Percentage of all Missions 38% 4 - Disaster Percentage of Total Work Hours 36% 5 - Body Recovery (W) 34% 6 - Other (W) 32% 7 - Evidence (W) 30% 8 - Missing Person (W) 28% 9 - Beacons 26% 10 - Other 24% 11 - Evidence (L) 22% 12 - Civic 20% 13 - False 18% 14 - Rescue (W) 16% 15 - Training 14% 16 - Rescue (L) 12% 17 - Missing Person (L) 10% 8% 6% 4% 2% 0%
35 2010 Transportation and Work by Mission and by County 2010 MP (L) Trans hrs Trans miles Paid hrs Vol hrs Amount hr/msn Rescue (L) ` Trans miles Paid hrs Vol hrs Amount hr/msn Baker 4, Baker Benton 14 3, Benton Clackamas 92 1,328 4, Clackamas Clatsop 12 1, Clatsop Columbia Coos Coos Crook Crook 2, Curry Curry , Deschutes , , Deschutes , , Douglas 11 2, Douglas 10 10, , Grant Grant 3 2, Harney Harney Hood River Hood River Jackson 14 2, Jackson , , Jefferson Jefferson Josephine Josephine 22 5, , Klamath Klamath 69 11, , Lane 2 2, Lake Linn Lane 20 15, , Malheur Lincoln Morrow Linn , Multnomah Malheur Tillamook Marion 65 1, , Umatilla Morrow Union 2, Multnomah ,572 4,602 14, Wallowa Polk Wasco Tillamook Yamhill Umatilla Total ,585 1,973 4, Union 21 18, , Average ,963 1,426 3, Wallowa Wasco 97 1, Washington 22 1,508 1,309 1, Yamhill Total 2, ,268 13,793 48, Average 2, ,510 6,699 28,
36 2010 Transportation and Work by Mission and by County 2010 Aviation Trans hrs Trans miles Paid hrs Vol hrs Amount hr/msn MP (W) Trans hrs Trans miles Paid hrs Vol hrs Amount hr/msn Clackamas Benton Douglas Clackamas Jackson 1, Curry Josephine Deschutes Klamath Douglas Polk Josephine Region Klamath Umatilla Lane Total 1 3, Lincoln Average 149 2, , Linn Marion Rescue (W) Morrow Clackamas Multnomah 72 1, Curry Wasco Douglas Total 482 2,325 1, Jackson Average 546 6,051 1,314 1, Josephine Klamath Evid (W) Lane 33 1, Baker Malheur Clatsop Morrow Douglas Multnomah 37 1, Josephine Wallowa Klamath Wasco Multnomah Washington Total Total 148 3,588 1, Average Average 137 2, Body (L) Multiple missions Clackamas Curry Deschutes 47 1, Deschutes 44 1, Jackson Klamath Klamath Lane Umatilla Polk Total 63 2, Umatilla Average 39 1, Total 69 2, Average 126 4, ,
37 2010 Transportation and Work by Mission and by County 2010 Other (W) Trans hrs Trans miles Paid hrs Vol hrs Amount hr/msn False Trans hrs Trans miles Paid hrs Vol hrs Amount hr/msn Clackamas Baker Clatsop Benton Curry Clackamas Jackson Clatsop Lane Crook Morrow Curry Multnomah Deschutes Total Douglas Average 28 1, Hood River Jackson 20 7, Body (W) Josephine Clackamas Klamath Deschutes Lane Douglas Malheur Klamath Marion Lane Multnomah Marion Tillamook Multnomah Umatilla Total 13 1, Union Average 37 2, Wallowa Washington Civic Total , , Baker 1, Average 98 4, Clatsop 1, Curry Other (L) Deschutes 29 15, Benton Jackson , , Clackamas Josephine Crook Multnomah Deschutes Total , , Douglas Average , , Jackson 33 5, Josephine 2, , Klamath Region Yamhill Total 40 7, , Average 48 5, ,
38 2010 Transportation and Work by Mission and by County 2010 Training Trans hrs Trans miles Paid hrs Vol hrs Amount hr/msn Evid (L) Trans hrs Trans miles Paid hrs Vol hrs Amount hr/msn Baker 9, Baker Benton 1, , Benton Clackamas 57 1, Clackamas Clatsop 16 1, Clatsop Columbia 57 1, Columbia Crook 1, , Coos Curry , Deschutes 1, Deschutes , , Douglas Douglas 1,794 4, Jackson 1, Jackson , , Klamath Josephine 120 2, , Lane Lane 14, ,183 Lincoln Multnomah 7,078 2,295 8, ,577 Marion Polk Multnomah 1, Tillamook Polk Union 101 1, Tillamook Yamhill Union Total 3, ,022 4,711 70, Wasco Average 1, ,457 2,186 44, Washington Yamhill Disaster Total 5 6, , Crook Average 57 7, , Deschutes Jackson 10 3, Beacons Josephine 0 3, Clackamas Klamath Clatsop Total 24 8, , Coos Average 44 7, , Deschutes Douglas Lane Lincoln Morrow Region Washington Yamhill Total Average 57 1, ,
39 2010 Data for Multiple Missions 2010 County MP (L) MP (W) Evid (L) Evid (W) Resc (W) Trans hrs Trans miles Paid hrs Vol hrs Curry Yes Yes Deschutes Yes Yes Deschutes Yes Yes Deschutes SUM 44 1, Klamath Yes Yes Lane Yes Yes Lane Yes Yes Lane SUM Polk Yes Yes Umatilla Yes Yes Total 68 3, ,
40 2010 Subject Activity by County 2010 ATV Trans hrs Trans miles Paid hrs Vol hrs Amount hrs/msn Bicycle Trans hrs Trans miles Paid hrs Vol hrs Amount hrs/msn Baker Clackamas Crook Deschutes Deschutes 14 1, Jackson 12 1, Jefferson Jefferson Josephine Lane Linn Multnomah Tillamook Tillamook Union Washington Total 29 2, Total 36 2, Average 73 2, Average 30 1, Criminal Hiking Deschutes Baker Linn Benton 1, Marion Clackamas , Washington Clatsop Total Columbia Average 35 3, , Crook Curry Climbing Deschutes 17 4, , Benton Douglas 8 2, Clackamas Grant Curry Hood River Deschutes 5 2, Jackson 9 7, Douglas 3 1, Jefferson Hood River Josephine Jackson Klamath Jefferson Lane 6 5, Klamath Lincoln Lane Linn Linn Marion 5 1, , Total 34 4, , Multnomah 21 4, , Average 289 4, , Tillamook Umatilla SCUBA Wallowa Clackamas Wasco Curry Washington Total Yamhill Average Total ,627 2,339 9, Average ,031 1,935 8,
41 2010 Subject Activity by County 2010 Other snow Trans hrs Trans miles Paid hrs Vol hrs Amount hrs/msn Other Trans hrs Trans miles Paid hrs Vol hrs Amount hrs/msn Benton Benton Clackamas Clackamas Deschutes 222 1, Crook Jackson Curry Klamath Deschutes Lane Douglas Linn Jackson Total 273 3, Josephine Average 61 1, Klamath Lane Motor vehicle Tillamook Baker 1, Umatilla Benton Union Clackamas Total 18 2, Clatsop Average 81 2, Columbia Coos Hunting birds Crook Crook Curry Lane Deschutes 100 5, Wasco Douglas 10 6, Total 0 1, Grant Average Harney Hood River Fix-winged Jackson 55 11, , Clackamas Jefferson Douglas Josephine 7 1, Jackson 1, Klamath 67 1, Josephine Lane 17 2, Klamath Lincoln Region Linn Umatilla Malheur Total 1 3, Marion Average 148 2, , Morrow Tillamook Other work Umatilla Curry Union 1, Klamath Wallowa Umatilla Wasco Union Yamhill Total Total ,245 1,609 4, Average Average ,011 1,174 3,
42 2010 Subject Activity by County 2010 Other Water Trans hrs Trans miles Paid hrs Vol hrs Amount hrs/msn Wandering Trans hrs Trans miles Paid hrs Vol hrs Amount hrs/msn Clatsop Baker Jackson Benton Josephine Clackamas Lane Columbia Multnomah Coos Washington Curry , Total Deschutes 5 2, Average Douglas Jackson 50 9, , Non-powerboat Josephine 20 2, Benton Klamath 4, Clackamas Lane 3 2, Douglas Lincoln Josephine Multnomah Klamath Polk Lane 24 1, Tillamook Malheur Umatilla Morrow Wallowa Multnomah Wasco Wasco Washington Total 91 1, Yamhill Average 138 3, Total ,031 1,906 6, Average , , Swimming Clackamas Snowmobile Deschutes Deschutes 62 3, Douglas Douglas Josephine Jefferson Lane Klamath Morrow Linn Multnomah 1, Umatilla Wasco Union Total 362 3, Total 99 3, Average 149 2, Average 92 3, Caving Helicopter Deschutes Polk Average Average
43 2010 Subject Activity by County 2010 Hunting game Trans hrs Trans miles Paid hrs Vol hrs Amount hrs/msn Powerboat Trans hrs Trans miles Paid hrs Vol hrs Amount hrs/msn Baker Clackamas Clackamas Deschutes Columbia Klamath Coos Lane Crook Lincoln Curry Morrow Deschutes Multnomah Douglas Wasco Grant 2, Total Jackson 1 1, Average Jefferson Klamath Suicide Lane Clackamas Linn Curry Malheur Jackson 1, Tillamook Jefferson Umatilla Lane 2, Union 1, Lincoln Wallowa Multnomah Wasco Tillamook Total 311 7, , Wallowa Average , , Washington Total 56 4, , Fishing Average 92 6, , Benton Clackamas Horse riding Curry Clackamas Douglas Jackson Jackson Klamath Klamath Union Lane Total Multnomah Average 21 1, Tillamook Union Other aviation Wallowa Jackson Washington Lake Total 60 1, Total Average 243 2, Average
44 2010 Subject Activity by County 2010 Other Forest Trans hrs Trans miles Paid hrs Vol hrs Amount hrs/msn Unknown Trans hrs Trans miles Paid hrs Vol hrs Amount hrs/msn Crook Benton Jackson Clackamas Klamath Clatsop 1, Morrow Columbia Total 2 1, Crook Average 27 2, , Curry Deschutes 1, Government work Douglas Linn Jackson 9, ,116 Total Josephine 1, Average Klamath 2, Lane Cross-Country skiing Multnomah ,272 3,910 12, ,133 Baker 2, Polk Clackamas Wasco Deschutes Washington , ,691 Hood River Total ,506 5,434 17, ,070 Jackson Average 69 10, , Jefferson Umatilla Mushroom pickers Union 21 14, , ,280 Benton Total 79 17, , Clatsop Average 27 1, Columbia Curry Snowboarding Deschutes 2 1, Benton Douglas Clackamas Grant Crook Jackson 14 6, Deschutes Josephine Hood River Klamath 6 2, Jackson 24 1, Lane 3, Total 59 2, Linn Average 103 2, Morrow Tillamook Other Pickers Umatilla Tillamook Union 1, Average Total , , Average 133 5, ,
45 Mission Results (SAR Only) Multiple results 0.9% Not reported 0.7% Alive 86.4% Missing 2.7% Deceased 9.3% -40-
46 2010 Self-recovered 26% Assets Locating Subjects (Searches only) 2010 Family Friends 6% Not reported 5% Other 23% Ground SAR 37% Air SAR 3% -41-
47 % Assets Locating Subjects (Searches Only) % Data from Data from % 26% 23% 15% 9% 8% 6% 4% 4% 3% Ground SAR Self-recovered Other Family Friends Not reported Air SAR -42-
48 Cell Phone Use (Searches Only)
49 2010 Subject Status by Age (SAR Only) 2010 MALES Alive Deceased Missing Unknown Total Unknown Total % of Total 91.0% 6.5% 2.3% 0.2% 100% FEMALES Alive Deceased Missing Unknown Total Unknown Total % of Total 94.2% 5.1% 0.7% 0.0% 100% % of Total Population Alive Deceased Missing Unknown Total 91.9% 6.1% 1.8% 0.1% 100% -44-
50 Searches for Females Females, Groups Females, Solo
51 Searches for Males Males, Groups Males, Solo
52 % Searches for Males and Females (Solo) % 7% Females Males 6% 5% 4% 3% 2% 1% 0%
53 % 18% Searches for Males and Females (Groups) % 16% 15% Females Males 14% 13% 12% 11% 10% 9% 8% 7% 6% 5% 4% 3% 2% 1% 0%
54 Subjects 2010 and Average (SAR Only) Male 2010 Female 2010 Male Average Female Average
55 13% Subject Comparison (SAR only) % Female 11% Male 10% 9% 8% 7% 6% 5% 4% 3% 2% 1% 0%

56 Oregon's Population and SAR % 12% 11% 10% 9% Female Oregon Population Male Oregon Population Female SAR Male SAR 8% 7% 6% 5% 4% 3% 2% 1% 0%
57 2010 Subject Age by County Males 2010 Unk Total Baker Benton Clackamas Clatsop Columbia Coos Crook Curry Deschutes Douglas Grant Hood River Jackson Jefferson Josephine Klamath Lane Lincoln Linn Malheur Marion Morrow Multnomah Polk Region Tillamook Umatilla Union Wallowa Wasco Washington Yamhill
58 2010 Subject Age by County Females 2010 Unk Total Baker Benton Clackamas Clatsop Columbia Crook Curry Deschutes Douglas Grant 1 1 Hood River Jackson Jefferson Josephine Klamath Lane Lincoln 1 1 Linn Malheur 2 2 Marion 1 1 Morrow Multnomah Tillamook Umatilla Union Wallowa 1 1 Wasco Washington Yamhill
59 Number of Subjects by Age Group (SAR Only) -54- Male (SAR Only) Female (SAR Only)
60 % Proportion of Subjects by Age Group (SAR Only) % 80% 70% 60% 50% Females Males 40% 30% 20% 10% 0%
61 Home of Missing Subjects County of Percentage Residence of all missing Multnomah 8.4% Jackson 8.0% Lane 7.3% Clackamas 6.1% Deschutes 5.5% All out-of-state 11.0% Washington 3.6% California 2.7% All in-state 72.3% All out-of-state 11.0% No location given 16.7% Total 100.0% -56-
62 Home of Rescued Subjects County of Percentage Residence of all rescued Lane 18.5% Multnomah 10.3% Deschutes 6.8% Clackamas 5.4% Jackson 4.6% All out-of-state 12.7% Washington 6.2% California 2.4% All in-state 71.4% All out-of-state 12.7% No location given 16.0% Total 100.0% -57-
63 2010 Land Use for Rescues (Land and Water) 2010 Other 13% Private 3% BLM 8% USFS 50% State 26% -59-
64 ,600 3,400 Work Hours (SAR Only) ,200 3,000 2,800 Hours 2,600 2,400 2,200 2,000 1,800 1,600 Volunteer Hours Paid Hours 1,400 1,200 1, ,001 1,501 2,001 2,501 3,001 3,501 4,001 4,501 5,001 5,501 6,001 Number of Missions -60-
65 Mission Hours (SAR Only) ,000. Wilberger Horman Engebretson Frauens Kim 1,000. James, Hall, Cooke Boehlke Hours of Work 100. Average (92 hours) Number of Missions -61-
66 Hours to Locate a Subject on Land ,000. 1, Hours ,000 Number of Missions -62-
67 ,000. Time to Find A Subject on Land (Alive) Hours % 95% 90% 85% 80% 75% 70% 65% 60% 55% 50% 45% 40% 35% 30% 25% 20% 15% 10% 5% 0% Percentage of Missions -63-
68 Time to Find A Subject on Land (Deceased) Days % 95% 90% 85% 80% 75% 70% 64% 59% 54% 49% 44% 39% 34% 29% 24% 19% 14% 9% 4% Percentage of Missions -64-
69 Deaths by Age % 13% 12% 11% 10% Males Females 9% 8% 7% 6% 5% 4% 3% 2% 1% 0%
70 Suicide Rates % 36% 34% 32% 30% 28% 26% Males Oregon Females Oregon Males SAR Females SAR 24% 22% 20% 18% 16% 14% 12% 10% 8% 6% 4% 2% 0%
71 2010 AVIATION 2010 Total transportation use and work hours for aviation missions TRANSPORTATION HOURS MILES Helicopter Helicopter Military Helicopter Military Helicopter Plane 1 Plane Snowmobile Snowmobile Snowcat Snowcat ATV ATV 8 Boat Boat Total Transportation Hours 1 4-Wheel drive 4-Wheel drive 2,362 Specialized vehicles Total Transportation Miles 3,310 Specialized vehicles Other 2-wheel drive Other 2-wheel drive Other equipment Other equipment 940 HOURS OF PAID WORK Other CAP Divers BLM Forest Service 10 Other Feds 7 Explorers Mt Rescue Dog team Jeep club Ski patrol Horse team Fire Service 75 Law Enforcement 58 State Agency 3 Sheriff's SAR 41 Total Paid Hours 193 HOURS OF VOLUNTEER WORK Other 130 CAP 54 Divers BLM Forest Service Other Feds Explorers Mt Rescue 108 Dog team 37 Jeep club Ski patrol Horse team Fire Service Law Enforcement State Agency 13 Sheriff's SAR 501 Amateur radio 64 Total Volunteer Hours 907 UNBUDGETED COSTS FOR SEARCH AND RESCUE Food $97.00 Fuel $88.00 Lodging $0.00 Other $7, Total Costs $7,
72 2010 Aviation Mishaps and Injuries by Month 2010 Mishaps Number of Injuries Fatal Serious Minor Uninjured Total January 0 0 February March April May June July August September October 3 0 November 3 0 December 3 0 Total
73 2010 General Aviation Mishaps by Month Average Number of Mishaps (01-10) 5 Mishaps for Jan Feb Mar Apr May Jun Jul Aug Sep Oct Nov Dec -69-

74 Number of Aviation Injuries Fatal Minor Serious Uninjured Average -70-
,610 7,755 7,590 8,210 9,000 fi 18,829 16,812 18,335 18,273 20,658
 : Commodity Data Sheet All Hay Order from: Economic Information Office Agricultural and Resource Economics Oregon State University 29 Ballard Extension Hall Corvallis, OR 9733 360 Item and Area Oregon
Oregon Smoke Management Annual Report
 Oregon Smoke Management Annual Report OREGON DEPARTMENT OF FORESTRY FIRE PROTECTION DIVISION SMOKE MANAGEMENT AND FUELS General File 1-2-5-910 OREGON SMOKE MANAGEMENT ANNUAL REPORT Prepared By: FIRE PROTECTION
Child Passenger Safety Senior Checker Update. Ruth Harshfield, Safe Kids Oregon Director February 4, 2015
 Child Passenger Safety Senior Checker Update Ruth Harshfield, Safe Kids Oregon Director February 4, 2015 Webinar Objectives Safe Kids Buckle Up (SKBU) Program Senior Checker Protocol Hot Tips Safe Kids
BEFORE THE PUBLIC UTILITY COMMISSION OF OREGON UM 1452
 ENTERED JAN 222014 BEFORE THE PUBLIC UTILITY COMMISSION OF OREGON UM 1452 In the Matter of PUBLIC UTILITY COMMISSION OF OREGON, ORDER Investigation into Pilot Programs to demonstrate the use and effectiveness
Who has trouble reporting prior day events?
 Vol. 10, Issue 1, 2017 Who has trouble reporting prior day events? Tim Triplett 1, Rob Santos 2, Brian Tefft 3 Survey Practice 10.29115/SP-2017-0003 Jan 01, 2017 Tags: missing data, recall data, measurement
Oregon Compensable Fatality Report
 Oregon Compensable Fatality Report Calendar Year 2002 Research & Analysis Section Oregon Dept. of Consumer & Business Services October 2004 Oregon Compensable Fatality Report Department of Consumer & Business
NON-FATAL ELECTRICAL INJURIES AT WORK
 NON-FATAL ELECTRICAL INJURIES AT WORK Richard Campbell May 2018 Copyright 2018 National Fire Protection Association (NFPA) CONTENTS Findings and Trends 1 Key Takeaways 2 Background on Data Sources and
2015 Community Report Grants
 5 Grants Produced for the New Mexico Department of Transportation, Traffic Safety Division, Traffic Records Bureau, Under Contract 58 by the University of New Mexico, Geospatial and Population Studies,
2016 Community Report De Baca County
 6 De Baca County Produced for the New Mexico Department of Transportation, Traffic Safety Division, Traffic Records Bureau, Under Contract 58 by the University of New Mexico, Geospatial and Population
2016 Community Report Los Alamos County
 6 Los Alamos County Produced for the New Mexico Department of Transportation, Traffic Safety Division, Traffic Records Bureau, Under Contract 58 by the University of New Mexico, Geospatial and Population
2015 Community Report White Rock
 5 White Rock Produced for the New Mexico Department of Transportation, Traffic Safety Division, Traffic Records Bureau, Under Contract 58 by the University of New Mexico, Geospatial and Population Studies,
2016 Community Report Torrance County
 6 Torrance County Produced for the New Mexico Department of Transportation, Traffic Safety Division, Traffic Records Bureau, Under Contract 58 by the University of New Mexico, Geospatial and Population
2015 Community Report Torrance County
 5 Torrance County Produced for the New Mexico Department of Transportation, Traffic Safety Division, Traffic Records Bureau, Under Contract 58 by the University of New Mexico, Geospatial and Population
2016 Community Report Portales
 6 Portales Produced for the New Mexico Department of Transportation, Traffic Safety Division, Traffic Records Bureau, Under Contract 58 by the University of New Mexico, Geospatial and Population Studies,
Passenger seat belt use in Durham Region
 Facts on Passenger seat belt use in Durham Region June 2017 Highlights In 2013/2014, 85 per cent of Durham Region residents 12 and older always wore their seat belt when riding as a passenger in a car,
2015 Community Report Las Vegas
 5 Las Vegas Produced for the New Mexico Department of Transportation, Traffic Safety Division, Traffic Records Bureau, Under Contract 58 by the University of New Mexico, Geospatial and Population Studies,
2016 Community Report Santa Fe County
 26 Santa Fe County Produced for the New Mexico Department of Transportation, Traffic Safety Division, Traffic Records Bureau, Under Contract 58 by the University of New Mexico, Geospatial and Population
2015 Community Report Tularosa
 5 Tularosa Produced for the New Mexico Department of Transportation, Traffic Safety Division, Traffic Records Bureau, Under Contract 58 by the University of New Mexico, Geospatial and Population Studies,
2016 Community Report San Juan County
 26 San Juan County Produced for the New Mexico Department of Transportation, Traffic Safety Division, Traffic Records Bureau, Under Contract 58 by the University of New Mexico, Geospatial and Population
2015 Community Report San Juan County
 25 San Juan County Produced for the New Mexico Department of Transportation, Traffic Safety Division, Traffic Records Bureau, Under Contract 58 by the University of New Mexico, Geospatial and Population
2015 Community Report Doña Ana County
 25 Doña Ana County Produced for the New Mexico Department of Transportation, Traffic Safety Division, Traffic Records Bureau, Under Contract 58 by the University of New Mexico, Geospatial and Population
2015 Community Report Chaparral
 5 Chaparral Produced for the New Mexico Department of Transportation, Traffic Safety Division, Traffic Records Bureau, Under Contract 58 by the University of New Mexico, Geospatial and Population Studies,
2016 Community Report Aztec
 Aztec Produced for the New Mexico Department of Transportation, Traffic Safety Division, Traffic Records Bureau, Under Contract 58 by the University of New Mexico, Geospatial and Population Studies, Traffic
2015 Community Report Aztec
 25 Aztec Produced for the New Mexico Department of Transportation, Traffic Safety Division, Traffic Records Bureau, Under Contract 58 by the University of New Mexico, Geospatial and Population Studies,
2014 Community Report Portales
 4 Portales Produced for the New Mexico Department of Transportation, Traffic Safety Division, Traffic Records Bureau, Under Contract 58 by the University of New Mexico, Geospatial and Population Studies,
2015 Community Report Los Lunas
 25 Los Lunas Produced for the New Mexico Department of Transportation, Traffic Safety Division, Traffic Records Bureau, Under Contract 58 by the University of New Mexico, Geospatial and Population Studies,
2014 Community Report Luna County
 4 Luna County Produced for the New Mexico Department of Transportation, Traffic Safety Division, Traffic Records Bureau, Under Contract 58 by the University of New Mexico, Geospatial and Population Studies,
2014 Community Report Las Vegas
 4 Las Vegas Produced for the New Mexico Department of Transportation, Traffic Safety Division, Traffic Records Bureau, Under Contract 58 by the University of New Mexico, Geospatial and Population Studies,
2014 Community Report Truth or Consequences
 4 Truth or Consequences Produced for the New Mexico Department of Transportation, Traffic Safety Division, Traffic Records Bureau, Under Contract 58 by the University of New Mexico, Geospatial and Population
2014 Community Report Tularosa
 4 Tularosa Produced for the New Mexico Department of Transportation, Traffic Safety Division, Traffic Records Bureau, Under Contract 8 by the University of New Mexico, Geospatial and Population Studies,
American Driving Survey,
 RESEARCH BRIEF American Driving Survey, 2015 2016 This Research Brief provides highlights from the AAA Foundation for Traffic Safety s 2016 American Driving Survey, which quantifies the daily driving patterns
2014 Community Report Aztec
 Aztec Produced for the New Mexico Department of Transportation, Traffic Safety Division, Traffic Records Bureau, Under Contract 58 by the University of New Mexico, Geospatial and Population Studies, Traffic
2014 Community Report Los Lunas
 4 Los Lunas Produced for the New Mexico Department of Transportation, Traffic Safety Division, Traffic Records Bureau, Under Contract 58 by the University of New Mexico, Geospatial and Population Studies,
2017 Adjusted Count Report February 12, 2018
 A statewide multi-use trail user study and volunteer data collection program 2017 Adjusted Count Report February 12, 2018 The following report includes the final adjusted infrared (IR) counter data at
UNITED STATES DEPARTMENT OF AGRICULTURE. Compilation of Statistical Material. Pacific Northwest Federal Milk Marketing Order. Federal Order No.
 UNITED STATES DEPARTMENT OF AGRICULTURE 1930-220th St. SE, Ste. 102 AGRICULTURAL MARKETING SERVICE 10050 N 25th Ave., Ste. 302 Bothell, WA 98021-8471 DAIRY PROGRAMS Phoenix, AZ 85021-1664 Phone: (425)
Provisional Review of Fatal Collisions. January to December 31 st 2017
 Provisional Review of Fatal Collisions January to December 31 st 17 2 nd January 18 Review of 17 fatal collision statistics as of 31st December 17 Overview This report summarises the main trends in road
Denver Car Share Program 2017 Program Summary
 Denver Car Share Program 2017 Program Summary Prepared for: Prepared by: Project Manager: Malinda Reese, PE Apex Design Reference No. P170271, Task Order #3 January 2018 Table of Contents 1. Introduction...
2016 Community Report New Mexico
 216 Produced for the Department of Transportation, Traffic Safety Division, Traffic Records Bureau, Under Contract 581 by the University of, Geospatial and Population Studies, Traffic Research Unit Distributed
Figure 15. Yearly Trend in Death Rates for Motor Vehicle Transport: NSW, Year
 6.0 MOTOR VEHICLE TRANSPORT 6.1 Deaths due to Motor Vehicle Transport: The motor vehicle transport (MV) death rate showed a statistically significant decrease overall between 1989 and 1999 although the
2004 Utility Electric Contact Incident Report. Regarding Personal Injury Incidents Reported to the OPUC in 2003
 2004 Utility Electric Contact Incident Report Regarding Personal Injury Incidents Reported to the OPUC in 2003 The Oregon Public Utility Commission does not discriminate on the basis of race, color, national
Where are the Increases in Motorcycle Rider Fatalities?
 Where are the Increases in Motorcycle Rider Fatalities? Umesh Shankar Mathematical Analysis Division (NPO-121) Office of Traffic Records and Analysis National Center for Statistics and Analysis National
Department of Highway Safety and Motor Vehicles
 Department of Highway Safety and Motor Vehicles Traffic Report 2005 A Compilation of Motor Vehicle Crash Data from the Florida Crash Records Database Fred O. Dickinson Executive Director Our Mission: Making
KANSAS Occupant Protection Observational Survey Supplementary Analyses Summer Study
 KANSAS Occupant Protection Observational Survey Supplementary Analyses 2018 Summer Study Submitted To: Kansas Department of Transportation Bureau of Transportation Safety and Technology Prepared by: DCCCA
TARGET ZERO TEAM PROJECT DUI ZONE IDENTIFICATION AND BASELINE DATA SNOHOMISH COUNTY
 TARGET ZERO TEAM PROJECT DUI ZONE IDENTIFICATION AND BASELINE DATA 2005 2009 SNOHOMISH COUNTY TABLE OF CONTENTS COUNTY CHARACTERISTICS AND SUMMARY... TOTAL FATAL COLLISIONS 4 DUI ZONE IDENTIFICATION...
TRAFFIC SAFETY FACTS. Overview Data
 TRAFFIC SAFETY FACTS 2009 Data Overview Motor vehicle travel is the primary means of transportation in the United States, providing an unprecedented degree of mobility. Yet for all its advantages, injuries
ITSMR Research Note. Motorcyclists and Impaired Driving ABSTRACT INTRODUCTION KEY FINDINGS. September 2013
 September 2013 KEY FINDINGS F&PI CRASHES INVOLVING IMPAIRED MOTORCYCLISTS 27% of the fatal MC crashes over the five year period, 2008-2012, were alcohol-related. 48% of the alcohol-related F&PI MC crashes
Motorcyclist Deaths Jan Jul. 2018
 Motorcyclist Deaths Jan. 2008 Jul. 2018 This report summarizes all accidental deaths of motorcyclists in traffic-related motor vehicle incidents (MVIs) between January 1, 2008 and July 30, 2018. Inclusion
Motorcycle Safety A Single Point of Truth
 Motorcycle Safety A Single Point of Truth Bringing together motorcycle safety information from the different data sources into one document Data sources include ACC, Ministry of Transport, NZ Transport
FOR IMMEDIATE RELEASE
 Article No. 7845 Available on www.roymorgan.com Roy Morgan Unemployment Profile Friday, 18 January 2019 Unemployment in December is 9.7% and under-employment is 8.8% FOR IMMEDIATE RELEASE Australian unemployment
Used Vehicle Supply: Future Outlook and the Impact on Used Vehicle Prices
 Used Vehicle Supply: Future Outlook and the Impact on Used Vehicle Prices AT A GLANCE When to expect an increase in used supply Recent trends in new vehicle sales Changes in used supply by vehicle segment
WIM #41 CSAH 14, MP 14.9 CROOKSTON, MINNESOTA APRIL 2014 MONTHLY REPORT
 WIM #41 CSAH 14, MP 14.9 CROOKSTON, MINNESOTA APRIL 2014 MONTHLY REPORT In order to understand the vehicle classes and groupings, the MnDOT Vehicle Classification Scheme and the Vehicle Classification
Missouri River Mainstem Reservoirs Runoff Volumes for Annual Operating Plan Studies RCC Technical Report Jy-08
 Missouri River Region Since 1953 US Army Corps of Engineers Reservoir Control Center Missouri River Region Northwestern Division Reservoir Control Center July 2008 Missouri River Basin Fort Peck Montana
VEHICLE / PEDESTRIAN COLLISIONS
 Info item No. 1 Crosswalk Safety Advisory Committee March 31, 2016 VEHICLE / PEDESTRIAN COLLISIONS HRM: January December 20 DISCLAIMER: All figures presented in this report reflect the information held
Alberta. Collision Facts. 330 people killed. 17,907 people injured. 140,705 collisions.
 Collision Facts 330 people killed 17,907 people injured 140,705 collisions May 2017 www.transportation.alberta.ca/statistics Collision Facts 330 people killed 17,907 people injured 140,705 collisions Monday
WIM #41 CSAH 14, MP 14.9 CROOKSTON, MINNESOTA MAY 2013 MONTHLY REPORT
 WIM #41 CSAH 14, MP 14.9 CROOKSTON, MINNESOTA MAY 2013 MONTHLY REPORT In order to understand the vehicle classes and groupings the Mn/DOT Vehicle Classification Scheme and the Vehicle Classification Groupings
Rates of Motor Vehicle Crashes, Injuries, and Deaths in Relation to Driver Age, United States,
 RESEARCH BRIEF This Research Brief provides updated statistics on rates of crashes, injuries and death per mile driven in relation to driver age based on the most recent data available, from 2014-2015.
Austin Police Department. An Analysis of Traffic Fatalities 2015
 Austin Police Department An Analysis of Traffic Fatalities Prepared by the Austin Police Department Research and Planning Unit April Table of Contents Background... Overview... Terminology... Notes about
Fatal Motor Vehicle Crashes on Indian Reservations
 April 2004 DOT HS 809 727 Fatal Motor Vehicle Crashes on Indian Reservations 1975-2002 Technical Report Colleges & Universities 2% Other Federal Properties 9% Other 4% Indian Reservations 65% National
FOR IMMEDIATE RELEASE
 Article No. 5842 Available on www.roymorgan.com Roy Morgan Unemployment Profile Thursday, 2 October 2014 Unemployment climbs to 9.9% in September as full-time work lowest since October 2011; 2.2 million
LONG RANGE PERFORMANCE REPORT. Study Objectives: 1. To determine annually an index of statewide turkey populations and production success in Georgia.
 State: Georgia Grant Number: 08-953 Study Number: 6 LONG RANGE PERFORMANCE REPORT Grant Title: State Funded Wildlife Survey Period Covered: July 1, 2010 - June 30, 2011 Study Title: Wild Turkey Production
September 2016 Water Production & Consumption Data
 September 2016 Water Production & Consumption Data September 2016 monthly water production (288.48 AF) was lowest in at least 17 years. Monthly water production has increased slightly each month since
Road Safety s Mid Life Crisis The Trends and Characteristics for Middle Aged Controllers Involved in Road Trauma
 Road Safety s Mid Life Crisis The Trends and Characteristics for Middle Aged Controllers Involved in Road Trauma Author: Andrew Graham, Roads and Traffic Authority, NSW Biography: Andrew Graham has been
Inflation: the Value of the Pound
 Inflation: the Value of the Pound 1750-1996 Research Paper 97/76 6 June 1997 The Library is often asked about how the purchasing power of the pound has changed over various periods. This Research Paper
TARGET ZERO TEAM PROJECT DUI ZONE IDENTIFICATION AND BASELINE DATA KING COUNTY
 TARGET ZERO TEAM PROJECT DUI ZONE IDENTIFICATION AND BASELINE DATA 2005 2009 KING COUNTY TABLE OF CONTENTS COUNTY CHARACTERISTICS AND SUMMARY TOTAL FATAL COLLISIONS 4 DUI ZONE IDENTIFICATION... Overview
DOT HS April 2013
 TRAFFIC SAFETY FACTS 2011 Data DOT HS 811 753 April 2013 Overview Motor vehicle travel is the primary means of transportation in the United States, providing an unprecedented degree of mobility. Yet for
Residential Load Profiles
 Residential Load Profiles TABLE OF CONTENTS PAGE 1 BACKGROUND... 1 2 DATA COLLECTION AND ASSUMPTIONS... 1 3 ANALYSIS AND RESULTS... 2 3.1 Load Profiles... 2 3.2 Calculation of Monthly Electricity Bills...
National Household Travel Survey Add-On Use in the Des Moines, Iowa, Metropolitan Area
 National Household Travel Survey Add-On Use in the Des Moines, Iowa, Metropolitan Area Presentation to the Transportation Research Board s National Household Travel Survey Conference: Data for Understanding
Mr. John Aitken June 6, 2017 Page 2
 Mr. John Aitken June 6, 2017 Page 2 quarterly period of 2016. Fluctuations in noise exposure from reporting period to reporting period are to be expected due to ongoing changes in aircraft activity levels,
Traffic Safety Facts Research Note
 Traffic Safety Facts Research Note DOT HS 810 947 May 2008 Fatalities to Occupants of 15-Passenger Vans, 1997-2006 Summary n In 2006, fatalities to occupants of 15-passenger vans reached the lowest level
Driving Tests: Reliability and the Relationship Between Test Errors and Accidents
 University of Iowa Iowa Research Online Driving Assessment Conference 2001 Driving Assessment Conference Aug 16th, 12:00 AM Driving Tests: Reliability and the Relationship Between Test Errors and Accidents
Florida Strategic Highway Safety Planning Florida Strategic Highway Safety Plan (SHSP) Update and Performance Overview
 Update and Performance Overview") Session 1 Florida Strategic Highway Safety Planning Florida Strategic Highway Safety Plan (SHSP) Update and Performance Overview Joe Santos, PE, FDOT, State Safety Office October, 23, 2013 Florida Statistics
Session 1 Florida Strategic Highway Safety Planning Florida Strategic Highway Safety Plan (SHSP) Update and Performance Overview Joe Santos, PE, FDOT, State Safety Office October, 23, 2013 Florida Statistics
INSERO QUARTERLY, Q4 2014
 INSERO QUARTERLY, Q4 20 - Nordic electric vehicle market overview with the latest sales figures, infrastructure overview and the main market tendencies FEBRUARY 2015 INSERO QUARTERLY, Q4 20 3 INTRODUCTION
U.S. Classes 3-8 Used Trucks
 Americas Commercial Transportation Research Co., LLC www.actresearch.net COMMERCIAL VEHICLES State of the Industry U.S. Classes 3-8 Used Trucks May 215 Data Published June 24, 215 Contributor to Blue Chip
National Center for Statistics and Analysis Research and Development
 U.S. Department of Transportation National Highway Traffic Safety Administration DOT HS 809 271 June 2001 Technical Report Published By: National Center for Statistics and Analysis Research and Development
First Do No Harm: Why Seatbelts are a Patient Care Issue. Noah Smith, NHTSA Office of EMS
 First Do No Harm: Why Seatbelts are a Patient Care Issue Noah Smith, NHTSA Office of EMS Hi, I m Noah Standard Bureaucratic Disclaimer To the extent that I mention specific brands or products in this presentation,
SJTPO TRAFFIC SAFETY FACTS 2005: OCCUPANTS. TRENDS IN OCCUPANT FATALITIES Seatbelt Use; Occupant Ejected
 SJTPO TRAFFIC SAFETY FACTS 2005: OCCUPANTS TRENDS IN OCCUPANT FATALITIES Seatbelt Use; Occupant Ejected 2002-2005 William Schiavi Safety Analyst SJTPO March, 2007 3/3/2010 Purpose: This paper will answer
Traffic Safety Facts
 Part 1: Read Sources Source 1: Informational Article 2008 Data Traffic Safety Facts As you read Analyze the data presented in the articles. Look for evidence that supports your position on the dangers
October 23, September year. in 1Q confidence in our. exacerbated by the. 0.3 percent. outpu. (over) Index of Sales. Mar 12.
 Index of Sales. Mar 12.") October 23, 20122 REPORT ON BUSINESSS TRENDS September 20122 Industry Performance Reverts to Pace off GDP in Broad Economy Index of Sales September 2011 - September 2012 140 130 125 127 125 120 114 117
October 23, 20122 REPORT ON BUSINESSS TRENDS September 20122 Industry Performance Reverts to Pace off GDP in Broad Economy Index of Sales September 2011 - September 2012 140 130 125 127 125 120 114 117
D G A G R I D A S H B O A R D : A P P L E S
 75 79 60 56 49 74 65 59 54 42 76 63 58 53 78 55 42 43 79 44 81 63 47 83 64 59 53 48 Sources: Eurostat, MSs notifications, DG Agri, Comext, Comtrade, GTA, ITC, AMI, Expert groups, Freshfel, Wapa. 89 68
ANNUAL SUMMARY REPORT FY 2005 PERFORMANCE REPORT SUMMARY COMPARATIVE ANALYSIS
 ANNUAL SUMMARY REPORT FY 2005 PERFORMANCE REPORT SUMMARY COMPARATIVE ANALYSIS RAIL OPERATIONS: Rail Passenger injuries increased from 34 in FY04 to 41 in FY05. The Woodley Park collision accounted for
Utah Fatal Crash Summary 2014
 Utah Fatal Crash Summary 1 State of Utah Department of Public Safety Highway Safety Office W Amelia Earhart Dr # Salt Lake City, UT 8116 81-366-6 www.highwaysafety.utah.gov Preliminary Totals as of 1/29/
Presentation to the Customer Service, Operations and Safety Committee OPERATIONS PERFORMANCE INDICATORS
 Presentation to the Customer Service, Operations and Safety Committee OPERATIONS PERFORMANCE INDICATORS May 19, 2005 Department of Operations 100 95 90 85 80 75 70 65 A B C D RAIL PERFORMANCE INDEX FY
Material World How Does the USA Compare?
 Material World How Does the USA Compare? Center for Energy and Environmental Education, University of Northern Iowa WR teacher training 24-25/Website/Lessons/Material World How Does the USA Compare? Written
Coal Mine Safety Shortchanged by Years of Budget Cuts
 Coal Mine Safety Shortchanged by Years of Budget Cuts Congress created the Mine Safety and Health Administration (MSHA) in 1977, placing a new federal focus on miner safety and health. However, the agency's
High Quality Service through Continuous Improvement st Quarter Performance Report
 High Quality Service through Continuous Improvement 6 st Quarter Performance Report TriMet Board Meeting May 5, 6 Quality is a never ending quest and continuous improvement is a never ending way to discover
FOR IMMEDIATE RELEASE
 Article No. 7761 Available on www.roymorgan.com Roy Morgan Unemployment Profile Monday, 8 October 2018 Unemployment down to 9.4% in September off two-year high Australian employment has grown solidly over
MOTORISTS' PREFERENCES FOR DIFFERENT LEVELS OF VEHICLE AUTOMATION: 2016
 SWT-2016-8 MAY 2016 MOTORISTS' PREFERENCES FOR DIFFERENT LEVELS OF VEHICLE AUTOMATION: 2016 BRANDON SCHOETTLE MICHAEL SIVAK SUSTAINABLE WORLDWIDE TRANSPORTATION MOTORISTS' PREFERENCES FOR DIFFERENT LEVELS
WIM #37 was operational for the entire month of September Volume was computed using all monthly data.
 SEPTEMBER 2016 WIM Site Location WIM #37 is located on I-94 near Otsego in Wright county. The WIM is located only on the westbound (WB) side of I-94, meaning that all data mentioned in this report pertains
WHITE PAPER. Preventing Collisions and Reducing Fleet Costs While Using the Zendrive Dashboard
 WHITE PAPER Preventing Collisions and Reducing Fleet Costs While Using the Zendrive Dashboard August 2017 Introduction The term accident, even in a collision sense, often has the connotation of being an
Seat Belt Survey. Q1. When travelling in a car, do you wear your seat belt all of the time, most of the time, some of the time, or never?
 N F O C F g r o u p Seat Belt Survey Q1. When travelling in a car, do you wear your seat belt all of the time, most of the time, some of the time, or never? The majority of Canadians (85%) wear their seat
Unemployment Rates - November 2011
 December 2, 2011 DATA BRIEF: Black Employment and Unemployment in November 2011 The unemployment rate for Blacks was 15.5% last month. This is according to the latest report on the nation s employment
Total Production by Month (Acre Feet)
") Production by Month (acre-feet) 2008 2009 2010 2011 2012 2013 2014 2015 2016 January 25 339.10 228.90 249.50 297.99 243.06 327.14 247.66 212.37 February 234.00 218.80 212.10 241.52 245.82 279.08 234.16
Production by Month (acre-feet) 2008 2009 2010 2011 2012 2013 2014 2015 2016 January 25 339.10 228.90 249.50 297.99 243.06 327.14 247.66 212.37 February 234.00 218.80 212.10 241.52 245.82 279.08 234.16
RTCSNV CRASH ANALYSIS REPORT
 2011-2015 RTCSNV CRASH ANALYSIS REPORT TABLE OF CONTENTS Summary... 3 Crash Types... 4 Time and Day of Crashes... 7 Crash Factors... 9 Fatalities... 10 Driver s Behavior... 11 Crash Locations... 15 Non-Motorized
Highway Safety Update
 Highway Safety Update January 26, 2018 Karin Mongeon, Safety Division Bryon Fuchs, Local Government NDDOT Safety Division The Traffic Records Program Collect and analyze crash data to identify traffic
DISCOVER U.S. SPENDING MONITOR SM
 DISCOVER U.S. SPENDING MONITOR SM Mar Feb DSM 86.5 88.7 86.1 86.0 86.8 85.4 85.1 86.4 Spending 95.6 95.8 97.5 97.6 97.9 95.3 93.9 92.1 Econ 75.2 79.9 71.9 71.4 73.0 73.0 74.2 79.4 DSBW 74.6 86.9 84.6 71.8
III. Drug Testing Data:
 U.S. DEPARTMENT OF TRANSPORTATION DRUG AND ALCOHOL TESTING MIS DATA COLLECTION FORM Calendar Year Covered by this Report: OMB No. 2105-0529 I. Employer: Company Name: Doing Business As (DBA) Name (if applicable):
FOR IMMEDIATE RELEASE
 Article No. 7433 Available on www.roymorgan.com Roy Morgan Unemployment Profile Friday, 12 January 2018 2.6m Australians unemployed or under-employed in December The latest data for the Roy Morgan employment
Figure 1 Unleaded Gasoline Prices
 Policy Issues Just How Costly Is Gas? Summer 26 Introduction. Across the nation, the price at the pump has reached record highs. From unleaded to premium grade, prices have broken three dollars per gallon
The Funding of Pupil Transportation In North Carolina March, 2001
 The Funding of Pupil Transportation In North Carolina March, 2001 North Carolina Department of Public Instruction Division of School Support, Transportation Services Three main components of pupil transportation