2004 Utility Electric Contact Incident Report. Regarding Personal Injury Incidents Reported to the OPUC in 2003
|
|
|
- Doreen Simpson
- 6 years ago
- Views:
Transcription
1 2004 Utility Electric Contact Incident Report Regarding Personal Injury Incidents Reported to the OPUC in 2003
2 The Oregon Public Utility Commission does not discriminate on the basis of race, color, national origin, sex, sexual orientation, religion, age, or disability in employment or the provision of services. This document is available in alternate formats by calling (voice), (TTY) or electronically via the Oregon PUC Web site at (click on Safety )

3 v 2004 Utility Electric Contact Incident Report (For Injury Incidents reported in 2003) Compiled March 2004 Prepared by: Bob Sipler, Utility Safety and Reliability Section Oregon Public Utility Commission 550 Capitol St. NE, Ste. 215, PO Box 2148 Salem, Oregon Telephone: Internet:
4 Table of Contents Page Introduction 1 Chart: Incidents Reported By Electric Utilities 20 Year History 2 Summary 3 Description of Charts 4 Chart: Injury Severity 5 Chart: Type of Electrical System Involved 6 Description of Charts 7 Chart: When Incidents Occurred - By Month 8 Chart: When Incidents Occurred - By Day of Week and Hour of Day 9 Chart: Demographic Areas: Rural, Suburban, Urban and Construction 10 Chart: Where Incidents Occurred - By Area 11 Area Map 12 Description of Charts 13 Chart: Who Was Involved in Accidents - By Activity Classification 14 Chart: Who Was Involved in Accidents - By Age 15 Description of Charts 16 Chart: Tree-Related 20 Year History 17 Chart: Crane-Related 20 Year History 18 Chart: Irrigation Pipe-Related 20 Year History 19 Chart: Antenna-Related 20 Year History 20 Breakdown by Activity Involved 21 Chart: Children in Trees 20 Year History 22 Recommendations to Electric Utilities by the OPUC Safety Staff 23 Target Your Education Efforts 24
5 Introduction Incident reporting to the PUC is required by ORS (IOU s), and OAR ( all operators - defined in OAR (3)). The PUC Utility Safety and Reliability Staff uses this information to help with National Electrical Safety Code (NESC) administration and to promote accident prevention. The safe transportation of electric energy includes more than just building and maintaining facilities to meet a safety code. It is very seldom that an accident occurs because utility facilities do not meet the safety code. Incidents usually occur because of an unsafe act, not an unsafe condition. There is often a lack of awareness of the degree of danger. The innocent looking wire that a bird can land on, with impunity, has the potential to end, or change forever, the life of a person who touches it. It is essential that all of us who live and work around power lines understand the danger, the possible consequences, and how to avoid it. The electric utilities have some responsibility to provide this education. This report contains a series of written analysis sheets with accompanying graphs. The end of the report contains a summary and recommendations. Electric operators can use this information to more accurately target their public information program and their worker safety efforts. (Chart on Page 2) The first chart shows incident levels since 1984 (20 years). There have been some parallels with the level of past construction activity in Oregon. The graph shows that while 2002 and 2003 were not statistically years with an extreme number of accidents, there were quite a number of serious and fatal injuries recorded. 1
6 Incidents Reported By Electric Utilities - 20 Year History p Serious Injury Contacts All Reported Contacts Fatalities Average All Reported Contacts=24.8 (Fatalities and Hospitalizations) * * * Yes, an average of almost 25 people injured each year! * * * 2
7 Summary Here are some basic facts for 2003 incidents: 1. There were 20 people who made Injury* electrical contacts in 17 separate incidents with electric utility facilities. Six were fatalities, seven were hospitalizations, and seven fell into the minor or non-injury categories. 2. Most of the incidents involved distribution voltage (between 600V and 30,000V) overhead wires. (See pg. 6) 3. About half of the contacts were work related in 1995 and again in In 1997, there were about twice the number of work-related incidents to non-work incidents (i.e., 29 to 14). That ratio changed to approximately 3 to 1 (work to non-work) in There were 19 work to 5 non-work incidents in 1999 (approximately 4 to 1), continuing this trend. This trend did not continue in 2000, as the ratio was 2 to 1 (i.e., 16 to 8). In 2001, the work- to non-work incidents were about even, 6/7, 2002 was 9/7, and 2003 had a 10/7 ratio. Non-work incident causes have been predominately tree-related for several years (not the case in 2003). 4. Historically, most (all in 2001) of the contact victims have involved males. An extremely high (3 of the 20) number of women were injured in All involved vehicles hitting facilities (one airplane and two cars). Again, in 2003, there were three female victims, one when a car hit a pole and two pedestrians who contacted a low wire. 5. Two workers were seriously injured when booms contacted lines while highway guardrail work was being done. 6. There were only two tree-related incidents in One was a person trimming a branch in a friend s yard near a transmission line. The other was a landscape tree trimmer who dropped a branch onto a distribution line. 7. An unusually high number of collision type accidents occurred in Three people were in a sailboat, two in an airplane, and there were two cars that hit poles. A high number were reported again in 2003 with three fatalities related to airplane collisions and another with an automobile accident. * Injury as defined in OAR
8 The next two charts show: Injury Severity - A Minor injury is usually a trip to the hospital, first-aid-type treatment, and same-day release. Noninjury cases often involve a person who does not need or want any treatment or examination but has had contact with high voltage and has felt a shock. Hospitalization requires at least an overnight stay for injury treatment. A precautionary, for-observation stay, can be considered a minor injury. Please note the high number of fatalities in Type of Electrical System Involved - This chart shows that most utility electrical incidents result from contacts with overhead distribution conductors. These are the typical high voltage distribution wires found in most neighborhoods and along roads. There were three other incidents that involved transmission voltages of 69 KV and 115 KV. There were no contacts in 2003 that involved facilities inside substations, lower voltage secondary and service lines, or underground distribution lines. Two line workers were injured when they made contact with de-energized lines that had static charges because of nearby lines that induced a voltage on the dead line. Serious injuries can occur when this type of contact is made. 4
9 Injury Severity Number of People Average (10-year Period) Severity of Injury Fatal Hospitalized Total Reportable Contacts (Includes "minor" & "non-injury" contacts) 5
10 Type of Electrical System Involved 2003 Number of Incidents to 30,000 Volt ,001 to 500,000 Volt 600 to 30,000 Volt 600 to 30,000 Volt Under 600 Volt Induction Charge 0 Overhead Distribution Overhead Transmission Substation Underground Distribution Secondary Service Static Type of Electrical Facilities 6
11 The next two charts relate to When Incidents Occurred: By Month In 2003, there was a high degree of variability from month to month with less of a seasonal peak. Incidents in 2002 were higher during the summer months, except August, and more like the typical pattern seen in most years. By Day of Week and by Hour of Day This chart shows when incidents generally occur. This correlation between on and off work hours to actual work-related activity is not accurate in all cases. 7
12 When Incidents Occurred - By Month 5 4 Number of Incidents Jan Feb Mar Apr May Jun Jul Aug Sep Oct Nov Dec
13 When Incidents Occurred By Day of Week and Hour of Day Number of Incidents Sunday Monday Tuesday Wednesday Thursday Friday Saturday (Off Hours) Normal Work Hours Off Hours (Off Hours) (M - F, 7 AM - 5:30 PM) (M-F, 5:31 PM - 6:59 AM and Sat., Sun., & major holidays) Note: This chart does not indicate the number of work related or home/recreation related incidents. Some work related incidents occurred during "off" hours and some home/recreation incidents occurred during "work" hours. The total number of incidents did come out close to what is indicated with ten (10) work related incidents and seven (7) incidents that were not related to work activities. 9
14 The pie chart below indicates where people are injured in regard to Demographic Areas or Sites: Rural, Suburban, Urban, Industrial and Construction. Our statistics show rural areas typically have a higher rate than other types of areas. There were no accidents in suburban areas in 2003, which is unusual. Industrial - 1 Rural - 14 Urban - 5 Suburban - 0 Costruction - 0 The next chart and map indicates Where Contact Injuries Occurred: Five time periods are compared: 1999 through The most populated area of the state, the Northwest, has historically had the highest incident rate. 10
15 Where Contact Injuries Occurred - By Area 20 Northwest Southwest Northeast Southeast Number of People
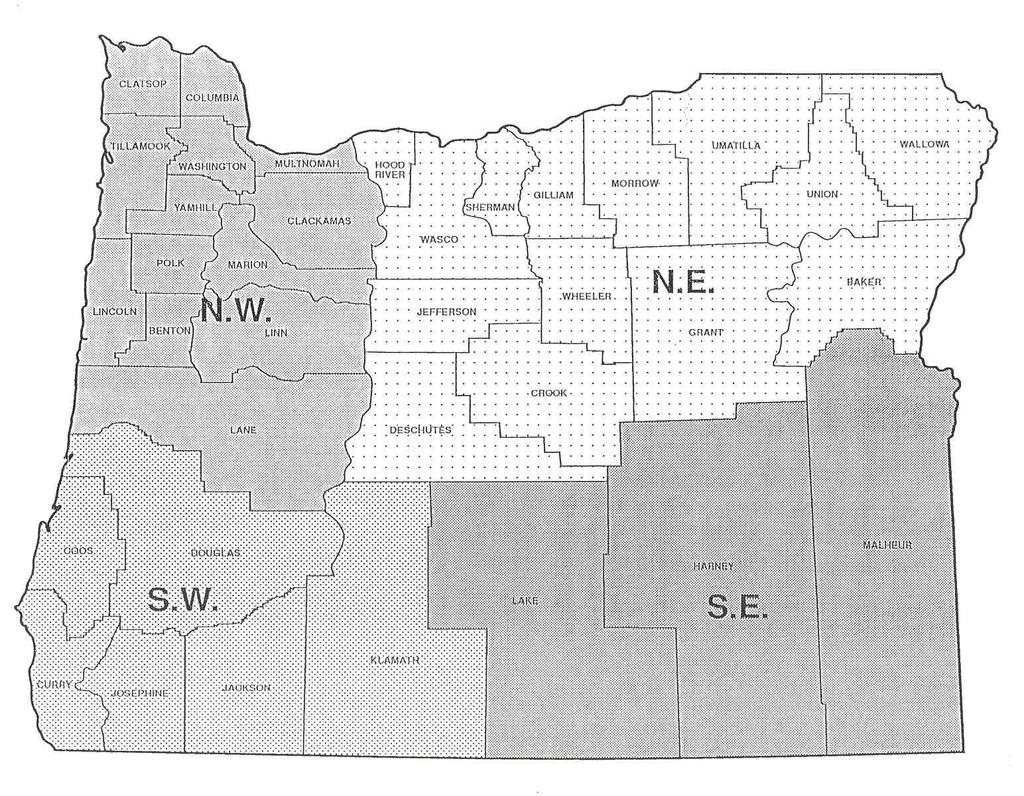
16 12
17 The next two charts indicate Who Was Involved In Accidents: By Activity Classification - This chart shows the trends over the last five years for the three categories. General worker accidents increased the last two years. This is hard to understand since general construction activity across the state doesn t seem to be increasing. By Age - This four-year chart shows the typical historical pattern where most of the incidents involve men in their 20s, 30s, and 40s. The pattern for 2001 and 2002 was somewhat different, in that injuries involving young men in the year old category were rare. The number of 2002 accidents to year olds was very high due to a single incident where three young men were injured in a boating accident has two unusual facts, with the 40s category at 0 and the 50s category very high at six injuries. 13
18 Who Was Involved In Accidents - 5 Year History By Activity Classification 16 Number of People General Public Line Worker Work Related (Residential, Recreation, etc.) (not Line) 14
19 Who Was Involved In Accidents - By Age 4-Year Comparison Number of People Age Bracket (The age of one person was not reported.) 15
20 The next four charts track 20 years of incidents related to certain equipment or activities. Tree-Related This category is, on average, where most people are injured. There has been an average of 5.25 treerelated contacts per year over the last twenty years. Many of these contacts involved homeowners trimming or falling trees in their yards. The majority of the remaining contacts were non-utility tree trimmers (landscapers) and loggers. If utility customers are going to get injured with high voltage lines, the chances are very high that it will be connected to a tree in their yard. The 2003 total of two injuries in this category is quite low. Crane-Related - Crane contact has been a continuing source of concern needing special attention by the electric utilities and Oregon OSHA. Over this 20-year period, there has been an average of 4.15 people injured each year. Here are some conclusions taken from recent crane incidents. Three of the five crane-related accidents for 2003 are digger booms on a track hoe or backhoe. The two fatalities were separate accidents involving cranes being used to work on highway guardrails. Crane contacts have been the most likely incident type to result in multiple victims. Line visibility is not a problem in most cases. Most operators know of the line s presence. The types of crane involved in line contacts are highly varied. Operator experience and training is highly varied. Moving cranes in the up position is dangerous. Cement pumper incidents are becoming more frequent (two in 1999 and another in 2001) Irrigation Pipe-Related - These incidents usually occur when farm workers raise pipes vertically to clear animals or debris. When a power line is above them, there are disastrous results. Constant utility education during certain times of year can help raise awareness and prevent accidents. Radio announcements seem to work well. Our investigations do reveal that even with education and awareness it is easy for people to just forget about the presence of overhead lines. Public service announcements on Spanish-speaking radio stations may be helpful. Two young men made this type of contact in 2003 when they tried to shake out a rat. They were aware of the line but lost control of the pipe. Their injuries, fortunately, seemed to be fairly minor. Antenna-Related - Antenna contact is another area of concern that usually involves members of the public installing or maintaining equipment near homes. 16
21 Tree Incidents Reported - 20 Year History Number of People Fatalities Total Contacts Annual Average Total Contacts =
22 Crane Incidents Reported - 20 Year History Number of People Fatalities Total Contacts Annual Average Total Contacts =
23 Irrigation Pipe Incidents Reported - 20 Year History Number of People Fatalities Total Contacts Annual Average Total Contacts =
24 Antenna Incidents Reported - 20 Year History Number of People Fatalities Total Contacts Annual Average Total Contacts =
25 Year 2003 Breakdown by Activity Involved (By Person Injured) Note: Some incidents fit into multiple categories. Tree Trimming/Falling or Other Contact Direct Contact By landscape tree trimmer 1 Vehicle hit pole-wire down-driver contact 1 By homeowner s friend 1 Power lineman contacts 3 Excavation/Dig-ins 0 Plane struck lines 3 Construction/Maintenance Pedestrians contact low conductor 2 Roofer metal roofing into line 1 Vehicle collision Irrigation Pipe 2 Aircraft 3 Crane/Lift/Digger booms Car hit pole 1 Cranes (Highway Guardrail work) 2 Homeowner (friends contractor) Diggers (Backhoe/Track hoe) into overhead lines 3 Tree related 2 Vehicle Antenna 1 Car hit pole 1 Recreation Dump truck (raised bed) 1 Shaking rat from irrigation pipe 2 Airplanes 3 Walking 2 Line/Utility Related Work Flying (ultra-light) 1 Overhead line work (electric) 3 Installing CB antenna 1 21
26 Children in Trees - 20 Years High Voltage Line Contacts in Oregon 3 Number of Children Injured (18 years and younger) Average Injury over 20-year period is about one every other year or.55 per year. This last chart, Children in Trees, reflects some serious statistics for an activity that concerns us all. Although there were no injuries in this category in the last four years, we cannot afford to become complacent. This is an important safety issue every year. Staff believes that consistent good tree-to-line clearances being maintained across the state is directly contributing to these excellent results. Remember the years 1980 through 1983 when there were 12 children injured this way. 22
27 Recommendations to Electric Utilities by the OPUC Safety Staff 1. Continue the effective general safety education programs now in place. These efforts are preventing accidents. Ongoing programs for schools are particularly encouraged. All grade school students in Oregon should receive power line safety education at least twice during these years. Some excellent bill stuffers have been developed and we recommend their use for educating customers about common hazards. 2. Focus educational programs to: a. Target construction workers where construction is anticipated. A special emphasis should be placed on work using crane or lift equipment. Crane related accidents have been very high when construction levels are up. Educate about dig-in hazards and one-call notification. b. Warn homeowners about electrical hazards related to trees. This is a key area needing emphasis to every customer. c. Continue education for agricultural workers. PUC staff specifically recommends broadcasting messages on Spanish language-speaking radio stations. Irrigation pipe accident prevention should particularly be emphasized. Stacking or laying out pipe under power lines should be discouraged (per OSHA rules). These incidents were high in 2000 and continue to be a problem area. 3. Emphasize utility worker safety programs to reduce the number of contact incidents. A significant number have been experienced in the last 11 years (total 59). Consider the expanded use of rubber gloves in any primary area, overhead and underground, energized or not. Trends indicate that accidents related to underground systems are on the rise. 4. Notification of utilities should be encouraged prior to all work or activities, which will occur near both overhead and underground lines. An overhead notification system coupled with the statewide underground one-call system is recommended. A system was instituted in 1997 related to logging operations. Each electrical utility should consider these recommendations with the perspective of knowing your local conditions and activities, priorities, and potential hazards. Our hope is that this information will help you develop an effective accident prevention program. 23
28 Target Your Education Efforts Use programs that have been successful in the past. Be creative in presenting information in attention getting ways. Try new ideas. Target problem areas. (Customers trimming their trees, cranes, work sites, and dig-ins.) Reward creative thinking and those who spot potential problem areas. Reward safe workers, especially those who consistently encourage safe practices for their crews. Give all employees the chance to know safety basics and be part of the accident prevention team. Electrical safety training should be a part of every grade school child s education at least twice. Consider using safety related bill stuffers regularly. Caution customers about tree related hazards. Encourage and participate in at least one (per year) utility worker safety day (or half day) with all operators who share the overhead and underground rights of way with you. Public Safety Education is an essential responsibility of the electric utility industry. 24
Alberta. Collision Facts. 330 people killed. 17,907 people injured. 140,705 collisions.
 Collision Facts 330 people killed 17,907 people injured 140,705 collisions May 2017 www.transportation.alberta.ca/statistics Collision Facts 330 people killed 17,907 people injured 140,705 collisions Monday
PT4 Pump Station, Turkey
 HEALTH AND SAFETY 9 PT4 Pump Station, Turkey PSG2 employees, Georgia KP 377, Azerbaijan 9 9 HEALTH AND SAFETY All efforts continued this quarter to observe the stringent health and safety targets set by
EEI Occupational Safety & Health Committee Conference Public Safety Issues and Trends
 EEI Occupational Safety & Health Committee Conference Public Safety Issues and Trends Anthony J. Calega Vice President, Loss Control October 7, 2008 A E G I S AssociatedElectric Gas Insurance Services
Alberta Speeding Convictions and Collisions Involving Unsafe Speed
 Alberta Speeding Convictions and Collisions Involving Unsafe Speed 2004-2008 Overview This document was prepared under the Alberta Traffic Safety Plan, Strategic Research Plan for 2008-2010, with the objective
Provisional Review of Fatal Collisions. January to December 31 st 2017
 Provisional Review of Fatal Collisions January to December 31 st 17 2 nd January 18 Review of 17 fatal collision statistics as of 31st December 17 Overview This report summarises the main trends in road
STATISTICS ELECTRICAL INCIDENTS IN ALBERTA. January 1 to December 31, 2012
 Safety Services 16 th floor, Commerce Place Tel: 1-866-421-6929 10155 102 nd Street Fax: 780-427-8686 Edmonton, Alberta Canada T5J 4L4 STATISTICS ELECTRICAL INCIDENTS IN ALBERTA January 1 to December 31,
For your SAFETY. Click Before You Dig, Drill or Excavate. Plan ahead. Dangers of hitting underground lines. May/June 2018
 Click Before You Dig, Drill or Excavate At this time of year many Manitoba homeowners are itching to get outside to begin working in their yards. If you re among this group and if you re planning any project
STATISTICS RE: ELECTRICAL INCIDENTS IN ALBERTA to
 Safety Services 16 th floor, Commerce Place Tel 1-866/421-6929 10155 102 nd Street Fax 780/427-8686 Edmonton, Alberta Canada T5J 4L4 STATISTICS RE: ELECTRICAL INCIDENTS IN ALBERTA 01 01 to 12 31 Regulations
STATISTICS ELECTRICAL INCIDENTS IN ALBERTA. January 1 to December 31, 2017
 Community and Technical Support 16 th floor, Commerce Place Tel: 1-866-421-6929 10155 102 nd Street Fax: 780-427-8686 Edmonton, Alberta Canada T5J 4L4 STATISTICS ELECTRICAL INCIDENTS IN ALBERTA January
Department of Highway Safety and Motor Vehicles
 Department of Highway Safety and Motor Vehicles Traffic Report 2005 A Compilation of Motor Vehicle Crash Data from the Florida Crash Records Database Fred O. Dickinson Executive Director Our Mission: Making
Austin Police Department. An Analysis of Traffic Fatalities 2015
 Austin Police Department An Analysis of Traffic Fatalities Prepared by the Austin Police Department Research and Planning Unit April Table of Contents Background... Overview... Terminology... Notes about
OKLAHOMA CORPORATION COMMISSION REGULATED ELECTRIC UTILITIES 2018 RELIABILITY SCORECARD
 OKLAHOMA CORPORATION COMMISSION REGULATED ELECTRIC UTILITIES 2018 RELIABILITY SCORECARD June 1, 2018 Table of Contents 1.0 Introduction...3 2.0 Summary...3 3.0 Purpose...3 4.0 Definitions...4 5.0 Analysis...5
STATISTICS RE: ELECTRICAL INCIDENTS IN ALBERTA to
 Safety Services th 16 floor, Commerce Place Tel 1-866/421-6929 10155 102 nd Street Fax 780/427-8686 Edmonton, Alberta Canada T5J 4L4 STATISTICS RE: ELECTRICAL INCIDENTS IN ALBERTA 01 01 to 12 31 Regulations
Denver Car Share Program 2017 Program Summary
 Denver Car Share Program 2017 Program Summary Prepared for: Prepared by: Project Manager: Malinda Reese, PE Apex Design Reference No. P170271, Task Order #3 January 2018 Table of Contents 1. Introduction...
TABLE OF CONTENTS CRASHES.. VI TRENDS. VII
 TABLE OF CONTENTS Introduction. I Letter from the Governor II Executive Summary of this Report. III-IV 1998 Nevada Quick Collision Facts V CRASHES.. VI a. Statewide Total Crashes by Severity... 1 b. Statewide
ELECTRICAL SAFET Y FOR CONTRACTORS
 ELECTRICAL SAFET Y FOR CONTRACTORS TABLE OF CONTENTS Electricity Demands Respect... 2 Before Starting to Work Let Us Help You...2 Basic Rules for Electrical Safety...2 Common Dangers for Contractors...3
LOADING AND UNLOADING SURVEY NATIONAL SCHOOL BUS. Kansas leads the world in the success of each student.
 NATIONAL SCHOOL BUS LOADING AND UNLOADING SURVEY Kansas leads the world in the success of each student. January 2018 The Kansas State Department of Education School Bus Safety Unit wishes to thank the
Road Safety s Mid Life Crisis The Trends and Characteristics for Middle Aged Controllers Involved in Road Trauma
 Road Safety s Mid Life Crisis The Trends and Characteristics for Middle Aged Controllers Involved in Road Trauma Author: Andrew Graham, Roads and Traffic Authority, NSW Biography: Andrew Graham has been
INTECH JUNE QHSE PERFORMANCE
 INTECH QHSE PERFORMANCE - MONTHLY QHSE PERFORMANCE Goal Zero Days ( worked days without Lost Time Injury (LTI)) 689 This Month Minor Accidents or Incidents This Month Major Accidents or Incidents Last
SPATIAL AND TEMPORAL PATTERNS OF FATIGUE RELATED CRASHES IN HAWAII
 SPATIAL AND TEMPORAL PATTERNS OF FATIGUE RELATED CRASHES IN HAWAII By Karl E. Kim Eric Y. Yamashita Hawaii CODES Project Traffic Records Forum July 29 - August 2, 2001 New Orleans, Louisiana Overview Background
ITSMR Research Note. Motorcyclists and Impaired Driving ABSTRACT INTRODUCTION KEY FINDINGS. September 2013
 September 2013 KEY FINDINGS F&PI CRASHES INVOLVING IMPAIRED MOTORCYCLISTS 27% of the fatal MC crashes over the five year period, 2008-2012, were alcohol-related. 48% of the alcohol-related F&PI MC crashes
NON-FATAL ELECTRICAL INJURIES AT WORK
 NON-FATAL ELECTRICAL INJURIES AT WORK Richard Campbell May 2018 Copyright 2018 National Fire Protection Association (NFPA) CONTENTS Findings and Trends 1 Key Takeaways 2 Background on Data Sources and
STATISTICS ELECTRICAL INCIDENTS IN ALBERTA. January 1 to December 31, 2013
 Safety Services 16 th floor, Commerce Place Tel: 1-866-421-6929 10155 102 nd Street Fax: 780-427-8686 Edmonton, Alberta Canada T5J 4L4 STATISTICS ELECTRICAL INCIDENTS IN ALBERTA January 1 to December 31,
WIM #37 was operational for the entire month of September Volume was computed using all monthly data.
 SEPTEMBER 2016 WIM Site Location WIM #37 is located on I-94 near Otsego in Wright county. The WIM is located only on the westbound (WB) side of I-94, meaning that all data mentioned in this report pertains
Young drivers. Drivers involved in fatal or injury crashes. Drivers involved in fatal/injury crashes per 100. per licence holders (lines)
") Young drivers CRASH FACTSHEET 2012 CRASH STATISTICS FOR THE YEAR ENDED 31 DECEMBER 2011 Prepared by the Ministry of Transport In 2011 young drivers aged 15 24 were involved in 80 fatal traffic crashes,
Young drivers CRASH FACTSHEET 2012 CRASH STATISTICS FOR THE YEAR ENDED 31 DECEMBER 2011 Prepared by the Ministry of Transport In 2011 young drivers aged 15 24 were involved in 80 fatal traffic crashes,
OKLAHOMA CORPORATION COMMISSION REGULATED ELECTRIC UTILITIES 2017 RELIABILITY SCORECARD
 OKLAHOMA CORPORATION COMMISSION REGULATED ELECTRIC UTILITIES 2017 RELIABILITY SCORECARD May 1, 2017 Table of Contents 1.0 Introduction...3 2.0 Summary...3 3.0 Purpose...3 4.0 Definitions...4 5.0 Analysis...5
COMPARISON OF FIXED & VARIABLE RATES (25 YEARS) CHARTERED BANK ADMINISTERED INTEREST RATES - PRIME BUSINESS*
 CHARTERED BANK ADMINISTERED INTEREST RATES - PRIME BUSINESS*") COMPARISON OF FIXED & VARIABLE RATES (25 YEARS) 2 Fixed Rates Variable Rates For Internal Use Only. FIXED RATES OF THE PAST 25 YEARS AVERAGE RESIDENTIAL MORTGAGE LENDING RATE - 5 YEAR* (Per cent) Year
COMPARISON OF FIXED & VARIABLE RATES (25 YEARS) 2 Fixed Rates Variable Rates For Internal Use Only. FIXED RATES OF THE PAST 25 YEARS AVERAGE RESIDENTIAL MORTGAGE LENDING RATE - 5 YEAR* (Per cent) Year
COMPARISON OF FIXED & VARIABLE RATES (25 YEARS) CHARTERED BANK ADMINISTERED INTEREST RATES - PRIME BUSINESS*
 CHARTERED BANK ADMINISTERED INTEREST RATES - PRIME BUSINESS*") COMPARISON OF FIXED & VARIABLE RATES (25 YEARS) 2 Fixed Rates Variable Rates FIXED RATES OF THE PAST 25 YEARS AVERAGE RESIDENTIAL MORTGAGE LENDING RATE - 5 YEAR* (Per cent) Year Jan Feb Mar Apr May Jun
COMPARISON OF FIXED & VARIABLE RATES (25 YEARS) 2 Fixed Rates Variable Rates FIXED RATES OF THE PAST 25 YEARS AVERAGE RESIDENTIAL MORTGAGE LENDING RATE - 5 YEAR* (Per cent) Year Jan Feb Mar Apr May Jun
WIM #29 was operational for the entire month of October Volume was computed using all monthly data.
 OCTOBER 2015 WIM Site Location WIM #29 is located on US 53 near Cotton in St Louis county. System Operation WIM #29 was operational for the entire month of October 2015. Volume was computed using all monthly
WIM #31 US 2, MP 8.0 EAST GRAND FORKS, MN JANUARY 2015 MONTHLY REPORT
 WIM #31 US 2, MP 8.0 EAST GRAND FORKS, MN JANUARY 2015 MONTHLY REPORT WIM #31 EAST GRAND FORKS MONTHLY REPORT - JANUARY 2015 WIM Site Location WIM #31 is located on US 2 at mile post 8.0, southeast of
The impact of electric vehicle development on peak demand and the load curve under different scenarios of EV integration and recharging options
 The impact of electric vehicle development on peak demand and the load curve under different scenarios of EV integration and recharging options Electricity demand in France: a paradigm shift Electricity
VEHICLE / PEDESTRIAN COLLISIONS
 Info item No. 1 Crosswalk Safety Advisory Committee March 31, 2016 VEHICLE / PEDESTRIAN COLLISIONS HRM: January December 20 DISCLAIMER: All figures presented in this report reflect the information held
INTECH AUGUST QHSE PERFORMANCE
 INTECH QHSE PERFORMANCE - MONTHLY QHSE PERFORMANCE Goal Zero Days ( worked days without Lost Time Injury (LTI)) 751 This Month Minor Accidents or Incidents 01 This Month Major Accidents or Incidents 00
Equipment Overview. Robert M. Friend Acting Deputy Assistant Secretary Mine Safety and Health Administration
 Equipment Overview Robert M. Friend Acting Deputy Assistant Secretary Mine Safety and Health Administration Today s s Discussion Seatbelt Usage/Accidents Ingress/Egress Accidents Human Demographics Potential
Electrical Safety in the Workplace
 Electrical Safety in the Workplace Increasing Electrical Safety in the Workplace through Purchasing and Procurement Robert Mitchell, Safety and Technical Safety Advisor Safety Risk, Policy and Innovation
Presented by Eric Englert Puget Sound Energy September 11, 2002
 Results from PSE s First Year of Time of Use Program Presented by Eric Englert Puget Sound Energy September 11, 2002 Puget Sound Energy Overview 973,489 Total Electric Customers 908,949 are AMR Capable
briefing notes road safety issues
 briefing notes road safety briefing notes road safety issues Land Transport New Zealand has prepared this road safety issues report. It is based on reported crash data and trends for the 2002 2006 period.
WIM #41 CSAH 14, MP 14.9 CROOKSTON, MINNESOTA APRIL 2014 MONTHLY REPORT
 WIM #41 CSAH 14, MP 14.9 CROOKSTON, MINNESOTA APRIL 2014 MONTHLY REPORT In order to understand the vehicle classes and groupings, the MnDOT Vehicle Classification Scheme and the Vehicle Classification
Fatal Motor Vehicle Crashes on Indian Reservations
 April 2004 DOT HS 809 727 Fatal Motor Vehicle Crashes on Indian Reservations 1975-2002 Technical Report Colleges & Universities 2% Other Federal Properties 9% Other 4% Indian Reservations 65% National
Monthly promotions. October 2018 Puget Sound Energy bill inserts and information. Download inserts
 Monthly promotions October 2018 Puget Sound Energy bill inserts and information Included in your electronic or mailed statement is information on ways to save energy and manage costs, as well as safety
Commercial-in-Confidence Ashton Old Baths Financial Model - Detailed Cashflow
 Year 0 1 2 3 4 5 6 7 8 9 10 11 12 13 Oct-16 Nov-16 Dec-16 Jan-17 Feb-17 Mar-17 Apr-17 May-17 Jun-17 Jul-17 Aug-17 Sep-17 Oct-17 2,038 2,922 4,089 4,349 6,256 7,124 8,885 8,885 8,885 8,885 8,885 8,885 9,107
TENTH DISTRICT MANUFACTURING SURVEY REBOUNDED MODERATELY Federal Reserve Bank of Kansas City Releases January Manufacturing Survey
 FOR RELEASE Thursday, January 23, 2014 EMBARGOED FOR 10 A.M. CENTRAL TIME CONTACT: Bill Medley 816-881-2556 Bill.Medley@kc.frb.org TENTH DISTRICT MANUFACTURING SURVEY REBOUNDED MODERATELY Federal Reserve
Trip Generation and Parking Study New Californian Apartments, Berkeley
 Trip Generation and Parking Study New Californian Apartments, Berkeley Institute of Transportation Engineers University of California, Berkeley Student Chapter Spring 2012 Background The ITE Student Chapter
WIM #41 CSAH 14, MP 14.9 CROOKSTON, MINNESOTA MAY 2013 MONTHLY REPORT
 WIM #41 CSAH 14, MP 14.9 CROOKSTON, MINNESOTA MAY 2013 MONTHLY REPORT In order to understand the vehicle classes and groupings the Mn/DOT Vehicle Classification Scheme and the Vehicle Classification Groupings
Traffic Accident Statistics
 2000 Missouri State Highway System Traffic Accident Statistics Missouri State Highway System Traffic Accident Statistics Table of Contents Subject Chapter 1: Statewide Traffic Accident Statistics, Introduction
May ATR Monthly Report
 May ATR Monthly Report Minnesota Department of Transportation Office of Transportation Data and Analysis May 2011 Introduction The purpose of this report is to examine monthly traffic trends on Minnesota
Parking Management Element
 Parking Management Element The State Transportation Planning Rule, adopted in 1991, requires that the Metropolitan Planning Organization (MPO) area implement, through its member jurisdictions, a parking
the Ministry of Transport is attributed as the source of the material images contained in the material are not copied
 Speed 2017 Disclaimer All reasonable endeavours are made to ensure the accuracy of the information in this report. However, the information is provided without warranties of any kind including accuracy,
the Ministry of Transport is attributed as the source of the material
 Young Drivers 2016 Disclaimer All reasonable endeavours are made to ensure the accuracy of the information in this report. However, the information is provided without warranties of any kind including
The Dangers of Equipment & Vehicle Interaction (are we gambling with the risk?) Presented by Cres Bulger (Inspector Of Mines - DNRM)
 Presented by Cres Bulger (Inspector Of Mines - DNRM)") The Dangers of Equipment & Vehicle Interaction (are we gambling with the risk?) Presented by Cres Bulger (Inspector Of Mines - DNRM) Contents This presentation explores recent HPI data and prior history
The Dangers of Equipment & Vehicle Interaction (are we gambling with the risk?) Presented by Cres Bulger (Inspector Of Mines - DNRM) Contents This presentation explores recent HPI data and prior history
JOB CLASSIFICATION: Heavy Equipment Operator
 JOB CLASSIFICATION: Heavy Equipment Operator SALARY: $6,146 - $7,115 Monthly $73,752 - $85,380 Annually OPENING DATE: Monday, March 28, 2016 CLOSING DATE: Friday, April 8, 2016 by 4:30 p.m. OPEN TO: General
Transportation Demand Management Element
 Transportation Demand Management Element Over the years, our reliance on the private automobile as our primary mode of transportation has grown substantially. Our dependence on the automobile is evidenced
January Manufacturing Technology Orders Off After a Strong December
 Contact: Bonnie Gurney, AMT, 703-827-5277 bgurney@amtonline.org For Release: March 9, 2015 January Manufacturing Technology Orders Off After a Strong December January U.S. manufacturing technology orders
Highway worker crushed by swinging backhoe boom
 Highway worker crushed by swinging backhoe boom SUMMARY On July 1, 2007, a 47-year-old road construction worker was killed while working on the ground alongside a backhoe. The worker was a journeyman equipment
National Household Travel Survey Add-On Use in the Des Moines, Iowa, Metropolitan Area
 National Household Travel Survey Add-On Use in the Des Moines, Iowa, Metropolitan Area Presentation to the Transportation Research Board s National Household Travel Survey Conference: Data for Understanding
2010 Motorcycle Risk Study Update
 2010 Motorcycle Risk Study Update Introduction This report provides an update to the Motorcycle Risk Study from AI.16 of the 2005 Rate Application. The original study was in response to Public Utilities
Could also be a Near Hit
 A near miss is an unplanned event that did not result in a fatal injury but had the potential to do so. Only a fortunate break in the chain of events prevented an injury, fatality or damage; in other words,
Pedestrians Road Safety
 Pedestrians Road Safety Overview According to the World Health Organization, the World Bank, the FIA Foundation for the Automobile and Society and the Global Road Safety Partnership collaborative report
Sound Transit Operations July 2016 Service Performance Report. Ridership
 Ridership Total Boardings by Mode Mode Jul-15 Jul-16 % YTD-15 YTD-16 % ST Express 1,618,779 1,545,852-4.5% 10,803,486 10,774,063-0.3% Sounder 333,000 323,233-2.9% 2,176,914 2,423,058 11.3% Tacoma Link
Florida Public Service Commission 2011 Hurricane Season Preparation Briefing
 Florida Public Service Commission 2011 Hurricane Season Preparation Briefing OUC The Reliable One May 4, 2011 Byron Knibbs Vice President, Sustainable Services (407) 434-2194 bknibbs@ouc.com 1 Florida
Chevron s Fatality Prevention Team and Focus
 Chevron s Fatality Prevention Team and Focus Kevin Moran Global Drilling and Completions HES Advisor October 18 th 2012 A Presentation to: The Greater Houston Industrial Hygiene Council Summary Of Presentation
ANNUAL SUMMARY REPORT FY 2005 PERFORMANCE REPORT SUMMARY COMPARATIVE ANALYSIS
 ANNUAL SUMMARY REPORT FY 2005 PERFORMANCE REPORT SUMMARY COMPARATIVE ANALYSIS RAIL OPERATIONS: Rail Passenger injuries increased from 34 in FY04 to 41 in FY05. The Woodley Park collision accounted for
WIM #48 is located on CSAH 5 near Storden in Cottonwood county.
 WIM Site Location WIM #48 is located on CSAH 5 near Storden in Cottonwood county. System Operation WIM #48 was operational for the entire month of August 2017. Volume was computed using all monthly data.
Road Safety. Background Information. Motor Vehicle Collisions
 Background Information Motor Vehicle Collisions For many Canadians, the riskiest part of their job is their time spent on the road driving. Motor vehicle collisions are the leading cause of injury and
RIDERSHIP TRENDS. March 2017
 RIDERSHIP TRENDS March 2017 Prepared by the Division of Strategic Capital Planning May 2017 Table of Contents Executive Summary...1 Ridership...3 Estimated Passenger Trips by Line...3 Estimated Passenger
THE STATE OF SAFETY IN THE REFUSE INDUSTRY
 THE STATE OF SAFETY IN THE REFUSE INDUSTRY JANUARY 31, 2018 David Biderman, ED/CEO 240-494-2254 dbiderman@swana.org What is SWANA? SWANA is the largest association for the waste sector in the United States
LONG RANGE PERFORMANCE REPORT. Study Objectives: 1. To determine annually an index of statewide turkey populations and production success in Georgia.
 State: Georgia Grant Number: 08-953 Study Number: 6 LONG RANGE PERFORMANCE REPORT Grant Title: State Funded Wildlife Survey Period Covered: July 1, 2010 - June 30, 2011 Study Title: Wild Turkey Production
MSHA s Rules to Live By Stakeholder Meeting MSHA Headquarters, Arlington, VA January 27, 2010
 MSHA s Rules to Live By Stakeholder Meeting MSHA Headquarters, Arlington, VA January 27, 2010 MSHA s Fatality Prevention Program Reflects MSHA s commitment to eliminate hazards with the most serious consequences
20 January Road Safety in Provisional results. Manuelle SALATHÉ Head of the French Road Safety Observatory (ONISR)
") 20 January 2014 Road Safety in 2013 Provisional results Manuelle SALATHÉ Head of the French Road Safety Observatory (ONISR) 1 Table of contents 1. Provisional results in 2013 2. Long trends 3. 10-year
20 January 2014 Road Safety in 2013 Provisional results Manuelle SALATHÉ Head of the French Road Safety Observatory (ONISR) 1 Table of contents 1. Provisional results in 2013 2. Long trends 3. 10-year
Meter Insights for Downtown Store
 Meter Insights for Downtown Store Commodity: Analysis Period: Prepared for: Report Date: Electricity 1 December 2013-31 December 2014 Arlington Mills 12 February 2015 Electricity use over the analysis
Stay Safe Around Electricity Teacher s Guide
 Stay Safe Around Electricity Teacher s Guide INTRODUCTION The Stay Safe Around Electricity activity booklet can be used as a follow-up to an electric utility presentation or as a stand-alone piece to teach
STOR Market Information Report TR27
 STOR Market Information Report TR27 Original Published 2 nd October 215. Update published 3 th October 215 minor volume corrections Foreword Welcome to the TR27 Market Information Report. It was good to
August ATR Monthly Report
 August ATR Monthly Report Minnesota Department of Transportation Office of Transportation Data and Analysis August 2011 Introduction The purpose of this report is to examine monthly traffic trends on
Traffic & Transportation Issues
 Traffic & Transportation Issues 2012 to 2045 FOR DISCUSSION PURPOSES ONLY M ANITOBA B UREAU OF S TATISTICS RIGHT ANSWERS RIGHT NOW January 18, 2016 Traffic & Transportation Issues The general growth of
tractors Rollover backwards Age Age specific rates of tractor related fatalities of working persons, Australia 1989 to 1992
 tractors Rollover backwards A middle aged man was using a tractor on his land to pull a large dead shrub out of the ground. He placed a chain around the base of the shrub and attached the other end to
Percentage of crashes with driving too fast for the conditions cited as a contributing factor ( ) 0% 5% 10% 15% 20% 25% 30% 35% Percentage
 0% 5% 10% 15% 20% 25% 30% 35% Percentage") Speeding CRASH FACTSHEET November 2013 CRASH STATISTICS FOR THE YEAR ENDED 31 DECEMBER 2012 Prepared by the Ministry of Transport In this fact sheet speeding is defined as driving too fast for the conditions.
Speeding CRASH FACTSHEET November 2013 CRASH STATISTICS FOR THE YEAR ENDED 31 DECEMBER 2012 Prepared by the Ministry of Transport In this fact sheet speeding is defined as driving too fast for the conditions.
FOR IMMEDIATE RELEASE
 Article No. 5842 Available on www.roymorgan.com Roy Morgan Unemployment Profile Thursday, 2 October 2014 Unemployment climbs to 9.9% in September as full-time work lowest since October 2011; 2.2 million
WHITE PAPER. Preventing Collisions and Reducing Fleet Costs While Using the Zendrive Dashboard
 WHITE PAPER Preventing Collisions and Reducing Fleet Costs While Using the Zendrive Dashboard August 2017 Introduction The term accident, even in a collision sense, often has the connotation of being an
1999 Missouri State Highway System. Missouri Department of Transportation - Transportation Management Systems
 1999 Missouri State Highway System Traffic Accident Statistics - Transportation Management Systems Missouri State Highway System Traffic Accident Statistics Table of Contents Subject Chapter 1: Statewide
Pedestrians Road Safety
 Pedestrians Road Safety Overview Over the period 1996-2009, 5,323 people have been killed on Irish road. Out of this 22% (1162) were pedestrians. Additional 3863 pedestrians were seriously injured in the
TARGET ZERO TEAM PROJECT DUI ZONE IDENTIFICATION AND BASELINE DATA SNOHOMISH COUNTY
 TARGET ZERO TEAM PROJECT DUI ZONE IDENTIFICATION AND BASELINE DATA 2005 2009 SNOHOMISH COUNTY TABLE OF CONTENTS COUNTY CHARACTERISTICS AND SUMMARY... TOTAL FATAL COLLISIONS 4 DUI ZONE IDENTIFICATION...
September 2016 Water Production & Consumption Data
 September 2016 Water Production & Consumption Data September 2016 monthly water production (288.48 AF) was lowest in at least 17 years. Monthly water production has increased slightly each month since
JAUNT SAFETY REPORT TO THE BOARD 1st QUARTER FY19
 JAUNT SAFETY REPORT TO THE BOARD 1st QUARTER FY19 Vehicle Accidents: During the first quarter of FY19, JAUNT had four (4) preventable accidents and three (3) non-preventable accidents for a total of seven
US Rt. 12/20/45 at US Rt. 20 <Westbound and Southbound>
 US Rt. 12/20/45 at US Rt. 20 Village of Stone Park, Illinois R L R F o l l o w - U p E v a l u a t i o n R e p o r t Reference No: 016-43280 December 2010 Table of Contents
In Recognition of National Work Zone Safety Awareness Week April 11-15, 2016 Presentation Provided by Alabama Struck By Alliance
 TOOL BOX SAFETY TALK In Recognition of National Work Zone Safety Awareness Week April 11-15, 2016 Presentation Provided by Alabama Struck By Alliance 1 GOALS To prevent highway construction and utility
2015 Community Report Los Lunas
 25 Los Lunas Produced for the New Mexico Department of Transportation, Traffic Safety Division, Traffic Records Bureau, Under Contract 58 by the University of New Mexico, Geospatial and Population Studies,
Total Production by Month (Acre Feet)
") Production by Month (acre-feet) 2008 2009 2010 2011 2012 2013 2014 2015 2016 January 25 339.10 228.90 249.50 297.99 243.06 327.14 247.66 212.37 February 234.00 218.80 212.10 241.52 245.82 279.08 234.16
Production by Month (acre-feet) 2008 2009 2010 2011 2012 2013 2014 2015 2016 January 25 339.10 228.90 249.50 297.99 243.06 327.14 247.66 212.37 February 234.00 218.80 212.10 241.52 245.82 279.08 234.16
Passive Investors and Managed Money in Commodity Futures. Part 2: Liquidity. Prepared for: The CME Group. Prepared by:
 Passive Investors and Managed Money in Commodity Futures Part 2: Liquidity Prepared for: The CME Group Prepared by: October, 2008 Table of Contents Section Slide Number Objectives and Approach 3 Findings
2015 Community Report White Rock
 5 White Rock Produced for the New Mexico Department of Transportation, Traffic Safety Division, Traffic Records Bureau, Under Contract 58 by the University of New Mexico, Geospatial and Population Studies,
2016 Community Report Los Alamos County
 6 Los Alamos County Produced for the New Mexico Department of Transportation, Traffic Safety Division, Traffic Records Bureau, Under Contract 58 by the University of New Mexico, Geospatial and Population
2017 Adjusted Count Report February 12, 2018
 A statewide multi-use trail user study and volunteer data collection program 2017 Adjusted Count Report February 12, 2018 The following report includes the final adjusted infrared (IR) counter data at
Who has trouble reporting prior day events?
 Vol. 10, Issue 1, 2017 Who has trouble reporting prior day events? Tim Triplett 1, Rob Santos 2, Brian Tefft 3 Survey Practice 10.29115/SP-2017-0003 Jan 01, 2017 Tags: missing data, recall data, measurement
JBBA Incident 1-NOV Saih Al Ahmar Incident 12-May Barka Incident 10-SEP-2011.
 JBBA Incident 1-NOV-2011. Saih Al Ahmar Incident 12-May-2001. Barka Incident 10-SEP-2011. Incident Detail Date of Incident : 1-NOV-2011 Location : JBBA District Saih AL-Ula. Actual Severity : 3 Fatalities.
Occupational Driving Consider the Risks. Sandra Wilson, OSACH
 Occupational Driving Consider the Risks Sandra Wilson, OSACH Session Outline Who is driving for work purposes? What are the risks factors? How can I minimize these risks? 2 What do you think? True or false:
TRAFFIC SAFETY FACTS. Overview Data
 TRAFFIC SAFETY FACTS 2009 Data Overview Motor vehicle travel is the primary means of transportation in the United States, providing an unprecedented degree of mobility. Yet for all its advantages, injuries
RTCSNV CRASH ANALYSIS REPORT
 2011-2015 RTCSNV CRASH ANALYSIS REPORT TABLE OF CONTENTS Summary... 3 Crash Types... 4 Time and Day of Crashes... 7 Crash Factors... 9 Fatalities... 10 Driver s Behavior... 11 Crash Locations... 15 Non-Motorized
Electrical Awareness for Construction Activities. Overhead Power Lines & Underground Cables
 Electrical Awareness for Construction Activities Overhead Power Lines & Underground Cables Electrical Awareness for Construction Activities Electrical appreciation Agenda Overview of the electrical distribution
2016 Community Report Portales
 6 Portales Produced for the New Mexico Department of Transportation, Traffic Safety Division, Traffic Records Bureau, Under Contract 58 by the University of New Mexico, Geospatial and Population Studies,
Demand and Time of Use Rates. Marty Blake The Prime Group LLC
 Demand and Time of Use Rates Marty Blake The Prime Group LLC Factors Affecting Electric Rates Generation plant cost increases Fuel price increases and volatility Carbon and environmental regulations Cost
VOL. 53 NO. 9. LENGTH OF COMMITMENT You can discontinue your solar energy commitment at any time by notifying us. If you
 The news you need to know in 5 minutes! VOL. 53 NO. 9 CAMILLA, GEORGIA www.mitchellemc.com MITCHELL EMC is pleased to present our cooperative solar project. Our site consists of a 20-megawatt solar electricity