Mission Statement. Page 2
|
|
|
- Stephen Price
- 6 years ago
- Views:
Transcription
1
2 Page 1

3 Mission Statement To enhance the quality of life of residents and visitors by providing the highest level of safe, clean, affordable responsive and reliable public transportation through a coordinated and convenient bus and rail system Page 2
4 Table of Contents Introduction 4 Service Delivery Ridership 6 Performance 7 On Time Performance 8 Route Performance Analysis 1 Mileage Efficiency 13 Fleet Reliability 16 Performance 17 Vehicle Profile 18 Vehicle Maintenance 2 ParaTransit Ridership 24 Registrations 25 Eligibility Types 26 Trip Types 27 Trip Delivery 28 Customer Care Call Center Activities 3 Customer Complaints & Commendations 31 Customer Surveys 33 Complaint Time Analysis 34 Complaints by Route 35 PAL Eligible Riders Complaints & Commendations 36 Financial Revenue 38 Expenses 39 Metro Pass Sales Fuel Cost 4 42 Attendance 43 Safety/Environment Collisions 46 Workplace 47 Carbon Footprint 48 Utility Analysis 49 Our Future 5 Page 3
5 INTRODUCTION NFTA-Metro is the Public Transit provider serving Erie and Niagara counties in New York. Metro operates 65 bus routes with over 4,4 bus stops being serviced, along with a 6.2 mile light rail system servicing 14 stations. Metro employs 63 bus and rail operators who have a combined driving experience of over 6, years, supported by a comprehensive staff of mechanics, technicians and specialists responsible for maintaining the system. As a public agency, NFTA Metro is accountable to the people we serve. We want to make it easy for our customers and stakeholders to understand and review our performance. Measuring the performance of a transit system is the first step toward efficient and proactive management. The use of performance measures for transportation planning and operations is critical for transportation agencies who are managing evolving demands with diminishing resources. The information in this report is used by Metro to identify trends in our operations and the impacts of external influences and provides the management team with metrics to communicate organizational effectiveness. Measuring, monitoring and reporting performance on a regular basis helps Metro achieve the following objectives: Continually improve the organization by monitoring progress. Maintain a comprehensive capital and operations planning process to secure funding which includes, collecting performance data, using the data to assess performance through the development of metrics and use of the metrics to make improvements. Maintain accountability for return on investment and effectiveness of accomplishing our mission. Improve management by quantifying the performance of Metro products, services, and the processes. Effective performance measures are tools that help us: o Monitor performance to judge how well we are doing, o Know if we are meeting our goals and if our customers are satisfied, o Take action to affect performance or improve efficiency if as necessary. Performance measures provide data and information necessary to make informed decisions. Performance measures also provide trends to determine whether actual performance is getting better, staying the same, or getting worse over time. The best performance measures start conversations about organizational priorities, the allocation of resources, ways to improve performance, and offer an honest assessment of effectiveness. This annual performance report provides a summary of the performance metrics that Metro monitors to keep the system efficient, economical, safe, and reliable while pursuing continued improvement. Most of the representations compare data for either three or four fiscal years (April 1 through March 31 of the following year). Some of the measures compare fixed route bus service, Paratransit Access Line (PAL) and rail operations. There is performance data on service delivery, PAL, revenue vehicle fleet, customer care, financial, safety and environmental. It is Metro's intent to use these metrics to provide a look back at where we have been as well as provide a roadmap to the future. This report is updated annually and may introduce new performance measures to expand our ability to evaluate our efforts and keep our review relevant. Page 4


6 SERVICE DELIVERY Page 5
7 Millions Millions SERVICE DELIVERY Ridership Metro ridership is reported based on data collected through a Federal Transit Administration (FTA) approved sampling program and on-vehicle technology. Ridership includes all trips delivered on Metro Bus, Metro Rail and Paratransit Access Line (PAL). 35 Ridership Ridership by Mode Metro Bus Metro Rail Page 6
8 Riders per Gallon SERVICE DELIVERY Performance 8. Passengers per Vehicle Mile Metro Bus Metro Rail Passengers per vehicle miles is a measurement of service efficiency. Metro pursues improved operating efficiency by attracting additional riders and maximizing route design. 12 Fixed Route Riders per Gallon Page 7
9 SERVICE DELIVERY On Time Performance Metro monitors the efficiency of the service it provides. Metro Bus On Time Performance is the calculated difference between the actual time a Metro vehicle encounters a specific stop compared to the time that vehicle was scheduled to be there. 1% 9% 8% 7% 6% 5% 4% 3% 2% 1% % On Time Metro Bus Metro Rail PAL Vans On Time Calculation Metro Bus The window for Metro Bus On Time is six minutes. An arrival is considered on time if it is less than two minutes early and less than four minutes late. Late arrivals can be affected by weather conditions, street conditions, boarding/alighting patterns or traffic along the route. Metro Rail The window for Metro Rail On Time is one minute*. PAL The window for PAL On Time is 3 minutes. When a PAL eligible rider makes a reservation, a pickup time is established. The PAL window is 15 minutes before that pickup time to 15 minutes after the pickup time. *On Time for the Metro Rail does not include the period when service was disrupted by construction projects on Main Street. Page 8
10 4: AM 5: AM 6: AM 7: AM 8: AM 9: AM 1: AM 11: AM noon 1: PM 2: PM 3: PM 4: PM 5: PM 6: PM 7: PM 8: PM 9: PM 1: PM 11: PM mid 1: AM SERVICE DELIVERY On Time Performance FIXED ROUTE 1% 8% Daily On Time - Metro Bus 9.4% 88.3% 88.2% 6% 4% 2% % Sunday Weekday Saturday 1% 8% 6% 4% 2% % Hourly On Time - Metro Bus Early arrivals are the portion of non-compliant arrivals the can be improved through management and technology enhancements and are less related to external factors. 7% 6% 5% 4% 3% 2% 1% % Earlies - Metro Bus 6.1% 5.9% 4.9% 4.5% Page 9
11 SERVICE DELIVERY Route Performance Analysis Weekday Service ONLY Metro Service Delivery and Evaluation Guidelines have been established to provide an objective basis for assessing the performance of existing Metro Bus service. Routes are grouped by type or characteristics of service and evaluated to provide the basis for developing service adjustments. Farebox Recovery The amount of operating expenses which are covered by the fares paid by passengers. It is computed by dividing the total passenger fare revenue by the total operating expenses. Passengers per Revenue Hour The measure of productivity in terms of the number of passengers carried for each hour of revenue service provided. It is computed by dividing the number of average weekday riders by the associated number of revenue hours of service. Primary / Core Routes Farebox Recovery Passengers / Revenue Hour GOAL 4% GOAL 37 Riders 55 PINE AVE 32 AMHERST 26 DELEVAN 25 DELAWARE 24-GENESEE 23 FILLMORE-HERTEL 2 ELMWOOD 19 BAILEY 13 KENSINGTON 12 UTICA 6 SYCAMORE 5 NIAGARA- KENMORE 4 BROADWAY 3 GRANT FYE 212 FYE 213 FYE 214 Page 1
12 SERVICE DELIVERY Route Performance Analysis Weekday Service ONLY Secondary Routes Farebox Recovery Passengers / Revenue Hour GOAL 25% 57 TONAWANDAS 54 MILITARY 52 HYDE PARK 5 MAIN-NIAGARA 49 MILLARD- SUBURBAN 48 WILLIAMSVILLE 47 YOUNGS RD. 46 LANCASTER 44 LOCKPORT GOAL 24 Riders 42 LACKAWANNA 36 HAMBURG 35 SHERIDAN 34 N.F. BLVD. 29 WOHLERS 27 ERIE CNTY HOME 22 PORTER-BEST 18 JEFFERSON 16 SOUTH PARK 15 SENECA 14 ABBOTT 11 COLVIN 8 MAIN 7 BAYNES- RICHMOND 2 CLINTON 1 WILLIAM Page 11
13 SERVICE DELIVERY Route Performance Analysis Weekday Service ONLY Collector Express Routes Farebox Recovery Passengers / Revenue Hour GOAL 2% GOAL 19 Riders 79 TONAWANDA 76 LOTUS BAY 75 WEST SENECA 74 HAMBURG 72 ORCHARD PARK 7 EAST AURORA 69 ALDEN 68 GEO URBAN 67 CLEVELAND HILL 66 WILLIAMSVILLE 61 N. TONAWANDA 4 GRAND ISLAND Limited Express (enhanced) Routes Farebox Recovery Passengers / Revenue Hour GOAL 19% GOAL 18 Riders 24 AIRPORT 64 LOCKPORT 6 NIAGARA FALLS Page 12
14 SERVICE DELIVERY Mileage Efficiency Mileage efficiency compares the amount of vehicle miles traveled providing revenue generating service (REV miles) with the miles traveled when the vehicle is out of service (DeadHead miles). This measure reflects route design efficiency. Metro Bus REV miles 9,54,54 REV miles 9,28,514 REV miles 8,674,422 REV miles 8,53, % 81.2% 8.74% 8.79% D/H miles -1,917,336 D/H miles -2,115,133 D/H miles -2,69,489 D/H miles -2,44,61 PAL Vans REV miles 1,434,615 REV miles 1,627,77 REV miles 1,67,742 REV miles 1,541, % 78.7% 79.39% 79.77% D/H miles -49,752 D/H miles -457,243 D/H miles -417,478 D/H miles -387,633 Note: Metro Rail mileage efficiency is maintained in excess of 98%. Page 13
15 Page 14

16 FLEET Page 15
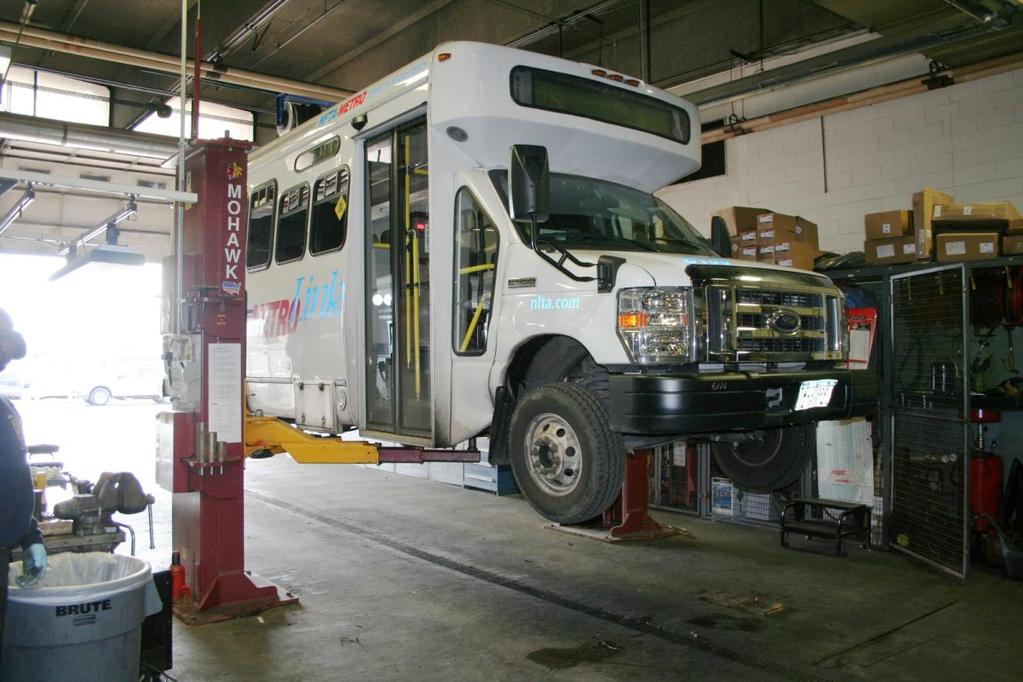
17 FLEET Reliability Metro s bus fleet consists of primarily 4 buses with either diesel or hybrid (diesel/electric) power. The PAL fleet is comprised of vans powered by either diesel or gasoline. Vehicle performance has a direct impact on Metro s ability to deliver reliable, safe service. Measurement of fleet reliability and efficiency demonstrates the effectiveness of Metro s maintenance program. Occasionally mechanical defects necessitate removing a vehicle from service. Miles without Service Interruptions reflects how many miles a bus has traveled in service before an unscheduled breakdown takes it off the road resulting in riders being transferred to a backup bus to continue their trip. Vehicles are also removed from service for scheduled preventative maintenance. Mileage without Service Interruptions 35, 3, 25, 2, 15, 1, 5, Metro Bus hybrid bus diesel bus PAL van Page 16
18 Miles per Quart Miles per Gallon FLEET Performance Fuel and Motor Oil economy are directly related to the state of good repair and technological innovation of the bus fleet and are impacted by both maintenance and fleet age. 1. Fuel Economy Metro System hybrid bus diesel bus PAL van Metro Bus Motor Oil Economy Metro Bus hybrid bus diesel bus Page 17
19 FLEET Vehicle Profile An underlying factor to the vehicle reliability is the overall age and mileage of the vehicle. The FTA, which provides the major portion of funding for vehicle purchase, has prescribed the useful life of a 4 vehicle as 12 years of revenue service and/or 5, miles. 12 Average Age per Bus Average Age (years) 6.89 Average Age (years), 7.37 Average Age (years) 8.13 FYE 212 FYE 213 FYE 214 5, Average Miles per Bus 4, 3, 2, 1, Average Miles 239,256 Average Miles 271,677 Average Miles 299,593 FYE 212 FYE 213 FYE 214 Page 18
20 FLEET Vehicle Profile Based on the prescribed useful life milestones, a portion of the bus fleet is in need of replacement. 25% Buses Beyond Useful Age 2% 21.% 15% 1% 5% 9.1% 12.2% % FYE 212 FYE 213 FYE % Buses Beyond Useful Miles 2% 15% 15.5% 1% 1.3% 5% % 5.2% FYE 212 FYE 213 FYE 214 Page 19

21 FLEET Vehicle Maintenance A comprehensive training program is mandatory to improve vehicle reliability and maintain performance of an aging fleet. Emissions DPIM Fire Suppression Wipers Doors HVAC Steering Brakes Air System Chassis Body Fire Suppression HVAC Steering Brakes Air System Chassis Electrical Transmission Engine Hours of Subsystem Training (4 year Total Electrical Transmission Engine Number of Defects Page 2
22 FLEET Vehicle Maintenance Vehicles to Mechanics ratio Buses out of service Mechanics Page 21
23 FLEET Vehicle Maintenance Buses out of service are undergoing repair of defects and are not available for revenue service. 7 Buses out of service Apr 213 May Jun Jul Aug Sep Oct Nov Dec Jan Days 31-9 Days 91+ Days Feb Mar 214 Page 22

24 PARATRANSIT Page 23
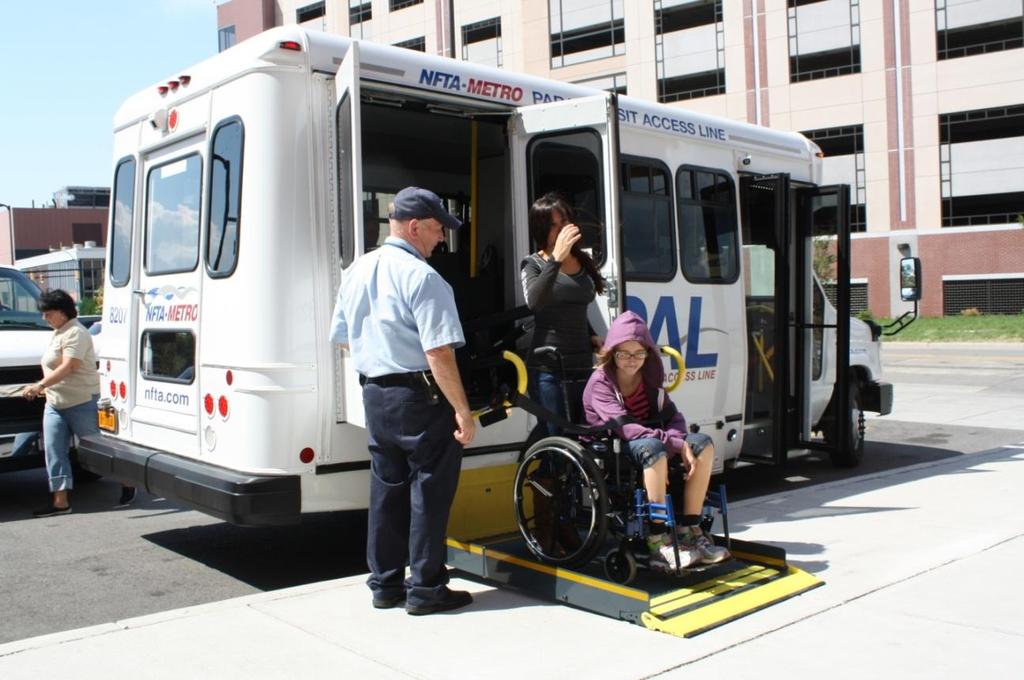
25 PARATRANSIT Ridership Metro has a fully accessible bus and rail system. For those individuals who cannot access our regular Metro Bus & Rail due to a disability (temporary or permanent) we provide safe, reliable curb-to-curb transportation services through the Paratransit Access Line (PAL). 18, Ridership 16, 14, 12, 1, 8, 6, 4, 2, 7 Average Daily Trips Weekday Saturday Sunday Page 24
26 PARATRANSIT Registrations Paratransit ridership is comprised of passengers who have obtained eligibility by completing the application process (eligible riders). Eligibility to use PAL is determined based on the guidelines contained in the Americans with Disabilities Act (ADA) of ,5 4,4 4,3 4,2 4,1 4, 3,9 3,8 3,7 3,6 Active Eligible Riders 1, Annual NEW Eligible Rider Registrations Page 25
27 PARATRANSIT Eligibility Types Access to PAL service is established through the application process when conditions may be applied to eligibility: Unconditional eligibility entitles an ADA rider to unlimited PAL service Conditional eligibility places restrictions on use of PAL service based on disability* 7 New Rider Eligibility Unconditional Conditional *For example, the ADA rider may only be eligible to use PAL service during winter months or for travel to unfamiliar destinations where they have not been travel trained. Page 26

28 PARATRANSIT Trip Types Trip bookings are classified as either casual or subscription trips. Casual, single trips are non-recurring trips made by an eligible rider. Subscription trips are trips requested between the same origin and destination on fixed days at fixed times. 14, Trip Type 12, 1, 8, 6, 4, 2, Casual Subscription Eligible riders, who require assistance, may request to travel with a Personal Care Attendant (PCA) who rides free of charge (non-rev). Eligible riders are also permitted to travel with a companion who rides for the same fare as the eligible rider (rev). Clients - Rev 93% Typical PAL Ridership 4 year average Companions - Rev 2% PCA - NON Rev 5% Page 27
 The Metro vehicle arrived within 3 minute pickup window and waited at least five minutes but the rider did not board. Late Cancel (.")
29 PARATRANSIT Trip Delivery Trip delivery is based on trips scheduled for ADA eligible riders. Trip Delivery Performance 4 year average Delivered 97.7% Undelivered 2.3% Undelivered Trips include: No Show (1.3%) The Metro vehicle arrived within 3 minute pickup window and waited at least five minutes but the rider did not board. Late Cancel (.9%) Rider called to cancel a trip less than two hours prior to the scheduled pickup window. Missed Trip (.1%) The Metro vehicle arrived after the pickup window and the rider found other means of transportation 3, Undelivered Trip Performance 2,5 2, 1,5 1, 5 No Show Late cancel Missed Trip Page 28

30 CUSTOMER CARE The Customer Care Department is the first point of contact for our customers. They handle all calls from both Buffalo and Niagara counties providing information on all Metro Bus and Rail routes. In assisting customers, critical information received from both internal and external sources is utilized along with state of the art customer service systems. Page 29
31 Millions CUSTOMER CARE Call Center Activities Customer input is a critical element of providing quality public transit service. In order to provide opportunities for our customers to engage Metro, our Customer Care response line ( ) is utilized. 3. Call Center Volume When a Customer terminates a call.5. IVR Answered Agent Answered Call abandoned Customer calls are initially answered by an Interactive Voice Response (IVR) system with an automated message directing the caller to select an option which usually takes about 15 seconds (introduction time). This allows the caller to get standard information quickly (IVR Answered). If the need arises for more specific information, the caller can then transfer to a Customer Care Agent (Agent Answered) for assistance. Customer Call Composition :26 :12 :1 :11 1:34 1:33 1:29 1:35 Avg Wait Time (min:sec) Avg Talk Time (min:sec) Once the caller requests Agent contact, the average wait time reflects the time until the Agent engages the caller. Once an Agent is engaged, the actual conversation is measured as talk time. Page 3
32 CUSTOMER CARE Customer Complaints & Commendations Customers are encouraged to comment on their experience using Metro. These comments are documented as either Commendations or Complaints with complaints broken down into Equipment, Service Delivery and Professionalism Complaints FYE 211 FYE 212 Commendations 24% Commendations 29% Professionalism 52% Professionalism 52% Complaints 76% Service Delivery 23% Complaints 71% Service Delivery 19% Equipment 1% Equipment % FYE 213 FYE 214 Commendations 37% Commendations 3% Professionalism 5% Professionalism 57% Complaints 63% Service Delivery 13% Complaints 7% Service Delivery 13% Equipment % Equipment % Page 31
33 CUSTOMER CARE Customer Complaints Customer complaints are delineated by specific issues encountered and then reported by category. Rules & Regulations Professionalism Passing up Passengers Reckless Driving Discourtesy Improper Routing Service Delivery Carried Past Stop Schedule Failure Fares/ID/Passes Facilities Equipment Cleanliness Equipment Page 32
34 Bus Exterior Bus Interior Bus Shelters Rail Car Exterior Rail Car Interior Metro Transit Centers Rail Stations CUSTOMER CARE Customer Surveys An online Customer Survey to evaluate the current levels of cleanliness on Metro Bus and Rail, Bus Shelters and Transit Centers was completed in January 214 with 65 responses. Metro Cleanliness Survey 6.1% 6.2% 5.% 8.3% 7.5% 6.8% 5.8% Excellent 53.6% 44.6% 38.2% 58.3% 57.3% 39.% 45.8% Good -31.8% -34.2% -35.6% -8.5% -15.% -14.3% -28.4% -27.8% -4.9% -7.8% -22.5% -8.8% -31.8% -16.4% Needs Improvement Poor Page 33
35 4 AM 5 AM 6 AM 7 AM 8 AM 9 AM 1 AM 11 AM noon 1 PM 2 PM 3 PM 4 PM 5 PM 6 PM 7 PM 8 PM 9 PM 1 PM 11 PM midnight CUSTOMER CARE Complaint Time Analysis Complaints are monitored for when they occur. Monthly Apr 213 May 213 Jun 213 Jul 213 Aug 213 Sep 213 Oct 213 Nov 213 Dec 213 Jan 214 Feb 214 Mar Daily Average Sunday Monday Tuesday Wednesday Thursday Friday Saturday Hourly Average Metro has nine Agents for three shifts on Monday Friday from 6: AM to 6: PM. On nights and weekends, the telephone lines are answered by the IVR. Page 34
36 CUSTOMER CARE Complaints by Route AIRPORT EX - 24 TONAWANDA - 79 LOTUS BAY - 76 WEST SENECA-75 HAMBURG-74 ORCHARD PARK-72 EAST AURORA - 7 ALDEN-69 GEO URBAN-68 CLEVELAND HILL - 67 WILLIAMSVILLE - 66 LOCKPORT - 64 DELAWARE-61 NIAGARA FALLS-6 TONAWANDAS - 57 PINE AVE-55 MILITARY-54 HYDE PARK-52 MAIN/NIAGARA-5 HOPKINS - 49 WILLIAMSVILLE - 48 YOUNGS ROAD - 47 LANCASTER - 46 LOCKPORT - 44 LACKAWANNA-42 GRAND ISLAND - 4 HAMBURG - 36 SHERIDAN - 35 NIAG. FALLS BLVD - 34 AMHERST - 32 WOHLERS - 29 ERIE COUNTY HOME - 27 DELAVAN - 26 DELAWARE - 25 GENESEE - 24 FILLMORE/HERTEL - 23 PORTER/BEST - 22 ELMWOOD - 2 BAILEY - 19 JEFFERSON - 18 SOUTH PARK - 16 SENECA - 15 ABBOTT - 14 KENSINGTON - 13 UTICA - 12 COLVIN - 11 MAIN - 8 BAYNES-RICHMOND - 7 SYCAMORE - 6 NIAGARA-KENMORE - 5 BROADWAY - 4 GRANT - 3 CLINTON - 2 WILLIAM - 1 Complaints / 1, Riders by Route FYE 212 FYE 213 FYE 214 Page 35
37 CUSTOMER CARE PAL Eligible Riders Complaints & Commendations PAL customers comment of service delivery. These comments are documented as either commendations or complaints and the appropriate action is taken by Metro. FYE 211 FYE 212 Commendations 34% Complaints 66% Commendations 34% Complaints 66% FYE 213 FYE 214 Commendations 58% Complaints 42% Commendations 67% Complaints 33% Page 36

38 FINANCIAL Page 37
39 Millions FINANCIAL Revenue Revenue primarily consists of passengers fares and operating assistance. Other revenue consists of advertising fees and miscellaneous revenues. Passengers fares make up approximately 27% of total revenues. $12 Revenue Stream $1 $8 $6 $4 $2 $ Fares Assistance $4. $3.5 $3. $2.5 $2. $1.5 $1. $.5 $ Avg Fare / Rider Metro Bus Metro Rail PAL Vans Riders / Revenue Veh Hour Metro Bus Metro Rail Page 38
40 Millions FINANCIAL Expenses Expenses include personal services, maintenance & repairs, transit fuel & power, utilities, insurance and injuries, safety & security, general business & support services. Personal Services account for approximately 7% of all operational expenses. $12 Operating Costs by Mode $1 $8 $6 $4 $2 $ $35 Metro Bus Metro Rail PAL Vans Operating Costs / Veh Hour $3 $25 $2 $15 $1 $5 $ 35% Metro Bus Metro Rail PAL Vans Farebox Recovery 3% 25% 2% 15% 1% 5% % Metro Bus Metro Rail PAL Vans Page 39
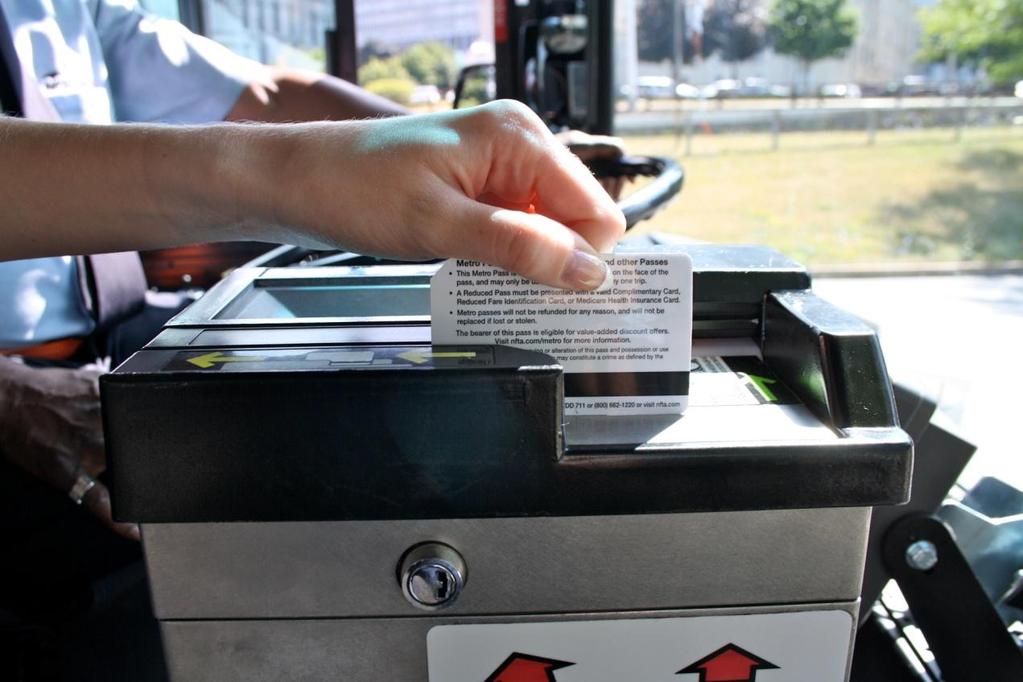
41 FINANCIAL Metro Pass Sales Metro Passes are distributed through a variety of sources providing alternatives for customer access to pass media. These sources include: On Bus Downtown Bus Terminal (MTC) Ticket Vending Machines (TVM) Rail Stations Bus Transit Centers Outside Sales Retail Outlets Metro web page Pass point of sale 3 year average MTC.3% On Bus 57.7% Outside Sales 5.9% TVM 36.1% Page 4
42 FINANCIAL Metro Pass Sales Various transit pass products are available to the customer based on individual preferences. 2,, 1,8, 1,6, 1,4, 1,2, 1,, 8, 6, 4, 2, 1 Day Pass 18, 16, 14, 12, 1, 8, 6, 4, 2, Multi Day Passes (introduced 212) 3 day 7 day FYE 212 FYE 213 FYE 214 FYE 213 FYE 214 Monthly Passes Full Fare Half Fare ParaTransit Passes 1 Ride 2 Ride 14, 6, 12, 5, 1, 8, 6, 4, 4, 3, 2, 2, 1, FYE 212 FYE 213 FYE 214 FYE 212 FYE 213 FYE 214 Page 41
43 Millions FINANCIAL Fuel Cost In order to maintain budget stability and minimize costs, Metro locks in fuel purchases for a portion of our consumption. Metro fuel costs are based on the total volume purchased at both the market rate and fixed rate for the associated quantities. Market cost for fuel is based on the total cost that would be expended if we were to purchase our entire consumption at the market rate. $8.5 Metro Fuel Costs vs Market Cost for Fuel $8. $7.5 $7. $6.5 $6. $5.5 $5. $4.5 METRO COSTS MARKET COSTS Page 42
44 FINANCIAL Attendance Improved attendance reliability lessens the Personal Services Costs associated with absenteeism. Unscheduled absences can occur for illness, personal or emergency situation for which staffing adjustments are required and may necessitate overtime expenditures. 1% 9% 8% 7% 6% 5% 4% 3% 2% 1% % Mechanics Attendance Operators Page 43
45 Page 44
46 SAFETY/ENVIRONMENT Page 45
47 SAFETY/ENVIRONMENT Collisions Metro operators drive over 1,, miles every year in the service area. Operating the fleet, subject to various weather and road conditions, will inevitably result in some vehicle collisions. Safe driver training techniques and mechanical soundness of the vehicles allow Metro to maintain a very low collision rate. Annual Collision Rate per 1, miles Monthly Collision Rate per 1, miles Apr May Jun Jul Aug Sep Oct Nov Dec Jan Feb Mar Page 46
48 Days Lost, 2847 Days Lost, 3397 Days Lost, 2454 Days Lost, 2461 SAFETY/ENVIRONMENT Workplace Personal injuries have a direct impact on Metro s ability to provide reliable, cost effective service. Regular monitoring, reporting and evaluating injuries are critical to maintaining operations and protecting our employees. Each month, the most predominant personal injuries are reviewed by the Executive Director and top levels of Metro management. Through their analysis, the injury root causes are discussed and recommendations are developed. This keeps employee safety a high priority within Metro. Reported Metro Employee Injuries Reported Cases Lost Time Cases Page 47
49 Thousands SAFETY/ENVIRONMENT Carbon Footprint Many considerations go into being a good community neighbor. The effect on the atmosphere due to emissions, the disposal of our waste products, the recycling of our motor oils and solid wastes and the energy consumed by our facilities operations are all areas that Metro monitors to find effectiveness and efficiency in the operations. The following charts represent Metro s efforts in some of these areas. 3 Metro Vehicles' Carbon Footprint represented in Tons Metro System CO2 hybrid bus CO2 diesel bus CO2 PAL van CO2 Page 48

50 SAFETY/ENVIRONMENT Utility Analysis Utility Costs past 4 years Natural Gas 3% Electric 65% Water 5% $1,6, Utility Costs by Type $1,4, $1,2, $1,, $8, $6, $4, $2, $ Electric Natural Gas Water Page 49

51 What does the future hold for Metro and its riders? More transparency and accountability through the Metro Performance Report New Fare collection system with more flexibility and greater access for rider convenience Connecting Metro with its customers using social media New buses powered by alternative fuel sources Rebuilding and modernizing the entire rail car fleet Technology enhancements for improved customer communications Next generation Metro bus corridors (Niagara Street) Analysis of transit alternatives to support community development Develop partnerships and marketing strategies to improve revenue and service Come ride with us! Page 5

52 Page 51
Mission Statement. Page 2
 Page 1 Mission Statement To enhance the quality of life of residents and visitors by providing the highest level of safe, clean, affordable, responsive and reliable public transportation through a coordinated
Paratransit Overview O & O Presentation January 11, 2018
 Paratransit Overview O & O Presentation January 11, 2018 Our vision is to be a valued regional partner that drives prosperity and makes life better for our community. Our mission is to connect Hampton
COMMUNITY REPORT FISCAL YEAR We are making progress, are you on board? GOLD COAST TRANSIT DISTRICT
 FISCAL YEAR 178 GOLD COAST TRANSIT DISTRICT COMMUNITY REPORT We are making progress, are you on board? OJAI OXNARD PORT HUENEME VENTURA COUNTY OF VENTURA GENERAL MANAGER S MESSAGE STEVEN P. BROWN DEAR
High Quality Service through Continuous Improvement st Quarter Performance Report
 High Quality Service through Continuous Improvement 6 st Quarter Performance Report TriMet Board Meeting May 5, 6 Quality is a never ending quest and continuous improvement is a never ending way to discover
Sean P. McBride, Executive Director Kalamazoo Metro Transit. Presentation to Michigan Transportation Planning Association July 13, 2016
 Sean P. McBride, Executive Director Kalamazoo Metro Transit Presentation to Michigan Transportation Planning Association July 13, 2016 Metro Transit in Kalamazoo County Square Miles = 132 Urbanized Population:
Sound Transit Operations July 2016 Service Performance Report. Ridership
 Ridership Total Boardings by Mode Mode Jul-15 Jul-16 % YTD-15 YTD-16 % ST Express 1,618,779 1,545,852-4.5% 10,803,486 10,774,063-0.3% Sounder 333,000 323,233-2.9% 2,176,914 2,423,058 11.3% Tacoma Link
Strategic Plan Performance Metrics & Targets
 San Francisco Municipal Transportation Agency Strategic Plan Performance Metrics & Targets Fiscal Year 2019 Fiscal Year 2020 April 3, 2018 SAFETY Goal 1: Create a safer transportation experience for everyone.
RIDERSHIP TRENDS. March 2017
 RIDERSHIP TRENDS March 2017 Prepared by the Division of Strategic Capital Planning May 2017 Table of Contents Executive Summary...1 Ridership...3 Estimated Passenger Trips by Line...3 Estimated Passenger
MAX VIP Rider s Guide
 ma MAX VIP Rider s Guide Welcome to the MAX VIP Service The Birmingham-Jefferson VIP is a demand-response, County origin to Transit destination Authority transportation system. Persons who are deemed ADA
Downtown Transit Connector. Making Transit Work for Rhode Island
 Downtown Transit Connector Making Transit Work for Rhode Island 3.17.17 Project Evolution Transit 2020 (Stakeholders identify need for better transit) Providence Core Connector Study (Streetcar project
PARTIAL PROGRAM OF PROJECTS FFY
 PARTIAL PROGRAM OF PROJECTS FFY 2016-17 The proposed Partial Program of Projects for FFY 2016-17 is attached. The proposed Partial Program of Projects was introduced at the SCTA Board at its meeting on
5. OPPORTUNITIES AND NEXT STEPS
 5. OPPORTUNITIES AND NEXT STEPS When the METRO Green Line LRT begins operating in mid-2014, a strong emphasis will be placed on providing frequent connecting bus service with Green Line trains. Bus hours
Performance Measures 4 th Quarter/Year End 2010
 Performance Measures 4 th Quarter/Year End 2010 Earn & Retain Community Trust 6 Performance Measures: Ridership Cost Effectiveness (Cost per Passenger) Cost Efficiency (Cost per Revenue Hour) Service Effectiveness
Performance Measures Second Quarter 2012
 Performance Measures Second Quarter 2012 2Q2011 Earn & Retain Community Trust 6 Performance Measures: Ridership Cost Effectiveness (Cost per Passenger) Cost Efficiency (Cost per Revenue Hour) Service Effectiveness
Northeast Corridor Alternatives Analysis. Public Involvement Round 2 Input on Alternatives for Further Study
 Northeast Corridor Alternatives Analysis Public Involvement Round 2 Input on Alternatives for Further Study Feb. 7-9, 2012 Agenda Review project background Progress summary Recommended alternatives for
TORONTO TRANSIT COMMISSION REPORT NO.
 Revised: March/13 TORONTO TRANSIT COMMISSION REPORT NO. MEETING DATE: March 26, 2014 SUBJECT: COMMUNITY BUS SERVICES ACTION ITEM RECOMMENDATION It is recommended that the Board not approve any routing
STRATEGIC BUSINESS PLAN QUARTERLY KPI REPORT FOR: FISCAL YEAR 2015, QUARTER 1 (JULY THROUGH SEPTEMBER 2014)
") STRATEGIC BUSINESS PLAN QUARTERLY KPI REPORT FOR: FISCAL YEAR 215, QUARTER 1 (JULY THROUGH SEPTEMBER ) CONTENTS BALANCED SCORECARD OF KEY PERFORMANCE INDICATORS SAFETY & SECURITY SLIDE VEHICLE, PASSENGER
STRATEGIC BUSINESS PLAN QUARTERLY KPI REPORT FOR: FISCAL YEAR 215, QUARTER 1 (JULY THROUGH SEPTEMBER ) CONTENTS BALANCED SCORECARD OF KEY PERFORMANCE INDICATORS SAFETY & SECURITY SLIDE VEHICLE, PASSENGER
STRATEGIC BUSINESS PLAN QUARTERLY KPI REPORT FOR: FISCAL YEAR 2015 THROUGH QUARTER 4 (JULY 2014 THROUGH JUNE 2015)
") STRATEGIC BUSINESS PLAN QUARTERLY KPI REPORT FOR: FISCAL YEAR THROUGH QUARTER 4 (JULY THROUGH JUNE ) CONTENTS BALANCED SCORECARD OF KEY PERFORMANCE INDICATORS SAFETY & SECURITY SLIDE VEHICLE, PASSENGER
STRATEGIC BUSINESS PLAN QUARTERLY KPI REPORT FOR: FISCAL YEAR THROUGH QUARTER 4 (JULY THROUGH JUNE ) CONTENTS BALANCED SCORECARD OF KEY PERFORMANCE INDICATORS SAFETY & SECURITY SLIDE VEHICLE, PASSENGER
April 2010 April 2010 Presented by Alan Eirls
 April 2010 April 2010 Presented by Alan Eirls A Partnership Between the Coeur d Alene Tribe, the State of Idaho, the KMPO, and Kootenai County. Current System The Citylink system began on the Coeur d Alene
MAT Paratransit for Persons with Disabilities
 MAT Paratransit for Persons with Disabilities Who is Eligible ADA Paratransit Eligible per Americans with Disabilities Act Persons with disabilities who cannot ride MATBUS Fixed Routes independently There
PUBLIC TRANSPORTATION Activity # 91
 PUBLIC TRANSPORTATION ACTIVITY DESCRIPTION (Engineering) DESCRIPTION: Arcata and Mad River Transit System (A&MRTS) provides public transportation within the City of Arcata. There are two fixed routes that
Click to edit Master title style
 Nelson/Nygaard Consulting Associates SERVICE IMPROVEMENT STRATEGIES September 22, 2015 1 PROJECT OVERVIEW & WORK TO DATE 1. Extensive stakeholder involvement Throughout 2. System and market assessment
Help shape your community investment in Wake Transit. Fiscal Year 2019 Draft Work Plan Summary
 Help shape your community investment in Wake Transit Fiscal Year 2019 Draft Work Plan Summary Wake County, growth and transit The Triangle is one of the fastest-growing regions in the nation. Wake County
Customers certified in accordance with ADA are eligible to use Spec-Tran.
 CAPITAL AREA TRANSPORTATION AUTHORITY Spec-Tran Guide What is Spec-Tran? Spec-Tran is an Americans with Disabilities Act or ADA-complementary paratransit service for people who are unable to use CATA s
MAT Paratransit TRANSPORTATION FOR PERSONS WITH DISABILITIES
 MAT Paratransit TRANSPORTATION FOR PERSONS WITH DISABILITIES MAT Paratransit Overview MAT Paratransit is public transportation for persons with disabilities who are unable to use the Fargo-Moorhead MATBUS
Accessible Transit Service
 Accessible Transit Service Independence Through Accessibility 520-792-9222 TDD 520-628-1565 www.suntran.com SUN TRAN Independence through Accessibility Sun Tran is the Tucson region s fixed-route public
Central London Congestion Charging Scheme. 17 March 2005 Impacts - 9 th Annual Conference. Michele Dix Director Congestion Charging Division
 Central London Congestion Charging Scheme 17 March 2005 Impacts - 9 th Annual Conference Michele Dix Director Congestion Charging Division Contents 1. The Scheme 2. Impacts 3. Next Steps The Scheme Where
ADA Paratransit Service Guidelines
 ADA Paratransit Service Guidelines The Mountain Express PO Box 3482 803 Butte Ave. Crested Butte, CO 81224 p (970) 349-5616 f (970) 349-7214 www.mtnexp.org EFFECTIVE DATE December 2017 1 Table of Contents
Central Transportation Paratransit Policies
 Updated: 8/22/18 POINT PLUS Central Transportation Paratransit Policies Service Description Central Transportation offers a Paratransit service program to individuals with qualifying disabilities. Paratransit
Georgetown Transit ADA Plan
 Georgetown Transit ADA Plan INTRODUCTION The Americans with Disabilities Act of 1990 (ADA) requires that public entities that operate non-commuter fixed route transportation services also provide complementary
CTfastrak Expansion. Stakeholder Meeting #4 Manchester Town Hall June 3, 2016
 CTfastrak Expansion Stakeholder Meeting #4 Manchester Town Hall June 3, 2016 Today s Agenda Phase I Update 2016 Service Plan Implementation Schedule & Cost Update Phase II Services Timeline Market Analysis
Waco Rapid Transit Corridor (RTC) Feasibility Study
 Feasibility Study") Waco Rapid Transit Corridor (RTC) Feasibility Study Chris Evilia, Director of Waco Metropolitan Planning Organization Allen Hunter, General Manager Waco Transit System Jimi Mitchell, Project Manager AECOM
Waco Rapid Transit Corridor (RTC) Feasibility Study Chris Evilia, Director of Waco Metropolitan Planning Organization Allen Hunter, General Manager Waco Transit System Jimi Mitchell, Project Manager AECOM
Draft Results and Open House
 Waco Rapid Transit Corridor (RTC) Feasibility Study Draft Results and Open House Chris Evilia, Director of Waco Metropolitan Planning Organization Allen Hunter, General Manager Waco Transit System Jimi
Customer Service, Operations and Security Committee. Information Item III-A. January 12, 2017
 Customer Service, Operations and Security Committee Information Item III-A January 12, 2017 Train Reliability Program Page 4 of 19 Washington Metropolitan Area Transit Authority Board Action/Information
Draft Results and Recommendations
 Waco Rapid Transit Corridor (RTC) Feasibility Study Draft Results and Recommendations Chris Evilia, Director of Waco Metropolitan Planning Organization Allen Hunter, General Manager Waco Transit System
Greater Cleveland Regional Transit Authority. Joe Calabrese - General Manager
 Greater Cleveland Regional Transit Authority Joe Calabrese - General Manager RTA Ridership by Mode! 500 Buses - 75 %! 60 Heavy Rail Vehicles - 10%! 24 RTV s (BRT) - 8%! 48 Light Rail Vehicles - 6%! Paratransit
Central Maryland Transit Development Plan
 Central Maryland Transit Development Plan Planning the Future of Transit in Our Region Anne Arundel County Transportation Commission December 13, 2017 Anne Arundel County Howard County Prince George s
TRANSIT FEASIBILITY STUDY Town of Bradford West Gwillimbury
 TRANSIT FEASIBILITY STUDY Town of Bradford West Gwillimbury Open House Presentation January 19, 2012 Study Objectives Quantify the need for transit service in BWG Determine transit service priorities based
ROCHESTER, MINNESOTA
 ROCHESTER, MINNESOTA Rochester Public Works TRANSIT AND PARKING DIVISION Transit and Parking Manager Tony Knauer tknauer@rochestermn.gov SERVICE ATTITUDE CONSISTENCY - TEAMWORK ROCHESTER TRANSIT & PARKING
SamTrans Business Plan Update May 2018
 SamTrans Business Plan Update May 2018 SamTrans Business Plan Core Principles: 1. Sustain and enhance services for the transit-dependent 2. Expand and innovate mobility services 3. Promote programs that
RIDERSHIP TRENDS. July 2018
 RIDERSHIP TRENDS July Prepared by the Division of Strategic Capital Planning September Table of Contents Executive Summary...1 Ridership...3 Estimated Passenger Trips by Line...3 Estimated Passenger Trips
WIM #41 CSAH 14, MP 14.9 CROOKSTON, MINNESOTA APRIL 2014 MONTHLY REPORT
 WIM #41 CSAH 14, MP 14.9 CROOKSTON, MINNESOTA APRIL 2014 MONTHLY REPORT In order to understand the vehicle classes and groupings, the MnDOT Vehicle Classification Scheme and the Vehicle Classification
Milwaukee County Transit System
 Milwaukee County Transit System 2018 Proposed Transit Budget for Paratransit and Fixed Route Transit Operations and Capital Projects August 2017 Total Transit Budget State $ Federal $ Transit Rev. $ Vehicle
Wherever Your Path May Lead. RTS Takes You There! Citizen s Academy April 2017
 Wherever Your Path May Lead. RTS Takes You There! Citizen s Academy April 2017 1 First Two-Time Florida Public Transportation Association System of the Year Award Winner (2008 & 2015) FY 17 RTS Organization
12/5/2018 DRAFT. December 6, Item #1 CITIZENS PARTICIPATION
 December 6, 2018 Item #1 CITIZENS PARTICIPATION 1 Item #2 APPROVAL OF MINUTES Item #3 TRAC GOALS, FRAMEWORK & AGENDA REVIEW 2 COMMITTEE GOALS Learn about Southern Nevada s mobility challenges, new developments
PUBLIC TRANSPORTATION
 PUBLIC TRANSPORTATION PROJECT TITLE U-MED DISTRICT MULTI-MODAL IMPROVEMENTS- PHASE II Transit Vehicles and Upgrades MUNICIPALITY OF ANCHORAGE Capital Improvement Program PROJECT LIST BY DEPARTMENT Public
METRO Light Rail Update
 American Society of Highway Engineers METRO Light Rail Update Brian Buchanan Director, Design and Construction October 13, 2009 1 High Capacity Transit System 2 20-Mile Light Rail Line 3 Operations Operations
Blue Ribbon Committee
 Blue Ribbon Committee February 26, 2015 Kick-off Meeting Blue Ribbon Committee 1 2,228 Metro CNG Buses 170 Bus Routes 18 are Contract Lines Metro Statistics 2 Transitway Lines (Orange/Silver Lines) 20
Aren t You Really a Mobility Agency? Why The Vanpool Works for Transit
 Aren t You Really a Mobility Agency? Why The Vanpool Works for Transit Presenter: Kevin Coggin, Coast Transit Authority, Gulfport, MS Presenter: Lyn Hellegaard, Missoula Ravalli TMA, Missoula, MT Moderator:
El Metro Operations Proposed FY Budget
 Laredo Transit Management Inc.- El Metro El Metro Operations Proposed FY 2017-2018 Budget Claudia San Miguel Acting General Manager Mission Statement To provide a safe, reliable, cost effective, and efficient
Air Quality Impacts of Advance Transit s Fixed Route Bus Service
 Air Quality Impacts of Advance Transit s Fixed Route Bus Service Final Report Prepared by: Upper Valley Lake Sunapee Regional Planning Commission 10 Water Street, Suite 225 Lebanon, NH 03766 Prepared for:
GODURHAM PROGRESS REPORT
 GODURHAM PROGRESS REPORT OVERVIEW OPERATIONS & PERFORMANCE With the service enhancements, total revenue hours increased In 2016, GoDurham connected 5.9 million passengers to jobs, education and health
Overview of Transit Funding and Planning in the PACTS Region
 Overview of Transit Funding and Planning in the PACTS Region Presentation to PACTS Transit Committee and Federal Transit Administration Representatives February 8, 2018 Transit Agencies Agency Communities
REGULAR MEETING OF THE GOLDEN RAIN FOUNDATION MOBILITY AND VEHICLES COMMITTEE
 REGULAR MEETING OF THE GOLDEN RAIN FOUNDATION MOBILITY AND VEHICLES COMMITTEE Wednesday, October 3, 2018 1:30 p.m. Laguna Woods Village Community Center Board Room 24351 El Toro Road AGENDA 1. Call to
Rider Transit ADA Paratransit How to Ride Guide
 Rider Transit ADA Paratransit How to Ride Guide ADA Paratransit Program Policies and Procedures for Passengers & Staff A partnership of Concord Kannapolis Area Transit Mobility for all Transportation is
Executive Summary October 2013
 Executive Summary October 2013 Table of Contents Introduction... 1 Rider Transit and Regional Connectivity... 1 Plan Overview... 2 Network Overview... 2 Outreach... 3 Rider Performance... 4 Findings...
PAG Environmental Planning Advisory Committee Sun Link Streetcar Update May 1, 2015
 PAG Environmental Planning Advisory Committee Sun Link Streetcar Update May 1, 2015 Project Facts 4-mile route, 23 stops 8 made in USA modern streetcars All electric and green Voter-approved project Connects
Policy Note. Vanpools in the Puget Sound Region The case for expanding vanpool programs to move the most people for the least cost.
 Policy Note Vanpools in the Puget Sound Region The case for expanding vanpool programs to move the most people for the least cost Recommendations 1. Saturate vanpool market before expanding other intercity
RIDERSHIP TRENDS. April 2018
 RIDERSHIP TRENDS April Prepared by the Division of Strategic Capital Planning June Table of Contents Executive Summary...1 Ridership...3 Estimated Passenger Trips by Line...3 Estimated Passenger Trips
Martha s Vineyard Regional Transit Authority
 Martha s Vineyard Regional Transit Authority Annual Report Fiscal Year 2005 Martha s Vineyard Transit Authority Fiscal Year ending June 30, 2005 Annual Report Angela E. Grant, Administrator Advisory Board
Bus Stop Optimization Study
 Bus Stop Optimization Study Executive Summary February 2015 Prepared by: Passero Associates 242 West Main Street, Suite 100 Rochester, NY 14614 Office: 585 325 1000 Fax: 585 325 1691 In association with:
Presentation to the Customer Service, Operations and Safety Committee OPERATIONS PERFORMANCE INDICATORS
 Presentation to the Customer Service, Operations and Safety Committee OPERATIONS PERFORMANCE INDICATORS May 19, 2005 Department of Operations 100 95 90 85 80 75 70 65 A B C D RAIL PERFORMANCE INDEX FY
SCAT PASSENGER NO-SHOW/LATE CANCELLATION POLICY
 SCAT PASSENGER NO-SHOW/LATE CANCELLATION POLICY The Federal Transit Administration s paratransit regulations permit Suffolk County Accessible Transportation (SCAT) to establish an administrative process
EXECUTIVE SUMMARY. Introduction
 EXECUTIVE SUMMARY Introduction The purpose of this study is to ensure that the Village, in cooperation and coordination with the Downtown Management Corporation (DMC), is using best practices as they plan
First of four service increases delivered in April 2015
 CAC Update AGENDA» Recent service improvements» Upcoming service improvements» Transit and pedestrian safety corridor improvement projects slated for legislation» Outreach look ahead First of four service
Travel Time Savings Memorandum
 04-05-2018 TABLE OF CONTENTS 1 Background 3 Methodology 3 Inputs and Calculation 3 Assumptions 4 Light Rail Transit (LRT) Travel Times 5 Auto Travel Times 5 Bus Travel Times 6 Findings 7 Generalized Cost
PROGRESS ON BUDGET THEMES AND PERFORMANCE METRICS RECEIVE AND FILE PROGRESS REPORT ON BUDGET THEMES AND PERFORMANCE METRICS
 20 One Gateway Plaza Los Angeles, CA 90012-2952 213-922.2000 Tel metro. net FINANCE, BUDGET AND AUDIT COMMITTEE MARCH 20,2013 SUBJECT: ACTION: PROGRESS ON BUDGET THEMES AND PERFORMANCE METRICS RECEIVE
More than $9 Million coming to Central Valley for transportation
 More than $9 Million coming to Central Valley for transportation From free bus service to electric buses Part of overall $97 Million awarded to public transportation projects A total of 152 local public
Solano County Transit
 AGENDA ITEM: 9 BOARD MEETING DATE: FEBRUARY 18, 2016 Solano County Transit TO: PRESENTER: SUBJECT: ACTION: BOARD OF DIRECTORS ALAN PRICE, PROGRAM ANALYST II REVIEW AND APPROVE IMPLEMENTATION OF THE FUELING
Greater Cleveland Regional Transit Authority
 Greater Cleveland Regional Transit Authority Summary of Proposed Award Vanpool Program Presented to: Operations Committee August 2, 2016 What is a Vanpool? A vanpool is a group of people (larger than 5)
Vehicle and Equipment Services (4760P)
") 4-46 Program Locator County Environmentally Conscious Community Administrative Services Engineering Services Facilities Services Road Construction and Operations Construction Services Vehicle and Equipment
4-46 Program Locator County Environmentally Conscious Community Administrative Services Engineering Services Facilities Services Road Construction and Operations Construction Services Vehicle and Equipment
Feasibility Study. Community Meeting March, North-South Commuter Rail Feasibility Study
 Feasibility Study Community Meeting March, 2017 1 Agenda 1. Welcome / Introductions 2. Background / Meeting Purpose 3. Progress to Date Options Evaluated Capital/Operating Costs Ridership 4. Financial
An Overview of Transportation Responsibility
 1 An Overview of Transportation Responsibility Fast Facts Our Business History of Budget Cuts (2007 2013) Benchmark Comparison Proposed Budget Cuts for FY14 Community Input Peer Comparison 2 Mission Statement:
METRO TRANSIT a n n ua l re p o r t. madison, wisconsin // mymetrobus.com
 METRO TRANSIT 2016 a n n ua l re p o r t madison, wisconsin // mymetrobus.com metro transit In 2016, Metro Transit took steps to address capacity issues both on and off the road. Off the road, Metro began
Streetcar Update. Review of December 2018
 Streetcar Update Review of December 2018 Number of Incidents Safety Metrics: Near Miss Near Miss Incident Breakdown 19% decrease near-miss events year over year (2017 versus 2018) 66% decrease at 5 th
Foothill Transit Battery Electric Bus Performance Results
 Foothill Transit Battery Electric Bus Performance Results Leslie Eudy Matt Jeffers EV Summit, Cocoa Beach, Florida October 18, 2016 Presentation Outline NREL overview Zero emission bus (ZEB) evaluation
NYCBS June 2013 Monthly Report
 NYCBS June 2013 Monthly Report June 2013 Monthly Report Table of Contents 1. Executive Summary... 3 2. Membership... 4 3. Ridership... 4 4. Environmental Impact... 7 5. Rebalancing Operations... 8 6. Station
Troost Corridor Transit Study
 Troost Corridor Transit Study May 23, 2007 Kansas City Area Transportation Authority Agenda Welcome Troost Corridor Planning Study Public participation What is MAX? Survey of Troost Riders Proposed Transit
The Case for. Business. investment. in Public Transportation
 The Case for Business investment in Public Transportation Introduction Public transportation is an enterprise with expenditure of $55 billion in the United States. There has been a steady growth trend
Broward County Intermodal Center And People Mover. AASHTO Value Engineering Conference Presentation. September 1, 2009 San Diego, CA
 Project Development & Environment Study Broward County Intermodal Center And People Mover AASHTO Value Engineering Conference Presentation September 1, 2009 San Diego, CA Background P D & E Study Regional
WELCOME. Transit Options Amherst - Buffalo Public Workshops
 WELCOME Transit Options Amherst - Buffalo Public Workshops Sponsored by Niagara Frontier Transportation Authority Greater Buffalo Niagara Regional Transportation Council Where do you live? Where do you
Tri Delta Transit ADA Paratransit Information
 Tri Delta Transit ADA Paratransit Information Eligibility and Registration Eligibility is determined on a case-by-case basis in accordance with the ADA. Disabled status is strictly limited to those who
I-26 Fixed Guideway Alternatives Analysis
 I-26 Fixed Guideway Alternatives Analysis Public Meetings: North Charleston, January 25, 2016 Charleston: January 26, 2016 Summerville: January 28, 2016 Agenda I. Project Update II. III. IV. Screen Two
DRAFT Evaluation Scores. Transit
 DRAFT Evaluation s The criteria for evaluating applications for new funding commitments are used to measure how well they advance the six goals identified for the MTP. Through transportation: Reduce per
KANSAS CITY STREETCAR
 KANSAS CITY STREETCAR KAREN CLAWSON MID-AMERICA REGIONAL COUNCIL KANSAS CITY STREETCAR Regional Context Alternatives Analysis Kansas City Streetcar Project KANSAS CITY REGION KANSAS CITY REGION KANSAS
UTA Transportation Equity Study and Staff Analysis. Board Workshop January 6, 2018
 UTA Transportation Equity Study and Staff Analysis Board Workshop January 6, 2018 1 Executive Summary UTA ranks DART 6 th out of top 20 Transit Agencies in the country for ridership. UTA Study confirms
Strategies to keep people and goods moving in and through Seattle
 Strategies to keep people and goods moving in and through Seattle SR 99 Closure and the Seattle Squeeze 2018-2024 DON Information Session Department of Transportation Delridge Community Center November
ADA Paratransit Dial-a-Ride Passenger Guide
 ADA Paratransit Dial-a-Ride Passenger Guide Serving the areas of Jackson and Sutter Creek and parts of Pine Grove. Fixed-route buses may travel up to ¾ of a mile from the regular route to pick-up or drop-off
Metro-North Report on Metrics and Fare Evasion
 Metro-North Report on Metrics and Fare Evasion Performance Metrics Service Performance Improvement Metrics Service Metric OTP SHORT TRAINS SWITCH/SIGNAL DELAYS Change from 2018 2019 Goal YTD Target YTD
Public Meeting. City of Chicago Department of Transportation & Department of Housing and Economic Development
 Public Meeting City of Chicago Department of Transportation & Department of Housing and Economic Development Funded by Regional Transportation Authority September 12, 2011 In partnership with Presentation
MONTHLY PERFORMANCE DASHBOARD
 AUSTIN ENERGY MARCH 21 MONTHLY PERFORMANCE DASHBOARD A report highlighting key Austin Energy metrics for uary FY 21 FINANCIAL HEALTH Standard and Poor s Bond Rating Current AA AA Budget Based Revenues
EUGENE-SPRINGFIELD, OREGON EAST WEST PILOT BRT LANE TRANSIT DISTRICT
 EUGENE-SPRINGFIELD, OREGON EAST WEST PILOT BRT LANE TRANSIT DISTRICT (BRIEF) Table of Contents EUGENE-SPRINGFIELD, OREGON (USA)... 1 COUNTY CONTEXT AND SYSTEM DESCRIPTION... 1 SYSTEM OVERVIEW... 1 PLANNING
Request for Proposal for Trolley Security Services
 Request for Proposal for Trolley Security Services April 6, 2018 Trolley Security Support Services The Loop Trolley Company The Loop Trolley Company (LTC) is requesting proposals for armed on-board security
Central City Line Locally Preferred Alternative (LPA) Amendment Public Hearing. July 24, 2014
 Amendment Public Hearing. July 24, 2014") Central City Line Locally Preferred Alternative (LPA) Amendment Public Hearing July 24, 2014 Project Description The Central City Line is a High Performance Transit project that will extend from Browne
Central City Line Locally Preferred Alternative (LPA) Amendment Public Hearing July 24, 2014 Project Description The Central City Line is a High Performance Transit project that will extend from Browne
BROWARD BOULEVARD CORRIDOR TRANSIT STUDY
 BROWARD BOULEVARD CORRIDOR TRANSIT STUDY FM # 42802411201 EXECUTIVE SUMMARY July 2012 GOBROWARD Broward Boulevard Corridor Transit Study FM # 42802411201 Executive Summary Prepared For: Ms. Khalilah Ffrench,
GO Transit s deliverable: the 2020 Service Plan
 GO Transit s deliverable: the 2020 Service Plan GO Transit s 2020 Service Plan describes GO s commitment to customers, existing and new, to provide a dramatically expanded interregional transit option
2011 Saskatoon Transit Services Annual Report
 2011 Annual Report Saskatoon Transit provides a high quality of service for all citizens in our community, and is undertaking initiatives focused on building its ridership. Saskatoon, like most North American
Meter Insights for Downtown Store
 Meter Insights for Downtown Store Commodity: Analysis Period: Prepared for: Report Date: Electricity 1 December 2013-31 December 2014 Arlington Mills 12 February 2015 Electricity use over the analysis
New McNicoll Bus Garage Public Open House
 New McNicoll Bus Garage Public Open House Kennedy Public School 1 The Need for a New Bus Garage Riders Increased ridership means Buses Need for new buses Garage And a new buses facility Problems Garages
WIM #37 was operational for the entire month of September Volume was computed using all monthly data.
 SEPTEMBER 2016 WIM Site Location WIM #37 is located on I-94 near Otsego in Wright county. The WIM is located only on the westbound (WB) side of I-94, meaning that all data mentioned in this report pertains