Q Results Presentation d Amico International Shipping. May 4 th, 2016
|
|
|
- Esmond Cannon
- 5 years ago
- Views:
Transcription

1 Q Results Presentation d Amico International Shipping May 4 th, 2016

2 AGENDA. Executive Summary Highlights Financial Results Product Tanker Market & Outlook Appendix
3 EXECUTIVE SUMMARY. A strong product tanker market allowed DIS to record a Net Profit of US$ 7.2m in Q1 16 Spot TCE DIS generated a Daily Average Spot Rate of US$ 18,076 in Q1 16 substantially in line with the same period last year (US$ 18,503) and 15% higher compared to Q4 15 (US$ 15,673) Coverage TCE DIS had 47% of its total employment days in Q1 16 covered through Time-Charter contracts at an Average Daily Rate of US$ 15,706 Total TCE DIS achieved a Total Daily Average Rate of US$ 16,970 in Q1 16 slightly higher than US$ 16,939 achieved in Q1 15 Financials - DIS generated Net Profit of US$ 7.2m, EBITDA of US$ 21.6m (28.8% margin), Operating Cash Flow of US$ 25.5m in Q1 16 Investment Plan DIS continued implementing its large US$ 755m newbuilding plan (with US$317.4m in CAPEX remaining), of which US$ 38.6m invested in Q1 16 alone Strong financials in Q1 16 on the back of a favourable product tanker market 3
4 Highlights
5 HIGHLIGHTS. Main Events DIS Warrants The 3 rd and final exercise period ended in Jan 16, with approx. 17m warrants exercised at a price of Eur per ordinary share (1 new share for 3 warrants). In total, the program has been 98% subscribed, and it has generated US$ 2.9m in Q1 Buyback Program In Q1 16, DIS repurchased n. 1.18m own shares at the average price of for a total consideration of 0.5m. The 5y period for the execution of the buyback program expired at the end of Mar 16. At the end of this period, DIS had n. 7,760,027 own shares (1.81% of the Company s share capital). In Apr 16, DIS Annual General Shareholders Meeting renewed such program for a further 5 years. Long-Term incentive Plan In Apr 16, DIS Annual General Shareholders Meeting approved the Stock Option Plan DIS 2016/2019 submitted by the Board in Mar 16, in order to reinforce the loyalty and the involvement of directors, employees and contractors holding important roles or serving relevant functions in, or for, the Company. New Financing In Mar 16, DIS secured a new US$ 250m Term Loan Facility at very attractive terms with a pool of 9 primary financial institutions, in order to: i) refinance 7 existing vessels, extending their debt maturity from 2017 to 2020; ii) finance 6 newbuilding vessels. Trough this transaction, DIS has secured 100% of its long-term debt funding requirements. Fleet changes 1 Eco newbuilding MR product tanker built by Hyundai Mipo Dockyard Co. Ltd. (South Korea) was delivered to DIS in Jan 16 and employed on a 3y TC with an oil-major; the TC-Out contracts on 2 MR vessels due to expire in Q1 16 were extended for another year at higher rates; 3 TC-In vessels were redelivered to their owners in Q1 16, whilst the contracts on 6 further TC-In vessels were extended, with the new redeliveries dates between 2017 and
6 HIGHLIGHTS. Products tankers market Spot returns In Q1 16, the picture for the product tanker market was very mixed. The US markets and Asia Pacific maintained healthy returns through most of the quarter. The oil price declined markedly up to 11 February and then rose during the rest of the quarter. The decrease in average crude oil prices improved refinery margins. Furthermore, the volatility in prices created more trading opportunities. This resulted in an increase in demand for the seaborne transportation of petroleum products, even without a healthy increase in the consumption of such products. Stocks built unseasonably and by the end of the quarter were 12% higher year-on-year. Increase in Global Oil Product demand The growth in global oil demand will ease to around 1.2 mb/d in 2016, below 2015 s 1.8 mb/d expansion, as notable decelerations take hold across China, the United States and much of Europe. Preliminary Q1 16 data, according to the IEA, reveal this is already occurring, with year-on-year growth down to +1.2 mb/d, after gains of +1.4 mb/d in Q4 15 and +2.3 mb/d in Q3 15. Product stocks Product stocks drew by a small 11.5 million barrels in February, refined products stocks remain comfortable, covering 33.5 days of forward demand by end of March, 3 days above the level a year earlier. Following steep builds in the second half of 2015, middle distillate stocks remain ample, 100 million barrels above one year earlier, with warmer than average Northern hemisphere temperatures so far in 2016 resulting in lacklustre demand. Rising Product Tanker demand Global petroleum product trade continues to grow somewhat countered by supply of new Tonnage. However increasing ton-mile, positive refining margins and higher refinery runs are all positives for Product tanker demand. 6
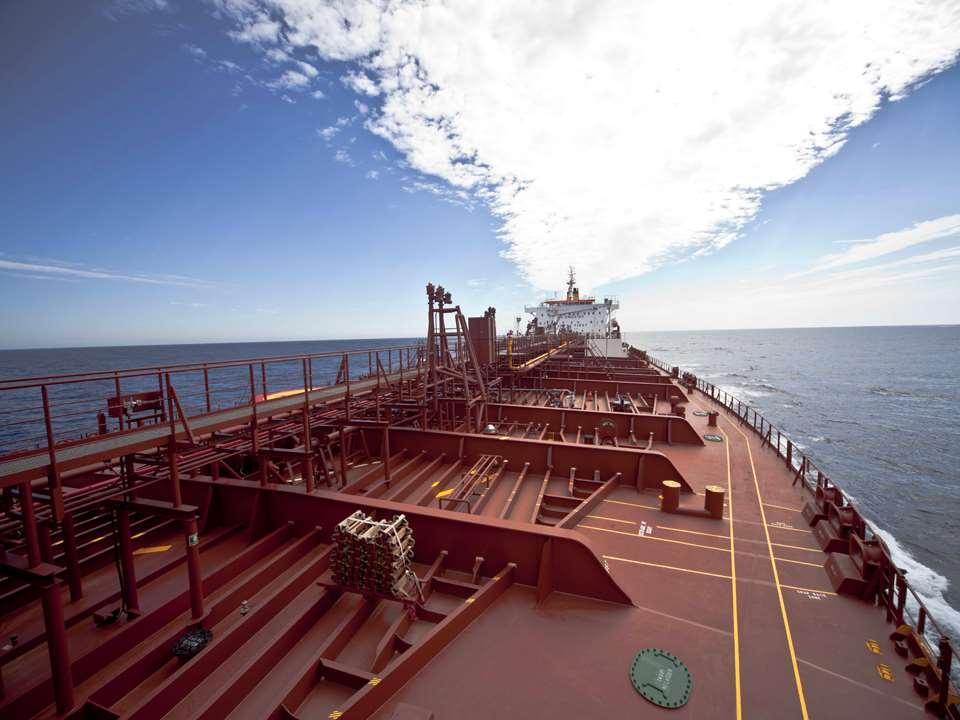
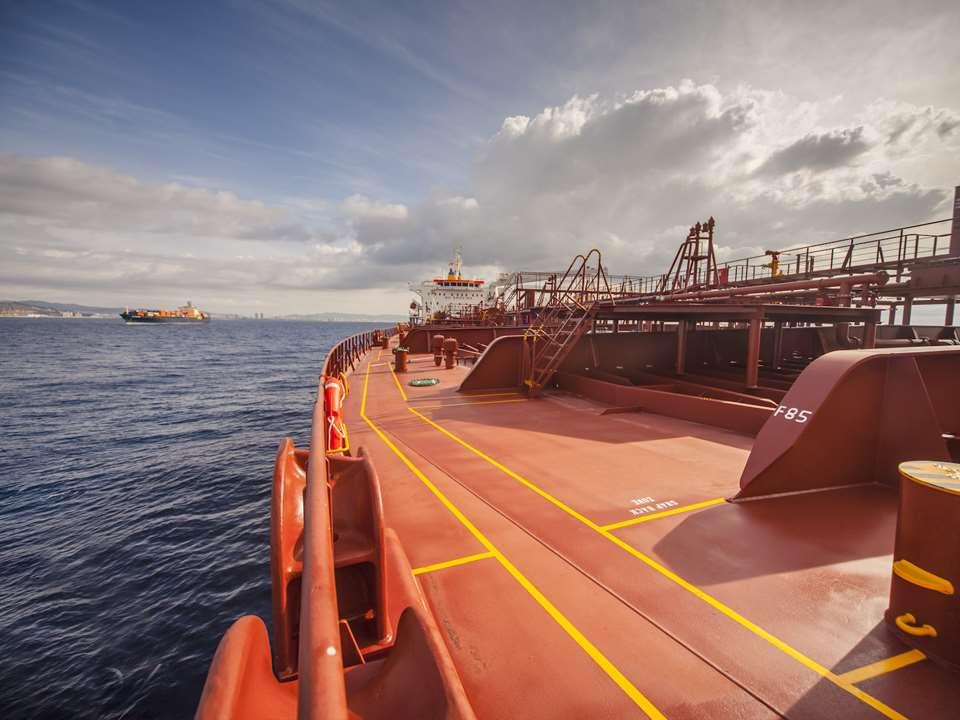
7 FLEET PROFILE. DIS Fleet 2 Mar. 31 st, 2016 MR Handy Total % Owned % Time chartered-in % TOTAL % DIS controls a modern fleet of 48.8 product tankers. Flexible and double-hull fleet 67% IMO classed, with an average age of 7.6 years (industry average 9.8 years 1 ). Fully in compliance with very stringent international industry rules. Long term vetting approvals from the main Oil Majors. 22 newbuildings ordered since 2012 (12 MRs, 4 Handys, 6 LR1s) of which 11 vessels already delivered between Q1 14 and Jan of these newbuildings have already been fixed on TC contracts with three different Oil Majors and one of the world largest refining Company at very profitable rates. DIS strategy is to maintain a top-quality TC coverage book, by fixing a large portion of its eco-newbuilding vessels with the main Oil Majors, which for long-term contracts currently have a strong preference for these efficient and technologically advanced ships. At the same time, DIS older tonnage will be employed mainly on the spot market. DIS has a modern fleet, a good mix of Owned and TC-In vessels, strong relationships with key market players which makes its business model very competitive 1. Source: Clarkson Research Services as at Apr Actual number of vessels as at the end of Mar 16 7
8 FINANCIAL RESULTS. TC Coverage Evolution 1 The possibility of accessing the TC market Allows DIS to: US$/day 100% 90% 80% 70% 60% 54% 71% 83% 15,953 16,332 16,558 17,000 16,000 15,000 Consolidate its strategic relationships with the World Oil Majors Hedge against the Spot market volatility 50% 40% 30% 20% 10% 0% 46% 29% 17% % Cover % Free Cover Dly Rate 14,000 13,000 12,000 Secure its TCE Earnings (FY 16 US$ 128m; FY 17 US$ 84m; FY 18 US$ 49m are already secured as of today) Improve its Operating Cash Flow (TC Hires are paid monthly in advance) DIS guideline is to have a TC coverage between 40% and 60% DIS has a high quality TC book with a good percentage of revenue already secured for the years to come 1. Situation based on contracts in place as of today and subject to changes 8

9 Financial Results
10 FINANCIAL RESULTS. Q Results (US$ million) Q Q TCE Earnings EBITDA EBITDA Margin 28.1% 28.8% EBIT Net Profit (Loss) TCE Earnings US$ 75.1m in Q1 16 vs. US$ 77.0m in Q1 15. The lower revenues are attributable only to the lower number of vessels managed in Q1 16 (Q1 16: 49.5 average vessels vs. Q1 15: 52.1 average vessels). In fact, DIS Total Daily Average TCE was US$ 16,970 in Q1 16 and very much in line with the previous year (Q1 15: US$ 16,939). EBITDA US$ 21.6m in Q1 16 and perfectly in line with last year. Such result was mainly driven by the good level of TCE Earnings generated in the period on the back of the positive product tanker market. DIS EBITDA margin was 28.8% in Q1 16 in line with the prior year (Q1 15: 28.1%). Net Profit US$ 7.2m in Q1 16 compared to US$ 11.4m posted in Q1 15. Such variance is almost entirely due to the positive impact arising from the Company s risk management activity which benefited 2015 results ( mark to market result on some hedging instruments). In Q1 16 DIS recorded a strong EBITDA margin of 29% and a Net Profit of US$ 7.2m 10
11 FINANCIAL RESULTS. Key Operating Measures Key Operating Measures Q Q Q Q Q Avg. n. of vessel Fleet contact coverage 44.8% 43.7% 46.8% 48.7% 46.7% Daily TCE Spot (US$/d) 18,503 19,533 21,219 15,673 18,076 Daily TCE Covered (US$/d) 15,010 15,153 15,220 15,461 15,706 Daily TCE Earnings (US$/d) 16,939 17,619 18,411 15,570 16,970 After three strong quarters last year, spot rates eased in Q4 mainly due to seasonality and refinery maintenance in the US Gulf. The market started firming up again in Dec and going into In fact, DIS realized a Daily Average Spot Rate of US$ 18,076 in Q1 16, a level slightly lower (-2.3%) than the same quarter last year (US$ 18,503) but 15% (or US$ 2,404/day) higher compared to the previous quarter (Q4 15: US$ 15,673). At the same time and in line with its strategy, DIS maintained a high level of coverage (fixed TC contracts) throughout the quarter, securing an average of 46.7% (Q1 15: 44.8%) of its revenue at a daily average rate of US$ 15,706 (Q1 15: US$ 15,010). DIS Total Daily Average TCE was US$ 16,970 in Q1 16 vs US$ 16,939 in Q1 15. Q1 16: DIS Daily Spot TCE was slightly lower than Q1 15, but 15% higher than the previous quarter 11
12 FINANCIAL RESULTS. Investment Plan Current CAPEX 1 & Financing US$/m M Y Plan Debt Financing Equity Financing ~ 2/3 of DIS current newbuilding plan should be financed with bank debt DIS has secured bank debt for all of its vessels under construction, and since for such vessels the first instalments were mostly equity financed, it should be able to fund 83% of the remaining CAPEX through bank debt 1. Other than yard Instalments, total CAPEX includes also small miscellaneous expenses in connection with the vessel s construction. 12
13 FINANCIAL RESULTS. Net Asset Value DIS Historical NAV evolution US$/m Dec-12 Dec-13 Dec-14 Dec-15 Mar-16 Fleet Market Value (FMV) Net Financial Position (NFP) Net Asset Value (NAV) NAV/Share (US$) US$ DIS Q1 16: NAV 1 of US$ 336m and Fleet Market Value of US$ 774m 1. Owned fleet market value according to a primary broker valuation less Net Debt 13
14 FINANCIAL RESULTS. Net Financial Position (US$ million) Dec 31, 2015 Mar 31, 2016 Gross debt/other fin. liabilities (469.1) (480.4) Cash/Current fin. assets Net financial position (422.5) (438.1) Fleet Market Value NFP of US$ (438.1)m and Cash resources of US$ 42.3m as at the end of Mar 16. US$ 38.6m investments in Q1 16 mainly in connection with the instalments paid on the newbuilding vessels under construction at Hyundai-MIPO shipyard, including 1 MR delivered in Jan 16. The substantial amount of CAPEX in the period was partially offset by the significant US$ 25.5m Operating Cash Flow generated in Q1 16 compared to US$ 11.1m realized in Q1 15. Solid financial structure and strong generation of operating cash flow supports DIS significant US$ 755m investment plan (CAPEX of US$317.4m remaining) 14

15 Product Tanker Market & Outlook
16 dollar/day mill $ $/day MARKET OVERVIEW. Earnings & vessels price Average Rates for MR 1 Product New-building/secondhand values Tankers (US$) 50 27, , ,000 12, Jan '16 spot 1 year 3 year 5 year Feb '16 Mar '16 Apr ' , Apr-16 MR Newbuilding Prices MR 5 Year Old Secondhand Prices 1 year T/C rate The product tanker charter rates recovered after the correction at the end of last year. The one year time-charter rate has maintained its level so far this year with a considerable number of contracts being concluded. In Q1 16 there were 60 new time charters in the MR segment for periods of 6 months or longer. The current one year rate for an MR is $17/17,500 per day. Refinery margins have provided good returns in the first quarter. Provided the oil price does not drastically improve this should continue and together with an improvement in gasoline demand going into the summer we could expect a pick up in Product tanker demand. 1. Source: Clarkson/Howe Rob as at Apr 16 16


17 DEMAND / SUPPLY. Balance Ton-mile demand % 1 Global Oil Demand Million barrels p/d Total OECD Total non-oecd Global petroleum product trade has grown on average 7 percent annually over the past 10 years, according to the latest figures from BP. Increasing ton mile, positive refining margins and higher runs have positively boosted product tanker demand. New refining projects coming on stream in Africa and Latin America have stalled meaning imports to both regions are expected to increase. Africa s refining capacity has changed very little over the past decade with current capacity of only 2.2 million b/d. Oil product imports to Africa are forecasted to increase 4% on average per annum over the next five years. This will primarily benefit MR tankers due to port restrictions. The ordering of new tankers has slowed compared to previous years and is over 40% lower this year to date compared to the same period last year. Only 7 new orders for MR tankers has been placed so far this year. 1. Source: Odin Marine, Banchero Costa SSY, HRP, DNB, d Amico 2. Source: International Energy Agency Medium-Term Oil Market Report, Mar 16 17
18 GROWTH IN REFINERY CAPACITY AND OIL DEMAND. Refinery growth % Capacity additions by region 6% 15% 10% 30% 30% K b/d OECD North America OECD Others Latin America Asia Middle East Others China Middle East Other Asia OECD Latin America other Global refinery crude distillation capacity is forecast to rise by 7.7 mb/d by 2021, to 105 mb/d. Non-OECD regions, essentially China and the Middle east account for 90% of these additions.. Saudi Arabia has added around 800,000 b/d of new refinery capacity in the last couple of years. Product exports from the Kingdom have doubled in the same period. They will add an additional 400,000 b/d of new refinery capacity by In the first quarter global refinery runs were up by 200,000 b/d to 79.3 mb/d, or 1.2 mb/d up year-on-year. The forecast for the second quarter throughput has been revised up by 270,000 b/d, reaching 79.7 mb/d growth followed by gasoil, jet/kerosene, and naphtha, respectively. NON-OECD oil demand has already posted 3.3% growth this year up from the average of 2.5% in Source: International Energy Agency Medium-Term Oil Market Report, Mar 16 18
19 DIS MARKET OPPORTUNITIES. In summary: Strong trend of refineries shifting towards oil production areas, especially in Asia and the Middle East, should lead to an increase in product tanker demand. The number of short-term time-charters has significantly increased, denoting charterers improved sentiment. Increase in ton-miles is improving product tanker utilisation rates and reducing the supply of tonnage. Increase of world oil demand still supported mainly by non-oecd countries (South America, sub-sahara Africa, China and India). Reduction in new building orders and scrapping of old tonnage should reduce future fleet growth. In-house ship-management enables DIS to better confront the ever increasing challenges in the product tankers market. DIS confirms its positive outlook on the product tankers market in the medium/ long term, and as a leading product tanker player, with first-class ship-management, is well positioned to take advantage of current and future market opportunities 1. Source: RS Platou, Clarkson 19
20 d AMICO INTERNATIONAL SHIPPING. This document does not constitute or form part of any offer to sell or issue, or invitation to purchase or subscribe for, or any solicitation of any offer to purchase or subscribe for, any securities of d Amico International Shipping S.A. (or the Company ), nor shall it or any part of it or the fact of its distribution form the basis of, or be relied on in connection with, any contract or investment decision. The information in this document includes forward-looking statements which are based on current expectations and projections about future events. Forward-looking statements concern future circumstances and results and other statements that are not historical facts, sometimes identified by the words "believes", expects", "predicts", "intends", "projects", "plans", "estimates", "aims", "foresees", "anticipates", "targets", and similar expressions. These forward-looking statements are subject to risks, uncertainties and assumptions about the Company and its subsidiaries and investments, including, among other things, the development of its business, trends in its operating industry, and future capital expenditures and acquisitions. In light of these risks, uncertainties and assumptions, actual results and developments could differ materially from those expressed or implied by the forward-looking statements. To understand these risks, uncertainties and assumptions, please read also the Company's announcements and filings with Borsa Italiana and Bourse de Luxembourg. No one undertakes any obligation to update or revise any such forward-looking statements, whether in the light of new information, future events or otherwise. Given the aforementioned risks, uncertainties and assumptions, you should not place undue reliance on these forward looking statements as a prediction of actual results or otherwise. You will be solely responsible for your own assessment of the market and the market position of the Company and for forming your own view of the potential future performance of the Company's business. The information and opinions contained in this presentation are provided as at the date of this presentation and are subject to change without notice. Neither the delivery of this document nor any further discussions of the Company with any of the recipients shall, under any circumstances, create any implication that there has been no change in the affairs of the Company since such date. 20
21 Appendix


22 DIS SHAREHOLDINGS STRUCTURE. Key Information on DIS Shares d'amico International SA 58.27% 2 Others 39.92% 3 d'amico International Shipping S.A. 1.81% 1 Listing Market Borsa Italiana, STAR No. of shares 428,510,356 Market Cap million Shares Repurchased / % of share capital 7,760,027 / 1.81% 1. Based on DIS Share price on April 29 th, 2016 of Eur

23 d AMICO S GROUP STRUCTURE. DIS benefits from the support of d Amico Società di Navigazione S.p.A. 23
24 DIS CURRENT FLEET OVERVIEW. MR Owned Fleet Owned Tonnage (dwt) Year Built Builder, Country Interest 1 IMO Classified High Trust 49, Hyundai MIPO, South Korea (Vinashin) 100% IMO II/IMO III High Trader 49, Hyundai MIPO, South Korea (Vinashin) 100% IMO II/IMO III High Loyalty 49, Hyundai MIPO, South Korea 100% IMO II/IMO III High Voyager 45, Hyundai MIPO, South Korea 100% IMO II/IMO III High Fidelity 49, Hyundai MIPO, South Korea (Vinashin) 100% IMO II/IMO III High Sun 2 49, Hyundai MIPO, South Korea (Vinashin) 33% IMO II/IMO III High Discovery 50, Hyundai MIPO, South Korea 100% IMO II/IMO III High Freedom 49, Hyundai MIPO, South Korea 100% IMO II/IMO III High Tide 51, Hyundai MIPO, South Korea 100% IMO II/IMO III High Seas 51, Hyundai MIPO, South Korea 100% IMO II/IMO III GLENDA Melissa 3 47, Hyundai MIPO, South Korea 100% IMO II/IMO III GLENDA Meryl 4 47, Hyundai MIPO, South Korea 50% IMO II/IMO III GLENDA Melody 3 47, Hyundai MIPO, South Korea 100% IMO II/IMO III GLENDA Melanie 4 47, Hyundai MIPO, South Korea 50% IMO II/IMO III GLENDA Meredith 4 46, Hyundai MIPO, South Korea 50% IMO II/IMO III GLENDA Megan 3 47, Hyundai MIPO, South Korea 100% IMO II/IMO III High Venture 51, STX, South Korea 100% IMO II/IMO III High Prosperity 48, Imabari, Japan 100% - High Presence 48, Imabari, Japan 100% - High Priority 46, Nakai Zosen, Japan 100% - High Progress 51, STX, South Korea 100% IMO II/IMO III High Performance 51, STX, South Korea 100% IMO II/IMO III High Valor 46, STX, South Korea 100% IMO II/IMO III High Courage 46, STX, South Korea 100% IMO II/IMO III High Endurance 46, STX, South Korea 100% IMO II/IMO III High Endeavour 46, STX, South Korea 100% IMO II/IMO III 1. DIS economical interest 2. Vessel owned by Eco Tankers Limited, a JV with Venice Shipping and Logistics S.p.A. in which DIS has 33% interest 3. Vessel owned by GLENDA International Shipping Ltd. In which DIS has 50% interest and Time Chartered to d Amico Tankers Ltd. 4. Vessel owned by GLENDA International Shipping Ltd. In which DIS has 50% interest 24
25 DIS CURRENT FLEET OVERVIEW. MR TC-IN Fleet Time charter with purchase option Tonnage (dwt) Year Built Builder, Country Interest 1 IMO Classified High Enterprise 45, Shin Kurushima, Japan 100% - High Pearl 48, Imabari, Japan 100% - Time charter without purchase option Tonnage (dwt) Year Built Builder, Country Interest 1 IMO Classified Carina 47, Iwagi Zosen Co. Ltd., Japan 100% - High Strength 2 46, Nakai Zosen, Japan 100% - High Force 53, Shin Kurushima, Japan 100% - High Efficiency 2 46, Nakai Zosen, Japan 100% - High Current 46, Nakai Zosen, Japan 100% - High Beam 46, Nakai Zosen, Japan 100% - Freja Baltic 47, Onimichi Dockyard, Japan 100% - High Glow 46, Nakai Zosen, Japan 100% - Citrus Express 53, Shin Kurushima, Japan 100% - Freja Hafnia 53, Shin Kurushima, Japan 100% - High Power 46, Nakai Zosen, Japan 100% - Port Said 45, STX, South Korea 100% IMO II/IMO III Port Stanley 45, STX, South Korea 100% IMO II/IMO III Port Union 46, STX, South Korea 100% IMO II/IMO III Port Moody 44, STX, South Korea 100% IMO II/IMO III 1. DIS economical interest 2. Vessels owned by DM Shipping Ltd. In which DIS has 51% interest and Time chartered to d Amico Tankers Ltd. 25
26 DIS CURRENT FLEET OVERVIEW. Handy Fleet Owned Tonnage (dwt) Year Built Builder, Country Interest 1 IMO Classified Cielo di Ulsan 39, Hyundai MIPO, South Korea (Vinashin) 100% IMO II/IMO III Cielo di New York 39, Hyundai MIPO, South Korea 100% IMO II/IMO III Cielo di Gaeta 39, Hyundai MIPO, South Korea 100% IMO II/IMO III Cielo di Guangzhou 2 38, Guangzhou, China 100% IMO II Time charter without purchase option Tonnage (dwt) Year Built Builder, Country Interest 1 IMO Classified Cielo di Milano 40, Shina Shipbuilding, South Korea 100% IMO II/IMO III Port Stewart 38, GSI Guangzhou Shipyard Int. - China 100% - Port Russel 37, GSI Guangzhou Shipyard Int. China 100% IMO II/IMO III SW Cap Ferrat I 3 36, STX, South Korea 100% IMO II/IMO III 1. DIS economic interest 2. Vessel previously in bare-boat charter contract to d Amico Tankers and then purchased in Dec Ex-Cielo di Salerno sold by d Amico Tankers in Dec 15 and taken back in time charter 26
27 DIS NEW BUILDING PROGRAM. Owned Estimated tonnage (dwt) MR/Handysize Estimated delivery date Builder, Country Interest Tbn 39,000 Handysize Q Hyundai MIPO, South Korea (Vinashin) 100% 422 Tbn 39,000 Handysize Q Hyundai MIPO, South Korea (Vinashin) 100% 423 Tbn 39,000 Handysize Q Hyundai MIPO, South Korea (Vinashin) 100% 424 Tbn 50,000 MR Q Hyundai MIPO, South Korea (Vinashin) 100% Tbn 50,000 MR Q Hyundai MIPO, South Korea (Vinashin) 100% S429 Tbn 75,000 LR1 Q Hyundai MIPO, South Korea (Vinashin) 100% S430 Tbn 75,000 LR1 Q Hyundai MIPO, South Korea (Vinashin) 100% S431 Tbn 75,000 LR1 Q Hyundai MIPO, South Korea (Vinashin) 100% 2018 S432 Tbn 75,000 LR1 Q Hyundai MIPO, South Korea (Vinashin) 100% S433 Tbn 75,000 LR1 Q Hyundai MIPO, South Korea (Vinashin) 100% S434 Tbn 75,000 LR1 Q Hyundai MIPO, South Korea (Vinashin) 100% Time charter with purchase option Estimated tonnage (dwt) MR/Handysize Estimated delivery date Builder, Country Interest TBN 50,000 MR H Minaminippon Shipbuilding, Japan 100% TBN 50,000 MR H Minaminippon Shipbuilding, Japan 100% TBN 50,000 MR H Onomichi Dockyard, Japan 100% 2018 TBN 50,000 MR H Onomichi Dockyard, Japan 100% TBN 50,000 MR H Japan Marine United Co., Japan 100% TBN 50,000 MR H Japan Marine United Co., Japan 100% 1. DIS economical interest 27


28 SUPPLY. Slippage & net fleet growth The order book for MR tankers that is scheduled to be delivered in 2016 is according to various reports between 114 and 151. So far this year 37 ships in the MR sector have been delivered compared to 54 in the same period last year. As was the case in 2015, also in 2016 a relatively large amount of newbuildings are scheduled to be delivered. Thereafter, however, net fleet growth is expected to slowdown. Slippage, cancellations and order changes have reduced deliveries by about 30% over the last five years. Net MR 1 fleet growth Orderbook vs. deliveries - MR 1 Tankers Orderbook 200 FY'16 Exp.Deliveries Deliveries 100 FY'16 Exp.Removals Order Book Delivered Scrapped 2016 Scrapped MR product tankers ranging from 25,000 to 55,000 dwt. Source: Clarkson, HRP, SSY, Braemar and Gibson search 2. MR product tanker fleet Source Clarkson 28
29 (f) 2017(f) 2018(f) 2019(F) 2020(f) 2021(f) DEMAND. Growth The IEA 1 expects growth in global oil demand will ease to around 1.2 mb/d in 2016, below 2015 s 1.8 mb/d expansion, as notable decelerations take hold across China, the United States and much of Europe. Preliminary 1Q2016 data according to the IEA reveal this is already occurring, with year-on-year growth down to +1.2 mb/d, after gains of +1.4 mb/d in Q4 15 and +2.3 mb/d in Q3 15. Strong gains in India remain one of the most persistent demand drivers, showing that if an economy remains fundamentally robust lower oil prices can stimulate additional demand. Oil deliveries grew globally by 335,000 b/d in Q versus last year. Global Oil Demand Global Oil Demand Growth Million barrels p/d Total OECD Total non-oecd Million barrels p/d Source: International Energy Agency Medium-Term Oil Market Report, Mar 16 29
30 Global Product Supply Balances China shipped record high volumes of gasoil in March as refiners, holding plentiful export quotas, scouted around for overseas buyers in an effort to cut burgeoning stocks at home because of sluggish domestic demand, a trend market experts expect to continue. Chinese Gasoil exports hit a record 1.25 million metric tonnes in March, surpassing the previous all-time high of 1.11 million metric tonnes in September Saudi Arabia has added around 800,000 b/d of new refinery capacity in the last couple of years. Product exports from the Kingdom have doubled in the same period. They will add an additional 400,000 b/d of new refinery capacity by Supply balances gasoline / naphtha (thousand barrels per day) Supply balances gasoil / kerosene (thousand barrels per day) OECD Americas Europe FSU Middle East Asia Africa OECD Americas Europe FSU Middle East Asia Africa non-oecd Americas Source: International Energy Agency Medium-Term Oil Market Report, Mar 16 30

31 Thank you!
Q3 & 9 months 2015 Results Presentation d Amico International Shipping. November 11 th, 2015
 Q3 & 9 months 2015 Results Presentation d Amico International Shipping November 11 th, 2015 AGENDA. Executive Summary Highlights Financial Results Product Tanker Market & Outlook Appendix WHY INVEST IN
BUSINESS OVERVIEW FEBRUARY
 BUSINESS OVERVIEW FEBRUARY 2018 Except for historical information, the statements made in this presentation constitute forward looking statements. These include statements regarding the intent, belief
Q Analyst Teleconference. 9 August 2018
 9 August 218 Disclaimer This presentation contains forward-looking statements that reflect the Company management s current views with respect to certain future events. Although it is believed that the
Valvoline Fourth-Quarter Fiscal 2016 Earnings Conference Call. November 9, 2016
 Valvoline Fourth-Quarter Fiscal 2016 Earnings Conference Call November 9, 2016 Forward-Looking Statements This presentation contains forward-looking statements within the meaning of Section 27A of the
Tanker Market Outlook
 Tanker Market Outlook 4 th Maritime Indonesia Simon Chattrabhuti, Director, Head of Tanker Market Analysis Jakarta, 22 March 212 Disclaimer THIS PRESENTATION IS CONFIDENTIAL AND IS SOLELY FOR THE USE OF
2015 Interim Results Announcement
 China Petroleum & Chemical Corporation 2015 Interim Results Announcement August 27, 2015 Hong Kong Cautionary Statement This presentation and the presentation materials distributed herein include forward-looking
MALAYSIAN BULK CARRIERS BERHAD ( W)
") www.maybulk.com.my MALAYSIAN BULK CARRIERS BERHAD (175953-W) Contents t Commercial highlights Page 3 MBC Fleet composition 4 Shipping Revenue Composition and Operating Profit 5 MBC Fleet TCE rates 6 Fleet
www.maybulk.com.my MALAYSIAN BULK CARRIERS BERHAD (175953-W) Contents t Commercial highlights Page 3 MBC Fleet composition 4 Shipping Revenue Composition and Operating Profit 5 MBC Fleet TCE rates 6 Fleet
9M 2003 Financial Results (US GAAP)
") 9M Financial Results (US GAAP) January 2004 LUKOIL Group Crude Oil Production* mln tonnes 82 80 78 76 74 72 70 68 66 64 Crude oil production 3.2 5.5 3.9 76.8 70.3 71.3 2001 Production by subsidiaries Share
9M Financial Results (US GAAP) January 2004 LUKOIL Group Crude Oil Production* mln tonnes 82 80 78 76 74 72 70 68 66 64 Crude oil production 3.2 5.5 3.9 76.8 70.3 71.3 2001 Production by subsidiaries Share
2010 1Q Investor Meeting. May 2010
 2010 1Q Investor Meeting May 2010 This presentation contains preliminary figures which may be materially different from the final figures. While the statements in this presentation represent our current
FISCAL YEAR MARCH 2014 FINANCIAL RESULTS
 FISCAL YEAR MARCH 214 FINANCIAL RESULTS Mazda CX-5 Mazda Atenza Mazda Motor Corporation April 25, 214 New Mazda Axela 1 PRESENTATION OUTLINE Highlights Fiscal Year March 214 Results Fiscal Year March 215
Commercial Highlights
 1 3 Fleet Composition Tanker - as at 31 Dec Bulk Post-Panamax (5 vessels) 276,009 DWT Handysize (5 vessels) 435,260 DWT Supramax (5 Product Tanker (3 Carriers vessels) 156,302 DWT 142,129 DWT Grand-total
FISCAL YEAR MARCH 2014 FIRST HALF FINANCIAL RESULTS. New Mazda Axela (Overseas name: New Mazda3)
") FISCAL YEAR MARCH 2014 FIRST HALF FINANCIAL RESULTS New Mazda Axela (Overseas name: New Mazda3) Mazda Motor Corporation October 31, 2013 1 PRESENTATION OUTLINE Highlights Fiscal Year March 2014 First Half
FISCAL YEAR MARCH 2014 FIRST HALF FINANCIAL RESULTS New Mazda Axela (Overseas name: New Mazda3) Mazda Motor Corporation October 31, 2013 1 PRESENTATION OUTLINE Highlights Fiscal Year March 2014 First Half
Financial Statements Matti Lievonen, President & CEO 7 February 2017
 Financial Statements 2016 Matti Lievonen, President & CEO Agenda 1 2 3 4 Year 2016 Financials 2016 Segment reviews Current topics 5 Appendix 2 Disclaimer The following information contains, or may be deemed
Cosmo Oil Co., Ltd. Presentation on Results for First Quarter of Fiscal 2012 August 2, 2012 Director: Satoshi Miyamoto
 Cosmo Oil Co., Ltd. Presentation on Results for First Quarter of Fiscal 2012 August 2, 2012 Director: Satoshi Miyamoto Copyright 2012 COSMO OIL CO.,LTD. All Rights Reserved. Key Points of Financial Results
Valeo reports 14% growth in consolidated sales for third quarter 2011
 24.11 Valeo reports 14 growth in consolidated sales for third quarter 2011 Third quarter 2011-14 growth in consolidated sales (12 on a like-for-like basis 1 ) to 2,662 million euros - 17 growth in original
FISCAL YEAR MARCH 2018 FIRST HALF FINANCIAL RESULTS
 FISCAL YEAR MARCH 2018 FIRST HALF FINANCIAL RESULTS PRESENTATION OUTLINE Highlights Fiscal Year March 2018 First Half Results Fiscal Year March 2018 Full Year Forecast Progress of Key Initiatives/ Business
DRY BULK FREIGHT MARKET OUTLOOK MJUNCTION INDIAN STEEL MARKETS CONFERENCE
 DRY BULK FREIGHT MARKET OUTLOOK MJUNCTION INDIAN STEEL MARKETS CONFERENCE JUNE 2018 PRESENTATION STRUCTURE where are we in the dry bulk freight market cycle? current freight rates in perspective fundamental
Bernstein Strategic Decisions Conference 2018
 Bernstein Strategic Decisions Conference 2018 Forward-Looking Statements Certain statements in this presentation, other than statements of historical fact, including estimates, projections, statements
Emerging Trends in Petroleum Markets
 Emerging Trends in Petroleum Markets For Defense Logistics Agency, Worldwide Energy Conference Washington, D.C. By T. Mason Hamilton, Petroleum Markets Analyst U.S. Energy Information Administration Independent
2003 fourth quarter and full-year results
 Dinesh Paliwal Member of Group Executive Committee, Head of Automation Technologies Division 2003 fourth quarter and full-year results Automation Technologies Copyright 2003 ABB. All rights reserved. -
Sinopec Corp. Q Results Announcement. 29 October 2010
 Sinopec Corp. Q3 2010 Results Announcement 29 October 2010 Disclaimer i As required by the CSRC, financial statements of the third quarter of Sinopec Corp. (the Company ) were prepared under PRC Accounting
2010 Interim Results Presentation. August 23, 2010 Hong Kong
 Sinopec Corp. 21 Interim Results Presentation August 23, 21 Hong Kong Disclaimer i This presentation and the presentation materials distributed herein include forwardlooking statements. All statements,
BMW Group posts record earnings for 2010
 10.03.2011 BMW Group posts record earnings for 2010 Profit before tax rises to euro 4,836 million Profit before financial result climbs to euro 5,094 million Automobiles segment reports EBIT of euro 4,355
Kongsberg Automotive ASA. Fourth quarter February 28, 2019
 Kongsberg Automotive ASA Fourth quarter - February 28, 2019 Highlights Q4 Sales Revenues grew by 21 (7.3%) YoY to 288 including negative FX effects of 1. We booked new business with 77 in expected annual
DISCLAIMER. Indofood Agri Resources Ltd.
 INTEGRATED PLANTATION WITH LEADING BRANDS Company Presentation Q 2008 Results 29 April 2008 DISCLAIMER This presentation was prepared solely and exclusively for the parties presently being invited for
Third Quarter 2018 Performance and Business Update. October 24, 2018
 Third Quarter 2018 Performance and Business Update October 24, 2018 1 Important Notice Please read this management presentation together with the Company s press release issued earlier today announcing
FISCAL YEAR MARCH 2015 FIRST QUARTER FINANCIAL RESULTS. Mazda Roadster 25 th Anniversary Model
 FISCAL YEAR MARCH 2015 FIRST QUARTER FINANCIAL RESULTS Mazda Roadster 25 th Anniversary Model Mazda Motor Corporation July 31, 2014 1 PRESENTATION OUTLINE Highlights Fiscal Year March 2015 First Quarter
Q SALES Strong organic growth, confirmed momentum. October 12, 2017
 Q3 2017 SALES Strong organic growth, confirmed momentum October 12, 2017 Q3 2017 Sales Key facts Sales Since January 1, 2017, Faurecia reports on value-added sales, which are total sales less monolith
FISCAL YEAR MARCH 2015 THIRD QUARTER FINANCIAL RESULTS. Updated Mazda CX-5 (Japanese specification model)
") FISCAL YEAR MARCH 2015 THIRD QUARTER FINANCIAL RESULTS Updated Mazda CX-5 (Japanese specification model) Mazda Motor Corporation February 4, 2015 1 PRESENTATION OUTLINE Highlights Fiscal Year March 2015
FISCAL YEAR MARCH 2015 THIRD QUARTER FINANCIAL RESULTS Updated Mazda CX-5 (Japanese specification model) Mazda Motor Corporation February 4, 2015 1 PRESENTATION OUTLINE Highlights Fiscal Year March 2015
MONRO MUFFLER BRAKE, INC. PROVIDES FOURTH QUARTER AND FISCAL 2017 FINANCIAL RESULTS
 CONTACT: John Van Heel Chief Executive Officer (585) 647-6400 Robert Gross Executive Chairman (585) 647-6400 FOR IMMEDIATE RELEASE Brian D Ambrosia Senior Vice President Finance Chief Financial Officer
April Título da apresentação DD.MM.AAAA
 Aquisition of Shell Argentina downstream assets April 2018 Título da apresentação DD.MM.AAAA DISCLAIMER This presentation contains estimates and forward-looking statements regarding our strategy and opportunities
Global Downstream Petroleum Outlook
 Global Downstream Petroleum Outlook Claude Mandil Executive Director International Energy Agency 3 rd OPEC International Seminar Vienna, 12 September 26 Spare Refinery Capacity Has Tightened 9 1% 85 95%
Regional Refining Outlook
 Regional Refining Outlook Implications for Crude Demand Platts Crude Summit 15 May 213 David Wech JBC Energy GmbH 13 th May 213 Research - Energy Studies - Consulting - Training Disclaimer All statements
Conference Call H Düsseldorf August 4, 2016
 R H E I N M E TA L L A G T H E T EC H N O LO GY G RO U P FO R S EC U R I T Y A N D M O B I L I T Y Conference Call Düsseldorf August 4, 2016 RHEINMETALL AG 2016 Rheinmetall Group Highlights Increased sales,
Corporate Communications. Media Information 15 March 2011
 15 March 2011 BMW Group aims to further increase earnings in 2011 EBIT margin of over 8% expected in Automobiles segment Sales volume of well in excess of 1.5 million vehicles targeted Margin of 8% to
Third Quarter 2017 Performance and Business Update. October 26, 2017
 Third Quarter 2017 Performance and Business Update October 26, 2017 1 Important Notice Please read this management presentation together with the Company s press release issued earlier today announcing
Product Tanker Market Outlook IMSF Geneva - May 2017
 Product Tanker ket Outlook IMSF Geneva - 217 Global Presence 16 staff in strategic locations LONDON HOUSTON BEIJING SEOUL HONG KONG SINGAPORE Product Tanker ket Outlook 217 2 Where are we now? Product
FISCAL YEAR END MARCH 2013 FIRST HALF FINANCIAL RESULTS. New Mazda6 (Atenza)
") FISCAL YEAR END MARCH 2013 FIRST HALF FINANCIAL RESULTS New Mazda6 (Atenza) Mazda Motor Corporation October 31, 2012 1 PRESENTATION OUTLINE Highlights Fiscal Year March 2013 First Half Results Fiscal Year
FISCAL YEAR END MARCH 2013 FIRST HALF FINANCIAL RESULTS New Mazda6 (Atenza) Mazda Motor Corporation October 31, 2012 1 PRESENTATION OUTLINE Highlights Fiscal Year March 2013 First Half Results Fiscal Year
TANKERSKA NEXT GENERATION Inc. MARCH Full fleet capacity in December Dividend payout from 2015 & 2016 profits
 MARCH 2018 1 1 About us Incorporated in August 2014 IPO & SPO in H1 2015 Full fleet capacity in December 2015 6 modern MR product tankers Dividend payout from 2015 & 2016 profits Transparency 2016 IR award
The Changing composition of bunker fuels: Implications for refiners, traders, and shipping
 Platts 4 th European Refining Markets Conference The Changing composition of bunker fuels: Implications for refiners, traders, and shipping Wade DeClaris, EVP Marine World Fuel Services Corp. Agenda: Role
I remind you that our presentation is available on our website. We can start from the first 2 slides that show Piaggio Group First
 CONFERENCE CALL 2009 1 st HALF RESULTS Good afternoon and welcome to everybody. I remind you that our presentation is available on our website. We can start from the first 2 slides that show Piaggio Group
Roadshow Presentation
 Roadshow Presentation June 2, Wilfried Trepels, CFO 1 SAF-HOLLAND - Components Fifth Wheels Kingpins Suspensions Landing Gear Axle Systems 2 SAF-HOLLAND - Business Units Trailer Systems Powered Vehicle
FY2012. H1 Financial Results. November 8, Copyright(C) 2011 Isuzu Motors Limited All rights reserved
 2011 Isuzu Motors Limited All rights reserved") FY2012 H1 Financial Results November 8, 2011 1 Copyright(C) 2011 Isuzu Motors Limited All rights reserved Ⅰ. President and Representative Director : Susumu Hosoi :FY2012 H1 Financial Summary Outline Ⅱ.
FY2012 H1 Financial Results November 8, 2011 1 Copyright(C) 2011 Isuzu Motors Limited All rights reserved Ⅰ. President and Representative Director : Susumu Hosoi :FY2012 H1 Financial Summary Outline Ⅱ.
FISCAL YEAR MARCH 2018 FIRST QUARTER FINANCIAL RESULTS
 FISCAL YEAR MARCH 2018 FIRST QUARTER FINANCIAL RESULTS PRESENTATION OUTLINE Highlights Fiscal Year March 2018 First Quarter Results Fiscal Year March 2018 Full Year Forecast Structural Reform Stage 2 Progress
CONFERENCE CALL RESULTS Q1 2017
 CONFERENCE CALL RESULTS Q1 2017 May 5, 2017 Marc Bunz (CFO) Nicolas-Fabian Schweizer (CTO) AGENDA Market & Strategy Update Financials 2016 Financials Q1 2017 Outlook SCHWEIZER Share Schweizer Electronic
A2A-LGH Partnership. Milan, September 8 th, Borsa Italiana Italian Infrastructure Day
 A2A-LGH Partnership Milan, September 8 th, 2016 Borsa Italiana Italian Infrastructure Day Partnership Rationale PARTNERSHIP CRITERIA PARTNERSHIP OPPORTUNITIES Territorial leadership Territorial investments
third QUARTER 2012 October 26, 2012
 third QUARTER 212 October 26, 212 Helena norrman Senior Vice President Communications third QUARTER 212 October 26, 212 This presentation contains forward-looking statements. Such statements are based
Aegean Marine Petroleum Network Inc.
 Aegean Marine Petroleum Network Inc. First Quarter 2007 Conference Call May 24, 2007 Disclosure Today s s presentation and discussion will contain forward-looking statements within the meaning of the Private
EXANE BNP PARIBAS 13th European Seminar June 8, 2011
 EXANE BNP PARIBAS 13th European Seminar June 8, 2011 This presentation may contain forward-looking statements. Such forward-looking statements do not constitute forecasts regarding the Company s results
Focus on value creation
 Focus on value creation Matti Lievonen President & CEO Capital Markets Day 2011 21 September 2011 Results and outlook EBITDA shows our ability to generate cash flow Comparable EBITDA has been over EUR
FY H1 Financial Results
 FY2011 1 H1 Financial Results November 8, 2010 1 Copyright(C) 2010 Isuzu Motors Limited All rights reserved Contents Ⅰ. President and Representative Director : Susumu Hosoi :FY2011 H1 Financial Summary
RESULTS FOR Q ANALYST TELECONFERENCE
 RESULTS FOR Q4 216 ANALYST TELECONFERENCE Market 1 2 Operation Financials 3 Market 1 216 Fourth Quarter Market Conditions Product Market Crude Oil Postponed Maintenances Started to take place High Agricultural
FISCAL YEAR END MARCH 2013 FIRST QUARTER FINANCIAL RESULTS
 FISCAL YEAR END MARCH 213 FIRST QUARTER FINANCIAL RESULTS New MAZDA CX-5 Mazda Motor Corporation July 31, 212 1 PRESENTATION OUTLINE Highlights Fiscal Year End March 213 Results Update of Structural Reform
PROTELINDO PT. SARANA MENARA NUSANTARA, Tbk. (TOWR) Indonesia s Premier Tower Company 1Q 2015 Results Presentation
 Indonesia s Premier Tower Company 1Q 2015 Results Presentation") PROTELINDO PT. SARANA MENARA NUSANTARA, Tbk. (TOWR) Indonesia s Premier Tower Company 1Q 2015 Results Presentation Disclaimer These materials have been prepared by PT Sarana Menara Nusantara, Tbk. (the
PROTELINDO PT. SARANA MENARA NUSANTARA, Tbk. (TOWR) Indonesia s Premier Tower Company 1Q 2015 Results Presentation Disclaimer These materials have been prepared by PT Sarana Menara Nusantara, Tbk. (the
ZSE INVESTORS CONFERENCE 2018
 ZSE INVESTORS CONFERENCE 2018 About us Incorporated in August 2014 IPO & SPO in H1 2015 Full fleet capacity in December 2015 6 modern MR product tankers Dividend payout from 2015 & 2016 profits Transparency
Global Oil&Gas Tanker Outlook
 MARSEILLE MARITIME 28 Global Oil&Gas Tanker Outlook ( and just a few words on containerships) Ralph Leszczynski Marseille, 16 September 28 banchero costa research www.bancosta.it - research@bancosta.it
FISCAL YEAR ENDED MARCH 2011 FINANCIAL RESULTS
 FISCAL YEAR ENDED MARCH 211 FINANCIAL RESULTS Mazda Motor Corporation April 28, 211 Mazda MINAGI 1 PRESENTATION OUTLINE Highlights Fiscal Year Ended March 211 Results In Summary Question & Answer Session
ENEL PUBLISHES 2018 SECOND QUARTER AND FIRST HALF GROUP OPERATING DATA REPORT
 Media Relations Investor Relations T +39 06 8305 5699 T +39 06 8305 7975 F +39 06 8305 3771 F +39 06 8305 7940 ufficiostampa@enel.com investor.relations@enel.com enel.com enel.com ENEL PUBLISHES 2018 SECOND
Q Matti Lievonen President and CEO
 Q1 2018 Matti Lievonen President and CEO CONTENTS 1. Q1 2018 review 2. Group financials 3. Segment reviews 4. Current topics 5. Appendix 2 Disclaimer The following information contains, or may be deemed
Fiscal Year 2012: Year of record operational performance
 Ranshofen, March 1, 2013 Fiscal Year 2012: Year of record operational performance Year of record operational performance: - 327,800 tons of external shipments - 266,900 tons of scrap charged in Ranshofen
ABATEMENT TECHNOLOGY, RFO vs DISTILLATE - impact on costs & emissions
 ABATEMENT TECHNOLOGY, RFO vs DISTILLATE - impact on costs & emissions CIMAC Circle Marintec, Shanghai Dec 2009 Jerry Hammett Marine Technology Manager DISCLAIMER STATEMENT This presentation contains forward-looking
BUSINESS OVERVIEW 12 February 2019
 BUSINESS OVERVIEW 12 February 2019 Except for historical information, the statements made in this presentation constitute forward looking statements. These include statements regarding the intent, belief
Q Financial Results
 Q3 2018 Financial Results 1 Forward-looking statement The statements on the future in this presentation, including expected sales and earnings, are associated with risks and uncertainties and may be affected
Handelsbanken s. 5 th Transport Seminar. Billede. Michael Tønnes Jørgensen Executive Vice President & CFO. (Solnedgang?)
") Handelsbanken s Billede 5 th Transport Seminar (Solnedgang?) 2010 Michael Tønnes Jørgensen Executive Vice President & CFO October 2010 THE PREFERRED PARTNER IN GLOBAL TRAMP SHIPPING. UNIQUE PEOPLE. OPEN
Handelsbanken s Billede 5 th Transport Seminar (Solnedgang?) 2010 Michael Tønnes Jørgensen Executive Vice President & CFO October 2010 THE PREFERRED PARTNER IN GLOBAL TRAMP SHIPPING. UNIQUE PEOPLE. OPEN
Q SALES Strong outperformance in all regions. April 20, 2018
 Q1 2018 SALES Strong outperformance in all regions April 20, 2018 Q1 2018 Sales - Key Facts Impact from IFRS15 implementation In 2017, Faurecia had already partly anticipated IFRS15 through the presentation
Volvo Group THIRD QUARTER 2015 JAN GURANDER. Volvo Group Headquarters Third quarter
 Volvo Group THIRD QUARTER 2015 JAN GURANDER 1 VOLVO GROUP Third quarter highlights NET SALES SEK bn 12 months 310 bn IMPROVED PROFITABILITY ON FLAT VOLUMES UNDERLYING OPERATING MARGIN 6.9% 67 73 OPERATING
Welcome Welcome... 1
 Welcome Welcome... 1 Presentation Structure Our presentation is split into three sections going through the market, operations and financials 2 3 As it has been indicated previously, it is now much clear
Earnings conference call Q4 & FY 2016
 Earnings conference call Q4 & FY 2016 Bo Annvik, CEO / Åke Bengtsson, CFO February 10, 2016 1 Agenda Business Highlights Market Update Sales Financials Way forward 2 Business Summary FY 2016 A year with
AMAG posts record shipments in 2013; dividend recommendation of 0.60 EUR per share
 Ranshofen, 28 February 2014 AMAG posts record shipments in 2013; dividend recommendation of 0.60 EUR per share Shipments at an all-time high of 351,700 tonnes (t) in 2013, compared with 344,200 t a year
AMAG posts record shipments in 2013; dividend recommendation of 0.60 EUR per share unchanged on last year
 Ranshofen, 28 February 2014 AMAG posts record shipments in 2013; dividend recommendation of 0.60 EUR per share unchanged on last year Shipments at an all-time high of 351,700 tonnes (t) in 2013, compared
Economic & Steel Market Development in Japan
 1 Economic & Steel Market Development in Japan 68 th OECD Steel Committee Paris May 6-7, 2010 The Japan Iron & Steel Federation 2 Macro-economic overview Steel Supply and Demand v v v Steel Production
INTEGRATED PLANTATION WITH LEADING BRANDS. Company Presentation - Q Results
 INTEGRATED PLANTATION WITH LEADING BRANDS Company Presentation - Q1 2007 Results April 2007 DISCLAIMER This presentation was prepared solely and exclusively for the parties presently being invited for
New York Energy Forum
 Presentation at the New York Energy Forum 30 June 2014 Antoine Halff The oil market at a junction Balances loosen up on paper but must be seen in perspective The unconventional supply revolution enters
Fiscal Year 2012: Year of record operational performance
 Ranshofen, February 28, 2013 Fiscal Year 2012: Year of record operational performance Year of record operational performance: - 327,800 tons of external shipments - 266,900 tons of scrap charged in Ranshofen
QUARTERLY REVIEW OF BUSINESS CONDITIONS: NEW MOTOR VEHICLE MANUFACTURING INDUSTRY / AUTOMOTIVE SECTOR: 2 ND QUARTER 2017
 NATIONAL ASSOCIATION OF AUTOMOBILE MANUFACTURERS OF SOUTH AFRICA GROUND FLOOR, BUILDING F ALENTI OFFICE PARK 457 WITHERITE ROAD, THE WILLOWS, X82 PRETORIA PO BOX 40611, ARCADIA 0007 TELEPHONE: (012) 807-0152
Q3 & 9M 2018 Results Presentation. October 24 th, 2018
 Q3 & 9M 2018 Results Presentation October 24 th, 2018 Q3 & 9M HIGHLIGHTS & CATEGORY SPOTLIGHTS Gonzalve BICH 3Q and 9M 2018 Results Presentation 2 9 Months 2018 Key Messages Continued challenging trading
Third quarter results Matti Lievonen, President & CEO 26 October 2017
 Third quarter results 2017 Matti Lievonen, President & CEO 26 October 2017 Agenda 1. Q3/17 Group financials 2. January-September 2017 review 3. Q3/17 Segment reviews 4. Current topics 5. Appendix 2 Disclaimer
Mazda Motor Corporation June 17, 2011
 FY ENDING MARCH 2012 FINANCIAL FORECAST New MAZDA Demio 13-SKYACTIV Mazda Motor Corporation June 17, 2011 1 PRESENTATION OUTLINE FY ending March 2012 Forecast Updates of Framework for Medium- and Long-term
HONDA CANADA FINANCE INC. AUTO FINANCE FORUM February 15, ACCORD
 HONDA CANADA FINANCE INC. AUTO FINANCE FORUM February 15, 2018 2018 ACCORD 1 Caution with Respect to Forward-Looking Statements: These slides contain forward-looking statements within the meaning of the
OCTANE THE NEW ECONOMICS OF. What Drives the Cost of Octane and Why Octane Costs Have Risen Since 2012 T. J. HIGGINS. A Report By:
 THE NEW ECONOMICS OF OCTANE What Drives the Cost of Octane and Why Octane Costs Have Risen Since 2012 A Report By: T. J. HIGGINS Contents Foreword... 1 1. Executive Summary... 2 2. Tracking the Changing
VGI Global Media Plc. 2015/16 Earnings Presentation 16 May 2016
 VGI Global Media Plc 2015/16 Earnings Presentation 16 May 2016 Disclaimer Investment involves risk. Prospective should understand the characteristics of Securities and study information about VGI Global
FY2018 H1 Financial Results
 FY2018 H1 Financial Results November 6,2017 1 Copyright(C) 2017 Isuzu Motors Limited All rights reserved Contents Ⅰ. President and Representative Director : Masanori Katayama :FY2018 H1 Financial Summary
FY2019 H1 Financial Results. November 2, 2018 ISUZU MOTORS LIMITED. 1 Copyright(C) 2018 Isuzu Motors Limited All rights reserved
 2018 Isuzu Motors Limited All rights reserved") FY2019 H1 Financial Results November 2, 2018 ISUZU MOTORS LIMITED 1 Copyright(C) 2018 Isuzu Motors Limited All rights reserved Contents Ⅰ. President and Representative Director : Masanori Katayama :FY2019
FY2019 H1 Financial Results November 2, 2018 ISUZU MOTORS LIMITED 1 Copyright(C) 2018 Isuzu Motors Limited All rights reserved Contents Ⅰ. President and Representative Director : Masanori Katayama :FY2019
Earnings conference call. Q4 and Full year 2015
 Earnings conference call Q4 and Full year 2015 Bo Annvik, CEO / Åke Bengtsson, CFO 11 February 2016 1 Agenda Business Highlights Market Update Sales Financials Outlook 2 2015 in numbers Operating margin
2Q06 Results. Investor Relations
 2Q06 Results Investor Relations Content 1. 2Q06 Key Results 2. Summarized Income Statement 3. Balance Sheet as of Jun. 2006 4. Outlook for 2006 5. Result & Outlook By Division Appendix : 2Q06 Results Breakdown
Oil Refineries Ltd. Fourth Quarter and Full Year 2011 Results. March 2012
 Oil Refineries Ltd. Fourth Quarter and Full Year 21 Results March 22 1 Disclaimer This presentation has been prepared by Oil Refineries Ltd. (the "Company") as a general presentation of the Company and
Performing In A Volatile Oil Market
 Performing In A Volatile Oil Market Matti Lehmus Executive Vice President, Oil Products Capital Markets Day Key Trends Impacting Refining Margins Demand growth to resume after steep drop Supply growth
FISCAL YEAR MARCH 2018 THIRD QUARTER FINANCIAL RESULTS
 FISCAL YEAR MARCH 2018 THIRD QUARTER FINANCIAL RESULTS PRESENTATION OUTLINE Highlights Fiscal Year March 2018 Nine Month Results Fiscal Year March 2018 Full Year Forecast Progress of Key Initiatives 1
Recent Developments in EU Refining and in the Supply and Trade of Petroleum Products
 Recent Developments in EU Refining and in the Supply and Trade of Petroleum Products Third Meeting of the EU Refining Forum Brussels, 22 May 2014 Toril Bosoni, International Energy Agency OECD/IEA 2014
Report for Q Mr. Tom Erixon President and CEO Alfa Laval Group.
 Report for Q3 2018 Mr. Tom Erixon President and CEO Alfa Laval Group Key figures July September 2018 Orders received grew 35% to SEK 11,357 million. Net sales increased 24% to SEK 10,131 million. Adjusted
Implications Across the Supply Chain. Prepared for Sustainableshipping Conference San Francisco 30 September 2009
 Implications Across the Supply Chain Prepared for Sustainableshipping Conference San Francisco 30 September 2009 Agenda Residual Markets & Quality Refinery Bunker Production Supply & Pricing 2 World marine
Market Report Series: Oil 2018 Analysis & Forecasts to Energy Community 10 th Oil Forum, Belgrade, 25 September 2018
 Market Report Series: Oil 218 Analysis & Forecasts to 223 Energy Community 1 th Oil Forum, Belgrade, 25 September 218 Short term update: crude prices (excl. WTI) up strongly Aug/Sep $/bbl 8 Benchmark Crude
Marine Money - Odfjell SE. Leveraging an industrial platform to outperform the cycle
 Marine Money - Odfjell SE Leveraging an industrial platform to outperform the cycle Odfjell SE - Key facts Established in 1914 Listed on Oslo Stock Exchange since 1986 One of the worlds largest operator
The Changing Face of Global Refining
 The Changing Face of Global Refining OPIS National Supply Summit Las Vegas, Nevada October 24-26, 2010 John B. O Brien, Executive Chairman Baker & O Brien, Inc. All rights reserved. The Changing Face of
3Q 2016 Analyst Presentation
 3Q 2016 Analyst Presentation November 18, 2016 This presentation includes forward-looking statements. Actual future conditions (including economic conditions, energy demand, and energy supply) could differ
Recent Developments in EU Refining and in the Supply and Trade of Petroleum Products
 Recent Developments in EU Refining and in the Supply and Trade of Petroleum Products Second Meeting of the EU Refining Forum Brussels, 27 November 2013 Toril Bosoni, International Energy Agency OECD/IEA
282m 75% +575m. Net sales Operating income before non-recurring items. Operating margin before non-recurring items. Net Loss.
 First-Half 2009 Financial Highlights Net sales Operating income before non-recurring items Operating margin before non-recurring items Net Loss Net debt-to-equity ratio Free cash flow** 7,134m 282m 4.0%
Tankerska Next Generation May 2017
 Tankerska Next Generation May 2017 1 T N G Disclaimer This presentation includes certain statements regarding Tankerska Next Generation Inc. ( TNG ) which are not historical facts and are forward-looking
Months Investor Presentation
 2018 9 Months Investor Presentation 25.10.2018 Disclaimer Ereğli Demir Çelik Fabrikaları T.A.Ş. (Erdemir) may, when necessary, make written or verbal announcements about forward-looking information, expectations,
ZF posts record sales in 2017; announces increased research and development activities
 Page 1/5, March 22, 2018 ZF posts record sales in 2017; announces increased research and development activities ZF chief executive officer announces further expansion of research and development activities