Circumnavigation HELM PwC Economy of the Sea Barometer (World)
|
|
|
- Lily Hodge
- 5 years ago
- Views:
Transcription

1 HELM PwC Economy of the Sea Barometer (World) In-depth HELM December 2016 Edition nº2
2 2
3 We've explored very little of the ocean. We really don't know what's out there. But people think we've figured it all out. Philippe Cousteau. Jr. 3
4 This communication is of informative nature and intended for general purposes only. It does not address any particular person or entity nor does it relate to any specific situation or circumstance. PwC will not accept any responsibility arising from reliance on information hereby transmitted. which is not intended to be a substitute for specific professional business advice. 4
5 Index Introduction 7 Executive summary International context Maritime transport. ports and logistics Shipbuilding, maintenance and equipment Offshore energy Naval security power, piracy and maritime disasters (oil spills) Fishing and aquaculture Entertainment, sports, tourism and culture 97 Economy of the sea map List of Tables, Figures and Acronyms
6 : Edition nº2 - December 2016 is a PwC social responsibility and thought leadership initiative that includes three documents: - : Summary - : In-depth - Economy of the Sea Map The economy of the sea is an integrated approach to sea activities with the aim to promote growth and development in a sustainable way. Please see PwC social responsibility and thought leadership projects about the economy of the sea in 6
7 Introduction 7
8 8
9 Introduction The sea is a valuable global asset that needs to be preserved and valorised. Only with greater knowledge and an integrated view of this extensive resource are we able to ensure development in line with the principles of environmental, economic and social sustainability of marine resources. PwC s social responsibility project,, systematises, in a summarised form, quantitative information on various industries of the sea, enabling the identification of trends of ocean-related industries, and rankings, overlapped on a world map, to help identify the intensity of ocean use in every region of the world. The results of this exercise are clear. In the period 2005 to 2015, in which there was a profound financial and economic crisis on a global scale, during which time Asia - and in particular the China - took the lead in fisheries, aquaculture, cargo handling at ports and shipbuilding. The world's top 10 container ports are in Asia and seven of these are in China. In 2015, Chinese fisheries and aquaculture represented, respectively, 18.2% and 61.7% of total world output of these sectors. Only in the production of offshore energy, the ownership and operation of merchant ships, tourism (cruise) and sports does America and Europe remain ahead of Asia. Africa and South America are regions that will yet reveal important future economy of the sea opportunities. Australia and New Zealand, in particular, are references for the economy of the sea in Oceania and in the World. This period was also one of increased environmental stress (particularly oil spills) and sea piracy (more than 4,000 people were subjected to maritime piracy attacks, more than 3,500 were taken hostage and 28 were killed - Somalia, Nigeria and Indonesia are countries with the greatest incidence of attacks). As for the defence industry the United States of America, China and Russia are the three main naval powers. The five principal oceans: the Atlantic Ocean, the Indian Ocean, the Pacific Ocean, the Arctic Ocean and the Southern Ocean, together with the other seas of the world, are valuable assets that should be enjoyed by mankind sustainably. Several industries operate in or on this huge natural resource, producing wealth and generating jobs. In order to exploit all this wealth sustainably, it is essential to understand it better, becoming familiar with each of the industries, how they interact with each other, their evolution and how intensively they use the sea around the world. The is a contribution of reference about the economy of the sea in the world. It may be also seen as a voyage around the world in which the key countries for each sea industry are identified, this is why this publication has been entitled. José Bernardo Territory Senior Partner (Portugal) Miguel Marques Economy of the Sea Partner Stephanie Hyde Global Middle Market Leader Ricardo Frederico Correia Economy of the Sea Senior Manager 9
10 10
11 Executive summary 11
12 Executive summary The in-depth has two parts: 1. A summary of quantitative information on various subsectors that make up the economy of the sea in the world, including trend analysis and a number of rankings of countries by industry; 2. An economy of the sea map made by overlapping different rankings of countries by industry on a map of the world; The economy of the sea is a significant part of the world economy and, as such, is affected by the general evolution of macroeconomics. Taking into account growth rates of the various countries, it may be said that recent years have not been easy. In particular, the year 2009 was a particularly negative year in which the growth rate of global gross national product was negative (-2.1%), and the major contributors to this poor result were the developed economies (their gross domestic product fell in the order of -3.7%). In 2009, the low growth rate of gross domestic product in developing countries (+ 2.6%) was not enough to offset the negative growth in developed countries. The high growth rates of GDP recorded in 2007 (4.0%) have not yet been restored; the growth rate in 2014 and projected to 2015 was a mere 2.5%. 12
13 Executive summary Maritime transport, ports and logistics Recent years have been years of slowdown in global economic growth, which have negatively impacted the growth rate of the volume of exports and imports. As most of the load volume is transported by sea, the maritime transport sector has been considerably affected. Although oil and gas, as well as bulk, are the load types most transported by sea, containerized cargo has been growing. Between 2006 and 2014 there was a change in the relative importance of maritime trade in developed economies compared to developing economies. In 2006, developed economies accounted for approximately 53% of the tonnage of cargo transported by sea, a figure which fell to 38% in However, the share of developing economies in 2006 was 46% and increased to 61 % in This was primarily because Europe dropped from 54% in 2006 to 39% in 2014, while Asia rose from a 37% in 2006 to 50% in Between 1980 and 2014, bulk shipping and container shipping have gained weight compared to oil tankers and general load. Greece, Japan, China and Germany have the greatest concentration of ship ownership. Switzerland, Denmark, France, China and Tawain are the countries where the headquarters of the leading transportation companies are primarily located. Panama, Liberia, The Marshall Islands, China and Singapore are the countries with largest ship registers. The world's ten largest container ports are Asian, and seven of these are Chinese. The world s five largest operators of ports have their headquarters in Unitied Arab Emirates or China. 13
14 Executive summary Shipbuilding, maintenance and equipment The order backlog in global shipyards grew between 2002 and 2008; thereafter, orders decreased until However, for the following three years (2012, 2013 and 2014), this trend has been reversed. At the end of 2015, 39.6% of ship orders were for solid bulk transport ships, immediately followed by orders for tankers for the transport of crude oil (27.7%). In 2015, China had the highest volume of orders for ships (36.4%), followed by South Korea (26.7%) and Japan (19%). In fourth place appears the European Union 28+Norway (7.9%). In 2015, Asia (China, South Korea and Japan), completed more than 80% of the production of ships in that year (35.4%, 31.2% and 18.1% respectively). Ship production capacity drastically reduced in Europe 28 + Norway, but increased exponentially in China. China, India, Bangladesh and Pakistan were the locations where there was the most dismantling of bulk volume ships. Offshore energy In 2004, after the Middle East and North America and, Europe was the third largest oil and natural gas producing region of the world. By 2015, Europe had been relegated to 4th place; the Middle East continued to lead production, followed by South then North America. In 2015, more than half of the world's proven gas reserves belonged to Iran and the Russian Federation. Saudi Arabia, Norway and Qatar were the three main producers of offshore oil & gas, in Since late 2014, the price of a barrel of Brent oil has been below 100 USD; in mid 2016, the price was slightly above 40 USD. The oil price decline has put pressure on the profitability of offshore operations, which are more expensive than onshore operations. Offshore wind power capacity in the world is led by four European countries (UK, Denmark and Germany), representing 79.6% of total installed capacity in the world. In fourth place, China represents 8.4% of capacity. 14
15 Executive summary Naval security power, piracy and maritime disasters (oil spills) In 2016, the country with the largest naval fleet (aircraft carriers, frigates, destroyers, corvettes and submarines) is the China with 175, closely followed by US with 162. Russia is the third with 161 large naval craft. Somalia, Nigeria and Indonesia are countries with the greatest incidence of maritime piracy attacks in the period Between 2010 and 2015, about 4,000 people were subjected to maritime piracy attacks, more than 3,500 were taken hostage and 28 were killed. Accidents involving oil spills have been occurring over time, all over the world. Fishing and aquaculture Between 2002 and 2014, as the world population has grown, there has been an increase in the consumption of fish and other food products per capita. In 2004, per capita consumption was 16.2 kg, rising to a per capita consumption of 20.1 kg in This increase in per capita consumption was met by increased production in aquaculture. In 2004, production in onshore and offshore aquaculture reached about 27,8 and 18,1 million tons, respectively, rising to 47,1 and 26,7 million tons in Fish catches at sea continue to represent the largest contribution to the supply of fish, but have not grown in recent years. The top ten countries in terms of fishing, led by China with 18.2% of the catch, represent about 60% of the total of global fishing. The Pacific Ocean is where most of the fishing takes place, accounting for about 58% of the total. The fifteen species most fished represent about 1/3 of all fish caught. In 2014, 91% of world aquaculture was in Asia, and was responsible for the significant growth of aquaculture globally. Onshore aquaculture is the main contributor to the growth of aquaculture and China represents 61.7% of global aquaculture production. From 1974 to 2013, there was increasing pressure on fish stocks, significantly increasing the number of species that are in danger of overfishing. Africa and Latin America are the regions of the world with the lowest per capita consumption of fish and other sea products. 15
16 Executive summary Entertainment, sports, tourism and culture The revenue associated with cruise ships has been increasing. North America and Europe are the most important markets for cruise ships. The Caribbean still holds the largest market share in the business of cruise ships, closely followed by the Mediterranean and the rest of Europe. The number of people participating in cruises has increased. The largest cruise consumers are North Americans, immediately followed by the British and the Germans. The USA, Australia, New Zealand, Italy, France and the UK are countries of reference in terms of the recreational boating and marinas business. In the last four Olympic Games, Europe was the continent with more medals in canoeing, with Germany as the country that led with 32 medals. In sailing, while European countries, led by the UK, continue well classified, winning 19 medals at the last three Olympic Games, Australia appears in second place in the ranking with 11 medals. In rowing, the United Kingdom leads with 24 medals, soon followed by Australia (15) and New Zealand and Germany (both 12). In surfing, Australia and USA have led consistently in recent years. 16
17 17
18 18
19 HELM PwC Economy of the Sea Barometer (World) 19
20 HELM PwC Economy of the Sea Barometer (World) More than 2/3 of the surface area of our planet is sea. The five principal oceans: the Atlantic Ocean, the Indian Ocean, the Pacific Ocean, the Arctic Ocean and the Southern Ocean, and the other of seas of the world, are valuable assets that should be enjoyed by mankind sustainably. Several industries operate in or on this huge natural resource, producing wealth and generating jobs. In order to enhance all this wealth in a sustainable way, it is essential to understand it better, becoming familiar with each of the industries, and how they interact with each other, their evolution and how intensively they use the sea around the world. The concept of Economy of the Sea is related to the valorisation of the ocean in environmental, social and economic terms, with the aim to achieve a holistic view of all human action on sea. It includes industries like maritime transport, ports and logistics, shipbuilding, ship maintenance and repair, offshore energy, security and defence, fisheries and aquaculture, entertainment, sport, tourism and leisure. Learning more about the oceans, also means learning more about maritime industries, in particular, it is crucial to quantify their economic development in each region. There has been some quantitative information by industry, but there are few studies that quantify the economic development of all the industries related with the sea. With, we intend to build a tool that allows us to clarify the current situation in respect of the sea as a resource in the world, as well as its development prospects in the future. The HELM is meant to be a monitoring tool that allows its users to draw useful information, easily and quickly. The HELM is a long-term project, which will act as a compilation of data for monitoring, over time, the evolution of the economy of the sea in the world and simultaneously enable us to analyse trends and the choices that are made by the various economic agents. Several efforts have been made by various entities in order to quantitatively evaluate the importance of the economy of the sea. Progress has been made; however, the weight of economic activities related to the sea in total world economy remains difficult to measure and evaluate. The indicators do not allow us to measure with complete accuracy or continuously, the actual impact of these activities in the global economy. 20
21 HELM PwC Economy of the Sea Barometer (World) The has two parts: 1. A summary of quantitative information on various subsectors that make up the economy of the sea in the world, including trend analysis and a number of rankings of countries by industry; 2. An economy of the sea map made by overlapping different rankings of countries by industry on a map of the world. Sea industries considered Relevant sub-sectors within the sea economy of the world considered in summary quantitative information: - Maritime transport, ports and logistics; - Shipbuilding, ship repair and maintenance; - Offshore energy; - Security and defence; - Fishing and aquaculture; - Entertainment, sport, tourism and leisure. There is another set of sub-sectors, such as offshore mineral resources and blue biotechnology that, although reveal a huge potential, will still take some time to gain importance in the global economy. Rankings Taking into account the existing quantitative information and respective representation that the variable has on the industry analysis, the following variables were selected for the preparation of rankings considered in the Economy of the Sea Map: - Ownership of the world fleet (top countries) - Top container terminals - Shipbuilding completions (top countries) - Offshore oil & gas production (top countries) - Offshore wind capacity (top countries) - Aircraft Carriers + Frigates + Destroyers + Corvettes + Submarines (top countries) - Pirate attacks locations - Marine capture fisheries (top countries) - Aquaculture (top countries) - Cruises (top markets) - Olympic medals in sailing(top countries) - Commercial shipping trading track with the highest traffic 21
22 HELM PwC Economy of the Sea Barometer (World) Update of the quantitative information As mentioned above, quantification and measurement of the economy of the sea remains difficult. However, as time goes by, new sources of information appear and new reliable indicators may be used. In this context, every year we do a careful review of all the variables that compose the quantitative summary information and update it with relevant information, which has since become available. Similarly, every year, reconfirm that the comparative data of information sources quantitative information summary remain stable. In case of restatement, by the issuer, we proceed to the respective update summary quantitative information. 22
23 23
24 24
25 International context 25
26 International context Exclusive Economic Zones Countries with the largest exclusive economic zones have a bigger potential to have benefits from the oceans. Below is presented the ranking of the 25 countries with the largest exclusive economic zones. Table 1: Top 25 Exclusive Economic Zones (in millions of square kilometers), 2016 EEZ (Millions of Km2) USA 12.2 Federated States of Micronesia 3.0 France 10.1 Denmark 2.6 Australia 9.1 Norway 2.4 Russia 7.6 Papua New Guinea 2.4 United Kingdom 6.8 India 2.3 Indonesia 6.0 Marshall Islands 2.0 Canada 5.7 Philippines 1.8 New Zealand 4.1 Portugal 1.7 Japan 4.0 Solomon Islands 1.6 Brazil 3.7 South Africa 1.5 Chile 3.7 Mauritius 1.3 Kiribati 3.5 Seychelles 1.3 Mexico 3.3 Source: Marineregions.org 26
27 International context World Economic Growth The economy of the sea is a significant part of the world economy and. as such, is affected by the general evolution of macroeconomics. Taking into account growth rates of the various countries, it may be said that recent years have not been easy. In particular, the year 2009 was a particularly negative year in which the growth rate of global gross national product was negative (-2.1%). and the major contributors to this poor result were the developed economies (their gross domestic product fell in the order of -3.7%). In 2009, the low growth rate of gross domestic product in developing countries (+ 2.6%) was not enough to offset the negative growth in developed countries. The high growth rates of GDP recorded in 2007 (4.0%) have not yet been restored; the growth rate in 2014 and projected to 2015 was a mere 2.5%. Table 2: World GDP growth, (Annual percentage change) Region/country ª World 4.0% 1.5% -2.1% 4.1% 2.8% 2.2% 2.4% 2.5% 2.5% a Developed countries 2.5% 0.1% -3.7% 2.6% 1.5% 1.1% 1.3% 1.6% 1.9% of which: Japan 2.2% -1.0% -5.5% 4.7% -0.5% 1.7% 1.6% -0.1% 0.9% United States 1.8% -0.3% -2.8% 2.5% 1.6% 2.3% 2.2% 2.4% 2.3% European Union (EU-28) 3.0% 0.5% -4.4% 2.1% 1.8% -0.5% 0.1% 1.3% 1.7% South-East Europe and CIS 8.7% 5.4% -6.6% 4.7% 4.6% 3.3% 2.0% 0.9% -2.6% South-East Europe b 6.2% 5.8% -1.8% 1.5% 1.7% -0.6% 2.4% 0.7% 1.5% CIS. incl. Georgia 8.9% 5.3% -6.8% 4.9% 4.7% 3.5% 2.0% 0.9% -2.8% of which: Russian Federation 8.5% 5.2% -7.8% 4.5% 4.3% 3.4% 1.3% 0.6% -3.5% Developing countries 8.0% 5.3% 2.6% 7.8% 5.8% 4.7% 4.8% 4.5% 4.1% Africa 6.1% 5.5% 3.0% 5.1% 0.9% 5.1% 3.8% 3.4% 3.2% Latin America and the Caribbean 5.6% 3.6% -1.6% 5.8% 4.7% 3.2% 2.8% 1.4% 0.8% Asia 9.2% 5.9% 4.1% 8.8% 6.9% 5.1% 5.6% 5.6% 5.2% of which: China 14.2% 9.6% 9.2% 10.4% 9.3% 7.7% 7.7% 7.4% 6.9% India 10.1% 6.2% 5.0% 11.0% 6.2% 4.4% 6.4% 7.1% 7.5% Oceania 4.1% 2.1% 1.0% 3.5% 4.4% 3.2% 2.8% 3.3% 5.3% Note: Calculations for country aggregates are based on GDP at constant 2005 dollars. a) Forecasts. b) Albania. Bosnia and Herzegovina. Montenegro. Serbia and the former Yugoslav Republic of Macedonia. Source: UNCTAD Trade and Development Report
28 28
29 Maritime transport, ports and logistics 29
30 Maritime transport, ports and logistics Recent years have seen a slowdown in global economic growth, which resulted in a fall in the growth rate of export volume and import volumes. As shown in the table below, the growth rate of export volume in the world in 2010 was 13.9%. falling to 2.3% in The same goes in the growth rate of the import volume in the world: in 2010, it was 13.8%; by 2014, it was 2.3%. This decline in the growth rate of exports and imports affected all developed countries and all developing countries. Table 3: Growth in the volume of merchandise trade, (Annual percentage change) Exports Imports Countries/regions % 5.5% 2.0% 2.6% 2.3% World 13.8% 5.4% 2.0% 2.3% 2.3% 12.9% 4.9% 0.6% 1.4% 2.0% Developed economies 10.8% 3.4% -0.4% -0.3% a 3.2% of which: 11.6% 5.5% -0.1% 1.7% 1.5% European Union (EU-28) 9.4% 2.8% -2.5% -0.9% 2.8% 27.5% -0.6% -1.0% -1.9% 0.6% Japan 10.1% 4.2% 3.8% 0.5% 2.8% 15.4% 7.2% 3.9% 2.6% 3.1% United States 14.8% 3.8% 2.8% 0.8% 4.7% 16.0% 6.7% 4.0% 4.2% 2.9% Developing economies 18.5% 7.7% 5.1% 6.1% 2.0% of which: 10.3% -6.8% 5.5% -2.0% -3.6% Africa 6.5% 3.9% 13.2% 5.2% 3.3% 8.1% 5.1% 3.2% 2.1% 2.4% Developing America 22.3% 11.3% 3.3% 4.0% 0.6% 18.2% 8.5% 4.0% 5.2% 3.5% Asia 19.3% 7.3% 7.7% 6.6% 2.2% of which: 29.5% 13.4% 6.2% 7.7% 6.8% China 25.0% 10.7% 3.6% 9.9% 3.9% 14.0% 15.0% -1.8% 8.5% 3.2% India 13.8% 9.7% 5.9% -0.2% 3.2% 4.2% 9.1% 9.6% 3.1% 0.3% Western Asia 8.6% 8.2% 9.2% 9.6% 0.2% 11.4% 4.1% 0.7% 1.8% 0.2% Transition economies 17.6% 16.8% 5.6% -0.8% -8.5% Note: Data on trade volumes are derived from international merchandise trade values deflated by UNCTAD unit value indices. Source: UNCTAD - Review of Maritime Transport
31 Maritime transport, ports and logistics Most of the load volume is transported by sea and. Consequently, the maritime transport sector was impacted by slowing growth of exports and imports globally. Although oil and gas, as well as bulk, are the load types most transported by sea, containerized cargo has been growing. Table 4: International seaborne trade, selected years (Millions of tons loaded) Year Container Other dry cargo Five major bulks Oil and gas , , , , , ,125 1,105 2, ,928 1,295 2, ,009 1,709 2,422a ,076 2,112 1,814 2, ,193 2,141 1,953 2, ,249 2,173 2,065 2, ,127 2,004 2,085 2, ,280 2,022 2,335 2, ,393 2,112 2,486 2, ,464 2,150 2,742 2, ,544 2,218 2,923 2, ,631 2,272 3,112 2,826 Source: UNCTAD - Review of Maritime Transport 2015 Figure 1: International seaborne trade. selected years (Millions of tons loaded) 12,000 10,000 8,000 6,000 4,000 Oil and gas Five major bulks Other dry cargo Container 2,
32 Maritime transport, ports and logistics Between 2006 and 2014 there was a change in the relative importance of maritime trade in developed economies compared to developing economies. In developed economies accounted for approximately 53% of the tonnage of cargo transported by sea. a figure which fell to 38% in However. the share of developing economies in 2006 was 46% and increased to 61 % in This was primarily because Europe dropped from 54% in 2006 to 39% in while Asia rose from a 37% in 2006 to 50% in Table 5: World seaborne trade in by type of cargo. country group and region (Millions of tons) Goods unloaded (Millions of tons) Region/country Year Total Crude Petroleum products and gas Dry cargo Share of the total World Developed economies Transition economies Developing economies Africa America Asia Europe Oceania ,878 1, , % ,808 1,862 1,123 6, % ,165 1, ,348 53% , ,206 38% % % , ,644 46% , ,550 61% % % % % , ,105 37% , ,737 50% ,235 1, ,409 54% , ,274 39% % % a Source: UNCTAD - Review of Maritime Transport
33 Maritime transport, ports and logistics The largest consumers of oil and natural gas worldwide are East Asia and North America. Table 6: Major producers and consumers of oil and natural gas (Percentage world market share) World oil production World oil consumption Western Asia 32% Asia Pacific 34% North America 18% North America 22% Transition economies 16% Europe 15% Developing America 12% Developing America 10% Africa 9% Western Asia 9% Asia Pacific 9% Transition economies 5% Europe 3% Africa 4% a World natural gas production World natural gas consumption North America 26% North America 26% Transition economies 22% Asia Pacific 20% Western Asia 17% Transition economies 17% Asia Pacific 15% Western Asia 14% Europe 7% Europe 13% Developing America 7% Developing America 8% Africa 6% Africa 4% Note: Oil includes crude oil. shale oil. oil sands and natural gas liquids. The term excludes liquid fuels from other sources such as biomass and coal derivatives. Source: UNCTAD - Review of Maritime Transport
34 Maritime transport, ports and logistics At a global level, shipping containers have increased a lot; however, with the 2009 global crisis and a decrease of world gross domestic product, there was a negative growth of containerization in that year. Figure 2: Global containerized trade, (Millions of TEUs and percentage annual change) Million TEUs (left) Percentage annual change (right) Source: UNCTAD - Review of Maritime Transport
35 Maritime transport, ports and logistics In terms of container transport, the transatlantic route in 2014 represented about 3.8% of total TEU s transported, while the transpacific route accounted for about 13.4%. Table 7: Distribution of global containerized trade by route, (Millions of TEUs) Year Intraregional & South-South North-South Trans-Pacific Far East- Europe (Millions of TEUs) Secondary East-West Transatlantic Source: UNCTAD - Review of Maritime Transport 2014 Figure 3: Distribution of global containerized trade by route, (Millions of TEUs) Intraregional & South-South North-South Trans-Pacific Far East-Europe Secondary East-West Transatlantic
36 Maritime transport, ports and logistics Asia, and particularly China, is the main importer of steel, iron, coal and grain, while the American Continent and Australia are the main exporters of these strategic products. Table 8: Some major dry bulks and steel: Main producers, users, exporters and importers, 2014 (Percentage world market share) Steel producers % Steel users % China 50% China 46% Japan 7% United States 7% United States 7% India 5% India 5% Japan 4% Russian Federation 4% Republic of Korea 4% Republic of Korea 4% Russian Federation 3% Germany 3% Transition economies 3% Turkey 2% Germany 3% Brazil 2% Turkey 2% Ukraine 2% Mexico 1% Other 15% Other 22% Iron ore exporters % Iron ore importers % Australia 54% China 68% Brazil 25% Japan 10% South Africa 5% Europe 9% Canada 3% Republic of Korea 6% Sweden 2% Other 7% Other 12% Coal exporters % Coal importers % Indonesia 34% China 20% Australia 31% Europe 19% Russian Federation 9% India 18% Colombia 6% Japan 15% South Africa 6% Republic of Korea 11% Canada 3% Taiwan 5% Other 12% Malaysia 2% Thailand 2% Other 9% Grain exporters % Grain importers % United States 26% Asia 33% European Union 14% Africa 21% Ukraine 10% Developing America 20% Canada 9% Western Asia 19% Argentina 8% Europe 5% Russia Federation 8% Transition economies 2% Others 25% Source: UNCTAD - Review of Maritime Transport
37 Maritime transport, ports and logistics From 1980 to 2015 bulk ship and containers have gained relative weight compared to oil and general load tankers. Table 9: World fleet by principal vessel types, (Beginning-of-year figures. percentage share of dwt) Year Other Container General cargo Dry bulk Oil tanker % 1.6% 17.0% 27.2% 49.7% % 3.9% 15.6% 35.6% 37.4% % 8.0% 12.7% 34.6% 35.4% % 13.3% 8.5% 35.8% 35.3% % 12.8% 4.6% 43.1% 28.6% % 13.0% 4.4% 43.5% 28.0% Note: All propelled seagoing merchant vessels of 100 GT and above. excluding inland waterway vessels. fishing vessels. military vessels. yachts. and offshore fixed and mobile platforms and barges (with the exception of FPSOs and drill ships). Source: UNCTAD - Review of Maritime Transport 2015 Figure 4: World fleet by principal vessel types, (Beginning-of-year figures. percentage share of dwt) 100% 90% 80% 70% 60% 50% 40% 30% Oil tanker Dry bulk General cargo Container Other 20% 10% 0%
38 Maritime transport, ports and logistics Greece, Japan, China and Germany are the countries with the highest concentration of ship ownership. Table 10: Ownership of the world fleet. as of 1 January 2015 (dwt and nº of ships) Dead-weight tonnage (thousand dwt) Beneficial Owner Location ª Number of ships Greece 279,429 4,017 Japan 230,675 3,986 China 157,557 4,966 Germany 122,035 3,532 Singapore 84,022 2,356 Republic of Korea 80,181 1,618 Hong Kong SAR (China) 75,321 1,258 United States 60,263 1,972 United Kingdom 48,381 1,227 Norway 46,370 1,857 Taiwan 45, Bermuda 42, Denmark 36, Turkey 27,687 1,530 Monaco 23, Italy 22, India 21, Brazil 20, Belgium 20, Russian Federation 18,324 1,739 Iran (Islamic Republic of) 18, Note: Vessels of GT and above. a Beneficial ownership location indicates the country/economy in which the company that has the main commercial responsibility for the vessel is located. Source: UNCTAD - Review of Maritime Transport 2015 Ranking included in the economy of the sea map. 38
39 Maritime transport, ports and logistics Denmark, Switzerland, France, Taiwan, China and Germany are the countries where the headquarters of the leading transportation companies are primarily located. Table 11: The 20 leading liner companies (headquarters country), 1 January 2015 (Number of ships and total shipboard capacity deployed. in TEUs. ranked by TEU) Ranking Headquarters Vessels TEU Denmark ,505,935 2,526,490 2 Switzerland ,609,181 2,483,979 3 France ,508,007 1,502,417 4 Taiwan ,102, ,280 5 China , ,171 6 China , ,507 7 Germany , ,656 8 Republic of Korea , ,490 9 Japan , , Singapore , , China , , Germany , , Japan , , Taiwan , , Republic of Korea , , Japan , , Singapore , , United Arab Emirates , , Israel , , Chile , ,567 Note: Includes all container-carrying ships known to be operated by liner shipping companies. Source: UNCTAD - Review of Maritime Transport
40 Maritime transport, ports and logistics Panama, Liberia, The Marshall Islands, China and Singapore are the countries with largest ship registers. Table 12: The 20 flags of registration with the largest registered fleets. as of 1 January 2015 (dwt) Flag of registration Number of ships Dead-weight tonnage (thousand dwt) Per cent of world total (dwt) Panama 7,068 8, , , % 20.1% Liberia 3,126 3, , , % 11.7% Marshall Islands 2,207 2, , , % 10% Hong Kong SAR, China 2,065 2, , , % 8.6% Singapore 2,318 3, , , % 6.6% Malta 1,698 1,895 72,935 82, % 4.7% Greece 883 1,484 77,078 78, % 4.5% Bahamas 1,327 1,421 74,874 75, % 4.3% China 2,802 3,941 73,522 75, % 4.3% Cyprus 937 1,629 32,594 33, % 1.9% Isle of Man 409 1,079 23,711 23, % 1.3% Japan 766 5,224 17,915 22, % 1.3% Norway 531 1,558 18,221 20, % 1.2% Italy 719 1,418 20,022 17, % 1% United Kingdom 658 1,865 18,805 17, % 1% Republic of Korea ,881 16, % 1% Denmark 381 7,373 14,371 16, % 1% Indonesia 1,609 1,604 13,846 15, % 0.9% India 702 1,174 15,245 15, % 0.9% Antigua and Barbuda 1, ,391 12, % 0.7% Rest of the world 15,411 36, , , % 13% Total World 47,601 89,464 1,676,853 1,749, % 100.0% Note: Propelled seagoing merchant vessels of GT and above; ranked by dead-weight tonnage. For a complete list of all countries for ships of 100 GT and above see NIS: Norwegian International Ship Register; DIS: Danish International Ship Register. Source: UNCTAD - Review of Maritime Transport
41 Maritime transport, ports and logistics Most ship owners register their ships in different location from the country where they are located, looking for better conditions. Figure 5: Top 20 ship owning nations. beneficial ownership, 1 January 2015 (1.000 dwt. by country/economy of ownership) 300, , , ,000 Foreign flag National flag 100,000 50,
42 Maritime transport, ports and logistics Most ships are registered in developing countries. Table 13: Distribution of dwt capacity of vessel types, by country group of registration, January 2015 (Beginning-of-year figures, per cent of dwt) Total fleet Oil tankers Bulk carriers General cargo Container ships Others World total 100% 100% 100% 100% 100% 100% Developed countries 22.70% 26.26% 17.82% 28.38% 26.81% 25.75% Countries with economies in transition 0.71% 0.78% 0.26% 5.35% 0.03% 1.22% Developing countries 76.36% 72.91% 81.90% 65.41% 73.14% 71.45% of which: Africa 13.14% 17.18% 9.98% 5.96% 20.19% 9.93% America 26.74% 20.68% 31.93% 22.57% 19.75% 31.53% Asia 26.05% 21.46% 29.46% 33.92% 28.00% 18.92% Oceania 10.42% 13.60% 10.53% 2.95% 5.20% 11.07% Unknown and other 0.24% 0.05% 0.01% 0.86% 0.02% 1.57% Note: Propelled seagoing merchant vessels of 100 GT and above. Source: UNCTAD - Review of Maritime Transport
43 Maritime transport, ports and logistics The years 2009, 2011, 2013 and 2014 were years of decline in freight prices. Table 14: Container freight markets and rates Trans-Pacific Freight markets a ($ per FEU) Shanghai - United States West Coast 1,372 2,308 1,667 2,287 2,033 1,970 Percentage change 68% -28% 37% -11% -3% Shanghai - United States East Coast 2,367 3,499 3,008 3,416 3,290 3,720 Percentage change 48% -14% 14% -4% 13% Far East-Europe ($ per TEU) Shanghai - Northern Europe 1,395 1, ,353 1,084 1,161 Percentage change 28% -51% 54% -20% 7% Shanghai-Mediterranean 1,397 1, ,336 1,151 1,253 Percentage change 24% -44% 37% -14% 9% North-South ($ per TEU) Shanghai-South America (Santos) 2,429 2,236 1,483 1,771 1,380 1,103 Percentage change -8% -34% 19% -22% -20% Shanghai-Australia/New Zealand (Melbourne) 1,500 1, Percentage change -21% -35% 20% -12% -17% Shanghai-West Africa (Lagos) 2,247 2,305 1,908 2,092 1,927 1,838 Percentage change 3% -17% 10% -8% -5% Shanghai-South Africa (Durban) 1,495 1, , Percentage change -1% -33% 6% -23% -6% Intra-Asian ($ per TEU) Shanghai-South-East Asia (Singapore) Percentage change -34% 22% -10% 1% Shanghai-East Japan Percentage change 7% 2% 0% -21% Shanghai-Republic of Korea Percentage change 3% -8% 8% -5% Shanghai-Hong Kong (China) Percentage change 34% -15% -35% -24% Shanghai-Persian Gulf (Dubai) Percentage change 44% -9% 17% -21% 6% Note: Data based on yearly averages. FEU: 40-foot equivalent unit. Source: UNCTAD - Review of Maritime Transport
44 Maritime transport, ports and logistics In the period , the supply of transport in containers always grew; however, in 2009, the demand decreased. The growth in demand after 2009, on average, is lower than the growth in demand before Table 15: Growth of demand and supply in container shipping (Annual growth rates) Year Demand Supply % 7.8% % 8.5% % 8.0% % 8.0% % 8.0% % 10.5% % 13.6% % 11.8% % 10.8% % 4.9% % 8.3% % 6.8% % 4.9% % 5.0% % 5.0% 2015 (prevision) 6.5% 6.0% Note: Supply data refer to the total capacity of the container-carrying fleet. including multi-purpose and other vessels with some degree of container carrying capacity. Demand growth is based on million TEU lifts. The data for 2014 are projected figures. Source: UNCTAD - Review of Maritime Transport 2015 Figure 6: Growth of demand and supply in container shipping (Annual growth rates) 15.00% 10.00% 5.00% 0.00% Demand Supply -5.00% % % 44
45 Maritime transport, ports and logistics The Baltic Dry Index is a reference index in the analysis of the price of maritime transport. Figure 7: Baltic Exchange Dry Index, (16 July 2016) (Index base year 1985 = 1,000 points) 2,500 Baltic Exchange Dry Index 2,000 1,500 1, Note: The BDI is a composite of 3 sub-indices. each covering a different carrier size: Capesize. Panamax. and Supramax. Capesize carriers are the largest ships with a capacity greater than DWT. Panamax refers to the maximum size allowed for ships travelling through the Panama Canal. typically DWT. The Supramax Index covers carriers with a capacity of DWT. Source: 45
46 Maritime transport, ports and logistics The world's ten largest container ports are Asian, seven are Chinese. Table 16: Top 20 container terminals and their throughput for 2011, 2012, 2013 and 2014 (Million TEUs and percentage change) Port Name Country Million TEUs Percentage change Percentage share in the world Shanghai China % 5.16% Singapore Singapore % 4.95% Shenzhen China % 3.51% Hong Kong (China) Hong Kong (China) % 3.24% Ningbo China % 2.85% Busan South Korea % 2.73% Guangzhou China % 2.43% Qingdao China % 2.43% Dubai United Arab Emirates % 2.22% Tianjin China % 2.06% Roterdam Netherlands % 1.80% Port Klang Malaysia % 1.59% Kaohsiung Taiwan % 1.55% Dalian China % 1.47% Hamburg Germany % 1.42% Antwerp Belgium % 1.32% Xiamen China % 1.26% Tanjung Pelepas Malaysia % 1.24% Los Angeles United States % 1.21% Jacarta Indonesia % 0.89% Total top % 45.31% Note: In this list Singapore does not include the port of Jurong. Source: UNCTAD - Review of Maritime Transport 2015 Ranking included in the economy of the sea map. 46
47 Maritime transport, ports and logistics The five largest ports operators in the world have their headquarters in United Arab Emirates or China. Table 17: World s leading ports by productivity, 2014 (container moves per ship, per hour on all vessel sizes and percentage increase) Port Country 2012 berth productivity 2013 berth productivity 2014 berth productivity Percentage increase 2013/2012 Percentage increase 2014/2013 Jebel Ali United Arab Emirates % 16% Tianjin China % -4% Qingdao China % -1% Nansha China % 14% Yantian China % 10% Khor al Fakkan United Arab Emirates % -9% Ningbo China % -11% Yokohama Japan % -3% Busan Republic of Korea % -3% Xiamen China % -15% Source: UNCTAD - Review of Maritime Transport
48 48
49 Shipbuilding, maintenance and equipment 49
50 Shipbuilding, maintenance and equipment The order backlog in global shipyards grew between 2002 and 2008; thereafter. orders decreased until However, for the following four years (2012, 2013, 2014 and 2015), this trend has been reversed. Table 18: Summary of activity in World Shipyards (Thousands of CGT) 200,000 Year Order book New orders Completions ,946 20,471 21, ,807 41,705 22, ,800 45,128 25, ,200 39,588 29, ,000 57,315 34, ,740 85,277 34, ,166 42,953 41, ,200 16,554 44, ,013 38,581 51, ,442 30,823 51, ,300 24,713 47, ,900 53,839 38, ,146 45,592 36, ,690 39,354 37,601 Note: CGT - Compensated Gross Tonnage- International unit of measure that facilitates the comparison of different shipyards production regardless of the types of vessel produced. The CGT of a ship is calculated using a table of conversion factors published by OECD. The conversion factors vary with ship type. GT Gross Tonnage; unit of 100 cubic feet or cubic meters. used in arriving at the calculation of gross tonnage. Source: Sea Europe. Shipbuilding Market Monitoring 2015 Figure 8: Summary of activity in World Shipyards (Thousands of CGT) 180, , , , ,000 80,000 Order book New orders Completions 60,000 40,000 20,
51 Shipbuilding, maintenance and equipment The evolution of activity in Chinese shipyards has followed the trend in the shipyards globally, although the growth recorded between 2002 and 2008 was more significant than that in the rest of the world. Table 19: Summary of activity in Chinese shipyards (Thousands of CGT) Year Order book New orders Completions ,943 2,669 1, ,327 5,235 2, ,589 5,691 2, ,629 6,067 4, ,701 13,366 5, ,221 28,925 6, ,011 13,864 9, ,359 7,113 12, ,923 16,102 18, ,878 8,339 19, ,209 8,555 19, ,649 21,402 13, ,641 16,900 11, ,925 13,119 13,326 Source: Sea Europe. Shipbuilding Market Monitoring 2015 Figure 9: Summary of activity in Chinese shipyards (Thousands of CGT) 70,000 60,000 50,000 40,000 30,000 Order book New orders Completions 20,000 10,
52 Shipbuilding, maintenance and equipment Although in general. the activity of South Korean shipyards is below the activity of Chinese shipyards, at the end of 2014, the number of finished ships was very similar. Table 20: Summary of activity in South Korean shipyards (Thousands of CGT) Year Order book New orders Completions ,215 5,663 6, ,368 18,671 7, ,365 15,806 8, ,243 13,960 10, ,544 21,884 11, ,389 32,969 11, ,357 14,780 14, ,576 3,383 14, ,145 11,915 14, ,529 13,615 15, ,517 7,111 13, ,169 17,437 12, ,244 12,588 11, ,257 10,120 11,750 Source: Sea Europe. Shipbuilding Market Monitoring 2015 Figure 10: Summary of activity in South Korean shipyards (Thousands of CGT) 70,000 60,000 50,000 40,000 30,000 Order book New orders Completions 20,000 10,
53 Shipbuilding, maintenance and equipment Japanese shipyards have also seen a recovery in the last four years in terms of order book. Table 21: Summary of activity of Japanese shipyards (Thousands of CGT) Year Order book New orders Completions ,052 7,965 6, ,076 11,779 6, ,113 13,675 7, ,894 8,620 8, ,372 11,193 9, ,714 10,125 8, ,649 7,820 9, ,460 3,877 9, ,836 5,374 9, ,132 4,118 9, ,534 4,396 8, ,615 7,550 7, ,442 10,256 6, ,855 10,222 6,795 Source: Sea Europe. Shipbuilding Market Monitoring 2015 Figure 11: Summary of activity of Japanese shipyards (Thousands of CGT) 35,000 30,000 25,000 20,000 15,000 Order book New orders Completions 10,000 5,
54 Shipbuilding, maintenance and equipment European yards also have experienced a recovery of the order book as from Table 22: Summary of activity of EU28+ Norway shipyards (Thousands of CGT) Year Order book New orders Completions ,666 2,341 4, ,610 3,951 4, ,406 6,798 4, ,738 7,226 3, ,430 5,597 4, ,376 5,257 4, ,209 2,229 4, , , ,495 2,487 4, ,836 1,830 2, ,058 1,859 2, ,705 2,515 1, ,247 3,394 2, ,715 3,240 1,706 Source: Sea Europe. Shipbuilding Market Monitoring 2015 Figure 12: Summary of activity of EU28+ Norway shipyards (Thousands of CGT) 20,000 18,000 16,000 14,000 12,000 10,000 8,000 Order book New orders Completions 6,000 4,000 2,
55 Shipbuilding, maintenance and equipment At the end of 2015, 39.6% of the order ships refer to solid bulk load ship, immediately followed by orders for tankers for the transport of crude oil (27.7%). Table 23: Orderbook by Ship Types Types NO. 1,000 GT 1,000 CGT 1,000 DWT % DWT Crude Oil Tanker ,523 13,872 76, % Oil Products Tanker 193 3,199 2,009 5, % Chemical Tanker 497 9,922 6,888 16, % Other Liquids % Tankers 1,133 53,648 22,780 97, % Bulk Dry 1,299 59,938 25, , % Bulk Dry / Oil % Self-Discharging Bulk Dry % Other Bulk Dry % Bulk Carriers 1,331 60,504 25, , % General Cargo 349 2,988 2,745 4, % Container ,521 18,569 41, % Refrigerated Cargo % Ro-Ro Cargo 134 5,858 3,267 1, % Other Dry Cargo % Dry Cargoes 1,017 49,171 25,196 48, % LNG Tanker ,696 12,059 11, % LPG Tanker 212 6,115 4,330 6, % Gastankers ,811 16,389 18, % Passenger/Ro-Ro Cargo % Passenger (Cruise) 52 5,344 5, % Other Passenger Vessels/Ferries % Ferries / Passenger Ships 181 6,007 6, % Fish Catching % Other Fishing % Offshore Supply 710 1,841 3, % Other Offshore 306 7,931 6, % Research % Towing / Pushing , % Dredging % Other Activities % Other Non Cargo Vessels 2,022 11,122 13, % Total 6, , , , % Source: Sea Europe. Shipbuilding Market Monitoring
56 Shipbuilding, maintenance and equipment In 2015, China had the highest volume of orders for ships (36.4%), followed by South Korea (26.7%) and Japan (19.0%). Fourth, is the European Union 28+ Norway with 7.9%. Table 24: Orderbook by Country Country NO. 1,000 GT % 1,000 CGT % Croatia % % Finland % % Germany 28 1, % 1, % Italy 37 1, % 2, % Netherlands % % Poland % % Romania 83 1, % 1, % Spain % % United Kingdom % % Other EU % % EU , % 8, % Norway % % Russia % % Turkey % % Ukraine % % Others % 1 0.0% Other European % 1, % Japan , % 20, % South Korea , % 29, % China 2,354 77, % 39, % Brazil 128 3, % 2, % India % % Indonesia % % Malaysia % % Philippines 93 5, % 2, % Singapore % % Taiwan 33 1, % % USA % % Vietnam 206 1, % 1, % Others % % Rest of the world 1,241 13, % 9, % World Total 6, , % 109, % Source: Sea Europe. Shipbuilding Market Monitoring
57 Shipbuilding, maintenance and equipment At the end of 2015, 38.7% of the new order ships refer to tanks for the transport of crude oil, immediately followed by new orders of container carriers (23.1%) and solid bulk load ships (21.8%). Table 25: New Orders by Ship types 2015 Types NO. 1,000 GT 1,000 CGT 1,000 DWT % DWT Crude Oil Tanker ,346 7,258 40, % Oil Products Tanker 71 1, , % Chemical Tanker 200 4,040 2,784 6, % Other Liquids % Tankers ,894 10,921 49, % Bulk Dry ,744 5,755 22, % Bulk Dry / Oil % Other Bulk Dry % Bulk Carriers ,117 5,981 23, % General Cargo , % Container ,939 10,475 24, % Refrigerated Cargo % Ro-Ro Cargo 65 2,998 1, % Other Dry Cargo % Dry Cargoes ,039 13,231 26, % LNG Tanker 29 3,160 2,402 2, % LPG Tanker 72 2,463 1,655 2, % Gastankers 101 5,623 4,057 4, % Passenger/Ro-Ro Cargo % Passenger (Cruise) 19 2,002 2, % Other Passenger Vessels/Ferries % Ferries / Passenger Ships 87 2,348 2, % Fish Catching % Other Fishing % Offshore Supply % Other Offshore % Research % Towing / Pushing % Dredging % Other Activities % Other Non Cargo Vessels 609 1,599 2, % Total 2,108 76,620 39, , % Source: Sea Europe. Shipbuilding Market Monitoring
58 Shipbuilding, maintenance and equipment Table 26: New Orders by Country 2015 Country NO. 1,000 GT % 1,000 CGT % Croatia % % Germany % % Italy % % Netherlands % % Poland % % Romania % % Spain % % United Kingdom % % Other EU % % EU , % 3, % Norway % % Russia % % Turkey % % Ukraine % 6 0.0% Other European % % Japan , % 10, % South Korea , % 10, % China , % 13, % Brazil % % India % % Indonesia % % Malaysia % % Philippines 43 2, % 1, % Singapore % % Taiwan % % USA % % Vietnam % % Others % % Rest of the world 318 3, % 2, % World Total 2,108 76, % 39, % Source: Sea Europe. Shipbuilding Market Monitoring
59 Shipbuilding, maintenance and equipment At the end of 2015, 50.4% of completed ships worldwide were related to transport dry bulk ships, 20% of completed ships refer to container carriers, and 11.9% for transport tanks of crude oil. Table 27: Completions by Ship types 2015 Types NO. 1,000 GT 1,000 CGT 1,000 DWT % DWT Crude Oil Tanker 61 6,041 2,013 11, % Oil Products Tanker % Chemical Tanker 207 4,585 2,867 7, % Tankers ,968 5,209 19, % Bulk Dry ,272 11,533 47, % Self-Discharging Bulk Dry % Other Bulk Dry % Bulk Carriers ,519 11,695 47, % General Cargo 161 1,202 1,058 1, % Container ,339 8,246 18, % Refrigerated Cargo % Ro-Ro Cargo 88 2,090 1, % Other Dry Cargo % Dry Cargoes ,902 10,713 21, % LNG Tanker 31 3,021 2,411 2, % LPG Tanker 83 2,205 1,565 2, % Gastankers 114 5,226 3,976 4, % Passenger/Ro-Ro Cargo % Passenger (Cruise) % Other Passenger Vessels/Ferries % Ferries / Passenger Ships , % Fish Catching % Other Fishing % Offshore Supply , % Other Offshore 92 1,706 1, % Research % Towing / Pushing % Dredging % Other Activities % Other Non Cargo Vessels 1,163 3,056 4, % Total 2,841 67,636 37,601 94, % Source: Sea Europe. Shipbuilding Market Monitoring
60 Shipbuilding, maintenance and equipment In 2015, Asia (China, South Korea and Japan), completed more than 80% of the production of ships in that year (35.4%, 31.2% and 18.1% respectively). In the European Union 28 + Norway finished only 4.6% of all finished ships worldwide. Table 28: Completions by Countries 2015 Country NO. 1,000 GT % CGT % Croatia % % Germany % % Italy % % Netherlands % % Poland % % Romania % % Spain % % Other EU % % EU , % 1, % Norway % % Russia % % Turkey % % Others % 8 0.0% Other European % % Japan , % 6, % South Korea , % 11, % China , % 13, % Brazil % % India % % Indonesia % % Malaysia % % Philippines 40 1, % % Singapore % % Taiwan % % USA % % Vietnam % % Others % % Rest of the world 709 4, % 3, % World Total 2,841 67, % 37, % Source: Sea Europe. Shipbuilding Market Monitoring 2015 Ranking included in the economy of the sea map. 60
61 Shipbuilding, maintenance and equipment The ship production capacity has drastically reduced in Europe 28 + Norway, but has increased exponentially in China, South Korea and Japan have been able to maintain their importance. Figure 13: Completions in global shipyards (in CGT) EU 28 + Norway Japan South Korea China Others Source: Sea Europe. Shipbuilding Market Monitoring
62 Shipbuilding, maintenance and equipment China, India, Bangladesh and Pakistan were the locations where there was the most dismantling of bulk volume ships. China was the country that dismantled most container ships. Table 29: Tonnage reported sold for demolition, major vessel types and countries where demolished (Thousands of GT) China Índia Bangladesh Pakistan Others Indian subcontinent Turkey Others World total Year Oil tankers ,680 2, ,844 4,482 Bulk carriers General cargo Container Ships 3,524 1,576 2,934 2,771 4,222 2,888 1,335 1, ,665 9, ,211 2, , ,223 4,769 Gas carriers Chemical tankers Offshore , Ferries and passenger ships Other Total 6,124 6,965 8,409 4,873 6,506 4,269 5,118 4, ,336 1,051 29,052 22,394 Note: Propelled seagoing merchant vessels of 100 GT and above. Source: UNCTAD - Review of Maritime Transport
63 63
64 64
65 Offshore energy 65
66 Offshore energy In 2004, after the Middle East and North America and, Europe was the third largest oil and natural gas producing region of the world. By 2015, Europe had been relegated to 4th place; the Middle East continued to lead production, followed by Latin then North America. Table 30: Total onshore and offshore proved reserves of Oil by country Source: BP Statistical Review 2016 At end 2004 Thousand million barrels At end 2013 Thousand million barrels At end 2014 Thousand million barrels At end 2015 Thousand million barrels Share of the world total USA % Canada % Mexico % Total North America % Brazil % Ecuador % Venezuela % Other Central & South America % Total & Center South America % Azerbaijan % Kazakhstan % Norway % Russia % United Kingdom % Other Europe & Eurasia % Total Europe & Eurasia % Iran % Iraq % Kuwait % Oman % Qatar % Saudi Arabia % United Arab Emirates % Yemen % Other Middle East % Total Middle East % Algeria % Angola % Egypt % Libya % Nigeria % South Sudan % Other Africa % Total Africa % Australia % China % India % Indonesia % Malaysia % Vietnam % Other Asia Pacific % Total Asia Pacific % Total World % 66
67 Offshore energy In 2015, more than half of the world's proven gas reserves belonged to Iran and the Russian Federation. Table 31: Total proved reserves of natural gas by country At end 2004 Trillion cubic metres At end 2013 Trillion cubic metres At end 2014 Trillion cubic metres At end 2014 Trillion cubic metres US Other North America Total North America Venezuela Other S. & Cent. America Total S. & Cent. America Russian Federation Turkmenistan Other Europe & Eurasia Total Europe & Eurasia Iran Iraq Qatar Saudi Arabia United Arab Emirates Other Middle East Total Middle East Algeria Nigeria Other Africa Total Africa Australia China Other Asia Pacific Total Asia Pacific Total World Source: BP Statistical Review
68 Offshore energy Since late 2015, the price of a barrel of Brent oil has been below 100 USD; in mid 2016, the price was slightly above 40 USD. The oil price decline has put pressure on the profitability of offshore operations, which are more expensive than onshore operations. Table 32: Evolution of the Brent s price Date Price in USD Date Price in USD Date Price in USD Date Price in USD Date Price in USD Source: Bloomberg Note: The price corresponds to the last working day of the month. Figure 14: Evolution of the Brent s price in the last 5 years USD
69 Offshore energy In 2015 the top 3 countries in offshore oil and gas production were Saudi Arabia, Norway and Qatar. Table 33: Offshore Oil & Gas Production (Million bbl) Country Saudi Arabia 1, , , , ,572.0 Norway 1, , , , ,447.6 Qatar 1, , , , ,411.8 Iran ,171.3 Brazil Mexico USA 1, Nigeria United Arab Emirates Angola United Kingdom Malaysia Australia China Azerbaijan Indonesia India Venezuela Russia Egypt Trinidad and Tobago Thailand Vietnam Equatorial Guinea Myanmar Other countries 1, , , , , ,221.3 Total 16, , , , , ,361.0 Source: FLAD and Rystad Energy Ranking included in the economy of the sea map. 69
70 Offshore energy Offshore wind power capacity in the world is led by three European countries (UK, Germany and Denmark), representing 79.6% of total installed capacity in the world. Fourth, China represents 8.4% of capacity. Table 34: Global cumulative offshore wind capacity in 2015 Total 2011 Total 2012 Total 2013 Total 2014 Total 2015 Share of the (MW) total UK 2,094 2,948 3,681 4,500 5, % Germany ,012 3, % Denmark ,271 1,271 1, % PR China , % Belgium % Netherlands % Sweden % Japan % Finland % Ireland % South Korea % Spain % Norway % Portugal % USA % Total 4,119 5,415 7,046 8,724 12, % Source: Global Wind Report Market update 2015 Figure 15: Global cumulative offshore wind capacity in 2015 MW Ranking included in the economy of the sea map. Figure 16: Annual cumulative capacity ( ) 6,000 5,000 4,000 3,000 2,000 1,000 0 Cumulative Capacity 2013 Cumulative Capacity 2014 Cumulative Capacity 2015 MW 14,000 12,000 10,000 8,000 6,000 4,000 2, ,107 8,724 7,046 5,415 4,


71 Offshore energy Figure 17: Distribution of tidal companies in the world (2014) Non-EU 49% EU 51% Source: 2014 JRC Ocean Energy Status Report 71
72 72
73 Naval security power, piracy and maritime disasters (oil spills) 73
74 Naval security power, piracy and maritime disasters (oil spills) In 2016, the country with the biggest number of heavy naval equipments (aircraft carriers, frigates, destroyers, corvettes and submarines) is China with 175, followed by the US with 162, Russia is the third with 161 large naval craft. Table 35: Total Naval Ship Power by Countries (Sum of the number Aircraft Carriers, Frigates, Destroyers, Corvettes and Submarines) Top 25 Total (Aircraft Carriers + Frigates + Destroyers + Corvettes + Submarines) Year China USA Russia North Korea India Japan Republic of Korea Iran Turkey France Italy UK Taiwan Greece Vietnam Australia Egypt Germany Algeria Brazil Peru Indonesia Singapore Canada Argentina Source: Global Firepower September 2016 Ranking included in the economy of the sea map. 74
75 Naval security power, piracy and maritime disasters (oil spills) In 2015, Indonesia is the country with greatest incidence of pirate attacks. Table 36: Locations of actual and attempted attacks ( ) Locations Total Indonesia South East Asia Malaysia Singapore Straits Other Asia South China Sea Far East Vietnam Other Far East Indian Sub Continent Bangladesh India Brazil Colombia Ecuador South America Guyana Haiti Peru Venezuela Other South America Benin Egypt Guinea Gulf of Aden a Ivory Coast Africa Nigeria Red Sea a Somalia a Togo The Congo Other Africa Rest of the World Total ,936 Source: ICC International Maritime Bureau - Piracy and Armed Robbery Against Ships All Incidents with a above are attributed to Somali pirates Ranking included in the economy of the sea map. 75
76 Naval security power, piracy and maritime disasters (oil spills) Between 2010 and 2015, there was a downward trend of pirate attacks at sea. Of the 1936 attacks recorded between 2010 and 2015, only 344 did not have more serious consequences. In cases, the pirates managed to board ships. In 174 of the attacks. there were abductions of people. Table 37: Comparisons of the type of attacks ( ) Category Total Attempted Boarded Fired upon Hijack Total ,936 Source: ICC International Maritime Bureau - Piracy and Armed Robbery Against Ships Between 2010 and 2015, except 2014, there was a reduction in the level of violence of attacks on ships' crews. Between 2010 and 2015, about people were subjected to maritime piracy attacks, more than were taken hostage and 28 were killed. Table 38: Types of violence to crew ( ) Types of Violence Total Assaulted Hostage 1, ,578 Injured Kidnap/Ransom Killed Missing Threatened Total 1, ,012 Source: ICC International Maritime Bureau - Piracy and Armed Robbery Against Ships 76
77 Naval security power, piracy and maritime disasters (oil spills) In 2015,the types of ships that were the target of pirate attacks were transport ships of bulk products and chemicals. Table 39: Types of vessels attacked ( ) Type Total Bulk Carrier Container General Cargo Tanker Chem / Product Tanker Crude Oil Trawler/Fishing Tug Other Total at year end ,936 Source: ICC International Maritime Bureau - Piracy and Armed Robbery Against Ships Of the 246 ships attacked in 2015, 4o were sailing under the flag of The Marshall Islands, 38 of Panama and 32 of Singapore. Table 40: Nationalities of ships attacked ( ) Flag State Total Antigua Barbuda Bahamas Hong Kong (SAR) Liberia Malaysia Malta Marshall Islands Panama Singapore Other Total year end ,936 Source: ICC International Maritime Bureau - Piracy and Armed Robbery Against Ships 77
78 Naval security power, piracy and maritime disasters (oil spills) Accidents involving oil spills have been occurring over time, all over the world. Table 41: Location of major shipping oil spills (Since 1967) Top 20 Shipname Year Location Spill size (thousand tonnes) 1 Atlantic Empress 1979 Off Tobago. West Indies ABT Summer nautical miles off Angola Castillo de Bellver 1983 Off Saldanha Bay. South Africa Amoco Cadiz 1978 Off Brittany. France Haven 1991 Genoa. Italy Odyssey nautical miles off Nova Scotia. Canada Torrey Canyon 1967 Scilly Isles. UK Sea Star 1972 Gulf of Oman Irenes Serenidade 1980 Navarino Bay. Greece Urquiola 1976 La Coruna. Spain Hawaiian Patriot nautical miles off Honolulu Independenta 1979 Bosphorus. Turkey Jakob Maersk 1975 Oporto. Portugal Braer 1993 Shetland Islands. UK Aegean Sea 1992 La Coruna. Spain Sea Empress 1996 Milford Haven. UK Khark nautical miles off Atlantic coast of Morocco 18 Nova 1985 Off Kharg Island. Gulf of Iran Katina P 1992 Off Maputo. Mozambique Prestige 2002 Off Galicia. Spain 63 Source: ITOPF Oil Tanker Spill Statistics Table 42: Other relevant offshore spills Description Year Location 1 Deepwater Horizon 2010 Mexican Gulf 2 Ixtoc 1 Oil Well 1979 Bay of Campeche. Mexico 3 Nowruz Oil Field 1983 Persian Gulf Source: The Telegraph 78
79 79
80 80
81 Fishing and aquaculture 81
82 Fishing and aquaculture Between 2004 and 2014, as the world population has grown, there has been an increase in the consumption of fish and other food products per capita. In 2004, per capita consumption was 16.2 kg, rising to a per capita consumption of 20.1 kg in This increase in per capita consumption was met by increased production in aquaculture. In 2004, production in onshore and offshore aquaculture reached about 27.8 and 18.1 million tons, respectively, rising to 47.1 and 26.7 million tons in Fish catches at sea continue to represent the largest contribution to the supply of fish. but have not grown in recent years. Table 43: World fisheries and aquaculture production and utilization Production Inland Note:Data in this section for 2014 are provisional estimates. Source: FAO - The State of the World Fisheries and Aquaculture in (Million tonnes) Capture Aquaculture Total inland Marine Capture Aquaculture Total marine Total capture Total aquaculture TOTAL WORLD FISHERIES UTILIZATION Human consumption Non-food uses Population (billions) Per capita food fish supply (kg) Figure 18: Total Capture. Total Aquaculture and Total World fisheries in million tonnes Total Capture Total Aquaculture Total World Fisheries 82
83 Million tonnes Fishing and aquaculture The top ten countries in terms of fishing, led by China with 18.2% of the catch, represent about 60% of the total global fishing. Table 44: Marine capture fisheries: major producer countries Weight Variation 2014 Ranking Country /2014 (Million tonnes) (Percentage) (Percentage) 1 China % 21.3% 2 Indonesia % 39.5% 3 USA % 2.0% 4 Russian Federation % 29.0% 5 Japan % -21.7% 6 Peru % -42.6% 7 India % 13.3% 8 Vietnam % 68.8% 9 Myanmar % 145.5% 10 Norway % -8.0% 11 Chile % -38.9% 12 Philippines % 5.0% 13 Republic of Korea % 6.2% 14 Thailand % -40.7% 15 Malaysia % 15.4% 16 Mexico % 7.7% 17 Morocco % 55.6% Total 17 major countries % 5.5% Rest of the world % -5.7% World total % 2.3% Share 17 major countries (%) Source: FAO - The State of the World Fisheries and Aquaculture in 2016 Figure 19: Marine capture fisheries: major producer countries Ranking included in the economy of the sea map
84 Fishing and aquaculture The Pacific Ocean is where most of the fishing takes place, representing about 58% of the total. Table 45: Marine capture: major fishing areas Fishing area name (area code) Source: FAO - The State of the World Fisheries and Aquaculture in (Million Tonnes) Weight 2014 Variation 2003/2014 (Percentage) (Percentage) Atlantic. Northwest (21) % -21.7% Atlantic. Northeast (27) % -15.5% Atlantic. Western Central (31) % -33.3% Atlantic. Eastern Central (34) % 22.2% Mediterranean and Black Sea (37) % -26.7% Atlantic. Southwest (41) % 20.0% Atlantic. Southeast (47) % -5.9% Indian Ocean. Western (51) % 6.8% Indian Ocean. Eastern (57) % 52.8% Pacific. Northwest (61) % 10.6% Pacific. Northeast (67) % 6.9% Pacific. Western Central (71) % 18.5% Pacific. Eastern Central (77) % 5.6% Pacific. Southwest (81) % -28.6% Pacific. Southeast (87) % -34.9% Arctic and Antarctic areas ( ) % 200.0% World total % Figure 20: Marine capture: major fishing areas Arctic and Antarctic areas (18,48,58,88) Pacific, Southeast (87) Pacific, Southwest (81) Pacific, Eastern Central (77) Pacific, Western Central (71) Pacific, Northeast (67) Pacific, Northwest (61) Indian Ocean, Eastern (57) Indian Ocean, Western (51) Atlantic, Southeast (47) Atlantic, Southwest (41) Mediterranean and Black Sea (37) Atlantic, Eastern Central (34) Atlantic, Western Central (31) Atlantic, Northeast (27) Atlantic, Northwest (21)
85 Million tonnes Fishing and aquaculture The fifteen species most fished represent about 1/3 of all fish caught. Table 46: Marine capture: major species and genera Weight 2014 Variation 2003/ FAO English Scientific name Ranking name (Million Tonnes) (Percentage) (Percentage) 1 Theragra Alaska pollock (= chalcogramma walleye pollock) % 10.3% 2 Anchoveta (= Engraulis ringens Peruvian anchovy) % -50.0% 3 Katsuwonus Pelamis Skipjack tuna % 40.9% 4 Sardinella spp. Sardinellas nei % 9.5% 5 Scomber Japonicus Chub mackerel % 0.0% 6 Clupea harengus Atlantic herring % -20.0% 7 Thunnus Albacares Yellowfin tuna % 0.0% 8 Decapterus spp. Scads % 7.1% 9 Scomber scombrus Atlantic mackerel % 100.0% 10 Engraulis Japonicus Japanese anchovy % -26.3% 11 Gadus morhua Atlantic cod % 75.0% 12 Trichiurus Lepturus Largehead hairtail % 8.3% 13 Sardina European pilchard Pilchardus (= sardine) % 9.1% 14 Dosidicus gigas Jumbo flying squid % 200.0% 15 Micromesistius poutassou Blue whiting % 100.0% Total 15 major species and genera % 3.8% Rest of the world % 1.7% World total % 2.4% Share 15 major species and genera (%) Note: nei = not elsewhere included. Catches for single species have been added to those reported for the genus. Source: FAO - The State of the World Fisheries and Aquaculture in 2016 Figure 21: Marine capture: major species and genera
86 Fishing and aquaculture Worldwide, the inland freshwater fish catch is also led by China. Table 47: Inland waters capture: major producer countries Weight Variation /2014 Rankin Country (Percentag (Percentage g (Million Tonnes) e) ) 1 China % 9.5% 2 Myanmar % 366.7% 3 India % 62.5% 4 Bangladesh % 42.9% 5 Cambodia % 66.7% 6 Uganda % 150.0% 7 Indonesia % 33.3% 8 Nigeria % 100.0% 9 United Republic of Tanzania % 0.0% 10 Egypt % -33.3% Total 10 major countries % 50.9% Rest of the world % 16.1% World total % 38.4% Share 10 major countries (%) 64.0% 69.4% 69.0% 68.4% 69.7% Source: FAO - The State of the World Fisheries and Aquaculture in 2016 Figure 22: Inland waters capture: major producer countries in 2014 (in percentage of the total) China Myanmar India Bangladesh Cambodia Uganda Indonesia Nigeria United Republic of Tanzania Egypt 86
87 Fishing and aquaculture In 2014, 88.91% of world aquaculture was in Asia, and was responsible for the significant growth of aquaculture globally. Table 48: Aquaculture production by region: quantity of world total production Selected groups and countries Weight 2012 Weight 2014 Variation 2000/2014 (Million Tonnes) (Percentage) (Percentage) Africa % 2.3% 328% North Africa (excluding % 0.0% Egypt) 240% Sub-Saharan Africa % 0.3% (excluding Nigeria) 741% Americas % 4.5% 136% Caribbean % 0.1% -17.5% Latin America % 2.1% (excluding Chile) 278% North America % 0.8% -4% Asia % 88.9% 131% China % 61.6% 111% Central Asia % 0.0% 271% Eastern Asia (excluding % 2.1% China) 13% Europe % 4.0% 43% Northern Europe % 0.6% (excluding Norway) 30% Southern Europe % 0.8% -7% Oceania % 0.3% 55% World % 100.0% 128% Notes: Data exclude aquatic plants and non-food products. Data for 2014 for some countries are provisional and subject to revisions. For the purpose of this table. Cyprus. classified as part of Asia by FAO. is included under Europe as one of the 28 members of European Union (Member Organization). Source: FAO - The State of the World Fisheries and Aquaculture in 2016 Figure 23: Aquaculture production by region: quantity of world total production (in million tonnes), 2000, 2012 and 2014 Figure 24: Aquaculture production by region: quantity of world total production (weight in percentage), ,000 60,000 50,000 40,000 30,000 20,000 10, Africa Americas Asia Europe Oceania Africa Americas Asia Europe Oceania 87
88 Fishing and aquaculture Onshore aquaculture is the main contributor to the growth of aquaculture and China represents 61.7% of global aquaculture production. Table 49: Farmed food fish production by top 15 producers and main groups of farmed species in 2014 Producer Finfish Inland Aquaculture Mariculture Other speciesª a National total Share in world total (Million Tonnes) (Million Tonnes) (Percentage) China % India % Indonesia % Vietnam % Bangladesh % Norway % Chile % Egypt % Myanmar % Thailand % Philippines % Japan % Brazil % Republic of Korea % Malaysia % Top 15 subtotal % Rest of the world % World % Note: The symbol means the production data are not available or the production volume is regarded as negligibly low. a Other species includes crustaceans. molluscs and other species. Source: FAO - The State of the World Fisheries and Aquaculture in 2016 Figure 25: Farmed food fish production share of the top 15 producers in 2014 (in percentage of the total) China India Indonesia Vietnam Bangladesh Norway Chile Egypt Myanmar Thailand Philippines Japan Brazil Republic of Korea Malaysia Rest of the world Ranking included in the economy of the sea map. 88
89 Fishing and aquaculture Asia is responsible for the production of more than 90% of aquaculture algae. Table 50: Aquaculture production of farmed aquatic plants in the world and selected major producers Weight Variation /2014 (Million Tonnes) (Percentage) (Percentage) China % 91.6% Indonesia % 4695% Philippines % 111.3% Republic of Korea % 195% Japan % -24.5% Malaysia % 900% Subtotal % 202.5% Rest of the world % 39.6% World % 193.2% Notes: The Democratic People s Republic of Korea and Vietnam are among the major producers of farmed seaweeds. They are not listed separately in this table due to the unavailability of reliable statistics data. Instead. they are included in Rest of world.... = data not available. Source: FAO - The State of the World Fisheries and Aquaculture in 2016 Figure 26: Aquaculture production of farmed aquatic plants in the world per country (in million tonnes) and Figure 27: Aquaculture production of farmed aquatic plants in the world and selected major producers (Weight in percentage) China Indonesia Philippines Republic of Korea Japan Malaysia Rest of the world 89
90 Fishing and aquaculture In 2014, Asian fishermen and aquaculture producers represented 84% of employment in this sector. In addition to the growth registered in Asia (20.4%) between 2000 and 2014, there was growth in Africa (35.9%), in Latin America (37.8%) and a decrease in Europe (-47%). Table 51: World fishers and fish farmers by region Weight 2014 Variation 2000/2014 (Thousands) (Percentage) (Percentage) Africa 4,175 5,027 5,885 5, % 35.9% Asia 39,646 49,345 49,040 47, % 20.4% Europe % -47.0% Latin America and the Caribbean 1,774 2,185 2,251 2, % 37.8% North America % -6.1% Oceania % -63.5% World 46,845 57,667 58,272 56, % 20.9% Of which. fish farmers Africa % 212% Asia 12,211 17,915 18,175 18, % 47.7% Europe % -35.9% Latin America and the Caribbean % 66.4% North America % 50.0% Oceania % 20.0% World 12,632 18,512 18,861 18, % 48.5% Notes: Some statistics provided to FAO by national offices. in particular those for are provisional and may be amended in future editions. and in other FAO publications. Source: FAO - The State of the World Fisheries and Aquaculture in 2016 Figure 28: World fishers and fish farmers by region Africa Asia Europe Latin America and the Caribbean North America Oceania 90
91 Fishing and aquaculture In 2014, 80% of motorised fishing ships were in Asia. Figure 29: Distribution of motorized fishing vessels by region in 2014 Africa 6% North America 3% Latin America and the Caribbean 7% Europe 3% Pacific and Oceania 1% Asia 80% Fonte: FAO - The State of the World Fisheries and Aquaculture in

92 Fishing and aquaculture From 1974 to 2013, there has been a significant increase in the pressure on fish stocks, causing overfishing - or at the limit of what is acceptable - of a number of species. Figure 30: Global trends in the state of world marine fish stocks Percentage of stocks assessed Overfished Fully fished Underfished At biologically unsustainable levels Within biologically sustainable levels Source: FAO - The State of the World Fisheries and Aquaculture in
93 Fishing and aquaculture China is currently the greatest exporter of food products from the sea, while EUA is the most importer country. Table 52: Top ten exporters and importers of fish and fishery products Annual Growth (US$ millions) (%) Exporters China 6,637 20, % Norway 4,132 10, % Thailand 4,060 6, % Vietnam 2,444 8, % USA 3,851 6, % Chile 2,501 5, % Canada 3,487 4, % Denmark 3,566 4, % India 1,409 5, % Netherlands 2,452 4, % Top ten subtotal 34,539 77, % Rest of the World total 37,330 70, % World total 71, , % Importers USA 11,964 20, % Japan 14,560 14, % China 3,126 8, % Spain 5,222 7, % France 4,176 6, % Germany 2,805 6, % Italy 3,904 6, % Sweden 1,301 4, % UK 2,812 4, % Republic of Korea 2,250 4, % Top ten subtotal 52,119 83, % Rest of the world total 23,583 57, % World total 75, , % Source: FAO - The State of the World Fisheries and Aquaculture in
94 Fishing and aquaculture Africa and Latin America are the regions of the world with the lowest per capita consumption of fish and other sea products. Table 53: Per capita food fish supply by continent and economic grouping in 2010 and 2013 Per capita sea food supply (2010) (kg/year) Per capita sea food supply (2013) (kg/year) World World (excluding China) Africa North America Latin America and the Caribbean Asia Europe Oceania Industrialized countries Other developed countries Least-developed countries Other developing countries LIFDCs - Low-income fooddeficit countries Source: FAO - The State of the World Fisheries and Aquaculture in
95 Fish for human comsumption (KG/Capita) Fishing and aquaculture Since 1970, aquaculture has increased its relative importance in the supply of food from the sea, reaching a similar weight to the fisheries. Figura 31: Relative contribution of aquaculture and capture fisheries to fish for human consumption 12 Capture fisheries Aquaculture Source: FAO - The State of the World Fisheries and Aquaculture in 2016 Circum-navegação LEME Barómetro PwC da Economia do Mar (Mundo) 95
96 96
97 Entertainment, sports, tourism and culture 97
98 Revenue in billion U.S. dollars Entertainment, sports, tourism and culture Gross revenue associated with the cruise ship activity has been increasing. Figure 32: Revenue of the cruise industry worldwide from 2008 to 2015 (in billion U.S. dollars) a Source: Cruise industry - Statista Dossier a Forecast 98
99 Entertainment, sports, tourism and culture North America and Europe are the most important markets for cruise ships. Figure 33: Market size of the global cruise industry in 2014, by region (in billion U.S. dollars) Market size in billion U.S. dollars North America Europe Asia 1.80 South America 1.27 Australia and New Zealand 1.13 Middle East and Africa 0.07 Source: Cruise industry - Statista Dossier 99
100 Market share Entertainment, sports, tourism and culture The Caribbean still holds the largest market share in the business of cruise ships, closely followed by the Mediterranean and the rest of Europe. Figure 34: Global cruise industry deployment market share in 2016, by region 40% 35% 33.7% 30% 25% 20% 18.7% 15% 10% 5% 11.7% 9.2% 6.1% 4.1% 2.7% 13.8% 0% Source: Cruise industry - Statista Dossier Ranking included in the economy of the sea map. 100
101 Number of passengers in millions Entertainment, sports, tourism and culture The number of people participating in cruise travel has increased. Figure 35: Number of cruise passengers worldwide from 2005 to 2015 (in millions) Source: Cruise industry - Statista Dossier 101
102 Entertainment, sports, tourism and culture The largest cruise consumers are North Americans, immediately followed by the Germans and the British. Figure 36: Leading passenger source countries in the global cruise industry in 2014 Global passenger share 0% 10% 20% 30% 40% 50% 60% USA 51.0% Germany United Kingdom Australia Italy Canada China France Spain Norway 8.0% 7.3% 4.5% 3.8% 3.6% 3.2% 2.7% 2.0% 0.8% Source: Cruise industry - Statista Dossier 102
103 Passenger capacity in thousands Entertainment. sports. tourism and culture The cruise industry has been increasing its overall capacity. Figure 37: Passenger capacity of the global cruise industry from 2011 to 2015 (in thousands) Source: Cruise industry - Statista Dossier 103
104 Entertainment, sports, tourism and culture By the end of 2014, in terms of business volume, the three biggest companies involved in cruise line activity have their headquarters in Miami (USA). The fourth largest company is headquartered in the Switzerland. Figure 38: Leading cruise line companies headquarters location worldwide in 2014, by revenue (in billion U.S. dollars) Revenue in billion U.S. dollars Miami, USA Miami, USA 8.07 Miami, USA 3.13 Geneva, CH Miami, USA Luton, UK Kowloon, HK Tromsø, Norway Los Angeles, USA Monaco a a a a a / b a a a Via Cruise Market Watch b Figure was converted from Norwegian krone to U.S. dollars (exchange rate of 1 krone = 0.17 U.S. dollars was used). Source: Cruise industry - Statista Dossier 104
105 Entertainment, sports, tourism and culture In 2015, in a comparison of the "accommodation" on cruises, the ranking of the world's largest companies are headquartered in the US, Italy and Switzerland. Figure 39: Forecast capacity passenger capacity of the cruise industry worldwide in by cruise line. Capacidade de Passageiros 0 10,000 20,000 30,000 40,000 50,000 60,000 70,000 80,000 Miami, EUA 68,478 Miami, EUA 62,368 Los Angeles, EUA 40,996 Miami, EUA 38,546 Genova, IT 37,220 Geneva, CH 30,174 Miami, EUA 24,320 Seattle, EUA 23,126 Source: Cruise industry - Statista Dossier 105
106 Entertainment, sports, tourism and culture The USA, Australia, New Zealand, Italy, France and the UK are the countries of reference in terms of the recreational boating and marinas business. According to six 2015 edition of Pleasure Boat International Resource Guide Published by the National USA Marine Manufacturers Association, the USA exports of recreational marine craft and accessories totaled USD 2.1 billion in The U.S. recreational marine market makes up approximately 75 percent of the entire world market for these products. Table 54: US Exports Top 20 Markets by FAS Value Recreational Marine Craft. Parts. and Accessories. as defined by the Harmonized Tariff System. Top 20 Markets by FAS Value (Annual + Year-To-Date Data from January October. USD Thousands) Country YTD 2015 YTD Variation YTD Canada 642, , , , , , % Mexico 84, , , ,775 75,160 91, % Australia 247, , , ,448 62,758 53, % Belgium 92, , , ,151 62,150 88, % Spain 41,467 29,664 44,514 74,878 63,508 52, % Italy 71,652 53,874 53,076 74,791 64,775 57, % Brazil 72,565 85,103 68,894 56,331 28,392 15, % Japan 35,273 61,114 51,271 50,009 25,701 31, % United Arab Emirates 29,916 45,819 35,528 48,624 27,034 19, % Germany 51,268 50,209 43,038 45,556 26,969 22, % Costa Rica 33,581 42,277 24,122 44,932 4,034 3, % China 37,133 36,161 40,710 36,435 17,881 23, % Netherlands 57,193 35,943 32,662 33,731 20,338 12, % France 29,383 26,671 27,200 29,055 18,479 17, % Colombia 26,038 14,597 20,989 28,692 9,023 13, % United Kingdom 38,709 29,585 21,790 27,387 16,981 15, % New Zealand 24,163 35,848 31,585 24,577 8,118 8, % Russia 17,985 30,829 25,340 23,275 19,659 7, % Norway 16,245 15,413 13,701 21,000 13,712 13, % Korea 11,425 14,191 13,881 19,506 10,155 10, % Subtotal 1,661,314 1,707,930 1,680,908 1,720, , , % All others 538, , , , , , % World Total 2,199,506 2,274,393 2,167,656 2,148,475 1,175,881 1,092, % Source: Pleasure boat International Resource Guide. A Reference for U.S. Exporters Edition 106
107 Entertainment, sports, tourism and culture USA marina industry According to the National Maritime Manufacturers Association (NMMA), there are more than marinas in the United States of America. In the state of Florida alone there are more than marinas, which is a number that is higher than the number of marinas in several other well-known recreational boat countries. Nationwide, the number of berths available in the marina industry is estimated to be over 1.1 million. The marina industry is a sound contributor to the US employment statistics, it is believed that for each 100 berths there are 3 jobs created, which results in a total of full-time workers in the whole country. (In marinamanagement December 2001) 107
108 Entertainment, sports, tourism and culture The Yacht Harbour Association is a leading association in the UK and abroad in the marinas business. this association has an accreditation process. Table 55: Top countries with five and four gold anchor marinas (2016) Country Number of five gold anchor marinas Country Number of four gold anchor marinas United Kingdoma 49 Turkey 11 Portugal 6 Netherlands 4 United Arab Emirates 4 Belgium 3 Ireland 3 Italy 2 Croatia 2 France 2 Spain 1 Singapore 1 Malta 1 Montenegro 1 Greece 1 Qatar 1 Thailand 1 China 1 Hong Kong 1 Mexico 1 Cyprus 1 US Virgin Islands 1 Malaysia 1 West Indies 1 United Kingdom 26 France 3 Belgium 2 Italy 2 Netherlands 1 Source: Yacht Harbour Association. September 2016 a Includes Jersey and Turks and Caicos Islands. 108
109 Entertainment, sports, tourism and culture In the ranking of 5 best aquariums in the world, three aquariums are located in the United States, one in Portugal and one in Spain. Table 56: Top 25 Best Aquarium of the World Aquarium Location Ranking 2015 Oceanário de Lisboa Lisbon - Portugal 1º Georgia Aquarium Atlanta USA 2º Monterey Bay Aquarium California USA 3º Oceanografic Valencia Spain 4º Ripley's Aquarium of the Smokies Gatlinburg USA 5º Ripley's Aquarium of Canada Toronto Canada 6º Aquaworld Aquarium & Reptile Rescue Centre Hersonissos Greece 7º Tennessee Aquarium Chattanooga USA 8º Okinawa Churaumi Aquarium Motobu-cho Japan 9º Vancouver Aquarium Vancouver Canada 10º Mundomar Benidorm Spain 11º S.E.A. Aquarium Sentosa Island Singapore 12º Genoa Aquarium Genoa Italy 13º Parque Explora Medellin Colombia 14º Mote Marine Laboratory and Aquarium Sarasota USA 15º Two Oceans Aquarium Cape Town Central - South Africa 16º Aquario Vasco da Gama Lisbon Portugal 17º Shedd Aquarium Chicago USA 18º National Aquarium. Baltimore Baltimore USA 19º Dallas World Aquarium Dallas USA 20º Aquarium La Rochelle La Rochelle France 21º Voronezh Oceanarium Voronezh Russia 22º Cretaquarium Thalassocosmos Heraklion Greece 23º Dubai Aquarium & Underwater Zoo Dubai - United Arab Emirates 24º Marine Habitat at Atlantis Paradise Island - Bahamas 25º Source: TripAdvisor. September
110 Entertainment, sports, tourism and culture Europe remains the continent with more medals in canoeing, Germany being the country that leads with 32 medals. Table 57: Top 15 countries with gold. silver and bronze medals in canoeing (sum of last four Olympic Games) Athens London Country Medals Beijing 2008 Rio Table 57: Top 15 countries with gold. silver and bronze medals in canoeing Gold Germany (sum of last three Olympic Silver Games) Bronze Gold Hungary Silver Bronze Gold United Silver Kingdom Bronze Gold Slovakia Silver Bronze Gold Spain Silver Bronze Gold Australia Silver Bronze Gold Russia Silver Bronze Gold France Silver Bronze Gold Canada Silver Bronze Gold Belarus Silver Bronze Gold Ukraine Silver Bronze Gold Czech Silver Republic Bronze Gold Italy Silver Bronze Gold Poland Silver Bronze Gold Norway Silver Bronze Note: These results include slalom canoeing and sprint canoeing Source: Graphic of self-elaboration based on the portals data of the Olympic Games. Total
111 Entertainment, sports, tourism and culture In sailing, while European countries, led by the UK. continue well classified, winning 19 medals at the last four Olympic Games, Australia appears in second place in the ranking with 11 medals. Table 58: Top 15 countries with gold. silver and bronze medals in sailing (sum of last four Olympic Games) Country United Kingdom Australia France Spain Netherlands Denmark New Zealand Brazil USA China Sweden Greece Argentina Croatia Poland Medals Athens London Beijing Rio 2016 Gold Silver Bronze Gold Silver Bronze Gold Silver Bronze Gold Silver Bronze Gold Silver Bronze Gold Silver Bronze Gold Silver Bronze Gold Silver Bronze Gold Silver Bronze Gold Silver Bronze Gold Silver Bronze Gold Silver Bronze Gold Silver Bronze Gold Silver Bronze Gold Silver Bronze Total Source: Graphic of self-elaboration based on the portals data of the Olympic Games. Ranking included in the economy of the sea map. 111
112 Entertainment, sports, tourism and culture In rowing. the UK leads with 24 medals, followed by Australia (15) and New Zealand and Germany (12 both) Table 59: Top 15 countries with gold. silver and bronze medals in rowing (sum of last four Olympic Games) Country United Kingdom Australia New Zealand Germany USA Netherlands Canada Denmark France Italy Romania Poland Czech Republic China Belarus Source: Graphic of self-elaboration based on the portals data of the Olympic Games Medals Athens London Beijing Rio 2016 Gold Silver Bronze Gold Silver Bronze Gold Silver Bronze Gold Silver Bronze Gold Silver Bronze Gold Silver Bronze Gold Silver Bronze Gold Silver Bronze Gold Silver Bronze Gold Silver Bronze Gold Silver Bronze Gold Silver Bronze Gold Silver Bronze Gold Silver Bronze Gold Silver Bronze Total
113 Entertainment, sports, tourism and culture In surfing, Australia and USA have been consistently leading in recent years. Table 60: Top countries with first, second and third places in surf (sum of last three World Surf League championships) Country Positions Total Australia USA Brazil First Second Third First Second Third First Second Third Note: includes men and women leagues Source: World Surf League 113
114 114
115 Economy of the sea map 115
116 116
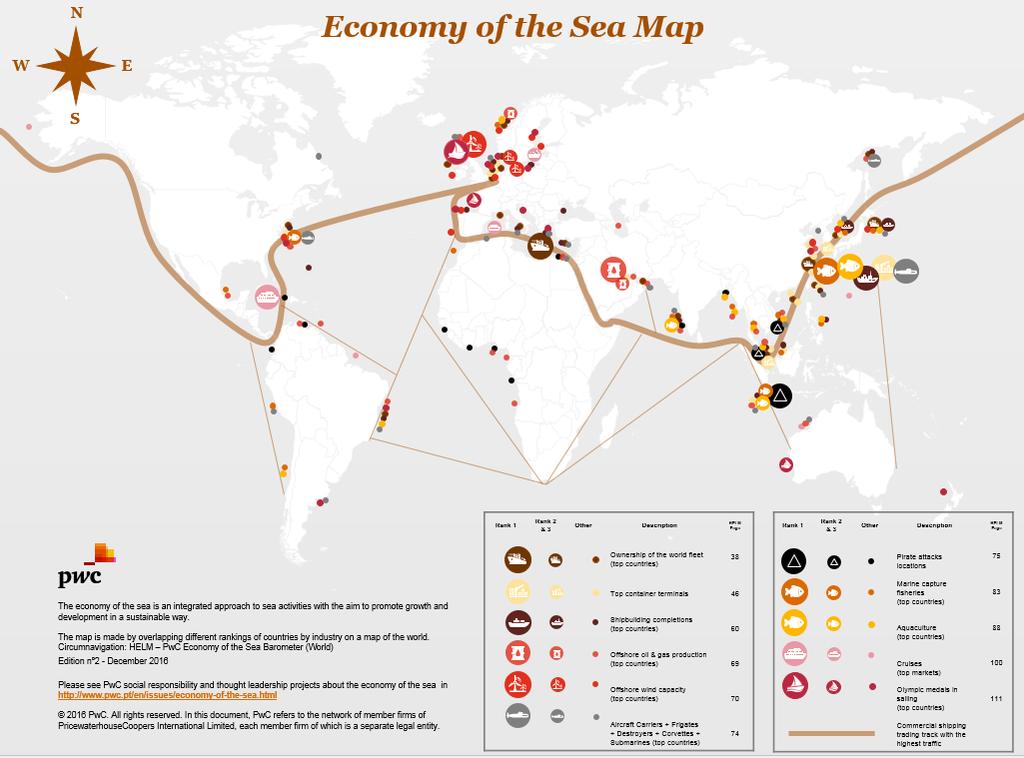
117
118 118

119 List of Tables, Figures and Acronyms 119
Recent Developments in International Seaborne Trade and Maritime Transport
 Recent Developments in International Seaborne Trade and Maritime Transport IFSPA, Hong Kong, 3-5 June 2013 Dr. Vincent F. Valentine Officer-in-Charge, Transport Section Division on Technology and Logistics
BP Statistical Review of World Energy June 2017
 BP Statistical Review of World Energy June 217 Primary energy 8 Consumption 8 Consumption by fuel 9 66 th edition Primary energy Consumption* Growth rate per annum Million tonnes oil equivalent 26 27 28
Primary energy. 8 Consumption 9 Consumption by fuel. 67 th edition
 Primary energy 8 Consumption 9 Consumption by fuel 67 th edition Primary energy Consumption* Growth rate per annum Million tonnes oil equivalent 27 28 29 2 211 212 213 214 215 216 217 217 26-16 Share 217
I. World trade in Overview
 I. World trade in - Overview Table I.1 Growth in the volume of world merchandise exports and production, 2-5 (Annual percentage change) 2-5 23 24 World merchandise exports 4.5 5. 9.5 6. Agricultural products
Annex IV. True nationality of the 20 largest fleets by flag of registration, as at 1 January 2011 a
 194 Annex IV. True nationality of the 20 largest fleets by flag of registration, as at 1 January 2011 a Antigua and Barbuda Bahamas China Belgium 0 0-9 122 0.2 1 59 0.1 Bermuda 0 0-17 1 907 2.8 0 0 - Brazil
REVIEW OF MARITIME TRANSPORT 2013
 UNITED NATIONS CONFERENCE ON TRADE AND DEVELOPMENT REVIEW OF MARITIME TRANSPORT 2013 Report by the UNCTAD secretariat Annex III UNITED NATIONS New York and Geneva, 2013 STATISTICAL ANNEX 173 True nationality
Coal. 36 Reserves and prices 38 Production and consumption. 67 th edition
 Coal 36 Reserves and prices 38 Production and consumption 67 th edition Total proved reserves at end 217 Million tonnes Anthracite and bituminous Subbituminous and lignite US 228 3116 25916 24.2% 357 Canada
67 th edition. Renewable energy. Appendices. 44 Other renewables consumption 45 Biofuels production
 Renewable energy 44 Other renewables consumption 45 Biofuels production Appendices A1 Solar Generation A2 Wind Generation A3 Geothermal, biomass and other Generation A4 Geothermal Cumulative installed
Natural gas. 26 Reserves 28 Production and consumption 33 Prices 34 Trade movements. 67 th edition
 Natural gas 26 Reserves 28 Production and consumption 33 Prices 34 Trade movements 67 th edition Natural gas Total proved reserves At end 1997 At end 2007 At end 2016 At end Trillion Trillion Trillion
AUSTRIA. Table 1. FDI flows in the host economy, by geographical origin. (Millions of US dollars)
") Table 1. FDI flows in the host economy, by geographical origin World 5 690 138 6 195 3 184 10 784 7 933 31 154 6 858 9 303 840 10 618 5 760 Developed economies 5 740 13 5 341 2 689 10 137 6 291 29 721
Table 1. FDI flows in the host economy, by geographical origin World 5 690 138 6 195 3 184 10 784 7 933 31 154 6 858 9 303 840 10 618 5 760 Developed economies 5 740 13 5 341 2 689 10 137 6 291 29 721
1. INTERNATIONAL OVERVIEW. 1.0 Area and population. population (1,000) area
 area") 1.0 Area and population area population (1,000) km 2 2000 2010 2018 1 inhabitants per km 2 Belgium 30,530 10,251 10,920 11,443 375 Germany 357,380 82,212 81,777 82,952 232 Estonia 45,230 1,397 1,331 1,315
1.0 Area and population area population (1,000) km 2 2000 2010 2018 1 inhabitants per km 2 Belgium 30,530 10,251 10,920 11,443 375 Germany 357,380 82,212 81,777 82,952 232 Estonia 45,230 1,397 1,331 1,315
World real merchandise trade grows faster than output
 I. I. world trade developments 8 Merchandise trade and GDP World real merchandise trade grows faster than output In 2006, the volume of world merchandise trade grew by 8 per cent while world gross domestic
Summary of debt securities outstanding
 Summary of debt securities outstanding All countries........................ 22,695 15,852 6,665 3,427 1,762 Developed countries........................ 16,504 13,087 5,869 2,716 701 Austria 510 173 44
FEDERAL RESERVE statistical release
 FEDERAL RESERVE statistical release FOR IMMEDIATE RELEASE MARCH 16, 1992 E.U C1Z1, GEOGRAPHICAL r DISTRIBUTION n OF e ASSETS AND^LIABILITIES (IN MILLIONS OF DOLLARS) ASSETS COUNTRY OF CUSTOMER 12/31/90
Table B1. Advanced Economies: Unemployment, Employment, and Real per Capita GDP (Percent)
") Statistical Appendix Table B1. Advanced Economies: Unemployment, Employment, and Real per Capita GDP (Percent) Unemployment Rate 2 Averages 1 1993 2002 2003 12 Advanced Economies 6.8 6.9 6.7 6.5 6.3 5.8
Statistical Appendix Table B1. Advanced Economies: Unemployment, Employment, and Real per Capita GDP (Percent) Unemployment Rate 2 Averages 1 1993 2002 2003 12 Advanced Economies 6.8 6.9 6.7 6.5 6.3 5.8
SWITZERLAND October 2011
 UNITED NATIONS CONFERENCE ON TRADE AND DEVELOPMENT INVESTMENT COUNTRY PROFILES SWITZERLAND October 2011 i NOTE The Division on Investment and Enterprise of UNCTAD is a global centre of excellence, dealing
World Air Conditioner Demand by Region
 World Air Conditioner Demand by Region April 2015 The Japan Refrigeration and Air Conditioning Industry Association 1 World Air Conditioner Demand by Region April 2015 The Japan Refrigeration and Air Conditioning
Inbound Tourism Trends Quarterly Q Issue 20 January 2017
 Inbound Tourism Trends Quarterly Q3 216 Issue 2 January 217 1 Contents 1. About this data 2. Global Context: Global view, Economic outlook and Exchange rate 3. Inbound Volume and Value 4. Journey Purpose,
Table 13 Production, trade and supply of conventional crude oil Thousand metric tons; kilograms per capita; reserves production ratio (R/P) in years
 in years") , trade and supply of conventional crude oil Thousand metric tons; kilograms per capita; reserves production ratio (R/P) in years Table Notes The Reserves / ratio refers to crude oil and natural gas liquids.
, trade and supply of conventional crude oil Thousand metric tons; kilograms per capita; reserves production ratio (R/P) in years Table Notes The Reserves / ratio refers to crude oil and natural gas liquids.
KINGDOM OF CAMBODIA NATION RELIGION KING 3
 KINGDOM OF CAMBODIA NATION RELIGION KING 3 TOURISM STATISTICS REPORT March 2018 MINISTRY OF TOURISM Statistics and Tourism Information Department No. A3, Street 169, Sangkat Veal Vong, Khan 7 Makara, Phnom
Evolving Global Oil Trade Flows. IEA-IEF-OPEC Joint Meeting Vienna, March 2018
 Evolving Global Oil Trade Flows IEA-IEF-OPEC Joint Meeting Vienna, March 2018 SHIFTING FLOWS: WHAT HAS THIS MEANT IN PRACTICE? US/Europe crude imports & exports Saudi crude to Poland Chinese teapots importing
35,000 52,000 87,000 1,600 8, ,400 76,600. Mean Crop. Monthly YTD Min ,671 8,211 Max. 2017
 YTD Inventory / Shipment Report In Shell Basis Crop: 2018 Monthly Market Prices FCA Hamburg Iranian Dried In Shell 28/30 Fandoghi Pistachios Total Consumption Ending Inventory 2nd Marketing Month YTD Carry
Total credit to the non-financial sector (core debt), % of GDP Table F1.1
, % of GDP Table F1.1") Total credit to the non-financial sector (core debt), % of GDP Table F1.1 2012 2013 2014 2015 2016 Q2 16 Q3 16 Q4 16 Q1 17 Q2 17 Argentina 62.6 66.4 64.6 75.5 75.3 81.7 80.1 75.3 71.6 72.7 Australia 208.0
Total credit to the non-financial sector (core debt), % of GDP Table F1.1 2012 2013 2014 2015 2016 Q2 16 Q3 16 Q4 16 Q1 17 Q2 17 Argentina 62.6 66.4 64.6 75.5 75.3 81.7 80.1 75.3 71.6 72.7 Australia 208.0
Table 13 Production, trade and supply of conventional crude oil Thousand metric tons; kilograms per capita; reserves production ratio (R/P) in years
 in years") Table 13, trade and supply of conventional crude oil Thousand metric tons; kilograms per capita; reserves production ratio (R/P) in years Table Notes The Reserves / ratio refers to crude oil and natural
Table 13, trade and supply of conventional crude oil Thousand metric tons; kilograms per capita; reserves production ratio (R/P) in years Table Notes The Reserves / ratio refers to crude oil and natural
KINGDOM OF CAMBODIA NATION RELIGION KING 3
 KINGDOM OF CAMBODIA NATION RELIGION KING 3 TOURISM STATISTICS REPORT March 2015 MINISTRY OF TOURISM Statistics and Tourism Information Department No. A3, Street 169, Sangkat Veal Vong, Khan 7 Makara, Phnom
World Geographic Shares
 World Geographic Shares North America South America Europe Africa Asia Australia/ Oceania 18% 13% 7% 22% 33% 6% World Population Shares North America South America Europe Africa Asia Australia/ Oceania
Table 13 Production, trade and supply of conventional crude oil Thousand metric tons; kilograms per capita; reserves production ratio (R/P) in years
 in years") Million metric tons Million metric tons Table 13, trade and supply of conventional crude oil Thousand metric tons; kilograms per capita; reserves production ratio (R/P) in years Table Notes The Reserves
Million metric tons Million metric tons Table 13, trade and supply of conventional crude oil Thousand metric tons; kilograms per capita; reserves production ratio (R/P) in years Table Notes The Reserves
KINGDOM OF CAMBODIA NATION RELIGION KING 3
 KINGDOM OF CAMBODIA NATION RELIGION KING 3 TOURISM STATISTICS REPORT December 2015 MINISTRY OF TOURISM Statistics and Tourism Information Department No. A3, Street 169, Sangkat Veal Vong, Khan 7 Makara,
GLOBAL SUMMARY REPORT Market for High Voltage Insulators & Bushings
 GLOBAL SUMMARY REPORT Market for High Voltage Insulators & Bushings 2010-2015 - 2025 GOULDEN REPORTS October 2016 No 1 Priorsfield, Marlborough, Wiltshire, SN84AQ. United Kingdom Tel: +44 1672 513316 Fax:
19,000 38,500. Mean Crop. 5, ,827 Max , ,869 Last Year 6, ,
 YTD Inventory / Shipment Report In Shell Basis Crop: 2017 Monthly Market Prices FCA Hamburg Iranian Dried In Shell 28/30 Fandoghi Pistachios 10th Marketing Month YTD Carry in from previous year 3,000 Total
Global Dialysis - Cost per Dialysis Session
 Cost per session for dialysis where a cost has been entered for a dialysis centre. All costs have been converted to US Dollars as at 19 May 2006. Note that the costs do not state what is covered by a dialysis
KINGDOM OF CAMBODIA NATION RELIGION KING 3
 KINGDOM OF CAMBODIA NATION RELIGION KING 3 TOURISM STATISTICS REPORT February 2017 MINISTRY OF TOURISM Statistics and Tourism Information Department No. A3, Street 169, Sangkat Veal Vong, Khan 7 Makara,
Table 5 Production, trade and supply of hard coal Thousand metric tons and kilograms per capita
 Table Notes Production includes production from other sources as defined in the previous table. Data for China include brown coal. Please refer to the Definitions Section on pages ix to xv for the appropriate
KINGDOM OF CAMBODIA NATION RELIGION KING 3
 KINGDOM OF CAMBODIA NATION RELIGION KING 3 TOURISM STATISTICS REPORT May 2017 MINISTRY OF TOURISM Statistics and Tourism Information Department No. A3, Street 169, Sangkat Veal Vong, Khan 7 Makara, Phnom
Annex. List of tables
 Statistical annex Annex List of tables A. 1 Developed economies: rates of growth of real GDP, 2000-2010... 145 A. 2 Economies in transition: rates of growth of real GDP, 2000-2010... 146 A. 3 Developing
KINGDOM OF CAMBODIA NATION RELIGION KING 3
 KINGDOM OF CAMBODIA NATION RELIGION KING 3 TOURISM STATISTICS REPORT October 2017 MINISTRY OF TOURISM Statistics and Tourism Information Department No. A3, Street 169, Sangkat Veal Vong, Khan 7 Makara,
JURISDICTIONS PARTICIPATING IN THE CONVENTION ON MUTUAL ADMINISTRATIVE ASSISTANCE IN TAX MATTERS
 JURISDICTIONS PARTICIPATING IN THE CONVENTION ON MUTUAL ADMINISTRATIVE ASSISTANCE IN TAX MATTERS STATUS 27 JULY 2018 ORIGINAL CONVENTION 27-05-2010) OR OR 1. ALBANIA 01-03-2013 (AC) 08-08-2013 01-12-2013
KINGDOM OF CAMBODIA NATION RELIGION KING 3
 KINGDOM OF CAMBODIA NATION RELIGION KING 3 TOURISM STATISTICS REPORT September 2017 MINISTRY OF TOURISM Statistics and Tourism Information Department No. A3, Street 169, Sangkat Veal Vong, Khan 7 Makara,
Oil. 12 Reserves 14 Production and consumption 20 Prices 22 Refining 24 Trade movements. 67 th edition
 Oil 12 Reserves 14 Production and consumption 20 Prices 22 Refining 24 Trade movements 67 th edition Oil Total proved reserves At end 1997 At end 2007 At end 2016 At end Thousand million barrels Thousand
KINGDOM OF CAMBODIA NATION RELIGION KING 3
 KINGDOM OF CAMBODIA NATION RELIGION KING 3 TOURISM STATISTICS REPORT October 2018 MINISTRY OF TOURISM Statistics and Tourism Information Department No. A3, Street 169, Sangkat Veal Vong, Khan 7 Makara,
Global Competitiveness Index Rankings
 APPENDIX B Global Competitiveness Index 2017 2018 Rankings The following pages report the GCI 2017 2018 rankings for the three subindexes (Table 1) and their corresponding pillars (Tables 2 4). Detailed
KINGDOM OF CAMBODIA NATION RELIGION KING 3
 KINGDOM OF CAMBODIA NATION RELIGION KING 3 TOURISM STATISTICS REPORT September 2018 MINISTRY OF TOURISM Statistics and Tourism Information Department No. A3, Street 169, Sangkat Veal Vong, Khan 7 Makara,
Inbound Tourism Trends Quarterly Quarter Issue 24 January 2018
 Inbound Tourism Trends Quarterly Quarter 3 217 Issue 24 January 218 1 Contents 1. About this data 2. Global Context: Global view, Economic outlook and Exchange rate 3. Inbound Volume and Value (Journey
Table 5 Production, trade and supply of hard coal Thousand metric tons and kilograms per capita
 Table Notes Production includes production from other sources as defined in the previous table. Data for China include brown coal. Please refer to the Definitions Section on pages ix to xv for the appropriate
Global Monthly February 2018
 Global Monthly February 18 3 1-year Treasury yields 1-year breakeven inflation rate 1 1 15 16 17 18 February 18 5 3 Global GDP growth Composite PMI (RHS) Index 56 5 5 1 5 1 13 1 15 16 17 18 3..5. 1.5 1.
9.01 ICT use for business-to-business transactions
 9.01 ICT use for business-to-business transactions To what extent do businesses in your country use ICTs for communicating and carrying out transactions with other businesses? [1 = not at all; 7 = extensively]
Imports of seed for sowing by country Calendar year 2011 Source: ISF compilation based on official statistics and international seed trade reports
 USA 157,432 15,562 464 173,458 523 318 67 908 Germany 195,159 5,913 520 201,592 595 97 22 714 France 125,701 4,389 277 130,367 522 150 11 683 Netherlands 140,899 12,253 796 153,948 250 330 48 628 Italy
(annual average compound growth rate)
") Table 3-1. 3KDVHVRI*URZWKE\0DMRU5HJLRQ (annual average compound growth rate) 1820-70 1870-1913 1913-50 1950-73 1973-92 1820-1992 GDP Western Europe 1.7 2.1 1.4 4.7 2.2 2.2 Western Offshoots 4.3 3.9 2.8
Table 3-1. 3KDVHVRI*URZWKE\0DMRU5HJLRQ (annual average compound growth rate) 1820-70 1870-1913 1913-50 1950-73 1973-92 1820-1992 GDP Western Europe 1.7 2.1 1.4 4.7 2.2 2.2 Western Offshoots 4.3 3.9 2.8
Production (bbl/day)
") 1 of 5 14/09/2011 22:15 From Wikipedia, the free encyclopedia This is a list of countries by oil production mostly based on CIA World Factbook data. [1] Note that oil production refers to the sum of barrels
1 of 5 14/09/2011 22:15 From Wikipedia, the free encyclopedia This is a list of countries by oil production mostly based on CIA World Factbook data. [1] Note that oil production refers to the sum of barrels
Production of minor oil products from refineries - by type Thousand metric tons
 Production of minor oil from refineries - by type Table 23 Table Notes Data refer to production from refineries of refinery, ethane, naphtha, lubricants, bitumen, paraffin, petroleum, white spirit, and
Next Release: 14 November Next Release: 14 November July
 43282 Next Release: 14 November 2018 Next Release: 14 November 2018 July Date of publication: 12 October 2018 TABLE OF CONTENTS Charts 1 Gross consumption of natural gas by OECD region 3 2 Indigenous production
UXC.COM A PUBLICATION OF. NPO Overview 1501 MACY DRIVE ROSWELL, GA PH FX
 2019 A PUBLICATION OF UXC.COM NPO Overview 1501 MACY DRIVE ROSWELL, GA 30076 PH +1 770 642-7745 FX +1 770 643-2954 NOTICE UxC, LLC ( UxC ) shall have title to, ownership of, and all proprietary rights
Next Release: 16 May Next Release: 16 May January
 43101 Next Release: 16 May 2018 Next Release: 16 May 2018 January Date of publication: 13 April 2018 TABLE OF CONTENTS Charts 1 Gross consumption of natural gas by OECD region 3 2 Indigenous production
STATISTICAL ANNEX NOTE ON QUARTERLY PROJECTIONS
 OECD Economic Outlook, Volume 2017 Issue 1 OECD 2017 This annex contains data on key economic series which provide a background to the recent economic developments in the OECD area described in the main
Economy and Output. Introduction. Key Trends. Key Indicators for Asia and the Pacific 2010
 152 Economy and Output The Asia and Pacific region accounts for almost one third of global GDP measured in purchasing power parity (PPP) terms. Many economies in the region have made substantial increases
Economic and Market Report. EU Automotive Industry Quarter
 Economic and Market Report EU Automotive Industry Quarter 2 2017 September 2017 CONTENTS Passenger cars... 2 Registrations... 2 World... 2 The European Union... 4 Passenger car registrations by fuel type...
Emerging Trends in Petroleum Markets
 Emerging Trends in Petroleum Markets For Defense Logistics Agency, Worldwide Energy Conference Washington, D.C. By T. Mason Hamilton, Petroleum Markets Analyst U.S. Energy Information Administration Independent
China s Global Peanut Export Share Declines
 United States Department of Agriculture Foreign Agricultural Service Circular Series FOP 07-13 China s Global Peanut Export Share Declines U.S. 10% Others 19% Argentina 17% U.S. 11% Others 16% Argentina
Information Technology and Economic Development: An Introduction to the Research Issues
 November 1998 Working Papers No. 153 Information Technology and Economic Development: An Introduction to the Research Issues TABLE 1 WORLD-WIDE INFORMATION TECHNOLOGY MARKET BREAKDOWN, 1995
TABLE OF CONTENTS 6 MEDIUM-TERM COAL MARKET REPORT 2012
 TABLE OF CONTENTS FOREWORD... 3 ACKNOWLEDGEMENTS... 5 EXECUTIVE SUMMARY... 12 Business as usual... 12 The winds of change... 12 US shale gas switches on coal in Europe... 13 From Beijing to New Delhi?...
5.01 Secondary education enrollment rate
 5.01 Secondary education enrollment rate Gross secondary education enrollment rate 2011 or most recent year available RANK COUNTRY/ECONOMY Value 1 Australia 8...131.3 2 Spain...128.5 3 Seychelles...123.9
Table 23 Production of minor oil products from refineries - by type Thousand metric tons
 Table 23 Production of minor oil from refineries - by type Table Notes Data refer to production from refineries of refinery, ethane, naphtha, lubricants, bitumen, paraffin, petroleum, white spirit, and
LPI ranking and scores, 2014
 ing and scores, 2014 Germany 1 4.12 100.0 Netherlands 2 4.05 97.6 Belgium 3 4.04 97.5 United Kingdom 4 4.01 96.6 Singapore 5 4.00 96.2 Sweden 6 3.96 94.9 Norway 7 3.96 94.8 Luxembourg 8 3.95 94.4 United
Thermal Coal Market Presentation to UNECE Ad Hoc Group of Experts on Coal in Sustainable Development December 7, 2004
 Thermal Coal Market Presentation to UNECE Ad Hoc Group of Experts on Coal in Sustainable Development December 7, 2004 Barlow Jonker Pty Ltd Commercial in Confidence 1 Presentation Outline 1. Barlow Jonker
Spain s exports by oil product group and country of destination
 Corporación de Reservas Estratégicas de Productos Petrolíferos Castellana, 79 28046 Madrid T. +34 91 360 09 10 Updated F. +34 91 420 on39 45 www.cores.es February 13 th 2017 Spain s exports by oil product
Capital Markets Day 2007 Kongsberg Maritime 25 September 20O7
 Capital Markets Day 27 Kongsberg Maritime 25 September 2O7 WORLD CLASS through people, technology and dedication 1 Kongsberg Maritime Offshore & Merchant Marine Offshore & Merchant Marine Introduction
Economic and Market Report. EU Automobile Industry
 Economic and Market Report EU Automobile Industry September 2015 Q2 2015 CONTENTS EU Economic Outlook... 2 Passenger cars... 4 Registrations... 4 World... 4 The European Union... 6 Production... 8 World...
Microsoft Social Engagement Translation Guide Last Updated: October 2017
 Microsoft Social Engagement Translation Guide Last Updated: October 2017 Microsoft Social Engagement is translated and supported by Microsoft and made generally available in the countries/regions and languages
Table 16 Refinery distillation capacity, throughput and output Thousand metric tons
 Million metric tons Table 16 Refinery distillation capacity, throughput and output Table Notes Output is equal to the sum of production from refineries for aviation gasoline, bitumen, gas/diesel oil, ethane,
Switzerland. A. Definitions and sources of data
 Switzerland A. Definitions and sources of data The Swiss National Bank (SNB) compiles data on foreign direct investment (FDI) for balance of payments- and international investment position- purposes. The
Table 16 Refinery distillation capacity, throughput and output Thousand metric tons
 Table 16 Refinery distillation capacity, throughput and output Table Notes Output is equal to the sum of production from refineries for aviation gasoline, bitumen, gas/diesel oil, ethane, feedstocks, gasoline-type
Global Summary Report Market for High Voltage Switchgear
 Global Summary Report Market for High Voltage Switchgear 2012-2022 GOULDEN REPORTS October 2016 No 1, Priorsfield, Marlborough,WiltshireSN8 4AQ, United Kingdom Tel: +44 1672 513316 Fax: +44 1672 513316
Fiche 1 Quelques données de la Banque Mondiale
 Fiche 1 Quelques données de la Banque Mondiale 274 WORLD DEVELOPMENT REPORT 2000 2001 Table 1. Size of the economy Surface Population area density Gross national product (GNP) GNP per capita GNP measured
WORLD MOTOR VEHICLE PRODUCTION BY COUNTRY AND TYPE QUARTERS June 14, 2018
 QUARTERS 2017-2018 June 14, 2018 CONTENTS BASEPROTOTAL BASEPROCARS BASEPROLCV BASEPROHCV BASEPROBC Summation of cars, LCVs, HCVs, heavy buses Cars LCVs HCVs Heavy buses Note: The production of cars and
F Statistics on total credit to the non-financial sector
 F Statistics on total credit to the non-financial sector www.bis.org/statistics/totcredit.htm The BIS statistics on credit to the non-financial sector capture borrowing activity of the government sector
wcshipping.com
 Containarized Car Exports From the United States Data and Analysis 2nd Quarter 2015 Second Quarter 2015 - US Car Export Market Summary Despite ongoing port delays and the expensive US dollar, global interest
Economic and Market Report. EU Automotive Industry Quarter
 Economic and Market Report EU Automotive Industry Quarter 3 2017 December 2017 CONTENTS EU economic outlook... 2 Passenger cars... 4 Registrations... 4 World... 4 The European Union... 6 Passenger car
Total fleet. Oil tankers
 184 as at 1 January 2011 (in thousands of dwt) DEVELOPING ECONOMIES OF AFRICA Algeria 809 30 204 66 0 509 Angola 58 10 0 14 0 34 Benin 0 0 0 0 0 0 Cameroon 10 0 0 4 0 6 Cape Verde 22 5 0 12 0 6 Comoros
STATISTISCHER ANHANG VORLÄUFIGE AUSGABE
 OECD-Wirtschaftsausblick Ausgabe 2013/1 OECD 2013 STATISTISCHER ANHANG VORLÄUFIGE AUSGABE Die statistischen Daten für Israel wurden von den zuständigen israelischen Stellen bereitgestellt, die für sie
2.01 Availability of latest technologies
 2.01 Availability of latest technologies To what extent are the latest technologies available in your country? [1 = not available; 7 = widely available] 2010 2011 weighted average RANK COUNTRY/ECONOMY
FAPRI Food and Agricultural Policy Research Institute
 26 WORLD OUTLOOK Presentation Food and Agricultural Policy Research Institute Global Macroeconomic Overview Sustained and widespread real economic growth for the decade averaging 3.1%. Industrialized countries
Section III Macroeconomic environment
 Data Tables Section III Macroeconomic environment 2.2: Data Tables Section III: Macroeconomic environment 422 3.01 Government budget balance General government budget balance as a percentage of GDP 2010
The People s Republic of China and Hong Kong, China together accounted for nearly 55% of developing member economies total external debt in 2015.
 185 IV. Globalization Snapshot The People s Republic of China and Hong Kong, China were once again the recipients of the largest net foreign direct investment (FDI) inflows in nominal terms in 2016, while
Fresh Connections: Netherlands
 Fresh Connections: Netherlands SHIFTING TRADE WINDS: GEOPOLITICS, GLOBAL TRADE & YOU JULIEN MARCILLY CHIEF ECONOMIST APRIL 29, 215 Oil prices: Lower for longer 14 Oil price (Brent, source: OPEC) 12 Oil
Global Oil&Gas Tanker Outlook
 MARSEILLE MARITIME 28 Global Oil&Gas Tanker Outlook ( and just a few words on containerships) Ralph Leszczynski Marseille, 16 September 28 banchero costa research www.bancosta.it - research@bancosta.it
I. Global wine markets,
 I. Global wine markets, 2007-09 Table 1: Summary of the world's wine markets, 2007-09 (annual average) Vine % of cropland Wine Wine Wine Wine Wine Per adult wine Pop- GDP GDP Area under vines produced
Euromoney Country Risk Q RESULTS
 1 Euromoney Country Risk Q3 218 RESULTS 2 TABLE OF CONTENTS 1. Introduction (Scoring) 2. Q/Q update 3. Y/Y update 4. Contacts 3 SCORING Euromoney Country Risk is a platform designed to capture and aggregate
JURISDICTIONS PARTICIPATING IN THE CONVENTION ON MUTUAL ADMINISTRATIVE ASSISTANCE IN TAX MATTERS
 JURISDICTIONS PARTICIPATING IN THE CONVENTION ON MUTUAL ADMINISTRATIVE ASSISTANCE IN TAX MATTERS COUNTRY/JURISDICTION * STATUS 15 DECEMBER 2017 1. ALBANIA 01-03-2013 (AC) 08-08-2013 01-12-2013 2. ANDORRA
Growing Soybean Oil Price Raises Oil s Contribution to Total Soybean Value
 United States Department of Agriculture Foreign Agricultural Service Circular Series FOP 10-07 October 2007 Growing Soybean Oil Price Raises Oil s Contribution to Total Soybean Value Relative Share Value:
ELBISCO INDUSTRIAL & COMMERCIAL FOOD S.A.
 Particulars About Your Organisation 1.1 Name of your organization 1.2 What is/are the primary activity(ies) or product(s) of your organization? Oil Palm Growers Palm Oil Processors and/or Traders Consumer
Macroeconomic Assumptions
 Macroeconomic Assumptions A major factor affecting the global economy this year continues to be weakness in Chinese financial markets and the resulting fallout affecting trading partners dependent on the
Drought in South America to Limit Soybean Exports
 United States Department of Agriculture Foreign Agricultural Service Circular Series FOP 2-09 ruary 2009 Drought in South America to Limit Soybean Exports Million Tons 16 14 12 10 8 6 4 2 Annual Change
Infographics on Electromobility (January 2019)
") Infographics on Electromobility (January 2019) Publisher: BMW Group Corporate Communications Electromobility Last Update: 04.01.2019 Contact: presse@bmw.de ELECTROMOBILITY IN GERMANY. SHARE IN NEW REGISTRATIONS
Infographics on Electromobility (January 2019) Publisher: BMW Group Corporate Communications Electromobility Last Update: 04.01.2019 Contact: presse@bmw.de ELECTROMOBILITY IN GERMANY. SHARE IN NEW REGISTRATIONS
Sharp Decline in Vegetable Oil Stocks Leads to Steeply Higher Prices
 United States Department of Agriculture Foreign Agricultural Service Circular Series FOP 1-11 Sharp Decline in Vegetable Oil Leads to Steeply Higher Prices Commodity prices have been on an upward trend
Spain s exports by oil product group and country of destination. Year Corporación de Reservas Estratégicas de Productos Petrolíferos
 Corporación de Reservas Estratégicas de Productos Petrolíferos Castellana, 79 28046 Madrid T. +34 91 360 09 10 Updated F. +34 91 420 on39 45 www.cores.es July 13 th 2015 Spain s exports by oil product
Cotton This Month. Major Changes in Supply and Demand Estimates and Projections
 1629 K Street NW, Suite 702 Washington, DC 20006, USA Cotton This Month February 1, 2018 Major Changes in Supply and Demand Estimates and Projections India Mexico Pakistan United States 2017/18 production
China Soybean Imports Stagnant Despite Record Consumption as Production Rebounds
 United States Department of Agriculture Foreign Agricultural Service Circular Series FOP 9-08 tember 2008 China Soybean Stagnant Despite Record Consumption as Rebounds Million Tons 60 50 40 30 20 10 0
Soybean Trade Growth: A Story of Brazil, the United States, and China
 United States Department of Agriculture Foreign Agricultural Service October 2017 Soybean Trade Growth: A Story of Brazil, the United States, and China 12-Month Soybean Export Growth Year Ending September
211 STATISTICAL APPENDIX
 211 STATISTICAL APPENDIX For the user s convenience, as well as to lighten the text, the Economic Survey of Europe includes a set of appendix tables showing time series for the main economic indicators
The Great Transition: Shifting from Fossil Fuels to Solar and Wind Energy Supporting Data - Hydropower
 The Great Transition: Shifting from Fossil Fuels to Solar and Wind Energy Supporting Data - Hydropower World Installed Hydroelectric Generating Capacity, 1980-2013 GRAPH: World Installed Hydroelectric