Bharat Petroleum Corporation Ltd.
|
|
|
- Duane Bruce
- 5 years ago
- Views:
Transcription


1 Bharat Petroleum Corporation Ltd. Investor Presentation August 2018
2 2 Disclaimer No information contained herein has been verified for truthfulness completeness, accuracy, reliability or otherwise whatsoever by anyone. While the Company will use reasonable efforts to provide reliable information through this presentation, no representation or warranty (express or implied) of any nature is made nor is any responsibility or liability of any kind accepted by the Company or its directors or employees, with respect to the truthfulness, completeness, accuracy or reliability or otherwise whatsoever of any information, projection, representation or warranty (expressed or implied) or omissions in this presentation. Neither the Company nor anyone else accepts any liability whatsoever for any loss, howsoever, arising from use or reliance on this presentation or its contents or otherwise arising in connection therewith. This presentation may not be used, reproduced, copied, published, distributed, shared, transmitted or disseminated in any manner. This presentation is for information purposes only and does not constitute an offer, invitation, solicitation or advertisement in any jurisdiction with respect to the purchase or sale of any security of BPCL and no part or all of it shall form the basis of or be relied upon in connection with any contract, investment decision or commitment whatsoever. The information in this presentation is subject to change without notice, its accuracy is not guaranteed, it may be incomplete or condensed and it may not contain all material information concerning the Company. We do not have any obligation to, and do not intend to, update or otherwise revise any statements reflecting circumstances arising after the date of this presentation or to reflect the occurrence of underlying events, even if the underlying assumptions do not come to fruition.
3 3 Table of Contents 1. Corporate Overview 4 2 Business Overview 9 3. Industry Overview 23
4 4 1. Corporate Overview Credit Highlights
5 Market Capitalization^ Refining Capacity Market Sales Introduction India s 6th largest company by turnover over INR 2,772 bn in FY18 and INR 2,420 bn in FY17 India s 2nd largest Oil Marketing Company (OMC) with domestic sales volume of over MMT in FY18 and MMT in FY17 FY18 FY17 FY16 FY15 FY MMT Domestic market share of 21% during FY Majority Govt. of India shareholding of 54.31% and explicit Govt. support through under-recovery compensation mechanism MMT # 314 ranking on Fortune 2018 global list; ranks 6 th among the only seven Indian companies on the list The Govt. of India conferred BPCL with MAHARATNA status in Sep 2017 Well positioned to meet market demand across India through Strategically located Refineries and Marketing Infrastructure Successful foray into upstream business FY15 FY16 FY17 FY18 Q1FY19 INR bn Ratings at par with the Sovereign Baa2 (Outlook Positive) by Moody s / BBB- (Outlook Stable) by Fitch FY15 FY16 FY17 FY18 Q1FY19 ^ Market capitalization figures as on period end FY means Financial year ending 31st March Source: National Stock Exchange India s Leading Oil and Gas Company with presence across the Hydrocarbon Value Chain 5
6 Important Milestones GoI acquired Burmah Shell Refineries. Name changed to BPCL in 1977 BPCL and GAIL formed a JV, IGL, for distribution of Natural Gas in entire capital region BPCL entered the LNG market by signing a gas sales purchase agreement with Petronet LNG MR capacity enhanced to 12 MMTPA. BPCL and Videocon JV acquired 50% stake in Brazil's EnCana Brasil Petroleo Kochi Refinery capacity enhanced to 9.5 MMTPA CCR 1 unit at Mumbai Refinery commissioned in March Acquisition of upstream assets in Russia Integrated Refinery Expansion Project (IREP) at Kochi conferred with MAHARATNA status in Sep 2017 Restructured business into corporate centre, Strategic Business Units (SBU) and Shared Entities First in the Indian Oil Industry to roll out ERP Solution Entered into upstream business and formed Bharat Petro Resources (BPRL) Started operations at its Bina refinery by launching its crude distillation unit Euro III / IV products launched at Mumbai and Kochi Refinery Commissioning of 6 MMTPA Bina Refinery Refrigerated LPG storage and handling facility at JNPT and Uran LPG plant commissioned Commissioned Energy Efficient CDU IV with replacement of CDU I & II at Mumbai Refinery Commissioned Kota Jobner Pipeline and Terminal 6
7 Major Subsidiaries/ JVs Subsidiaries Joint Ventures & Associates Upstream Refining Refining City Gas Distribution Pipelines Aviation Services Trading Activities % 61.65% 50.00% 22.50% Bharat Oman Refineries Indraprastha Gas 50.00% 50.00% Kochi Salem Pipeline Pvt. Bharat Stars Services Pvt 50.00% Matrix Bharat Pte Bharat PetroResources Numaligarh Refinery 25.00% Ratnagiri Refinery & Petrochemicals 25.00% 11.00% 37.00% 22.50% Central UP Gas 11.00% GSPL India Transco 21.68% Delhi Aviation Fuel Facility (P) 12.50% LNG Gas Maharashtra Natural Gas GSPL India Gasnet Kannur International Airport Ltd. Petronet LNG Bharat Gas Resources % 50.00% Sabarmati Gas Haridwar Natural Gas Private 50.00% 7 Goa Natural Gas Pvt. Ltd % Petronet India 25.00% 74.00% Mumbai Aviation Fuel Facility (P) BPCL-KIAL Fuel Farm Facility Pvt. Ltd % Others FINO Paytech Ltd
8 8 2. Business Overview Credit Highlights


9 Diversified Product Offering and Presence Across Value Chain Refinery Aviation Retail LPG Industrial/ Commercial Aviation Lubricants Gas Refining capacity of 36.5 MMTPA 15% of the country s refining capacity 26.0% market share 1 14,478 retail outlets 115 depots and 13 installations 26.1% market share 1 Currently 5,232 distributors 51 LPG bottling plants Currently 8,000+ customers 25.7% market share 1 in ATF 43 Aviation service stations 18.4% market share 1 Currently 16,000 customers More than grades of products 50+ major LNG customers Strategically located refineries Pan India presence across products Various Innovative offerings with ventures in allied business Reliable, innovative and caring supplier of I&C products Present at all the major gateways and airports for into plane services Major OEM tie ups such as Tata Motors, Honda, Genuine Oil, TVS etc. Emerging Markets Four refineries in Mumbai, Kochi, Numaligarh and Bina Pioneer in branded retail outlets, branded fuels ex: Speed Current customer base of 68mn incl. retail and bulk Pioneer in IT integration and Supply Chain Management Only OMC to implement Apron Fuel Management System Product customization 1 JV in LNG; 2 gas pipeline JVs City gas distribution networks in 10 cities 1. Market share includes sale by PSU as well as private oil marketing companies. All figures as of 30 th June Source : Ministry of Petroleum and Natural Gas. 9


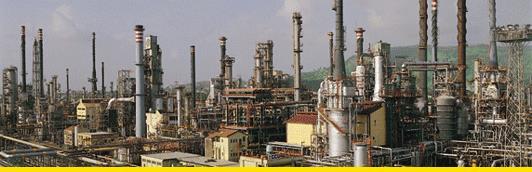
10 10 Refining Coverage Installed Capacity Refining Capacity Mumbai 240 kbpd Kochi 310 kbpd** BORL 120 kbpd Refining Throughput * 28.69* 29.24* 29.84* 31.25* FY14 FY15 FY16 FY17 FY18 Kochi Mumbai Numaligarh Bina MMT Numaligarh 60 kbpd Capacity Utilization consistently above global peers for KR and MR State of the art refinery at Bina - High Nelson Complexity Index of 9.1 * Bina Refinery throughput is considered proportionately because it s a 50:50 JV ** Full capacity utilization of enhanced capacity at Kochi commenced from Q4FY18 after sequential commissioning of IREP units during FY18 Four Strategically located refineries across India Refinery Utilization rates significantly above global peers 935-km cross country pipeline to source crude to BORL


11 11 Bina Refinery Bharat Oman Refineries (BORL) BPCL Interest 50% with 120,000 bpd (6 MMT) Refining capacity at BINA State of art technologies - High Nelson Complexity Index 9.1 Associated Facilities SPM, Crude Oil Terminal, 935-km cross country crude oil pipeline from Vadinar to Bina (VBPL) NRL Refinery Graded improvement in operations with the Refinery operating at more than 100% of the design capacity during FY17 Low cost capacity expansion from 6 MMTPA to 7.8 MMTPA Mumbai Refinery Kochi Refinery GRM of $15/bbl during Q1FY19 and $11.7/bbl during FY18 Pipelines : Bina refinery to consolidate refining portfolio required to support downstream retailing market in Northern India

 250 3900 3957 225 201 3687 200 169 173 176 3700 175 3500 3363 150 3300 125 Capacity Q1FY19 3075 3075 100 3100 75 2900 50 2700 25 2500 0 FY14 FY15 FY16 FY17 FY18 BPC")
12 Marketing Operations and Efficiencies SBU Market Sales (MMT) Retail Lubes Direct Aviation LPG Retail Market Share of MS & HSD * MS > 26.30% HSD > 26.30% 2.00 (3.00) FY14 FY15 FY16 FY17 FY18 LPG Bottling Plant Capacity (TMTPA) Thru put per Outlet BPC Vs. Industry (KL/month) Capacity Q1FY FY14 FY15 FY16 FY17 FY18 BPC IOC HPC Industry * Market share includes sale by PSU as well as private oil marketing companies during Q1FY19 Leading Player with a Diversified product portfolio and a well-established Marketing and Distribution network 12

 Dedicated fleet sales team Brand and Customer Loyalty Pure for Sure (PFS) Pioneer program guaranteeing fuel Quality")

13 Efficient Marketing Operations and Infrastructure Continuous innovation to extend customer focus and improve operational and financial efficiency. Retail Initiatives Launched the first branded fuel in India i.e. Speed Over 8,000 Automated Outlets, Generating over 75% of total retail sales volume In and Out Stores : 157 convenience stores Tie up with Amazon for Pick Up store initiative Highway Strategy GHAR. The new growth engine Chain of strategically located One Stop Truck Shops (OSTS) Dedicated fleet sales team Brand and Customer Loyalty Pure for Sure (PFS) Pioneer program guaranteeing fuel Quality and Quantity Loyalty programmes One of the largest in India Petrocard 0.50 mn customers Smartfleet 0.27 mn customers Landmark Initiatives New Business Initiatives Unique integrated non-fuel strategy to enhance BPCL s customer experience beyond fuel Bouquet of physical and digital non-fuel offerings to various customer segments Rural Market Place (RMP) Integrated Fleet Management (IFM) Personal Travel Offerings (PTO) Technology Initiatives Smart Drive Mobile application for retail customers E business: e-biz.com/e banking (B2B) 90% plus customers collections Online indenting/tracking E business: e-bharatgas.com (B2B / B2C) All India All Customers (B2C) Online refill booking/tracking (B2C) Bulk customers direct order (B2B) 13
14 14 Ongoing projects thriving to be self sufficient integrated source of fuel supply Kochi Refinery MS Block Project for Euro VI grade gasoline Mumbai Refinery Gasoline Hydro-treatment Unit Bina Refinery Creeping Capacity Expansion from 6 MMTPA to 7.8 MMTPA Investments in Gas pipelines GIGL & GITL pipelines in Joint Venture Kochi Diversification into Niche Petrochemicals Propylene Derivatives Petrochemical Project (PDDP) Retail : Network expansion with infrastructure growth and upgradation LPG import terminal at Haldia, West Bengal Significant Expansion in Downstream & Marketing network to drive future growth

15 15 Upcoming projects Funding for upstream developments and new assets Refineries Upgrade/ Expansion / De-bottlenecking Investments in Gas Expansion of marketing infrastructure across all business verticals More expansions in Upstream, Downstream business & Marketing network
16 16 Capex Strategy Capital Expenditure FY14 FY15 FY16 FY17 FY18 Rs bn Strategically expanding upstream activities through inorganic and organic growth opportunities Investment in refining and distribution capacity to bridge the gap between sales volumes and production Expand capacities and improve efficiencies at existing installation and refineries Create opportunities with the manufacture of niche petrochemicals Improve margin and value through facility upgrades Significant Expansion in Upstream and Downstream business to drive future growth
17 17 Improved Financial Performance Net Worth (INR bn) Total Debt / EBITDA x x 1.3x 1.3x FY15 FY16 FY17 FY18 FY15 FY16 FY17 FY18 EBITDA / Interest Total Debt / Equity 27.1x 18.0x 22.7x 17.6x 0.58x 0.58x 0.78x 0.68x FY15 FY16 FY17 FY18 FY15 FY16 FY17 FY18 Stable Earnings and Sound Financial Leverage driving Credit Strength
18 Net Profit (Rs. bn) 18 Networth % Improved Financial Performance PAT (INR Billion)/ Networth (%) FY13 FY14 FY15 FY16 FY17 FY Profit after Tax (Rs. Bn) Networth % Adjusted Debt-Equity Ratio (1) Adjusted Capital Employed (INR Billion) (1) FY14 FY15 FY16 FY17 FY18 Debt: Equity ratio (1) Adjusted for bonds outstanding as on period end Net Worth Borrowings Capital employed FY14 FY15 FY16 FY17 FY Stable Earnings and Sound Financial Leverage driving Credit Strength

 Declaration of Commerciality approved in Operatorship")

19 BPRL s Upstream Story over the years Indonesia entry Joint operator Schedule B Lead operator Russian 22 Acquisition discoveries (cumulative) Declaration of Commerciality approved in Operatorship block Entry in Lower Zakum NELP VI (5 blocks) Brazil & Mozambique acquisition Shale gas entry Australia 2006 Formation of BPRL 2003 Formation of E&P setup in BPCL
 Production 20 MMTPA by Vankor (currently at peak) and 1.2 MMTPA by Taas Country Nos Name of Block PI% 2 TAAS 9.")
20 Upstream Global Spread BPCL through its subsidiary BPRL has Participating Interests in 22 blocks across 6 countries and Equity Participation in Vankor and Taas in Russia Estimated recoverable reserves of about 75 TCF till date in Rovuma basin (Mozambique) Production 20 MMTPA by Vankor (currently at peak) and 1.2 MMTPA by Taas Country Nos Name of Block PI% 2 TAAS 9.86% Russia # 2 Vankorneft 7.88% 26 Exploration Discoveries Block in Appraisal stage Producing Blocks India Cauvery Basin 20 % - 100% Rajasthan 33.3, 100% Cambay 25% Assam-Arakan 20% Mumbai Basin 20,100% Indonesia 1 Nunukan 12.5% 1 BM-C % East Timor 1 JPDA 06/103 20% Brazil* 3 2 BM-SEAL-11 20% BM-POT-16 10% Mozambique 1 Area 1 Offshore 10% Discovery location Israel 1 Block 32 25% UAE^ 1 Lower Zakum 3% Australia 1 EP413 28% * Held through JV with Videocon Ind. # Held through SPVs with OIL & IOCL ^ Held through SPV with ONGC Viesh and IOCL
21 Global Upstream Footprint Partnership with established Oil and Gas operators expected to generate optimal returns for BPCL. Exploration Block NELP IV Within India Operator Indonesia BPCL Stake Partners CY/ONN/2002/2 ONGC 40.0% ONGC NELP VI CY/ONN/2004/2 ONGC 20.0% ONGC NELP VII RJ/ONN/2005/1 NELP IX CB/ONN/2010/11 HOEC, BPRL GAIL, BPRL 33.33% IMC 25.0% EIL, BIFL, MIEL AA/ONN/2010/3 OIL 20.0% ONGC CB-ONN-2010/8 BPRL, GAIL 25.0% EIL, BIFL, MIEL MB-OSN-2010/2 OIL 20.0% HPCL DSF Blocks BPRL 100.0% - Exploration Block Nunukan PSC, Tarakan Basin Operator Pertamina BPCL Stake Partners 12.5% Videocon Industries Exploration Block BM-SEAL-11 (3 blocks) BM-C-30 (1 block) BM-POT-16 (2 blocks) Exploration Block Mozambique Rovuma Basin Exploration Block Brazil Operator Petrobras Anadarko 12.5% Petrobras Mozambique Operator Anadarko 10.0% BPCL Stake 1 Partners 20.0% Videocon Videocon, BP and Maersk 10.0% Videocon, Petrogal, BP BPCL Stake Partners United Arab Emirates Operator Lower Zakum ADNOC 3% PTTEP, Mitsui and Co., ENH, OVL-OIL BPCL Stake 4 Partners CNPC, INPEX, ENI, TOTAL, OVL, IOCL Exploration Block Exploration Block Vankor (2 Blocks) Srednebotuobins koe (2 Blocks) Australia and East Timor Operator JPDA Oilex 20.0% EP-413 Exploration Block Block 32 Norwest Energy Russia Operator Vankorneft 7.89% 2 BPCL Stake Partners GSPC, Videocon, Japan Energy, Pan Pacific Petroleum 27.8% ARC Energy BPCL Stake Partners Rosneft, OIL, IOCL, OVL Rosneft, BP, TYNGD 9.87% 3 OIL, IOCL Israel Operator ONGC Videsh BPCL Stake Partners 25% IOCL, OIL 1. BPCL s effective stake held through 50:50 JV with Videocon. 2. BPCL s effective stake held through its 33% stake in the JV with Oil India and Indian Oil for the 23.9% stake acquisition of JSC Vankorneft (Vankor) 3. BPCL s effective stake held through its 33% stake in the JV with Oil India and Indian Oil for the 29.9% stake acquisition of Tass-Yuryakh Neftegazodobycha (TYNGD) 4. BPCL s effective 21 stake held through SPV with ONGC Videsh & IOCL

 Pvt. Ltd. He has had the distinction of heading three major Business Units viz.")

22 22 Highly Experienced Management Team Mr. D Rajkumar, Chairman & Managing Director 32 years of experience, out of which almost 15 years of board experience as MD of BPCL s JV and subsidiary companies Has experience in marketing, to pipeline projects and across the integrated upstream and downstream oil sector Mr. S. Ramesh, Director Marketing Almost 36 years of industry experience. He also holds a position of Director on the Boards of our JV, Bharat Star Services Pvt. Ltd and Bharat Stars Services (Delhi) Pvt. Ltd. He has had the distinction of heading three major Business Units viz. Lubes, LPG and Retail apart from spearheading Brand, PR & New Initiatives in the Company Mr. R. Ramachandran, Director Refineries Almost 34 years of industry experience He also holds the position of Director on the Board of Bharat Oman Refineries Ltd. and permanent invitee on the Board of Numaligarh Refinery Ltd. Prior to his current position, he held the post of Managing Director, Bharat Oman Refineries Ltd. Has varied experience in Refinery Operations, Product Planning, Technical Services, Project Conceptualization, Project Financing and setting up of grass root Refinery and Revamps. Mr. K Padmakar, Director Human Resources Over 33 years of experience with BPCL He has had experience across HR and ERP functions The Senior Management team has in-depth Knowledge and Extensive Experience in the Oil and Gas industry
23 23 3. Industry Overview Corporate Overview Credit Highlights
24 India Attractive Industry Dynamics Significant potential for domestic O&G companies given low per-capita oil consumption and growing demand. Per Capita Oil Consumption bbl/day per 1,000 People India Oil Demand Million Tonnes India 3 FY China Brazil 15 FY Russia UK 24 FY Germany Australia 42 FY US Singapore 242 FY Diesel Petrol LPG Source: Oil Consumption from BP Statistical Review 2016,Population from World Bank, Estimates 2015 Source: Central Statistics Office / PPAC 24
25 25 Indian Oil Industry Compensation of Under Recoveries Prices of retail sales of LPG and PDS Kerosene Oil are capped by the Government of India (GoI) Under-recoveries determined and compensated provisionally by the GoI on quarterly basis Govt. has consistently compensated OMCs including BPCL for under recoveries and ensured reasonable profitability Positive Policy actions Petrol Prices De-regulated completely Gasoil (Retail) Deregulation announced effective 19 th October 2014 Gasoil Bulk sales completely deregulated since January 2013 Restricted supply/targeted subsidies for cooking fuel products LPG DBTL scheme - Domestic LPG fully enrolled SKO PDS DBTK scheme launched on pilot basis in 4 districts and now implemented in the state of Jharkhand % Sharing of Under Recoveries by OMCs 3.0% 1.5% 0.6% FY13 FY14 FY15 Under-recoveries borne by OMCs have been NIL since FY16 Strategic position in the Indian economy with way to deregulation of fuel sector in the country

26 Thank You
Bharat Petroleum Corporation Ltd.
 Bharat Petroleum Corporation Ltd. Investor Presentation November 2018 2 Disclaimer No information contained herein has been verified for truthfulness completeness, accuracy, reliability or otherwise whatsoever
Bharat Petroleum Corporation Ltd.
 Bharat Petroleum Corporation Ltd. Investor Presentation June 2017 2 Disclaimer No information contained herein has been verified for truthfulness completeness, accuracy, reliability or otherwise whatsoever
Bharat Petroleum Corporation Ltd.
 Bharat Petroleum Corporation Ltd. Investor Presentation November 2016 2 Disclaimer No information contained herein has been verified for truthfulness completeness, accuracy, reliability or otherwise whatsoever
Bharat Petroleum Corporation Ltd.
 Bharat Petroleum Corporation Ltd. Investor Presentation February 2016 2 Disclaimer No information contained herein has been verified for truthfulness completeness, accuracy, reliability or otherwise whatsoever
Hindustan Petroleum Corporation Limited (HPCL) Global Fortune 500
 Global Fortune 500") Hindustan Petroleum Corporation Limited (HPCL) is a Global Fortune 500 company, ranked at 260 and engaged in business of refining & marketing of petroleum products in India. During the year ended 31 st
Hindustan Petroleum Corporation Limited (HPCL) is a Global Fortune 500 company, ranked at 260 and engaged in business of refining & marketing of petroleum products in India. During the year ended 31 st
Ready Reckoner Snapshot of India s Oil & Gas data March, 2014 Petroleum Planning & Analysis Cell
 Ready Reckoner Snapshot of India s Oil & Gas data March, 2014 Petroleum Planning & Analysis Cell (Ministry of Petroleum & Natural Gas) 0 Index of Tables Table Description Page 1. Selected Indicators of
Ready Reckoner Snapshot of India s Oil & Gas data July, 2014 Petroleum Planning & Analysis Cell
 Ready Reckoner Snapshot of India s Oil & Gas data July, 2014 Petroleum Planning & Analysis Cell (Ministry of Petroleum & Natural Gas) 0 Index of Tables Table Description Page Highlights 2 1. Selected Indicators
Refineries, Product Market and Capacity Expansion Opportunities and Outlook in India- 2018
 Refineries, Product Market and Capacity Expansion Opportunities and Outlook in India- 2018 Examining the market expansion trends for petrochemical industry in India and the scope of business E-REP Market
Indraprastha Gas Limited
 Indraprastha Gas Limited Corporate Presentation August 2005 CNG for Clean & Green Environment 1 Agenda Overview of Indian Oil & Gas Sector CNG and PNG Business in India Indraprastha Gas Critical Success
Formosa Petrochemical Corporation 2006 Q3 Financial Results
 Formosa Petrochemical Corporation 26 Q3 Financial Results November 26 Index Our Company 2 Financials 3 Refinery Division 4 Olefins Division 5 Capital Expansion 2 Our Company: Leading Private Integrated
2015 Interim Results Announcement
 China Petroleum & Chemical Corporation 2015 Interim Results Announcement August 27, 2015 Hong Kong Cautionary Statement This presentation and the presentation materials distributed herein include forward-looking
PERSPECTIVES FOR THE BRAZILIAN REFINING INDUSTRY
 PERSPECTIVES FOR THE BRAZILIAN REFINING INDUSTRY Jorge Celestino Refining & Natural Gas Executive Director 24.10.2016 Transformations facing the oil industry Changes in the competitive scenario: shale
2010 Interim Results Presentation. August 23, 2010 Hong Kong
 Sinopec Corp. 21 Interim Results Presentation August 23, 21 Hong Kong Disclaimer i This presentation and the presentation materials distributed herein include forwardlooking statements. All statements,
Fossil Fuel Subsidies in India: The Case for Rationalizing Petroleum Product Prices*
 Fossil Fuel Subsidies in India: The Case for Rationalizing Petroleum Product Prices* 8 th March 2011 Anmol Soni TERI * This presentation is a summary of a larger policy paper being prepared by the Centre
Bitumen Market & Outlook in India. Subroto Das Head : Bitumen & Fuels Hindustan Petroleum Corporation Limited India
 Bitumen Market & Outlook in India Subroto Das Head : Bitumen & Fuels Hindustan Petroleum Corporation Limited India Oil & Gas Industry Landscape Oil Sector in India: Salient aspects in 2016 India is the
Q Analyst Teleconference. 9 August 2018
 9 August 218 Disclaimer This presentation contains forward-looking statements that reflect the Company management s current views with respect to certain future events. Although it is believed that the
Continued strong performance in key businesses
 Continued strong performance in key businesses SECOND QUARTER PRELIMINARY RESULTS August 9, Disclaimer "This presentation and the associated slides and discussion contain forward-looking statements. These
Valvoline Fourth-Quarter Fiscal 2016 Earnings Conference Call. November 9, 2016
 Valvoline Fourth-Quarter Fiscal 2016 Earnings Conference Call November 9, 2016 Forward-Looking Statements This presentation contains forward-looking statements within the meaning of Section 27A of the
Oil Refineries Ltd. Fourth Quarter and Full Year 2011 Results. March 2012
 Oil Refineries Ltd. Fourth Quarter and Full Year 21 Results March 22 1 Disclaimer This presentation has been prepared by Oil Refineries Ltd. (the "Company") as a general presentation of the Company and
April Título da apresentação DD.MM.AAAA
 Aquisition of Shell Argentina downstream assets April 2018 Título da apresentação DD.MM.AAAA DISCLAIMER This presentation contains estimates and forward-looking statements regarding our strategy and opportunities
Media Interaction. 28 th September 2018
 Media Interaction 28 th September 2018 Petchem Refinery E&P ONGC portfolio consists of strong performers Selected portfolio companies Domestic NOC contributes 73% of India s Oil & Gas production Overseas
Q3 and Q1-Q3Q preliminary results
 MOL Hungarian Oil and Gas Company Q3 and Q1-Q3Q3 2005 preliminary results November 11,, 2005 Disclaimer "This presentation and the associated slides and discussion contain forward-looking statements. These
Roadshow Presentation
 Roadshow Presentation June 2, Wilfried Trepels, CFO 1 SAF-HOLLAND - Components Fifth Wheels Kingpins Suspensions Landing Gear Axle Systems 2 SAF-HOLLAND - Business Units Trailer Systems Powered Vehicle
PROTELINDO PT. SARANA MENARA NUSANTARA, Tbk. (TOWR) Indonesia s Premier Tower Company 1Q 2015 Results Presentation
 Indonesia s Premier Tower Company 1Q 2015 Results Presentation") PROTELINDO PT. SARANA MENARA NUSANTARA, Tbk. (TOWR) Indonesia s Premier Tower Company 1Q 2015 Results Presentation Disclaimer These materials have been prepared by PT Sarana Menara Nusantara, Tbk. (the
PROTELINDO PT. SARANA MENARA NUSANTARA, Tbk. (TOWR) Indonesia s Premier Tower Company 1Q 2015 Results Presentation Disclaimer These materials have been prepared by PT Sarana Menara Nusantara, Tbk. (the
Gabriel India Ltd Result Update Presentation
 Customer Relationships Quality Research & Development Successful Growth Gabriel India Ltd Result Update Presentation Q3 FY19 Safe Harbor This presentation and the accompanying slides (the Presentation
Proposed acquisition of Areva Distribution. December 2, 2009
 Proposed acquisition of Areva Distribution December 2, 2009 Disclaimer All forward-looking statements are Schneider Electric management s present expectations of future events and are subject to a number
3 rd Quarter 2017 Results
 Inside your life! 3 rd Quarter 2017 Results October 25, 2017 Mobile Automotive Display Semiconductor IoT LED Contents Ⅰ. Q3 2017 Earnings Summary Ⅱ. Earnings Highlight & Outlook Ⅲ. Results & Outlook by
FISCAL YEAR END MARCH 2013 FIRST HALF FINANCIAL RESULTS. New Mazda6 (Atenza)
") FISCAL YEAR END MARCH 2013 FIRST HALF FINANCIAL RESULTS New Mazda6 (Atenza) Mazda Motor Corporation October 31, 2012 1 PRESENTATION OUTLINE Highlights Fiscal Year March 2013 First Half Results Fiscal Year
FISCAL YEAR END MARCH 2013 FIRST HALF FINANCIAL RESULTS New Mazda6 (Atenza) Mazda Motor Corporation October 31, 2012 1 PRESENTATION OUTLINE Highlights Fiscal Year March 2013 First Half Results Fiscal Year
2010 Annual Results Announcement
 2010 Annual Results Announcement March 2011 1 Disclaimer These materials have been prepared by China ZhengTong Auto Services Holdings Limited ( ZhengTong Auto or The Company, together with its subsidiaries,
Pitti Laminations Limited. Q4 and FY2017 Earnings Presentation
 Pitti Laminations Limited (BSE: 513519, NSE: PITTILAM) Q4 and FY2017 Earnings Presentation 18 May 2017 Disclaimer This presentation contains statements that contain forward looking statements including,
Respect for customers, partners and staff. Service: another name for the respect that a company owes its customers, partners and staff.
 Respect for customers, partners and staff Service: another name for the respect that a company owes its customers, partners and staff. Vehicle glass KEY FIGURES (in EUR million) 2004 2003 % change Total
Mozambique Gas Master Plan: GTL Plant Project
 Mozambique Gas Master Plan: GTL Plant Project by Bongani Sayidini Regional Manager: East Africa PetroSA Maputo, Mozambique, 19 August 2013 1 1 Introduction This Session will focus on GTL Technology as
Business opportunities and major projects in India
 Business opportunities and major projects in India Rajesh Sharma Vice President, Financing Why India? Fastest growing economy now and in future India to become one of the world's three largest economies
Nove b m er 21, Yun K Kan g Jessie i Y Yoh
 Energy for tomorrow November 21, 2008 Yun Kang Jessie Yoh Industry Overview Company Overview Thesis Analysis Risks Q & A AGENDA WHY CONOCO? Leader in refining process provides natural hedge against falling
HPCL-Mittal Energy Limited
 Energising a Brighter Tomorrow HPCL-Mittal Energy Limited Corporate Profile Company Overview Hindustan Petroleum Corporation Ltd Mittal Energy Investments Pte Ltd, Singapore 49% 49% HPCL A Navratna Public
Bernstein Strategic Decisions Conference 2018
 Bernstein Strategic Decisions Conference 2018 Forward-Looking Statements Certain statements in this presentation, other than statements of historical fact, including estimates, projections, statements
Sinopec Corp. Q Results Announcement. 29 October 2010
 Sinopec Corp. Q3 2010 Results Announcement 29 October 2010 Disclaimer i As required by the CSRC, financial statements of the third quarter of Sinopec Corp. (the Company ) were prepared under PRC Accounting
Annual Press Conference 2011 Results
 Annual Press Conference 2011 Results Dr. Dieter Zetsche Chairman of the Board of Management Head of Mercedes-Benz Cars February 09, 2012 2 Last year s outlook Daimler results in 2011 Set all-time sales
FISCAL YEAR MARCH 2014 FIRST HALF FINANCIAL RESULTS. New Mazda Axela (Overseas name: New Mazda3)
") FISCAL YEAR MARCH 2014 FIRST HALF FINANCIAL RESULTS New Mazda Axela (Overseas name: New Mazda3) Mazda Motor Corporation October 31, 2013 1 PRESENTATION OUTLINE Highlights Fiscal Year March 2014 First Half
FISCAL YEAR MARCH 2014 FIRST HALF FINANCIAL RESULTS New Mazda Axela (Overseas name: New Mazda3) Mazda Motor Corporation October 31, 2013 1 PRESENTATION OUTLINE Highlights Fiscal Year March 2014 First Half
Petrochemicals: Opportunities and Challenges
 Petrochemicals: Opportunities and Challenges Sandeep Poundrik Joint Secretary (Refineries) Ministry of Petroleum & Natural Gas 5 th October, 2018 1 Petrochemical Growth World scenario mmboe: million barrels
CONFERENCE CALL RESULTS Q1 2017
 CONFERENCE CALL RESULTS Q1 2017 May 5, 2017 Marc Bunz (CFO) Nicolas-Fabian Schweizer (CTO) AGENDA Market & Strategy Update Financials 2016 Financials Q1 2017 Outlook SCHWEIZER Share Schweizer Electronic
WashTec AG Baader Bank Investment Conference Karoline Kalb WashTec AG
 WashTec AG Baader Bank Investment Conference 2017 Karoline Kalb WashTec AG What do they have in common? 2 WashTec AG BIC Carwash is an attractive business model around the globe Market drivers Consumer
3Q 2016 Analyst Presentation
 3Q 2016 Analyst Presentation November 18, 2016 This presentation includes forward-looking statements. Actual future conditions (including economic conditions, energy demand, and energy supply) could differ
COMMERCIALISATION OF UGANDA S OIL AND GAS SECTOR: REFINERY AND ATTENDANT INFRASTRUCTURE DEVELOPMENT
 MINISTRY OF ENERGY AND MINERAL DEVELOPMENT COMMERCIALISATION OF UGANDA S OIL AND GAS SECTOR: REFINERY AND ATTENDANT INFRASTRUCTURE DEVELOPMENT Dr. Stephen Robert Isabalija PERMANENT SECRETARY 13 th -15
2015 Annual Results Announcement
 China Petroleum & Chemical Corporation 2015 Annual Results Announcement March 30, 2016 Hong Kong Disclaimer This presentation and the presentation materials distributed herein include forward-looking statements.
1QFY2018 Financial Results. Quarter Ended 30 June 2017
 1QFY2018 Financial Results Quarter Ended 30 June 2017 Disclaimer This presentation is not and does not constitute an offer, invitation, solicitation or recommendation to subscribe for, or purchase, any
Presentation plan. Analyst meet/oct 03
 WELCOME Presentation plan 1. Global two wheeler scenario 2. Two wheeler industry in India 3. TVS Motor performance 4. Key initiatives / achievements 5. Future plans 2 1. Global two wheeler scenario 3 Global
Analyst Presentation 1Q 2008 Results
 Analyst Presentation 1Q 2008 Results 0 Contents Section 1: Section 2: Section 3: Section 4: Section 5: Company Overview IPO Update Operating Performance Consolidated Financial Performance Dividend Update
Target October (Month) April-October (Cumulative) (Apr- Mar)
 April-October (Cumulative) (Apr- Mar)") Government of India Ministry of Petroleum and Natural Gas Economic & Statistics Division ****** New Delhi Dated the 21 st November, 2017 Monthly Production Report October, 2017 Crude Oil 1. Crude oil 1
Government of India Ministry of Petroleum and Natural Gas Economic & Statistics Division ****** New Delhi Dated the 21 st November, 2017 Monthly Production Report October, 2017 Crude Oil 1. Crude oil 1
Increase of the sales by 33% mainly due to the Safelite acquisition
 36 - Vehicle Glass Repair and Replacement Increase of the sales by 33% mainly due to the Safelite acquisition 37 Key events in Vehicle Glass Repair and Replacement January 2007 The launch in the UK of
Financial Statements Matti Lievonen, President & CEO 7 February 2017
 Financial Statements 2016 Matti Lievonen, President & CEO Agenda 1 2 3 4 Year 2016 Financials 2016 Segment reviews Current topics 5 Appendix 2 Disclaimer The following information contains, or may be deemed
Pitti Laminations Limited
 Pitti Laminations Limited (BSE: 513519, NSE: PITTILAM) Q3 FY2016 Earnings Presentation 12 February 2016 Cautionary Statement This presentation contains statements that contain forward looking statements
Mazda Motor Corporation June 17, 2011
 FY ENDING MARCH 2012 FINANCIAL FORECAST New MAZDA Demio 13-SKYACTIV Mazda Motor Corporation June 17, 2011 1 PRESENTATION OUTLINE FY ending March 2012 Forecast Updates of Framework for Medium- and Long-term
Pakistan Refining Industry An Overview
 Pakistan Refining Industry An Overview October 2016 Oil World Crude Oil Reserves Largely sustained level of reserves Largest Region Contributes 47% (2014: 47.2%) Global proven oil reserves in 2015 fell
Cosmo Oil Co., Ltd. Presentation on Results for First Quarter of Fiscal 2012 August 2, 2012 Director: Satoshi Miyamoto
 Cosmo Oil Co., Ltd. Presentation on Results for First Quarter of Fiscal 2012 August 2, 2012 Director: Satoshi Miyamoto Copyright 2012 COSMO OIL CO.,LTD. All Rights Reserved. Key Points of Financial Results
The Indian Infrastructure Industry
 n The Indian Infrastructure Industry DIBD OMII Own Man In India October 2010 Introduction to the Indian Infrastructure Industry Macro level Key drivers Government initiatives Future projects Danish infrastructural
US$82,814m. Total assets. US$3,403m. Net debt. By Sector # US$411m Property. US$157m Insurance broking & financial services.
 Jardine Matheson Group Profile 2018 Jardine Matheson Holdings Limited 2017 Financial Highlights * US$83,808m Gross revenue US$4,378m Underlying profit before tax + US$82,814m Total assets 444,000 People
Financing New Technologies for Infrastructure and Cities Dr. Detlef Pohl (Corporate VC) Managing Partner Siemens Financial Services, Venture Capital
 Managing Partner Siemens Financial Services, Venture Capital") October 15 th 2013 Financing New Technologies for Infrastructure and Cities Dr. Detlef Pohl (Corporate VC) Managing Partner Siemens, Venture Capital Agenda 1 Cities and investment needs 2 Criteria for
October 15 th 2013 Financing New Technologies for Infrastructure and Cities Dr. Detlef Pohl (Corporate VC) Managing Partner Siemens, Venture Capital Agenda 1 Cities and investment needs 2 Criteria for
VGI Global Media Plc. 2015/16 Earnings Presentation 16 May 2016
 VGI Global Media Plc 2015/16 Earnings Presentation 16 May 2016 Disclaimer Investment involves risk. Prospective should understand the characteristics of Securities and study information about VGI Global
Doing business with Petrobras - Procurement Strategies and Local Content. Policy.
 Doing business with Petrobras - Procurement Strategies and Local Content Ronaldo M. L. Martins, M.Sc. Market Development, Manager Procurement Department March/2015 Policy. Disclaimer FORWARD-LOOKING STATEMENTS
4 th April, 2018 I Industry Research
 April'17 May'17 June'17 July'17 August'17 September'17 October'17 November'17 December'17 January'18 February'18 March'18 A case for including Petrol and Diesel under GST? Contact: Madan Sabnavis Chief
ENEL PUBLISHES 2018 SECOND QUARTER AND FIRST HALF GROUP OPERATING DATA REPORT
 Media Relations Investor Relations T +39 06 8305 5699 T +39 06 8305 7975 F +39 06 8305 3771 F +39 06 8305 7940 ufficiostampa@enel.com investor.relations@enel.com enel.com enel.com ENEL PUBLISHES 2018 SECOND
3QFY2018 Financial Results. Quarter Ended 31 December 2017
 3QFY2018 Financial Results Quarter Ended 31 December 2017 Disclaimer This presentation is not and does not constitute an offer, invitation, solicitation or recommendation to subscribe for, or purchase,
Target December (Month) April-December (Cumulative) (Apr- Mar)
 April-December (Cumulative) (Apr- Mar)") Government of India Ministry of Petroleum and Natural Gas Economic & Statistics Division ****** New Delhi Dated the 19 th January, 2018 Monthly Production Report December, 2017 Crude Oil 1. Crude oil 1
Government of India Ministry of Petroleum and Natural Gas Economic & Statistics Division ****** New Delhi Dated the 19 th January, 2018 Monthly Production Report December, 2017 Crude Oil 1. Crude oil 1
Downstream & Chemicals
 Downstream & Chemicals Pierre Breber Executive Vice President 017 Chevron Corporation Downstream portfolio Fuels refining & marketing Integrated value chains Lubricants & additives Globally positioned
Media Release. Strong growth driven by significant demand in key export markets & Increase in new value added products
 Media Release Strong growth driven by significant demand in key export markets & Increase in new value added products Q3 FY17 Revenue at Rs. 26.6 crore, YoY growth of 63% Q3 FY17 EBITDA at Rs. 5.0 crore,
Presentation to SANEC Technology as the core to progress. March 2014 Henk Dijkgraaf Berthold Breman
 Presentation to SANEC Technology as the core to progress March 2014 Henk Dijkgraaf Berthold Breman sasol at a glance An integrated energy and chemicals company with 33,000 employees worldwide The world
YULON MOTOR CO., LTD. Investor Conference
 TW:2201 YULON MOTOR CO., LTD. Investor Conference 2017/11/23 人 車 生活 Disclaimer Statement 1. This document is provided by Yulon Motor Co., Ltd. (the Company"). Except for the numbers and information included
FISCAL YEAR END MARCH 2013 FIRST QUARTER FINANCIAL RESULTS
 FISCAL YEAR END MARCH 213 FIRST QUARTER FINANCIAL RESULTS New MAZDA CX-5 Mazda Motor Corporation July 31, 212 1 PRESENTATION OUTLINE Highlights Fiscal Year End March 213 Results Update of Structural Reform
Operational flexibility for Indian Refiners
 The Growing Prominence of Asian Refining Plenary Session Operational flexibility for Indian Refiners 7 th December, 2016 PetroTech, New Delhi Sanjiv Singh Director (Refineries), Indian Oil Corporation
Downstream Petroleum Sector The Growing Prominence of Asian Refining
 Downstream Petroleum Sector The Growing Prominence of Asian Refining Mr. Fahad Al-Dihani Deputy CEO,MAA Refinery, Kuwait National Petroleum Company-Kuwait Outline.. Global refining trends Kuwait s Position
Indraprastha Gas Limited
 Indraprastha Gas Limited Corporate Presentation January 2005 Agenda Overview of Indian Oil & Gas sector Overview of Gas sector CNG and PNG business in India Indraprastha Gas Critical Success Factors Opportunity
Empresa Nacional del Petróleo 1Q 2013 Results
 Empresa Nacional del Petróleo 1Q 2013 Results Santiago, May 2013 1 Disclaimer Forward-looking statements are based on the beliefs and assumptions of ENAP s management and on information currently available
Unit-wise production details with reasons for shortfall have been given in following subsections:
 Government of India Ministry of Petroleum and Natural Gas Economic & Statistics Division ****** New Delhi Dated the May, 2017 Monthly Production Report April 2017 Crude Oil 1. Crude oil production 1 during
Empresa Nacional del Petróleo. 2Q 2012 Financial Results
 Empresa Nacional del Petróleo 2Q 2012 Financial Results Disclaimer Forward-looking statements are based on the beliefs and assumptions of ENAP s management and on information currently available to the
GROUP PRESENTATION. Milan, March 27 th &28 th 2012 SOGEFI GROUP
 GROUP PRESENTATION Milan, March 27 th &28 th 2012 1 PARIS, March OCTOBER 27 & 28 2012 11th WORLD LEADER Sogefi is a world leader in the design and manufacturing of engine filtration, air intake and cooling
JAGUAR LAND ROVER RESULTS FOR THE THREE MONTHS ENDED 31 DECEMBER th FEBRUARY 2017
 JAGUAR LAND ROVER RESULTS FOR THE THREE MONTHS ENDED 31 DECEMBER 2016 14 th FEBRUARY 2017 DISCLAIMER Statements in this presentation describing the objectives, projections, estimates and expectations of
Petroleum Planning & Analysis Cell
 MONTHLY REPORT ON INDIGENOUS CRUDE OIL PRODUCTION, IMPORT AND PROCESSING & PRODUCTION, IMPORT AND EXPORT OF PETROLEUM PRODUCTS November 2017 Petroleum Planning & Analysis Cell (Ministry of Petroleum &
1. Introduction Regional Analysis...4
 Table of Contents i Table of Contents 1. Introduction...1 1.1 Opportunities for international manufacturers...1 1.2 Objectives and structure of this report...2 2. Regional Analysis...4 2.1 Description
FISCAL YEAR MARCH 2018 FIRST HALF FINANCIAL RESULTS
 FISCAL YEAR MARCH 2018 FIRST HALF FINANCIAL RESULTS PRESENTATION OUTLINE Highlights Fiscal Year March 2018 First Half Results Fiscal Year March 2018 Full Year Forecast Progress of Key Initiatives/ Business
Q3 & 9M 2018 Results Presentation. October 24 th, 2018
 Q3 & 9M 2018 Results Presentation October 24 th, 2018 Q3 & 9M HIGHLIGHTS & CATEGORY SPOTLIGHTS Gonzalve BICH 3Q and 9M 2018 Results Presentation 2 9 Months 2018 Key Messages Continued challenging trading
Tanker Market Outlook
 Tanker Market Outlook 4 th Maritime Indonesia Simon Chattrabhuti, Director, Head of Tanker Market Analysis Jakarta, 22 March 212 Disclaimer THIS PRESENTATION IS CONFIDENTIAL AND IS SOLELY FOR THE USE OF
FISCAL YEAR MARCH 2014 FINANCIAL RESULTS
 FISCAL YEAR MARCH 214 FINANCIAL RESULTS Mazda CX-5 Mazda Atenza Mazda Motor Corporation April 25, 214 New Mazda Axela 1 PRESENTATION OUTLINE Highlights Fiscal Year March 214 Results Fiscal Year March 215
IndianOil Performance:
 IndianOil Performance: 2011-12 New Delhi, May 28 th, 2012: Indian Oil Corporation Ltd. (IndianOil) is a Maharatna Company and the nation s largest commercial enterprise. Ranked at 98, it is also the highest
Downstream. Mike Wirth. Executive Vice President Downstream Chevron Corporation
 Downstream Mike Wirth Executive Vice President Downstream What We Delivered in 2006 Base Business Record safety Record utilization Record energy efficiency Record earnings - $4 Billion Selective Growth
Indian Automotive and Industrial Lubricants Market: Trends & Opportunities ( ) June 2014
 June 2014") Indian Automotive and Industrial Lubricants Market: Trends & Opportunities (2014-2019) June 2014 Scope of the Report The report titled Indian Automotive and Industrial Lubricants Market: Trends & Opportunities
Indian Automotive and Industrial Lubricants Market: Trends & Opportunities (2014-2019) June 2014 Scope of the Report The report titled Indian Automotive and Industrial Lubricants Market: Trends & Opportunities
FISCAL YEAR MARCH 2015 FIRST HALF FINANCIAL RESULTS. New Mazda Demio
 FISCAL YEAR MARCH 2015 FIRST HALF FINANCIAL RESULTS New Mazda Demio Mazda Motor Corporation October 31, 2014 1 PRESENTATION OUTLINE Highlights Fiscal Year March 2015 First Half Results Fiscal Year March
Jointly towards a long term sustainable energy supply
 Jointly towards a long term sustainable energy supply Lars G. Josefsson, CEO Vattenfall, CEO Nuon 23 February 2009 Agenda Nuon & Vattenfall: a great partnership Rationale for Nuon Rationale for Vattenfall
FISCAL YEAR MARCH 2018 FIRST QUARTER FINANCIAL RESULTS
 FISCAL YEAR MARCH 2018 FIRST QUARTER FINANCIAL RESULTS PRESENTATION OUTLINE Highlights Fiscal Year March 2018 First Quarter Results Fiscal Year March 2018 Full Year Forecast Structural Reform Stage 2 Progress
DISCLAIMER. Indofood Agri Resources Ltd.
 INTEGRATED PLANTATION WITH LEADING BRANDS Company Presentation Q 2008 Results 29 April 2008 DISCLAIMER This presentation was prepared solely and exclusively for the parties presently being invited for
Business Opportunities downstream. Hellenic Petroleum s perspective
 Business Opportunities downstream Hellenic Petroleum s perspective 9 th SE Europe Energy Dialogue Thessaloniki, Greece 29-30 June 2016 Daniil Antonopoulos Thessaloniki Refinery Operations Manager Hellenic
PT Astra International Tbk 2011 Full Year Financial Statements
 To: Business Editor For immediate release PT Astra International Tbk 2011 Full Year Financial Statements The following announcement was issued today by the Company s 71%-owned subsidiary, Jardine Cycle
RESULTS FOR Q ANALYST TELECONFERENCE
 RESULTS FOR Q4 216 ANALYST TELECONFERENCE Market 1 2 Operation Financials 3 Market 1 216 Fourth Quarter Market Conditions Product Market Crude Oil Postponed Maintenances Started to take place High Agricultural
Performance of Wipro Limited for Quarter and Year ended - March 31, 2013
 Performance of Wipro Limited for Quarter and Year ended - March 31, 2013 Suresh Senapaty Executive Director and Chief Financial Officer April 19, 2013 1 Financial Summary for the Year Ended March 31, 2013
Refineries Table of Contents
 Refineries Dec 18 Refineries Table of Contents Refineries Table of Contents Contents: Page # National Fuel Consumption Product Wise 3 Demand and Supply POL Products 4 Local Refineries POL Volume Sales
GAZPROM NEFT TODAY FEBRUARY 2017
 GAZPROM NEFT TODAY FEBRUARY 2017 ABOUT GAZPROM NEFT KEY PERFORMANCE INDICATORS 2016 TITLE 1,514 mtoe proven hydrocarbon reserves (SPE(PRMS)) 86.2 mtoe of hydrocarbon production 41.89 mt refining volumes
1 st Half 2018 Results. August 1 st, 2018
 1 st Half 2018 Results August 1 st, 2018 H1 HIGHLIGHTS & CATEGORY SPOTLIGHTS Gonzalve BICH 2 First Half 2018 Key Messages Challenging market and business environment Continued investment in targeted Brand
BEFORE IT ALL BEGAN. Osagyefo unveils the plaque to mark the opening of GHAIP
 Osagyefo unveils the plaque to mark the opening of GHAIP BEFORE IT ALL BEGAN Prior to the construction of the refinery, Ghana imported petroleum products from European and American refineries to meet its
~In March 2016, EML declared and paid an interim dividend of 1000%
 For Immediate Release: Motors Limited (EML) announces its best ever financial results for twelve month period ending 31st, ~For the consolidated business for the twelve month period ending 31,, EML posted
First in Mind First in Choice. Capital Markets Day 2006 Gunnar Brock, President and CEO
 First in Mind First in Choice Capital Markets Day 26 Gunnar Brock, President and CEO 1 December 4, 26 www.atlascopco.com Atlas Copco in a Snapshot Continuing operations A world leading provider of industrial