Manitoba. Population Report June 1, Manitoba Health, Healthy Living and Seniors
|
|
|
- Marian McDowell
- 5 years ago
- Views:
Transcription
1 Manitoba Health, Healthy Living and Seniors Population Report June 1, 2015 Manitoba Population Report June 1, 2015 Manitoba Health, Healthy Living and Seniors
2 Manitoba Health, Healthy Living and Seniors Population Report June 1, 2015 Manitoba Health, Healthy Living and Seniors Population Report June 1, 2015 Inquiries can be directed to: Manitoba Health, Healthy Living and Seniors Health Information Management Branch Room Carlton Street Winnipeg Manitoba R3B 3M9 Telephone: (204)
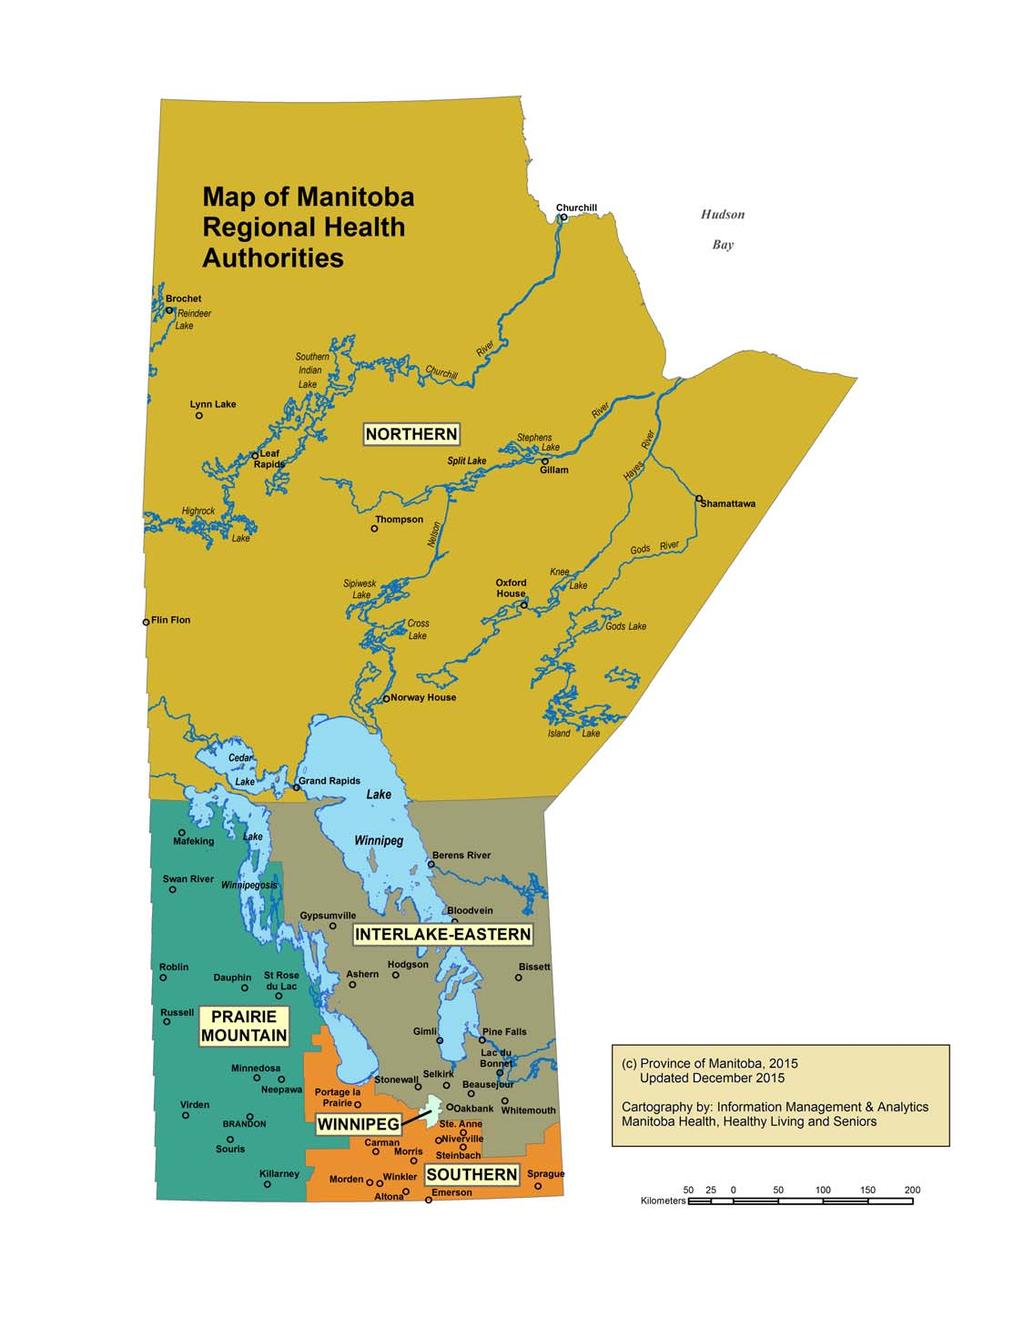
3 Manitoba Health, Healthy Living and Seniors Population Report June 1, Population Publication Report - Contents 1 Introduction Foreword Population Changes June 1, 2014 to June 1, 2015 Deaths by Age (Fig. 1a) Deaths by Age and Gender (Fig. 1b and 1c) Migration In and Out of the Province by Age (Fig. 2a) Migration In and Out of the Province by Age and Gender (Fig. 2b and 2c) 2 Population of Manitoba June 1, 2015 Population of Manitoba by Age and Gender Population of Manitoba by Age (Fig. 3a) Population of Manitoba by Age and Gender (Fig. 3b and 3c) Map of Manitoba RHA Boundaries (Fig. 4) Population of Manitoba by RHA, Age, and Gender Population of Manitoba First Nations, by RHA, Age and On/Off Reserve Status Population of Manitoba by RHA, Percent of Population by RHA, 2011 and 2015 (Fig. 5) Population of Manitoba by RHA (Age 65+), Percent of Population by RHA (Age 65+), (Fig. 6) 3 Population of Regional Health Authorities June 1, 2015 Interlake-Eastern RHA Population by District, Age, and Gender Population by District, Population by District (Age 65+), Population by Municipality, Age, and Gender Population by Municipality, Population by Municipality (Age 65+), Northern Health Authority Population by District, Age, and Gender Population by District, Population by District (Age 65+), Population by Municipality, Age, and Gender Population by Municipality, Population by Municipality (Age 65+), Prairie Mountain Health Population by District, Age, and Gender Population by District, Population by District (Age 65+), Population by Municipality, Age, and Gender Population by Municipality, Population by Municipality (Age 65+),
4 Manitoba Health, Healthy Living and Seniors Population Report June 1, Manitoba Population by RHA June 1, 2015 (cont.) Southern Health-Santé Sud Population by District, Age, and Gender Population by District, Population by District (Age 65+), Population by Municipality, Age, and Gender Population by Municipality, Population by Municipality (Age 65+), Winnipeg RHA Map of Winnipeg Community Area Boundaries (Figure 7) Population by Community Area, Neighborhood Cluster, Age, and Gender Population by Municipality, Age, and Gender Population by Municipality, Population by Municipality (Age 65+), Appendix
5 Manitoba Health, Healthy Living and Seniors Population Report - June 1, 2015 Part 1 Manitoba Population Report 2015 Introduction and Overview
6 Manitoba Health, Healthy Living and Seniors Population Report June 1, 2015 FOREWORD The population data shown in this report are based on records of residents registered with Manitoba Health as at June 1, Data for the regions include population of cities, towns, villages, rural municipalities, local government districts, and unorganized territories. It should be noted that villages and towns are separately identified if these are incorporated. If unincorporated, the population counts are included in the rural municipality in which these are located. Population for small areas (for example, a rural town) can be biased because the mailing address may be reported as the place of residence. An individual residing outside the town, but having a mailing address there, may be counted as living within the town. This bias in the population figures is reduced as the catchment area increases. Thus, regional estimates are not significantly affected by the mis-classification bias. Fluctuations from year to year for these small areas might also be affected by changes to mail delivery locations assigned by Canada Post. The type of place indicates First Nations, unorganized territory, and municipal status of incorporated places (city, town, village, rural municipality, and local government district). The following list indicates the abbreviations used for types of places: FN LGD R.H.A. RM First Nation Band Local Government District - a designated area having no local government; administered by the province through a resident administrator. Regional Health Authority Rural Municipality POPULATION REPORTING CHANGES Internal improvements affecting population reporting have enabled more appropriate identification of on-reserve residents of some First Nations communities as of 2012 and again as of Please note that the 2015 improvements in identification of on-reserve residents have been applied retrospectively to the 2014 and 2013 population reports, because the improvements have a significant effect on certain 2013 and 2014 populations in these reports. Current-year and five-year populations for RHA Districts were tabulated using the RHA District definitions current as of June 1 st, MUNICIPAL AMALGAMATIONS A series of municipal amalgamations, which were enacted between November 2013 and May 2014, came into effect as of January 1 st, The 2015 population reports use the amalgamated municipalities, because these municipalities are the municipalities defined at the population date. To assist in the transition to reporting on the populations of the the amalgamated municipalities, however, we are also providing populations by pre-amalgamation municipality as an appendix to these reports.
7 Manitoba Health, Healthy Living and Seniors Population Report June 1, 2015 Population Changes The purpose of this section is to highlight changes in the population of Manitoba. Changes are determined by comparing the registration file for the current year to that of the previous year. A file is created for additions (residents on the current file but not on the previous file) and one for deletions (residents on the previous file and not on the current file). After determining reason for coverage or cancellation, those coded as deaths, births and other(1) are separated, leaving only arrivals and departures. The deletions are subtracted from the additions with a resulting net migration. Figures 1a, 1b, and 1c depict the actual number of residents cancelled from the registration system upon notification of death during the period June 1, 2014 to June 1, Figures 1b and 1c are female and male profiles. Figures 2a, 2b, and 2c represent population migration. In-migration and outmigration with a resulting net migration trend line are depicted. Manitoba gained population through in-migration between June 1, 2014 and June 1, There were 30,214 in-migrants and 14,931 out-migrants resulting in a net in-migration of 18,823. Figures 2b and 2c are the female and male trends. (1) Member of the Armed Forces, inmate of a penitentiary, or not located.
8 Manitoba Health, Healthy Living and Seniors Population Report, June 1, 2015 Figure 1a Number of Deaths by Single Year of Age - June 1, 2014 to June 1, Figure 1b Number of Female Deaths by Single Year of Age - June 1, 2014 to June 1, Figure 1c Number of Male Deaths by Single Year of Age - June 1, 2014 to June 1,
9 Manitoba Health, Healthy Living and Seniors Population Report, June 1, 2015 Figure 2a Total Migration In and Out of the Province and Net Migration by Single Year of Age - June 1, 2014 to June 1, In Migration Net Migration Out Migration Figure 2b Migration In and Out of the Province and Net Migration of Females by Single Year of Age - June 1, 2014 to June 1, In Migration Net Migration Out Migration Figure 2c Migration In and Out of the Province and Net Migration of Males by Single Year of Age - June 1, 2014 to June 1, In Migration Net Migration Out Migration
10 Manitoba Health, Healthy Living and Seniors Population Report - June 1, 2015 This page intentionally left blank
11 Manitoba Health, Healthy Living and Seniors Population Report - June 1, 2015 Part 2 Population of Manitoba June 1, 2015
12 Population of Manitoba by single year of age and gender Age Total Male Female Under 1 16,641 8,597 8, ,677 8,641 8, ,963 8,758 8, ,628 8,494 8, ,780 8,656 8,124 Sub-Total 83,689 43,146 40, ,163 8,708 8, ,226 8,711 8, ,142 8,796 8, ,777 8,513 8, ,106 8,266 7,840 Sub-Total 84,414 42,994 41, ,811 8,122 7, ,028 8,132 7, ,910 8,214 7, ,946 8,290 7, ,260 8,381 7,879 Sub-Total 79,955 41,139 38, ,754 8,617 8, ,780 8,682 8, ,890 8,732 8, ,502 9,043 8, ,529 9,537 8,992 Sub-Total 86,455 44,611 41, ,171 9,899 9, ,429 10,136 9, ,033 9,727 9, ,696 10,079 9, ,706 9,966 9,740 Sub-Total 97,035 49,807 47, ,531 9,904 9, ,619 9,402 9, ,113 8,993 9, ,380 9,190 9, ,411 9,134 9,277 Sub-Total 93,054 46,623 46, ,291 9,084 9, ,235 9,073 9, ,059 8,976 9, ,827 8,899 8, ,662 8,783 8,879 Sub-Total 90,074 44,815 45, ,382 8,651 8, ,092 8,498 8, ,982 8,403 8, ,708 8,230 8, ,939 8,500 8,439 Sub-Total 85,103 42,282 42, ,766 8,354 8, ,401 8,279 8, ,622 8,357 8, ,976 8,492 8, ,116 8,490 8,626 Sub-Total 83,881 41,972 41,909 Total Population 1,320,343 Age Total Male Female 45 16,928 8,448 8, ,732 8,430 8, ,407 8,315 8, ,296 8,066 8, ,484 8,811 8,673 Sub-Total 83,847 42,070 41, ,590 9,242 9, ,892 9,532 9, ,081 9,540 9, ,019 9,549 9, ,959 9,590 9,369 Sub-Total 94,541 47,453 47, ,711 9,474 9, ,774 8,873 8, ,644 8,816 8, ,244 8,592 8, ,554 8,390 8,164 Sub-Total 87,927 44,145 43, ,599 8,267 8, ,010 7,938 8, ,036 7,219 7, ,454 7,210 7, ,882 6,699 7,183 Sub-Total 75,981 37,333 38, ,567 6,695 6, ,069 6,347 6, ,028 6,289 6, ,828 6,238 6, ,583 5,050 5,533 Sub-Total 63,075 30,619 32, ,740 4,791 4, ,552 4,694 4, ,136 4,327 4, ,110 3,834 4, ,943 3,646 4,297 Sub-Total 44,481 21,292 23, ,155 3,309 3, ,847 3,162 3, ,627 3,047 3, ,041 2,724 3, ,960 2,619 3,341 Sub-Total 32,630 14,861 17, ,473 2,397 3, ,231 2,298 2, ,062 2,154 2, ,851 1,988 2, ,416 1,725 2,691 Sub-Total 25,033 10,562 14, ,226 1,661 2, ,775 1,428 2, ,615 1,388 2, ,950 1,005 1, , ,805 Sub-Total 17,294 6,405 10,889 Male 655,436 Female 664,907 Total Population 1,320,343 File Status at: June 1, 2015 Age Total Male Female 90 2, , , , , , , , , Sub-Total 8,907 2,603 6, Sub-Total 2, , Sub-Total Sub-Total Sub-Total Male Female 655, ,907 Age Group Total Male Female , , , , , , ,186 66,772 73, ,201 20,274 33,927 Age Group Total Male Female ,387 87, , ,312 56,427 74, ,168 9,712 19, ,874 3,307 8,567 Age Group Total Male Female , , , ,490 94,418 89, ,128 91,438 91, ,984 84,254 84, ,388 89,523 88, ,908 81,478 82, ,556 51,911 55, ,831 35,135 51,696
13 Manitoba Health, Healthy Living and Seniors Population Report, June 1, 2015 Figure 3a Manitoba Health Population by Single Year of Age, June 1, 2015 Total Population Figure 3b Manitoba Health Female Population by Single Year of Age, June 1, 2015 Total Females Figure 3c Manitoba Health Male Population by Single Year of Age, June 1, 2015 Total Males
14
15 Population of Manitoba by Regional Health Authority (R.H.A.)(1), Gender, and Age Group - June 1, 2015 R.H.A. Gender Under Total 01 - Winnipeg Health Region F 4,030 16,254 21,025 20,286 22,854 27,477 28,169 27,881 26,075 25,073 24,895 27,444 25,338 22,546 19,040 13,302 31, ,246 M 4,235 17,298 21,799 21,591 24,363 28,848 28,206 27,391 25,561 24,908 24,892 27,688 25,010 20,946 16,967 11,527 19, ,143 T 8,265 33,552 42,824 41,877 47,217 56,325 56,375 55,272 51,636 49,981 49,787 55,132 50,348 43,492 36,007 24,829 51, , Prairie Mountain Health Region F 1,035 4,213 5,292 4,836 5,034 5,593 5,549 5,261 5,110 4,947 4,681 5,848 5,839 5,318 4,653 3,491 8,387 85,087 M 1,066 4,554 5,589 5,057 5,252 5,698 5,400 5,430 5,091 5,015 4,767 5,573 5,780 5,303 4,523 3,302 5,990 83,390 T 2,101 8,767 10,881 9,893 10,286 11,291 10,949 10,691 10,201 9,962 9,448 11,421 11,619 10,621 9,176 6,793 14, , Interlake-Eastern Health Region F 713 2,889 3,622 3,677 3,995 3,898 3,526 3,313 3,326 3,753 4,302 5,222 4,883 4,494 3,870 2,683 4,634 62,800 M 766 3,005 3,894 3,823 4,288 4,472 3,734 3,387 3,350 3,849 4,208 5,343 5,164 4,602 3,893 2,858 3,837 64,473 T 1,479 5,894 7,516 7,500 8,283 8,370 7,260 6,700 6,676 7,602 8,510 10,565 10,047 9,096 7,763 5,541 8, , Northern Health Region F 786 3,185 3,964 3,114 3,072 3,236 2,951 2,538 2,281 2,235 2,171 2,158 1,846 1, ,452 M 868 3,305 4,011 3,357 3,203 3,231 2,901 2,408 2,294 2,253 2,286 2,306 2,042 1,502 1, ,495 T 1,654 6,490 7,975 6,471 6,275 6,467 5,852 4,946 4,575 4,488 4,457 4,464 3,888 2,856 2,112 1,325 1,652 75, Southern Health-Santé Sud Region F 1,480 5,958 7,517 6,903 6,889 7,024 6,236 6,266 6,029 5,901 5,728 6,416 5,876 4,936 3,898 3,051 6,214 96,322 M 1,662 6,387 7,701 7,311 7,505 7,558 6,382 6,199 5,986 5,947 5,917 6,543 6,149 4,980 4,119 2,942 4,647 97,935 T 3,142 12,345 15,218 14,214 14,394 14,582 12,618 12,465 12,015 11,848 11,645 12,959 12,025 9,916 8,017 5,993 10, ,257 Manitoba F 8,044 32,499 41,420 38,816 41,844 47,228 46,431 45,259 42,821 41,909 41,777 47,088 43,782 38,648 32,456 23,189 51, ,907 M 8,597 34,549 42,994 41,139 44,611 49,807 46,623 44,815 42,282 41,972 42,070 47,453 44,145 37,333 30,619 21,292 35, ,436 T 16,641 67,048 84,414 79,955 86,455 97,035 93,054 90,074 85,103 83,881 83,847 94,541 87,927 75,981 63,075 44,481 86,831 1,320,343 First Nations Summary First Nations Summary F 1,288 4,929 6,296 4,828 4,649 4,851 4,123 3,401 2,931 2,859 2,791 2,445 1,780 1, ,419 M 1,338 5,252 6,341 5,160 4,750 4,858 3,785 3,255 2,634 2,539 2,503 2,191 1,665 1, ,117 T 2,626 10,181 12,637 9,988 9,399 9,709 7,908 6,656 5,565 5,398 5,294 4,636 3,445 2,341 1,582 1,054 1,117 99,536 (1) First nations residents are allocated to municipality and RHA by postal code. Summary includes all First Nations people regardless of where they reside.
16 Population by Regional Health Authority (1), First Nations On/Off Reserve, and Age Group - June 1, 2015 R.H.A. Gender Under Total 01 Winnipeg Health Region On Off 681 2,637 3,364 2,783 2,618 2,784 2,200 1,996 1,558 1,490 1,384 1, ,626 T 681 2,637 3,364 2,783 2,618 2,784 2,200 1,996 1,558 1,490 1,384 1, , Prairie Mountain Health Region On ,694 Off ,565 T 288 1,155 1,444 1, , , Interlake-Eastern Health Region On ,221 1,054 1,016 1, ,354 Off ,100 T 311 1,296 1,550 1,328 1,328 1,376 1, , Northern Health Region On 846 3,255 4,027 3,230 2,865 2,927 2,440 1,829 1,687 1,690 1,667 1,375 1, ,090 Off 287 1,044 1, ,698 T 1,133 4,299 5,351 4,085 3,702 3,744 3,191 2,407 2,170 2,098 2,046 1,730 1, , Southern Health-Santé Sud Region On ,388 Off ,021 T ,409 Manitoba On 1,335 5,197 6,494 5,278 4,810 4,859 3,942 3,197 2,845 2,945 2,987 2,641 2,104 1,418 1, ,526 Off 1,291 4,984 6,143 4,710 4,589 4,850 3,966 3,459 2,720 2,453 2,307 1,995 1, ,010 T 2,626 10,181 12,637 9,988 9,399 9,709 7,908 6,656 5,565 5,398 5,294 4,636 3,445 2,341 1,582 1,054 1,117 99,536 (1) First nations residents are allocated to municipality and RHA by postal code. Summary includes all First Nations people regardless of where they reside.
17 Manitoba Health, Healthy Living and Seniors Population Report, June 1, 2015 Summary of Provincial Population by Regional Health Authority Regional Health Authority Winnipeg Health Region , , , , ,389 Prairie Mountain Health Region Interlake-Eastern Health Region Northern Health Region Southern Health-Santé Sud Region 164, , , ,720 73,651 74, , , , , , , , ,273 74,731 75,349 75, , , ,257 Provincial Total 1,250,484 1,271,388 1,289,268 1,306,309 1,320,343
18 Manitoba Health, Healthy Living and Seniors Population Report - June 1, 2015 Figure 5 Percent of Population for Regional Health Authority June 1, 2011 and % 56.8% 57.1% % 40.0% Percent 30.0% 20.0% 13.1% 12.8% 14.4% 14.7% 10.0% 9.8% 9.6% 5.9% 5.8% 0.0% 01 - Winnipeg Health Region 02 - Prairie Mountain Health Region 03 - Interlake-Eastern Health Region 04 - Northern Health Region 05 - Southern Health-Santé Sud Region Regional Health Authority
19 Manitoba Health, Healthy Living and Seniors Population Report, June 1, 2015 Summary of Provincial Population by Regional Health Authority Age Group 65+ Regional Health Authority Winnipeg Health Region Prairie Mountain Health Region Interlake-Eastern Health Region Northern Health Region Southern Health-Santé Sud Region , , , , ,306 28,608 29,070 29,540 30,033 30,346 18,869 19,760 20,571 21,163 21,775 4,337 4,522 4,737 4,926 5,089 21,998 22,723 23,477 24,178 24,871 Provincial Total 173, , , , ,387
20 Manitoba Health, Healthy Living and Seniors Population Report - June 1, 2015 Figure 6 Percent of Population for Age Group 65+ by Regional Health Authority June 1, 2011 and % % Percent of RHA 20.0% 15.0% 10.0% 14.0% 17.4% 5.9% 14.9% 15.4% 6.7% 18.0% 17.1% 12.2% 12.8% 5.0% 0.0% 01 - Winnipeg Health Region 02 - Prairie Mountain Health Region 03 - Interlake-Eastern Health Region Regional Health Authority 04 - Northern Health Region 05 - Southern Health-Santé Sud Region
21 Manitoba Health, Healthy Living and Seniors Population Report - June 1, 2015 Part 3 Population of Regional Health Authorities June 1, 2015
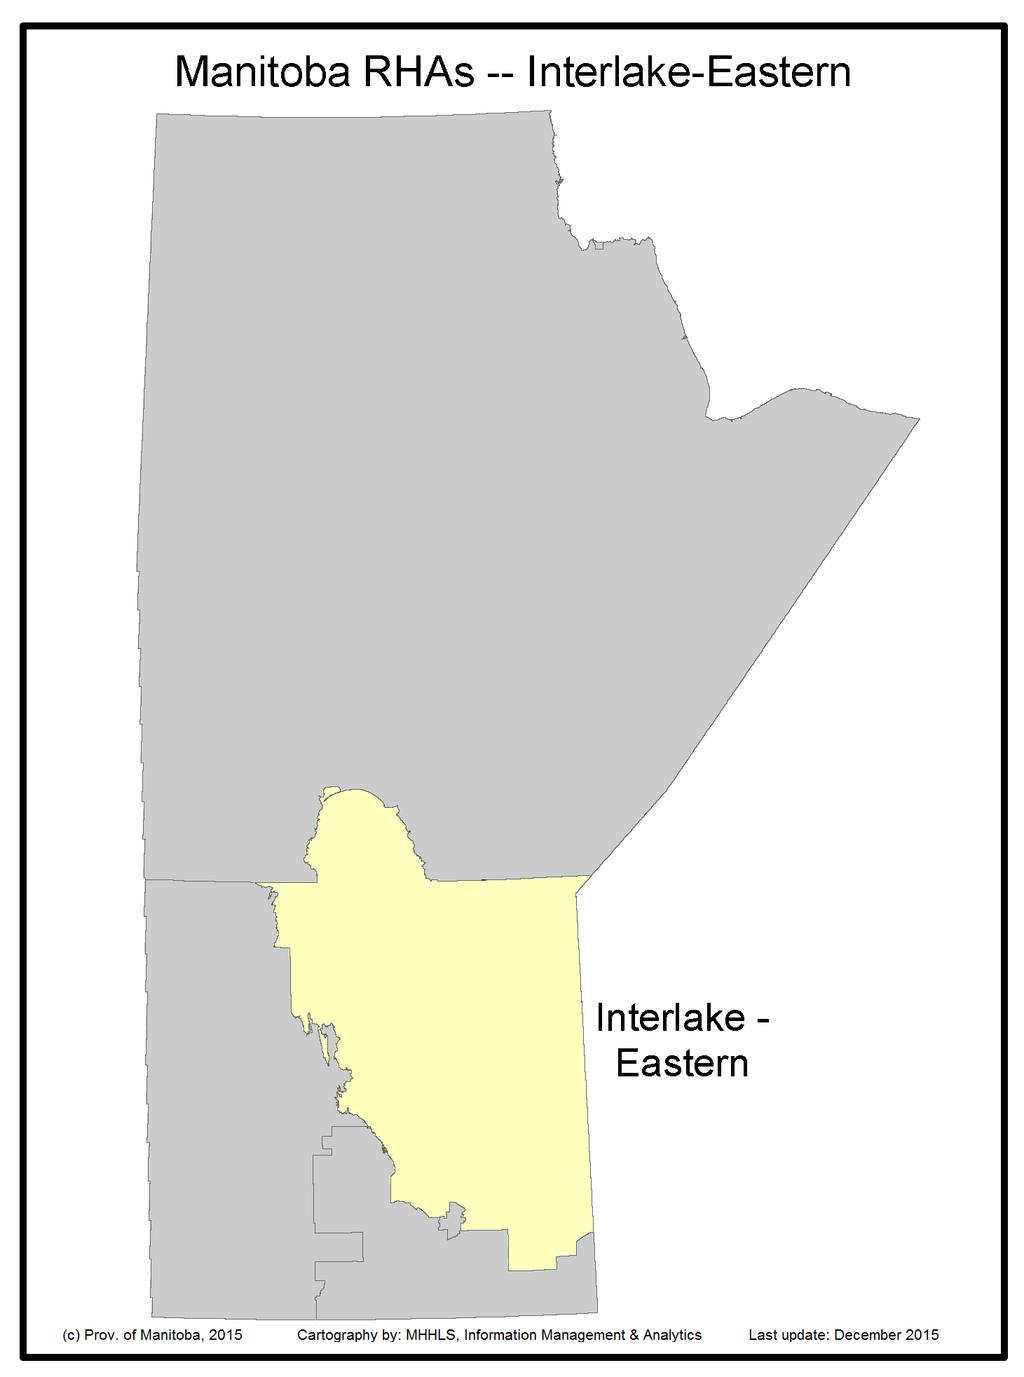
22 Manitoba Health, Healthy Living and Seniors Population Report - June 1, 2015 Population of Interlake-Eastern RHA June 1, 2015
23
24 Interlake-Eastern Health Region Manitoba Health, Healthy Living and Seniors Population Report - June 1, 2015 District Interlake-Eastern East Zone Gender Under Total Beausejour F ,496 Pinawa/Lac du Bonnet M ,652 F ,839 Whiteshell M ,005 F ,428 M ,550 F ,763 M ,207 Interlake-Eastern North Zone Eriksdale/Ashern F ,055 Fisher/Peguis M ,230 F ,300 Powerview/Pine Falls M ,473 F ,144 M ,263 F ,499 M ,966 Interlake-Eastern Northern Remote Zone Northern Remote F ,943 M ,029 F ,943 M ,029
25 Interlake-Eastern Health Region Manitoba Health, Healthy Living and Seniors Population Report - June 1, 2015 District Gender Under Total Interlake-Eastern Selkirk Zone Selkirk F ,381 M ,751 F ,381 M ,751 Interlake-Eastern South Zone Springfield F ,059 St. Clements M ,305 F ,153 Stonewall/Teulon M ,386 F ,435 Wpg Beach/St. Andrews M ,704 F ,142 M ,530 F 282 1,193 1,525 1,676 1,832 1,761 1,587 1,546 1,675 1,918 2,238 2,724 2,370 2,036 1,717 1,108 1,601 28,789 M 310 1,264 1,668 1,745 2,019 2,047 1,719 1,542 1,609 1,922 2,165 2,763 2,567 2,126 1,741 1,252 1,466 29,925
26 Interlake-Eastern Health Region Manitoba Health, Healthy Living and Seniors Population Report - June 1, 2015 District Interlake-Eastern West Zone Gender Under Total Arborg/Riverton F ,418 Gimli M ,531 F ,035 St. Laurent M ,926 F ,972 M ,138 F ,425 M ,595 RHA Sub-Total (Sex) F 713 2,889 3,622 3,677 3,995 3,898 3,526 3,313 3,326 3,753 4,302 5,222 4,883 4,494 3,870 2,683 4,634 62,800 M 766 3,005 3,894 3,823 4,288 4,472 3,734 3,387 3,350 3,849 4,208 5,343 5,164 4,602 3,893 2,858 3,837 64,473 RHA Total 1,479 5,894 7,516 7,500 8,283 8,370 7,260 6,700 6,676 7,602 8,510 10,565 10,047 9,096 7,763 5,541 8, ,273
27 Manitoba Health, Healthy Living and Seniors Population Report - June 1, 2015 Interlake-Eastern Health Region District Interlake-Eastern East Zone Beausejour Pinawa/Lac du Bonnet Whiteshell Interlake-Eastern North Zone Eriksdale/Ashern Fisher/Peguis Powerview/Pine Falls 8,459 8,662 7,937 7,951 2,981 2,962 6,872 6,775 6,515 6,497 6,262 6,365 8,828 9,039 9,148 7,932 7,908 7,844 2,959 2,998 2,978 6,655 6,425 6,285 6,649 6,712 6,773 6,391 6,456 6,407 Interlake-Eastern Northern Remote Zone Northern Remote 3,711 3,736 3,863 3,903 3,972 Interlake-Eastern Selkirk Zone Selkirk Interlake-Eastern South Zone Springfield St. Clements Stonewall/Teulon Wpg Beach/St. Andrews Interlake-Eastern West Zone Arborg/Riverton Gimli St. Laurent 9,814 9,819 13,294 13,581 6,759 8,186 18,554 18,760 16,154 16,468 4,832 4,902 5,809 5,883 4,218 4,173 9,884 10,013 10,132 13,808 14,066 14,364 8,352 8,492 8,539 18,875 19,065 19,139 16,562 16,587 16,672 4,972 4,909 4,949 5,922 5,982 5,961 4,193 4,119 4,110 R.H.A. Total 122, , , , ,273 Note: Manitoba Health Districts are defined by the RHAs, and are subject to change over time. For comparability, all populations have been tabulated using current district definitions, even if different definitions were in use during that population's year.
28 Manitoba Health, Healthy Living and Seniors Population Report - June 1, 2015 Interlake-Eastern Health Region Age Group 65+ District Interlake-Eastern East Zone Beausejour Pinawa/Lac du Bonnet Whiteshell Interlake-Eastern North Zone Eriksdale/Ashern Fisher/Peguis Powerview/Pine Falls 1,381 1,438 2,041 2, ,467 1,507 1,549 2,199 2,287 2, , Interlake-Eastern Northern Remote Zone Northern Remote Interlake-Eastern Selkirk Zone Selkirk Interlake-Eastern South Zone Springfield St. Clements Stonewall/Teulon Wpg Beach/St. Andrews Interlake-Eastern West Zone Arborg/Riverton Gimli St. Laurent 1,882 1,937 1,504 1,595 1,038 1,165 2,516 2,653 2,229 2, ,710 1, ,992 2,080 2,148 1,716 1,828 1,947 1,246 1,295 1,340 2,770 2,826 2,904 2,534 2,591 2, ,830 1,862 1, R.H.A. Total 18,869 19,760 20,571 21,163 21,775 Note: Manitoba Health Districts are defined by the RHAs, and are subject to change over time. For comparability, all populations have been tabulated using current district definitions, even if different definitions were in use during that population's year.
29 Interlake-Eastern Health Region Manitoba Health, Healthy Living and Seniors Population Report - June 1, 2015 Municipality Alexander RM Gender Under Total F M Arborg Town F ,107 M ,089 Armstrong RM F M Beausejour Town F ,011 M ,069 Brokenhead RM F ,485 M ,583 Coldwell RM F M Dunnottar Village F M Fisher RM F ,323 M ,316 Gimli RM F ,035 M ,926 Grahamdale RM F M Lac du Bonnet RM F M
30 Interlake-Eastern Health Region Manitoba Health, Healthy Living and Seniors Population Report - June 1, 2015 Municipality Gender Under Total Lac du Bonnet Town F ,543 M ,521 Municipality of Bifrost-Riverton F ,310 M ,440 Municipality of West Interlake F ,338 M ,357 Pinawa LGD F M Powerview-Pine Falls Town F ,097 M ,104 Reynolds RM F M Rockwood RM F ,141 M ,410 Rosser RM F M Selkirk City F ,381 M ,751 Springfield RM F ,059 M ,305 St Andrews RM F ,292 M ,745
31 Interlake-Eastern Health Region Manitoba Health, Healthy Living and Seniors Population Report - June 1, 2015 Municipality St Clements RM Gender Under Total F ,043 M ,256 St Laurent RM F M Stonewall Town F ,054 M ,962 Teulon Town F M Unorganized Territories - Interlake F M Unorganized Territories - North Eastman F ,206 M ,328 Victoria Beach RM F M Whitemouth RM F M Winnipeg Beach Town F M Woodlands RM F ,695 M ,779 Non-FN Sub-Total(Sex) F 599 2,383 3,022 3,167 3,503 3,418 3,133 2,995 3,013 3,437 3,929 4,877 4,639 4,314 3,760 2,597 4,508 57,294 M 656 2,513 3,273 3,279 3,764 3,938 3,334 2,984 3,034 3,492 3,838 4,986 4,855 4,413 3,752 2,768 3,746 58,625
32 Interlake-Eastern Health Region Manitoba Health, Healthy Living and Seniors Population Report - June 1, 2015 Municipality Berens River FN Gender Under Total F M Bloodvein FN F M Brokenhead FN F M Dauphin River FN F M Fairford FN F M Fisher River FN F M Fort Alexander FN F ,012 M ,077 Hollow Water FN F M Kinonjeoshtegon FN F M Lake Manitoba FN F M Lake St. Martin FN F M
33 Interlake-Eastern Health Region Manitoba Health, Healthy Living and Seniors Population Report - June 1, 2015 Municipality Gender Under Total Little Black River FN F M Little Grand Rapids FN F M Little Saskatchewan FN F M Pauingassi FN F M Peguis FN F ,089 M ,182 Poplar River FN F M FN Sub-Total(Sex) F ,506 M ,848 RHA Sub-Total (Sex) F 713 2,889 3,622 3,677 3,995 3,898 3,526 3,313 3,326 3,753 4,302 5,222 4,883 4,494 3,870 2,683 4,634 62,800 M 766 3,005 3,894 3,823 4,288 4,472 3,734 3,387 3,350 3,849 4,208 5,343 5,164 4,602 3,893 2,858 3,837 64,473 RHA Total 1,479 5,894 7,516 7,500 8,283 8,370 7,260 6,700 6,676 7,602 8,510 10,565 10,047 9,096 7,763 5,541 8, ,273
34 Manitoba Health, Healthy Living and Seniors Population Report - June 1, 2015 Interlake-Eastern Health Region Municipality Alexander RM 1,773 1,767 1,749 1,724 1,725 Arborg Town 1,782 1,924 2,081 2,107 2,196 Armstrong RM 1,512 1,497 1,499 1,472 1,430 Beausejour Town 5,561 5,754 5,804 5,945 6,080 Brokenhead RM 2,898 2,908 3,024 3,094 3,068 Coldwell RM 1,281 1,290 1,313 1,278 1,285 Dunnottar Village Fisher RM 2,599 2,565 2,575 2,641 2,639 Gimli RM 5,809 5,883 5,922 5,982 5,961 Grahamdale RM 2,009 1,969 1,918 1,852 1,781 Lac du Bonnet RM 1,458 1,387 1,320 1,257 1,197 Lac du Bonnet Town 2,864 2,949 2,991 3,029 3,064 Municipality of Bifrost-Riverton 3,047 2,975 2,888 2,799 2,750 Municipality of West Interlake 2,709 2,726 2,716 2,693 2,695 Pinawa LGD 1,495 1,488 1,494 1,519 1,485 Powerview-Pine Falls Town 2,086 2,111 2,140 2,225 2,201 Reynolds RM 1, Rockwood RM 6,490 6,628 6,568 6,588 6,551 Rosser RM 1,312 1,286 1,290 1,279 1,250 Selkirk City 9,814 9,819 9,884 10,013 10,132 Springfield RM 13,294 13,581 13,808 14,066 14,364 St Andrews RM 14,635 14,896 14,981 14,964 15,037 St Clements RM 6,526 7,962 8,128 8,251 8,299 St Laurent RM 1,425 1,386 1,381 1,369 1,395 Stonewall Town 5,610 5,685 5,818 5,939 6,016 Teulon Town 1,735 1,772 1,787 1,833 1,848 Unorganized Territories - Interlake Unorganized Territories - North Eastman 2,513 2,541 2,526 2,549 2,534 Victoria Beach RM
35 Manitoba Health, Healthy Living and Seniors Population Report - June 1, 2015 Interlake-Eastern Health Region Municipality Whitemouth RM 1,693 1,724 1,725 1,769 1,801 Winnipeg Beach Town 1,402 1,464 1,484 1,536 1,553 Woodlands RM 3,407 3,389 3,412 3,426 3,474 Non-FN Sub-Total 110, , , , ,919 Berens River FN Bloodvein FN Brokenhead FN Dauphin River FN Fairford FN Fisher River FN Fort Alexander FN 2,042 2,082 2,100 2,102 2,089 Hollow Water FN Kinonjeoshtegon FN Lake Manitoba FN Lake St. Martin FN Little Black River FN Little Grand Rapids FN 1, Little Saskatchewan FN Pauingassi FN Peguis FN 2,152 2,154 2,245 2,250 2,271 Poplar River FN FN Sub-Total 11,302 11,299 11,492 11,340 11,354 R.H.A. Total 122, , , , ,273
36 Manitoba Health, Healthy Living and Seniors Population Report - June 1, 2015 Interlake-Eastern Health Region Age Group 65+ Municipality Alexander RM Arborg Town Armstrong RM Beausejour Town ,016 1,059 1,087 Brokenhead RM Coldwell RM Dunnottar Village Fisher RM Gimli RM 1,710 1,783 1,830 1,862 1,906 Grahamdale RM Lac du Bonnet RM Lac du Bonnet Town Municipality of Bifrost-Riverton Municipality of West Interlake Pinawa LGD Powerview-Pine Falls Town Reynolds RM Rockwood RM ,025 Rosser RM Selkirk City 1,882 1,937 1,992 2,080 2,148 Springfield RM 1,504 1,595 1,716 1,828 1,947 St Andrews RM 1,829 1,982 2,116 2,152 2,244 St Clements RM 1,028 1,153 1,231 1,279 1,324 St Laurent RM Stonewall Town Teulon Town Unorganized Territories - Interlake Unorganized Territories - North Eastman Victoria Beach RM
37 Manitoba Health, Healthy Living and Seniors Population Report - June 1, 2015 Interlake-Eastern Health Region Age Group 65+ Municipality Whitemouth RM Winnipeg Beach Town Woodlands RM Non-FN Sub-Total 18,282 19,157 19,942 20,518 21,131 Berens River FN Bloodvein FN Brokenhead FN Dauphin River FN Fairford FN Fisher River FN Fort Alexander FN Hollow Water FN Kinonjeoshtegon FN Lake Manitoba FN Lake St. Martin FN Little Black River FN Little Grand Rapids FN Little Saskatchewan FN Pauingassi FN Peguis FN Poplar River FN FN Sub-Total R.H.A. Total 18,869 19,760 20,571 21,163 21,775
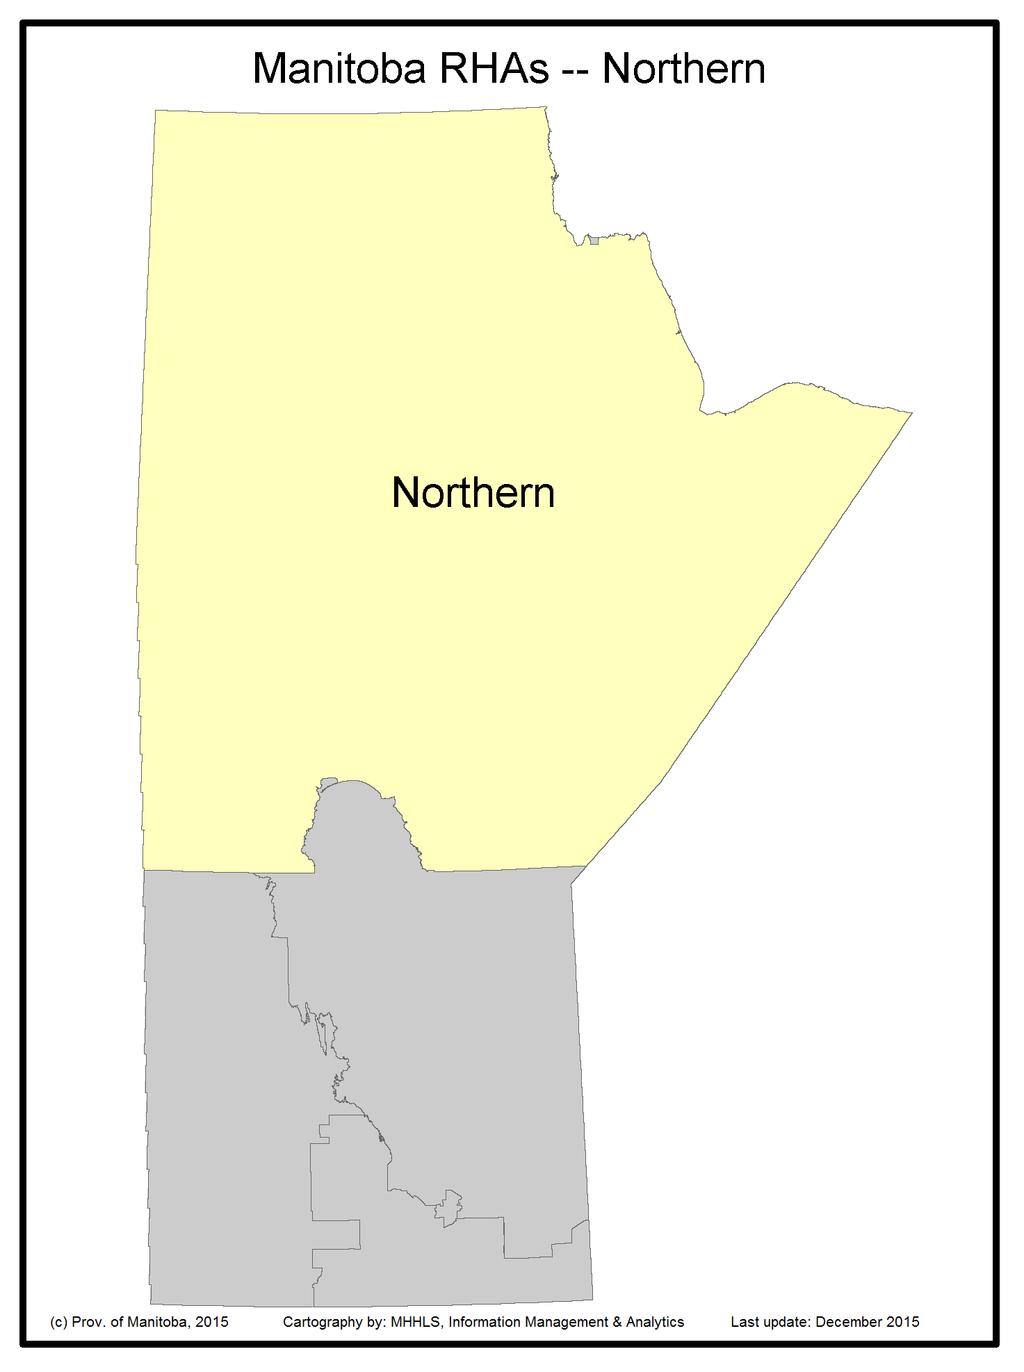
38 Manitoba Health, Healthy Living and Seniors Population Report - June 1, 2015 Population of Northern Health Authority June 1, 2015
39
40 Northern Health Region Manitoba Health, Healthy Living and Seniors Population Report - June 1, 2015 District Northern Direct Service Zone Gender Under Total Bay Line F Flin Flon/Snow Lake/Cranberry/Sherridon M F ,819 Gillam/Fox Lake CN M ,956 F M Lynn/MC FN/Leaf/O-P FN (SIL)/PN FN (Granville) F ,167 The Pas/OCN/Kelsey M ,275 F ,669 Thompson/Mystery Lake M ,621 F ,269 M ,401 F 286 1,256 1,600 1,340 1,380 1,541 1,493 1,411 1,298 1,232 1,218 1,360 1, ,302 M 337 1,268 1,580 1,436 1,457 1,505 1,450 1,322 1,249 1,197 1,282 1,437 1,373 1, ,720 Northern Island Lake Zone Island Lake F ,253 M ,509 F ,253 M ,509
41 Northern Health Region Manitoba Health, Healthy Living and Seniors Population Report - June 1, 2015 District Gender Under Total Northern Non-Direct Service Zone Bunibonibee/Oxford House/Manto Sipi/God's River/God's Lake F ,047 Cross Lake/Pimicikamak CN M ,151 F ,456 M ,445 GR/Misipawistik CN/ML/Mosakahiken CN/Eas/Chemawawin FN F ,001 M ,059 Nelson House/Nisichawayasihk Cree Nation F ,284 Norway House/Norway House CN M ,365 F ,771 Pukatawagan/Mathias Colomb CN M ,778 F M Sayisi Dene/Tadoule/Barren Lands/Brochet/Northlands/Lac Br F M Shamattawa FN/York Factory FN/Tataskweyak CN/Split Lake F ,681 M ,718 F 371 1,420 1,751 1,299 1,328 1,312 1, ,897 M 395 1,492 1,803 1,407 1,317 1,357 1, ,266 RHA Sub-Total (Sex) F 786 3,185 3,964 3,114 3,072 3,236 2,951 2,538 2,281 2,235 2,171 2,158 1,846 1, ,452 M 868 3,305 4,011 3,357 3,203 3,231 2,901 2,408 2,294 2,253 2,286 2,306 2,042 1,502 1, ,495 RHA Total 1,654 6,490 7,975 6,471 6,275 6,467 5,852 4,946 4,575 4,488 4,457 4,464 3,888 2,856 2,112 1,325 1,652 75,947
42 Manitoba Health Population Report - June 1, 2015 Northern Health Region District Northern Direct Service Zone Bay Line 1,383 1,342 Flin Flon/Snow Lake/Cranberry/Sherridon 7,858 7,833 Gillam/Fox Lake CN 1,648 1,615 Lynn/MC FN/Leaf/O-P FN (SIL)/PN FN (Granville) 2,294 2,294 The Pas/OCN/Kelsey 11,097 11,297 Thompson/Mystery Lake 14,682 14,741 1,325 1,303 1,263 7,707 7,695 7,775 1,671 1,648 1,582 2,358 2,411 2,442 11,348 11,310 11,290 14,506 14,463 14,670 Northern Island Lake Zone Island Lake 7,899 8,059 8,347 8,630 8,762 Northern Non-Direct Service Zone Bunibonibee/Oxford House/Manto Sipi/God's River/God's Lake 3,977 3,962 Cross Lake/Pimicikamak CN 4,539 4,598 GR/Misipawistik CN/ML/Mosakahiken CN/Eas/Chemawawin FN 3,836 3,858 Nelson House/Nisichawayasihk Cree Nation 2,585 2,565 Norway House/Norway House CN 5,289 5,374 Pukatawagan/Mathias Colomb CN 1,689 1,778 Sayisi Dene/Tadoule/Barren Lands/Brochet/Northlands/Lac Br 1,570 1,535 Shamattawa FN/York Factory FN/Tataskweyak CN/Split Lake 3,305 3,324 4,109 4,167 4,198 4,597 4,771 4,901 3,966 4,031 4,060 2,605 2,655 2,649 5,416 5,455 5,549 1,833 1,832 1,838 1,576 1,591 1,569 3,367 3,387 3,399 R.H.A. Total 73,651 74,175 74,731 75,349 75,947 Note: Manitoba Health Districts are defined by the RHAs, and are subject to change over time. For comparability, all populations have been tabulated using current district definitions, even if different definitions were in use during that population's year.
43 Manitoba Health, Healthy Living and Seniors Population Report - June 1, 2015 Northern Health Region Age Group 65+ District Northern Direct Service Zone Bay Line Flin Flon/Snow Lake/Cranberry/Sherridon 1,056 1,076 Gillam/Fox Lake CN Lynn/MC FN/Leaf/O-P FN (SIL)/PN FN (Granville) The Pas/OCN/Kelsey 950 1,003 Thompson/Mystery Lake ,129 1,159 1, ,055 1,100 1, Northern Island Lake Zone Island Lake Northern Non-Direct Service Zone Bunibonibee/Oxford House/Manto Sipi/God's River/God's Lake Cross Lake/Pimicikamak CN GR/Misipawistik CN/ML/Mosakahiken CN/Eas/Chemawawin FN Nelson House/Nisichawayasihk Cree Nation Norway House/Norway House CN Pukatawagan/Mathias Colomb CN Sayisi Dene/Tadoule/Barren Lands/Brochet/Northlands/Lac Br Shamattawa FN/York Factory FN/Tataskweyak CN/Split Lake R.H.A. Total 4,337 4,522 4,737 4,926 5,089 Note: Manitoba Health Districts are defined by the RHAs, and are subject to change over time. For comparability, all populations have been tabulated using current district definitions, even if different definitions were in use during that population's year.
44 Northern Health Region Manitoba Health, Healthy Living and Seniors Population Report - June 1, 2015 Municipality Flin Flon City Gender Under Total F ,932 M ,953 Gillam Town F M Grand Rapids Town F M Kelsey RM F ,183 M ,347 Leaf Rapids Town F M Lynn Lake Town F M Mystery Lake LGD F M Snow Lake Town F M The Pas City F ,793 M ,714 Thompson City F ,268 M ,400 Unorganized Territories - Burntwood F ,622 M ,641
45 Northern Health Region Manitoba Health, Healthy Living and Seniors Population Report - June 1, 2015 Municipality Gender Under Total Unorganized Territories - Norman F ,187 M ,373 Non-FN Sub-Total(Sex) F 376 1,617 1,985 1,583 1,660 1,789 1,724 1,606 1,458 1,402 1,338 1,496 1, ,171 M 432 1,618 1,963 1,658 1,750 1,751 1,688 1,511 1,430 1,396 1,452 1,593 1,461 1, ,686 Barren Lands FN F M Chemawawin FN F M Churchill FN F M Cross Lake FN F ,869 M ,848 Fox Lake FN F M Garden Hill FN F ,255 M ,405 Gods Lake FN F M Gods River FN F M Marcel Colomb FN M
46 Northern Health Region Manitoba Health, Healthy Living and Seniors Population Report - June 1, 2015 Municipality Gender Under Total Mathias Colomb FN F M Misipawistik Cree Nation F M Moose Lake FN F M Nelson House FN F M ,021 Northlands FN F M Norway House FN F ,293 M ,310 Opaskwayak Cree Nation F ,009 M O-Pipon-Na-Piwin Cree Nation F M Oxford House FN F M Red Sucker Lake FN F M Shamattawa FN F M
47 Northern Health Region Manitoba Health, Healthy Living and Seniors Population Report - June 1, 2015 Municipality Split Lake FN Gender Under Total F M St. Theresa Point FN F ,324 M ,457 War Lake FN F M Wasagamack FN F M York Factory FN F M FN Sub-Total(Sex) F 410 1,568 1,979 1,531 1,412 1,447 1, ,281 M 436 1,687 2,048 1,699 1,453 1,480 1, ,809 RHA Sub-Total (Sex) F 786 3,185 3,964 3,114 3,072 3,236 2,951 2,538 2,281 2,235 2,171 2,158 1,846 1, ,452 M 868 3,305 4,011 3,357 3,203 3,231 2,901 2,408 2,294 2,253 2,286 2,306 2,042 1,502 1, ,495 RHA Total 1,654 6,490 7,975 6,471 6,275 6,467 5,852 4,946 4,575 4,488 4,457 4,464 3,888 2,856 2,112 1,325 1,652 75,947
48 Manitoba Health, Healthy Living and Seniors Population Report - June 1, 2015 Northern Health Region Municipality Flin Flon City 6,023 5,962 5,855 5,840 5,885 Gillam Town 1,379 1,336 1,367 1,339 1,305 Grand Rapids Town Kelsey RM 2,538 2,572 2,541 2,520 2,530 Leaf Rapids Town Lynn Lake Town Mystery Lake LGD Snow Lake Town The Pas City 7,440 7,615 7,633 7,598 7,507 Thompson City 14,678 14,738 14,503 14,459 14,668 Unorganized Territories - Burntwood 6,889 6,919 7,097 7,203 7,263 Unorganized Territories - Norman 2,472 2,513 2,564 2,549 2,560 Non-FN Sub-Total 44,326 44,600 44,583 44,585 44,857 Barren Lands FN Chemawawin FN Churchill FN Cross Lake FN 3,445 3,470 3,472 3,614 3,717 Fox Lake FN Garden Hill FN 2,473 2,524 2,581 2,651 2,660 Gods Lake FN Gods River FN Inuit & OOP FN Marcel Colomb FN Mathias Colomb FN 1,334 1,391 1,431 1,456 1,454 Misipawistik Cree Nation Moose Lake FN Nelson House FN 1,966 1,961 1,993 2,010 1,997 Northlands FN Norway House FN 4,360 4,425 4,483 4,532 4,603
49 Manitoba Health, Healthy Living and Seniors Population Report - June 1, 2015 Northern Health Region Municipality Opaskwayak Cree Nation 1,822 1,821 1,865 1,894 1,938 O-Pipon-Na-Piwin Cree Nation Oxford House FN 1,894 1,886 1,909 1,918 1,917 Red Sucker Lake FN Shamattawa FN Split Lake FN 1,518 1,524 1,551 1,574 1,550 St. Theresa Point FN 2,495 2,553 2,616 2,730 2,781 War Lake FN Wasagamack FN 1,106 1,117 1,180 1,210 1,227 York Factory FN FN Sub-Total 29,325 29,575 30,148 30,764 31,090 R.H.A. Total 73,651 74,175 74,731 75,349 75,947
50 Manitoba Health, Healthy Living and Seniors Population Report - June 1, 2015 Northern Health Region Age Group 65+ Municipality Flin Flon City Gillam Town Grand Rapids Town Kelsey RM Leaf Rapids Town Lynn Lake Town Snow Lake Town The Pas City Thompson City Unorganized Territories - Burntwood Unorganized Territories - Norman Non-FN Sub-Total 3,129 3,272 3,452 3,582 3,725 Barren Lands FN Chemawawin FN Churchill FN Cross Lake FN Fox Lake FN Garden Hill FN Gods Lake FN Gods River FN Mathias Colomb FN Misipawistik Cree Nation Moose Lake FN Nelson House FN Northlands FN Norway House FN Opaskwayak Cree Nation O-Pipon-Na-Piwin Cree Nation Oxford House FN
51 Manitoba Health, Healthy Living and Seniors Population Report - June 1, 2015 Northern Health Region Age Group 65+ Municipality Red Sucker Lake FN Shamattawa FN Split Lake FN St. Theresa Point FN War Lake FN Wasagamack FN York Factory FN FN Sub-Total 1,208 1,250 1,285 1,344 1,364 R.H.A. Total 4,337 4,522 4,737 4,926 5,089
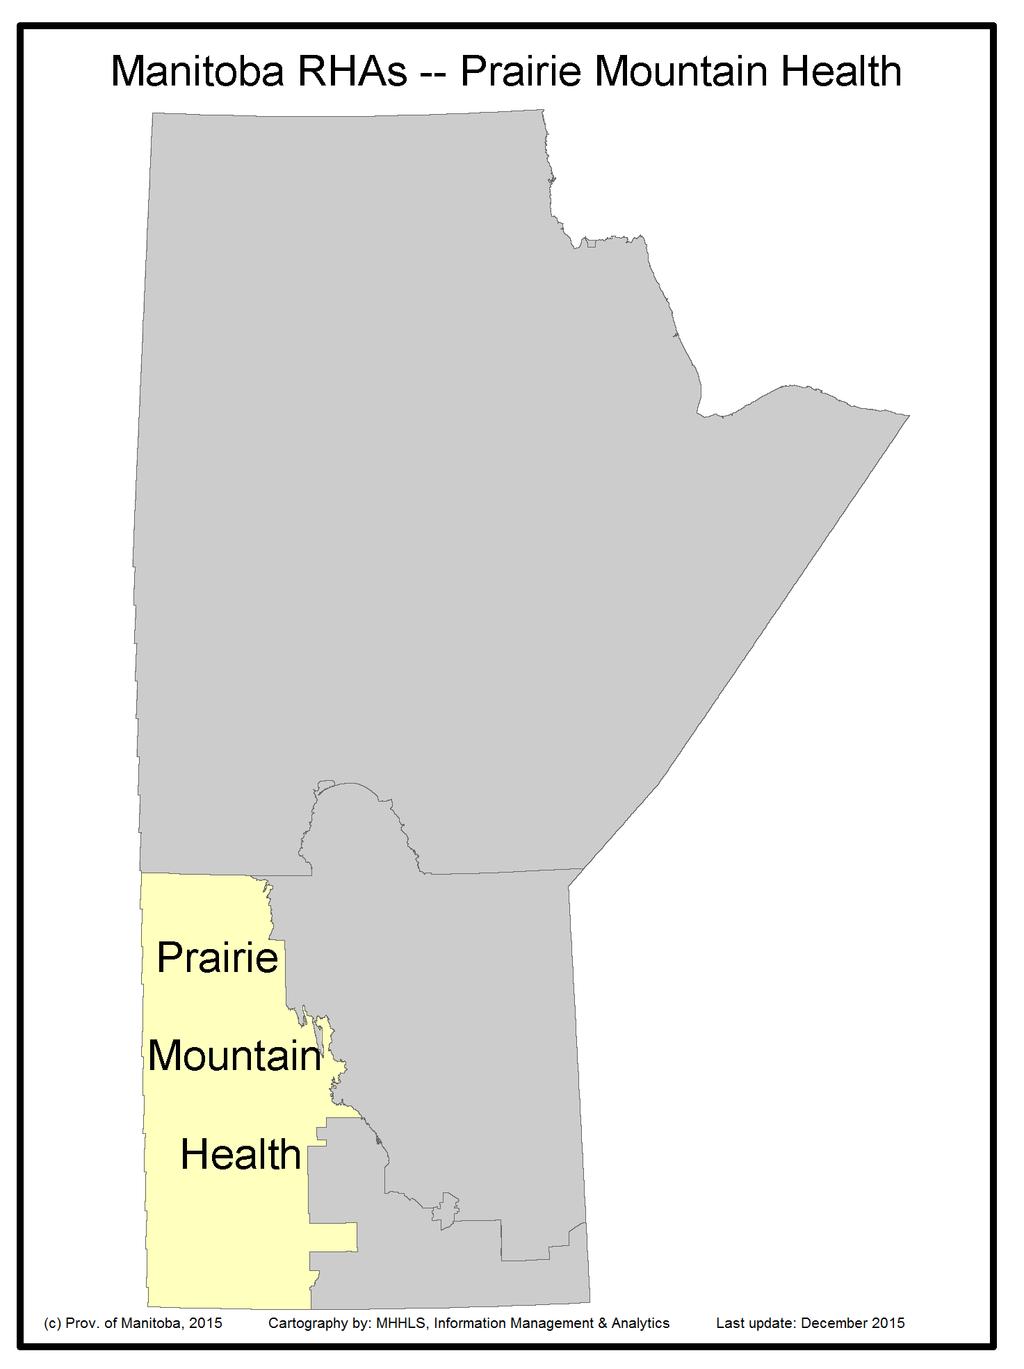
52 Manitoba Health, Healthy Living and Seniors Population Report - June 1, 2015 Population of Prairie Mountain Health June 1, 2015
53
54 Prairie Mountain Health Region Manitoba Health, Healthy Living and Seniors Population Report - June 1, 2015 District PMH Brandon Zone Gender Under Total Brandon Downtown F ,949 Brandon East End M ,613 F ,527 Brandon North Hill M ,365 F ,884 Brandon South End M ,525 F ,159 Brandon West End M ,930 F ,480 M ,804 F 351 1,375 1,682 1,519 1,523 2,061 2,196 2,032 1,928 1,722 1,492 1,774 1,564 1,389 1, ,276 26,999 M 351 1,507 1,674 1,550 1,555 1,856 1,960 2,075 1,869 1,788 1,497 1,617 1,456 1,270 1, ,437 25,237
55 Prairie Mountain Health Region Manitoba Health, Healthy Living and Seniors Population Report - June 1, 2015 District PMH North Zone Gender Under Total Agassiz Mountain F ,558 Dauphin M ,551 F ,741 Duck Mountain M ,142 F ,736 Porcupine Mountain M ,708 F ,169 Riding Mountain M ,595 F ,485 Swan River M ,687 F ,743 M ,567 F ,316 1,172 1,284 1,277 1,082 1,031 1,068 1,134 1,159 1,397 1,434 1,410 1, ,255 20,432 M ,389 1,259 1,327 1,376 1,162 1,077 1,049 1,129 1,139 1,403 1,428 1,410 1, ,698 20,250
56 Prairie Mountain Health Region Manitoba Health, Healthy Living and Seniors Population Report - June 1, 2015 District PMH South Zone Gender Under Total Asessippi F ,654 Little Saskatchewan M ,699 F ,364 Souris River M ,446 F ,055 Spruce Woods M ,068 F ,767 Turtle Mountain M ,540 F ,062 Whitemud M ,059 F ,754 M ,091 F 438 1,867 2,294 2,145 2,227 2,255 2,271 2,198 2,114 2,091 2,030 2,677 2,841 2,519 2,222 1,611 3,856 37,656 M 472 2,080 2,526 2,248 2,370 2,466 2,278 2,278 2,173 2,098 2,131 2,553 2,896 2,623 2,251 1,605 2,855 37,903 RHA Sub-Total (Sex) F 1,035 4,213 5,292 4,836 5,034 5,593 5,549 5,261 5,110 4,947 4,681 5,848 5,839 5,318 4,653 3,491 8,387 85,087 M 1,066 4,554 5,589 5,057 5,252 5,698 5,400 5,430 5,091 5,015 4,767 5,573 5,780 5,303 4,523 3,302 5,990 83,390 RHA Total 2,101 8,767 10,881 9,893 10,286 11,291 10,949 10,691 10,201 9,962 9,448 11,421 11,619 10,621 9,176 6,793 14, ,477
57 Manitoba Health, Healthy Living and Seniors Population Report - June 1, 2015 Prairie Mountain Health Region District PMH Brandon Zone Brandon Downtown Brandon East End Brandon North Hill Brandon South End Brandon West End PMH North Zone Agassiz Mountain Dauphin Duck Mountain Porcupine Mountain Riding Mountain Swan River PMH South Zone Asessippi Little Saskatchewan Souris River Spruce Woods Turtle Mountain Whitemud 10,406 10,872 6,680 6,779 6,989 7,165 9,521 9,645 14,853 15,203 7,248 7,195 8,867 8,833 5,556 5,619 9,358 9,271 5,296 5,242 5,233 5,309 11,340 11,344 12,544 12,596 14,026 14,154 15,309 15,317 10,011 10,072 10,865 11,060 11,174 11,400 11,562 6,789 6,753 6,892 7,245 7,328 7,409 9,864 9,885 10,089 15,582 15,916 16,284 7,242 7,153 7,109 8,832 8,868 8,883 5,594 5,560 5,444 9,117 8,898 8,764 5,228 5,163 5,172 5,321 5,345 5,310 11,308 11,339 11,353 12,648 12,770 12,810 14,248 14,228 14,123 15,361 15,429 15,307 10,078 10,155 10,121 11,490 11,652 11,845 R.H.A. Total 164, , , , ,477 Note: Manitoba Health Districts are defined by the RHAs, and are subject to change over time. For comparability, all populations have been tabulated using current district definitions, even if different definitions were in use during that population's year.
58 Manitoba Health, Healthy Living and Seniors Population Report - June 1, 2015 Prairie Mountain Health Region Age Group 65+ District PMH Brandon Zone Brandon Downtown Brandon East End Brandon North Hill Brandon South End Brandon West End PMH North Zone Agassiz Mountain Dauphin Duck Mountain Porcupine Mountain Riding Mountain Swan River PMH South Zone Asessippi Little Saskatchewan Souris River Spruce Woods Turtle Mountain Whitemud 1,326 1,336 1,116 1,127 1,020 1,088 1,238 1,245 2,078 2,150 1,223 1,264 1,972 2,000 1,304 1,319 1,293 1,312 1,050 1,066 1,124 1,136 2,127 2,128 2,403 2,435 2,569 2,624 2,796 2,813 1,978 2,006 1,991 2,021 1,366 1,383 1,451 1,090 1,092 1,104 1,144 1,194 1,190 1,322 1,353 1,369 2,274 2,394 2,489 1,295 1,330 1,345 1,967 2,006 2,033 1,337 1,370 1,366 1,318 1,307 1,321 1,089 1,098 1,111 1,149 1,160 1,167 2,109 2,093 2,065 2,488 2,562 2,614 2,638 2,648 2,651 2,858 2,894 2,887 2,036 2,059 2,045 2,060 2,090 2,138 R.H.A. Total 28,608 29,070 29,540 30,033 30,346 Note: Manitoba Health Districts are defined by the RHAs, and are subject to change over time. For comparability, all populations have been tabulated using current district definitions, even if different definitions were in use during that population's year.
59 Prairie Mountain Health Region Manitoba Health, Healthy Living and Seniors Population Report - June 1, 2015 Municipality Gender Under Total Alonsa - Parkland RM F M Argyle RM F M Brandon City F 351 1,375 1,682 1,519 1,523 2,061 2,196 2,032 1,928 1,722 1,492 1,774 1,564 1,389 1, ,276 26,999 M 351 1,507 1,674 1,550 1,555 1,856 1,960 2,075 1,869 1,788 1,497 1,617 1,456 1,270 1, ,437 25,237 Carberry Town F ,229 M ,198 Cartwright-Roblin Municipality F M Cornwallis RM F ,503 M ,183 Dauphin City F ,741 M ,142 Dauphin RM F M Elton RM F M Grandview Municipality F M Hamiota Municipality F M
60 Prairie Mountain Health Region Manitoba Health, Healthy Living and Seniors Population Report - June 1, 2015 Municipality Gender Under Total Killarney-Turtle Mountain RM F ,800 M ,788 Melita Town F M Minnedosa Town F ,773 M ,714 Mountain - North RM F M Mountain - South RM F M Municipality of Boissevain-Morton F ,243 M ,189 Municipality of Brenda-Waskada F M Municipality of Clanwilliam-Erickson F M Municipality of Deloraine-Winchester F M Municipality of Ethelbert F M Municipality of Gilbert Plains F M
61 Prairie Mountain Health Region Manitoba Health, Healthy Living and Seniors Population Report - June 1, 2015 Municipality Gender Under Total Municipality of Glenboro-South Cypress F M Municipality of Glenella-Lansdowne F M Municipality of Grassland F M Municipality of Harrison Park F M Municipality of Hillsburg-Roblin-Shell F ,656 M ,611 Municipality of McCreary F M Municipality of Minitonas-Bowsman F M Municipality of Norfolk-Treherne F M Municipality of North Cypress-Langford F M Municipality of Oakland-Wawanesa F M Municipality of Roblin F M
62 Prairie Mountain Health Region Manitoba Health, Healthy Living and Seniors Population Report - June 1, 2015 Municipality Gender Under Total Municipality of Russell-Binscarth F ,484 M ,421 Municipality of Souris-Glenwood F ,256 M ,217 Municipality of Ste. Rose F ,014 M Municipality of Swan Valley West F M Municipality of Two Borders F M Neepawa Town F ,579 M ,746 Pipestone RM F M Prairie View Municipality F ,137 M ,159 Riverdale Municipality F M ,003 RM of Ellice-Archie F M RM of Lakeshore F M
63 Prairie Mountain Health Region Manitoba Health, Healthy Living and Seniors Population Report - June 1, 2015 Municipality Gender Under Total RM of Minto-Odanah F M RM of Mossey River F M RM of Oakview F M RM of Prairie Lakes F M RM of Riding Mountain West F M RM of Sifton F M RM of Wallace-Woodworth F ,306 M ,355 RM of Yellowhead F ,117 M ,123 Rosedale RM F M Rossburn Municipality F M Swan River Town F ,743 M ,567
64 Prairie Mountain Health Region Manitoba Health, Healthy Living and Seniors Population Report - June 1, 2015 Municipality Gender Under Total Unorganized Territories - Parkland F ,297 M ,445 Victoria RM F M Virden Town F ,957 M ,866 Whitehead RM F M Non-FN Sub-Total(Sex) F 964 3,949 4,940 4,561 4,796 5,334 5,345 5,094 4,953 4,773 4,525 5,670 5,713 5,231 4,586 3,445 8,344 82,223 M 993 4,309 5,242 4,774 5,011 5,450 5,205 5,246 4,950 4,858 4,580 5,405 5,652 5,229 4,459 3,254 5,943 80,560 Birdtail Sioux FN F M Crane River FN F M Ebb & Flow FN F M Gamblers FN F M Indian Birch FN F M Keeseekoowenin FN F M
65 Prairie Mountain Health Region Manitoba Health, Healthy Living and Seniors Population Report - June 1, 2015 Municipality Gender Under Total Oak Lake Sioux FN F M Pine Creek FN F M Rolling River FN F M Shoal River FN F M Sioux Valley FN F M Valley River FN F M Waterhen FN F M Waywayseecappo FN F M FN Sub-Total(Sex) F ,864 M ,830 RHA Sub-Total (Sex) F 1,035 4,213 5,292 4,836 5,034 5,593 5,549 5,261 5,110 4,947 4,681 5,848 5,839 5,318 4,653 3,491 8,387 85,087 M 1,066 4,554 5,589 5,057 5,252 5,698 5,400 5,430 5,091 5,015 4,767 5,573 5,780 5,303 4,523 3,302 5,990 83,390 RHA Total 2,101 8,767 10,881 9,893 10,286 11,291 10,949 10,691 10,201 9,962 9,448 11,421 11,619 10,621 9,176 6,793 14, ,477
66 Manitoba Health, Healthy Living and Seniors Population Report - June 1, 2015 Prairie Mountain Health Region Municipality Alonsa - Parkland RM 1,604 1,551 1,586 1,542 1,521 Argyle RM Brandon City 48,449 49,664 50,654 51,282 52,236 Carberry Town 2,233 2,297 2,346 2,389 2,427 Cartwright-Roblin Municipality 1,248 1,224 1,236 1,241 1,236 Cornwallis RM 2,728 2,708 2,738 2,737 2,686 Dauphin City 8,867 8,833 8,832 8,868 8,883 Dauphin RM 1,630 1,671 1,699 1,651 1,673 Elton RM 1,561 1,609 1,670 1,786 1,795 Grandview Municipality 1,539 1,537 1,550 1,529 1,529 Hamiota Municipality 1,393 1,393 1,381 1,391 1,369 Killarney-Turtle Mountain RM 3,421 3,466 3,491 3,550 3,588 Melita Town 1,131 1,162 1,190 1,200 1,176 Minnedosa Town 3,368 3,417 3,447 3,469 3,487 Mountain - North RM Mountain - South RM Municipality of Boissevain-Morton 2,343 2,339 2,371 2,424 2,432 Municipality of Brenda-Waskada Municipality of Clanwilliam-Erickson 1,035 1,057 1,060 1,046 1,048 Municipality of Deloraine-Winchester 1,467 1,485 1,496 1,499 1,480 Municipality of Ethelbert Municipality of Gilbert Plains 1,713 1,661 1,644 1,651 1,646 Municipality of Glenboro-South Cypress 1,314 1,321 1,308 1,336 1,312 Municipality of Glenella-Lansdowne 1,072 1,061 1,037 1,026 1,010 Municipality of Grassland 1,552 1,571 1,530 1,519 1,508 Municipality of Harrison Park 1,744 1,763 1,733 1,697 1,725 Municipality of Hillsburg-Roblin-Shell 3,302 3,376 3,352 3,363 3,267 Municipality of McCreary Municipality of Minitonas-Bowsman 1,912 1,903 1,854 1,785 1,768
67 Manitoba Health, Healthy Living and Seniors Population Report - June 1, 2015 Prairie Mountain Health Region Municipality Municipality of Norfolk-Treherne 1,600 1,576 1,567 1,542 1,473 Municipality of North Cypress-Langford 1,623 1,572 1,517 1,470 1,435 Municipality of Oakland-Wawanesa 1,426 1,427 1,454 1,466 1,461 Municipality of Roblin Municipality of Russell-Binscarth 2,732 2,769 2,777 2,881 2,905 Municipality of Souris-Glenwood 2,443 2,463 2,446 2,484 2,473 Municipality of Ste. Rose 1,943 1,946 1,961 1,974 1,981 Municipality of Swan Valley West 1,986 1,955 1,922 1,887 1,844 Municipality of Two Borders 1,246 1,194 1,161 1,128 1,110 Neepawa Town 4,284 4,469 4,947 5,120 5,325 Pipestone RM 1,618 1,622 1,624 1,637 1,634 Prairie View Municipality 2,274 2,311 2,310 2,287 2,296 Riverdale Municipality 1,975 2,013 2,022 2,015 1,989 RM of Ellice-Archie RM of Lakeshore 1,446 1,441 1,407 1,374 1,371 RM of Minto-Odanah RM of Mossey River 1,285 1,246 1,234 1,205 1,197 RM of Oakview 1,566 1,531 1,541 1,531 1,498 RM of Prairie Lakes 1,311 1,339 1,302 1,284 1,280 RM of Riding Mountain West 1,295 1,260 1,248 1,230 1,218 RM of Sifton 1,472 1,478 1,500 1,495 1,495 RM of Wallace-Woodworth 2,767 2,757 2,756 2,683 2,661 RM of Yellowhead 2,217 2,172 2,180 2,208 2,240 Rosedale RM 1,653 1,661 1,643 1,647 1,648 Rossburn Municipality 1,325 1,307 1,312 1,278 1,295 Swan River Town 5,233 5,309 5,321 5,345 5,310 Unorganized Territories - Parkland 2,856 2,826 2,828 2,789 2,742 Victoria RM 1,287 1,290 1,312 1,323 1,329 Virden Town 3,507 3,599 3,691 3,801 3,823
68 Manitoba Health, Healthy Living and Seniors Population Report - June 1, 2015 Prairie Mountain Health Region Municipality Whitehead RM Non-FN Sub-Total 158, , , , ,783 Birdtail Sioux FN Crane River FN Ebb & Flow FN Gamblers FN Indian Birch FN Keeseekoowenin FN Oak Lake Sioux FN Pine Creek FN Rolling River FN Shoal River FN Sioux Valley FN Valley River FN Waterhen FN Waywayseecappo FN 1,021 1,016 1,035 1,046 1,034 FN Sub-Total 5,686 5,716 5,760 5,705 5,694 R.H.A. Total 164, , , , ,477
69 Manitoba Health, Healthy Living and Seniors Population Report - June 1, 2015 Prairie Mountain Health Region Age Group 65+ Municipality Alonsa - Parkland RM Argyle RM Brandon City 6,778 6,946 7,196 7,416 7,603 Carberry Town Cartwright-Roblin Municipality Cornwallis RM Dauphin City 1,972 2,000 1,967 2,006 2,033 Dauphin RM Elton RM Grandview Municipality Hamiota Municipality Killarney-Turtle Mountain RM Melita Town Minnedosa Town Mountain - North RM Mountain - South RM Municipality of Boissevain-Morton Municipality of Brenda-Waskada Municipality of Clanwilliam-Erickson Municipality of Deloraine-Winchester Municipality of Ethelbert Municipality of Gilbert Plains Municipality of Glenboro-South Cypress Municipality of Glenella-Lansdowne Municipality of Grassland Municipality of Harrison Park Municipality of Hillsburg-Roblin-Shell Municipality of McCreary Municipality of Minitonas-Bowsman
70 Manitoba Health, Healthy Living and Seniors Population Report - June 1, 2015 Prairie Mountain Health Region Age Group 65+ Municipality Municipality of Norfolk-Treherne Municipality of North Cypress-Langford Municipality of Oakland-Wawanesa Municipality of Roblin Municipality of Russell-Binscarth Municipality of Souris-Glenwood Municipality of Ste. Rose Municipality of Swan Valley West Municipality of Two Borders Neepawa Town Pipestone RM Prairie View Municipality Riverdale Municipality RM of Ellice-Archie RM of Lakeshore RM of Minto-Odanah RM of Mossey River RM of Oakview RM of Prairie Lakes RM of Riding Mountain West RM of Sifton RM of Wallace-Woodworth RM of Yellowhead Rosedale RM Rossburn Municipality Swan River Town 1,124 1,136 1,149 1,160 1,167 Unorganized Territories - Parkland Victoria RM Virden Town
71 Manitoba Health, Healthy Living and Seniors Population Report - June 1, 2015 Prairie Mountain Health Region Age Group 65+ Municipality Whitehead RM Non-FN Sub-Total 28,338 28,779 29,245 29,718 30,031 Birdtail Sioux FN Crane River FN Ebb & Flow FN Gamblers FN Indian Birch FN Keeseekoowenin FN Oak Lake Sioux FN Pine Creek FN Rolling River FN Shoal River FN Sioux Valley FN Valley River FN Waterhen FN Waywayseecappo FN FN Sub-Total R.H.A. Total 28,608 29,070 29,540 30,033 30,346
72 Manitoba Health, Healthy Living and Seniors Population Report - June 1, 2015 Population of Southern Health-Santé Sud June 1, 2015
73
74 Southern Health-Santé Sud Region Manitoba Health, Healthy Living and Seniors Population Report - June 1, 2015 District Southern East Zone Gender Under Total Hanover F ,883 Niverville/Richot M ,980 F ,041 Rural East M ,100 F ,917 Ste Anne/La Broquerie M ,107 F ,211 Steinbach M ,354 F ,240 Tache M ,012 F ,603 M ,865 F 612 2,332 2,845 2,677 2,641 2,675 2,466 2,552 2,424 2,314 2,182 2,295 2,033 1,716 1, ,831 35,895 M 610 2,461 3,018 2,727 2,784 2,777 2,412 2,429 2,392 2,350 2,249 2,433 2,163 1,742 1,427 1,003 1,441 36,418
75 Southern Health-Santé Sud Region Manitoba Health, Healthy Living and Seniors Population Report - June 1, 2015 District Southern Mid Zone Gender Under Total Carman F ,850 MacDonald M ,894 F ,623 Morris M ,719 F ,556 Notre Dame/St Claude M ,512 F ,342 Red River South M ,448 F ,289 St. Pierre M ,373 F ,112 M ,154 F , ,090 1, ,099 14,772 M ,040 1,023 1,085 1, ,116 1, ,100
76 Southern Health-Santé Sud Region Manitoba Health, Healthy Living and Seniors Population Report - June 1, 2015 District Southern North Zone Gender Under Total Cartier/St. Francçois Xavier F ,660 City of Portage La Prairie M ,892 F ,956 MacGregor M ,582 F ,107 Rural Portage M ,274 F ,380 Seven Regions M ,615 F ,946 M ,227 F 297 1,154 1,530 1,353 1,308 1,396 1,214 1,208 1,169 1,228 1,206 1,422 1,399 1, ,368 20,049 M 344 1,326 1,493 1,487 1,493 1,555 1,347 1,246 1,158 1,241 1,224 1,442 1,411 1, ,040 20,590
77 Southern Health-Santé Sud Region Manitoba Health, Healthy Living and Seniors Population Report - June 1, 2015 District Southern West Zone Gender Under Total Altona F ,693 Lorne/Louise/Pembina M ,820 F ,971 Morden M ,044 F ,897 Roland/Thompson M ,747 F ,022 Stanley M ,067 F ,841 Winkler M ,009 F ,182 M ,140 F 387 1,636 2,054 1,911 1,962 1,986 1,648 1,618 1,569 1,476 1,434 1,609 1,391 1, ,916 25,606 M 482 1,738 2,150 2,074 2,143 2,102 1,759 1,600 1,513 1,458 1,538 1,552 1,479 1, ,320 25,827 RHA Sub-Total (Sex) F 1,480 5,958 7,517 6,903 6,889 7,024 6,236 6,266 6,029 5,901 5,728 6,416 5,876 4,936 3,898 3,051 6,214 96,322 M 1,662 6,387 7,701 7,311 7,505 7,558 6,382 6,199 5,986 5,947 5,917 6,543 6,149 4,980 4,119 2,942 4,647 97,935 RHA Total 3,142 12,345 15,218 14,214 14,394 14,582 12,618 12,465 12,015 11,848 11,645 12,959 12,025 9,916 8,017 5,993 10, ,257
78 Manitoba Health, Healthy Living and Seniors Population Report - June 1, 2015 Southern Health-Santé Sud Region District Southern East Zone Hanover Niverville/Richot Rural East Ste Anne/La Broquerie Steinbach Tache Southern Mid Zone Carman MacDonald Morris Notre Dame/St Claude Red River South St. Pierre Southern North Zone Cartier/St. Francçois Xavier City of Portage La Prairie MacGregor Rural Portage Seven Regions 11,895 12,061 10,199 10,570 3,862 3,850 9,736 10,110 19,728 20,500 8,690 9,003 5,598 5,653 6,607 6,777 4,939 4,986 2,786 2,783 4,561 4,583 4,125 4,186 6,871 7,002 15,036 15,221 4,207 4,245 6,775 6,832 6,130 6,126 12,262 13,002 13,863 11,094 11,684 12,141 3,956 3,956 4,024 10,463 11,542 12,565 21,327 20,817 20,252 9,193 9,263 9,468 5,691 5,728 5,744 6,991 7,136 7,342 5,058 5,076 5,068 2,811 2,809 2,790 4,628 4,648 4,662 4,266 4,244 4,266 7,194 7,373 7,552 15,314 15,529 15,538 4,256 4,362 4,381 6,879 6,889 6,995 6,193 6,153 6,173 Note: Manitoba Health Districts are defined by the RHAs, and are subject to change over time. For comparability, all populations have been tabulated using current district definitions, even if different definitions were in use during that population's year.
79 Manitoba Health, Healthy Living and Seniors Population Report - June 1, 2015 Southern Health-Santé Sud Region District Southern West Zone Altona Lorne/Louise/Pembina Morden Roland/Thompson Stanley Winkler 9,382 9,494 7,823 7,913 8,777 8,932 2,044 2,103 5,945 5,916 14,055 14,480 9,548 9,522 9,513 7,921 7,930 8,015 9,277 9,464 9,644 2,077 2,082 2,089 5,843 5,851 5,850 15,142 15,781 16,322 R.H.A. Total 179, , , , ,257 Note: Manitoba Health Districts are defined by the RHAs, and are subject to change over time. For comparability, all populations have been tabulated using current district definitions, even if different definitions were in use during that population's year.
80 Manitoba Health, Healthy Living and Seniors Population Report - June 1, 2015 Southern Health-Santé Sud Region Age Group 65+ District Southern East Zone Hanover Niverville/Richot Rural East Ste Anne/La Broquerie Steinbach Tache Southern Mid Zone Carman MacDonald Morris Notre Dame/St Claude Red River South St. Pierre Southern North Zone Cartier/St. Francçois Xavier City of Portage La Prairie MacGregor Rural Portage Seven Regions 981 1, ,257 1,340 2,229 2, ,127 1, ,338 2, ,043 1,045 1, ,029 1, ,396 1,500 1,575 2,433 2,499 2, ,193 1,201 1, ,466 2,516 2, Note: Manitoba Health Districts are defined by the RHAs, and are subject to change over time. For comparability, all populations have been tabulated using current district definitions, even if different definitions were in use during that population's year.
81 Manitoba Health, Healthy Living and Seniors Population Report - June 1, 2015 Southern Health-Santé Sud Region Age Group 65+ District Southern West Zone Altona Lorne/Louise/Pembina Morden Roland/Thompson Stanley Winkler 1,125 1,155 1,482 1,507 1,323 1, ,605 1,655 1,176 1,174 1,203 1,506 1,523 1,552 1,444 1,521 1, ,707 1,732 1,771 R.H.A. Total 21,998 22,723 23,477 24,178 24,871 Note: Manitoba Health Districts are defined by the RHAs, and are subject to change over time. For comparability, all populations have been tabulated using current district definitions, even if different definitions were in use during that population's year.
82 Manitoba Health, Healthy Living and Seniors Population Report - Southern Health-Santé Sud Region June 1, 2015 Municipality Gender Under Total Alonsa - Central RM F M Altona Town F ,578 M ,533 Carman Town F ,013 M ,928 Cartier RM F ,565 M ,618 De Salaberry RM F ,399 M ,445 Dufferin RM F M Hanover RM F ,883 M ,980 Headingley RM F ,508 M ,636 La Broquerie RM F ,408 M ,498 MacDonald RM F ,623 M ,719 Montcalm RM F M
83 Manitoba Health, Healthy Living and Seniors Population Report - Southern Health-Santé Sud Region June 1, 2015 Municipality Morden Town Gender Under Total F ,897 M ,747 Morris RM F ,395 M ,407 Morris Town F ,161 M ,105 Municipality of Emerson-Franklin F ,439 M ,456 Municipality of Lorne F ,718 M ,796 Municipality of Louise F M Municipality of North Norfolk F ,107 M ,274 Municipality of Pembina F ,174 M ,190 Municipality of Rhineland F ,115 M ,287 Municipality of Westlake-Gladstone F ,419 M ,485 Niverville Town F ,499 M ,404
84 Manitoba Health, Healthy Living and Seniors Population Report - Southern Health-Santé Sud Region June 1, 2015 Municipality Piney RM Gender Under Total F M Portage la Prairie City F ,956 M ,582 Portage la Prairie RM F ,868 M ,076 Ritchot RM F ,542 M ,696 RM of Grey F ,342 M ,448 Roland RM F M St Francois Xavier RM F M St Pierre-Jolys Village F M Stanley RM F ,841 M ,009 Ste Anne RM F ,449 M ,552 Ste Anne Town F ,354 M ,304
85 Manitoba Health, Healthy Living and Seniors Population Report - Southern Health-Santé Sud Region June 1, 2015 Municipality Steinbach City Gender Under Total F ,240 M ,012 Stuartburn RM F M Tache RM F ,603 M ,865 Thompson RM F M Unorganized Territories - South Eastman F M Winkler City F ,182 M ,140 Non-FN Sub-Total(Sex) F 1,422 5,755 7,241 6,691 6,688 6,841 6,089 6,131 5,919 5,772 5,607 6,303 5,788 4,871 3,864 3,033 6,192 94,207 M 1,599 6,155 7,430 7,087 7,256 7,330 6,219 6,038 5,865 5,825 5,804 6,438 6,061 4,924 4,084 2,915 4,632 95,662 Buffalo Point FN F M Dakota Plains FN F M Dakota Tipi FN F M Long Plain FN F M
86 Manitoba Health, Healthy Living and Seniors Population Report - Southern Health-Santé Sud Region June 1, 2015 Municipality Roseau River FN Gender Under Total F M Sandy Bay FN F ,197 M ,298 Swan Lake FN F M FN Sub-Total(Sex) F ,115 M ,273 RHA Sub-Total (Sex) F 1,480 5,958 7,517 6,903 6,889 7,024 6,236 6,266 6,029 5,901 5,728 6,416 5,876 4,936 3,898 3,051 6,214 96,322 M 1,662 6,387 7,701 7,311 7,505 7,558 6,382 6,199 5,986 5,947 5,917 6,543 6,149 4,980 4,119 2,942 4,647 97,935 RHA Total 3,142 12,345 15,218 14,214 14,394 14,582 12,618 12,465 12,015 11,848 11,645 12,959 12,025 9,916 8,017 5,993 10, ,257
87 Manitoba Health, Healthy Living and Seniors Population Report - June 1, 2015 Southern Health-Santé Sud Region Municipality Alonsa - Central RM Altona Town 4,797 4,974 4,999 5,048 5,111 Carman Town 3,640 3,743 3,805 3,905 3,941 Cartier RM 3,065 3,104 3,119 3,151 3,183 De Salaberry RM 2,753 2,801 2,853 2,822 2,844 Dufferin RM 1,958 1,910 1,886 1,823 1,803 Hanover RM 11,895 12,061 12,262 13,002 13,863 Headingley RM 2,676 2,732 2,872 3,016 3,144 La Broquerie RM 2,660 2,871 3,092 4,064 4,906 MacDonald RM 6,607 6,777 6,991 7,136 7,342 Montcalm RM 1,232 1,224 1,203 1,174 1,190 Morden Town 8,777 8,932 9,277 9,464 9,644 Morris RM 2,812 2,773 2,806 2,796 2,802 Morris Town 2,127 2,213 2,252 2,280 2,266 Municipality of Emerson-Franklin 2,812 2,828 2,851 2,904 2,895 Municipality of Lorne 3,360 3,405 3,430 3,449 3,514 Municipality of Louise 1,879 1,881 1,893 1,901 1,903 Municipality of North Norfolk 4,207 4,245 4,256 4,362 4,381 Municipality of Pembina 2,361 2,382 2,346 2,349 2,364 Municipality of Rhineland 4,585 4,520 4,549 4,474 4,402 Municipality of Westlake-Gladstone 2,930 2,889 2,969 2,914 2,904 Niverville Town 3,900 4,102 4,399 4,635 4,903 Piney RM 1,751 1,725 1,755 1,728 1,757 Portage la Prairie City 15,036 15,221 15,314 15,529 15,538 Portage la Prairie RM 5,843 5,889 5,885 5,870 5,944 Ritchot RM 6,299 6,468 6,695 7,049 7,238 RM of Grey 2,786 2,783 2,811 2,809 2,790 Roland RM St Francois Xavier RM 1,130 1,166 1,203 1,206 1,225
88 Manitoba Health, Healthy Living and Seniors Population Report - June 1, 2015 Southern Health-Santé Sud Region Municipality St Pierre-Jolys Village 1,372 1,385 1,413 1,422 1,422 Stanley RM 5,945 5,916 5,843 5,851 5,850 Ste Anne RM 4,645 4,747 4,856 4,924 5,001 Ste Anne Town 2,431 2,492 2,515 2,554 2,658 Steinbach City 19,728 20,500 21,327 20,817 20,252 Stuartburn RM 1,643 1,668 1,718 1,737 1,777 Tache RM 8,690 9,003 9,193 9,263 9,468 Thompson RM 1,148 1,182 1,182 1,171 1,161 Unorganized Territories - South Eastman Winkler City 14,055 14,480 15,142 15,781 16,322 Non-FN Sub-Total 175, , , , ,869 Buffalo Point FN Dakota Plains FN Dakota Tipi FN Long Plain FN Roseau River FN Sandy Bay FN 2,372 2,436 2,456 2,472 2,495 Swan Lake FN FN Sub-Total 4,072 4,183 4,304 4,321 4,388 R.H.A. Total 179, , , , ,257
89 Manitoba Health, Healthy Living and Seniors Population Report - June 1, 2015 Southern Health-Santé Sud Region Age Group 65+ Municipality Alonsa - Central RM Altona Town Carman Town Cartier RM De Salaberry RM Dufferin RM Hanover RM 981 1,008 1,043 1,045 1,076 Headingley RM La Broquerie RM MacDonald RM Montcalm RM Morden Town 1,323 1,387 1,444 1,521 1,561 Morris RM Morris Town Municipality of Emerson-Franklin Municipality of Lorne Municipality of Louise Municipality of North Norfolk Municipality of Pembina Municipality of Rhineland Municipality of Westlake-Gladstone Niverville Town Piney RM Portage la Prairie City 2,338 2,383 2,466 2,516 2,535 Portage la Prairie RM Ritchot RM RM of Grey Roland RM St Francois Xavier RM
90 Manitoba Health, Healthy Living and Seniors Population Report - June 1, 2015 Southern Health-Santé Sud Region Age Group 65+ Municipality St Pierre-Jolys Village Stanley RM Ste Anne RM Ste Anne Town Steinbach City 2,229 2,320 2,433 2,499 2,579 Stuartburn RM Tache RM Thompson RM Unorganized Territories - South Eastman Winkler City 1,605 1,655 1,707 1,732 1,771 Non-FN Sub-Total 21,864 22,591 23,338 24,024 24,720 Buffalo Point FN Dakota Plains FN Dakota Tipi FN Long Plain FN Roseau River FN Sandy Bay FN Swan Lake FN FN Sub-Total R.H.A. Total 21,998 22,723 23,477 24,178 24,871
91 Manitoba Health, Healthy Living and Seniors Population Report - June 1, 2015 Population of Winnipeg RHA June 1, 2015

92

93 Winnipeg Regional Health Authority Community Areas (CAs)
Population of Northern RHA June 1, 2018
 Manitoba Health, Seniors and Active Living Population Report - June 1, 2018 Population of Northern RHA June 1, 2018 Manitoba RHAs -- Northern Northern (c) Prov. of Manitoba, 2019 Cartography by: MHSAL,
Population of Southern Health-Santé Sud June 1, 2016
 Manitoba Health, Seniors and Active Living Population Report - Population of Southern Health-Santé Sud Manitoba RHAs -- Southern Health-Santé Sud Southern Health- Santé Sud (c) Prov. of Manitoba, 2017
Interlake Region - Waste Disposal Grounds and Waste Transfer Stations Nov. 07
 Interlake Region - Waste Disposal Grounds and Waste Transfer Stations Nov. 07 Eriksdale Waste Disposal Ground CLOSED 2002 Class 2 RM of Eriksdale NW 21-21-5W Contact: Marion Grogan, 642-8593 Box 10 Eriksdale,
Population of Southern Health-Santé Sud June 1, 2014
 Manitoba Health, Healthy Living & Seniors Population Report - June 1, 2014 Population of Southern Health-Santé Sud June 1, 2014 Manitoba RHAs -- Southern Health-Santé Sud Southern Health- Santé Sud (c)
INFRASTRUCTURE AND TRANSPORTATION ADVERTISING SCHEDULE 2015/2016 CONSTRUCTION AND MATERIAL SUPPLY TENDERS
 INFRASTRUCTURE AND TRANSPORTATION ADVERTISING SCHEDULE 2015/2016 CONSTRUCTION AND MATERIAL SUPPLY TENDERS Manitoba Infrastructure and Transportation Contract Services Branch 1630-215 Garry Street Winnipeg,
Population of Prairie Mountain Health June 1, 2018
 Manitoba Health, Seniors and Active Living Population Report - Population of Prairie Mountain Health Manitoba RHAs -- Prairie Mountain Health Prairie Mountain Health (c) Prov. of Manitoba, 2019 Cartography
Saskatchewan Health Populations
 Saskatchewan Health Populations Data Source The following pages present data from the Health Insurance Registration File (HIRF) for the City of Saskatoon as reported by ehealth Saskatchewan. This information,
STUV. Proposed Concept Plan UV 280 [\ 39 [\ 10 [\ 60 [\ 20 [\ 68 [\ 50 [\ 6 [\ 34 [\ 15 [\ 2 [\ 13 [\ 3 [\ 59 [\ 75. Bipole III Transmission Project
 BAY AM ISK RE S E RV E Kettle G.S. GILLAM Henday.S. Keewatinoow.S. Radisson.S. Limestone G.S. Long Spruce G.S. UV 280 Kelsey G.S. Wuskwatim G.S. THOMPSON [\ 6 BIPOLE I & II FLIN FLON GRA SS R IVER [\ 39
Allows the Licence Holder to Operate Minimum Age Medical Requirements Requirements up to
 Class Licences Professional and non-professional licences Applying for your licence Taking knowledge and road tests Chart showing the class of licence you require Table of Contents Different licences for
Suicide Deaths in BC
 Suicide Deaths in BC 2006-2016 This report summarizes all deaths classified as suicide between January 1, 2006 and December 31, 2016. This includes cases that have been completed and those still under
Passenger seat belt use in Durham Region
 Facts on Passenger seat belt use in Durham Region June 2017 Highlights In 2013/2014, 85 per cent of Durham Region residents 12 and older always wore their seat belt when riding as a passenger in a car,
This page is intentionally left blank.
 This page is intentionally left blank. Bipole III Southern Ground Electrode Line Route Selection Introduction Manitoba Hydro has recently selected a route for the southern ground electrode line (Map 1).
FALL 2017 ADVERTISING SCHEDULE
 INFRASTRUCTURE FALL 2017 ADVERTISING SCHEDULE CONSTRUCTION AND MATERIAL SUPPLY TENDERS Manitoba Infrastructure Contract Services Branch 1630 215 Garry Street Winnipeg, MB R3C 3P3 204 945 3637 The Construction
INTERSTATE BATTERY SYSTEM OF CANADA 2015 PRODUCT STEWARDSHIP ANNUAL REPORT. for MANITOBA
 INTERSTATE BATTERY SYSTEM OF CANADA 2015 PRODUCT STEWARDSHIP ANNUAL REPORT for MANITOBA Table of Contents Educational Material and Strategies...3 Collection Facilities...3 Reducing Environmental Impact...
2018 Municipal Census RESULTS CENSUS2018
 2018 Municipal Census RESULTS CENSUS2018 Introduction The 2018 Municipal Census was conducted by the City of Fort Saskatchewan, Legislative Services Department. This report provides data collected between
Canadian Motor Vehicle Traffic Collision Statistics. Collected in cooperation with the Canadian Council of Motor Transport Administrators
 Canadian Motor Vehicle Traffic Collision Statistics 2015 Collected in cooperation with the Canadian Council of Motor Transport Administrators Her Majesty the Queen in Right of Canada, represented by the
The Used Petroleum and Antifreeze Products Stewardship Regulations
 USED PETROLEUM AND ANTIFREEZEPRODUCTS STEWARDSHIP E-10.22 REG 7 1 The Used Petroleum and Antifreeze Products Stewardship Regulations being Chapter E-10.22 Reg 7 (effective January 1, 2018). NOTE: This
Insolvency Statistics in Canada. Second Quarter of 2014
 Insolvency Statistics in Canada Second Quarter of 2014 List of Tables Table 1: Total Insolvencies... 1 Table 2: Insolvencies Filed by Consumers... 2 Table 3: Insolvencies Filed by Businesses... 3 Table
School Districts of Randolph County, IN Demographic Study
 School Districts of Randolph County, IN Demographic Study November 15, 2017 McKibben Demographic Research Jerome McKibben, Ph.D. Rock Hill, SC j.mckibben@mckibbendemographics.com 978-501-7069 Assumptions
2012 Water Consumption Statistics Report. Water Services Department
 212 Water Consumption Statistics Report Water Services Department Issued: December 213 TABLE OF CONTENTS 212 Water Consumption Statistics Report December 213 212 GVWD Statistics Book - Notes...3 Annual
Motor Vehicle Related Fatalities 10-year Statistics for British Columbia Research and Data Unit Policy and Strategic Initiatives Branch
 Motor Vehicle Related Statistics for British Columbia 2008-2017 Research and Data Unit Policy and Strategic Initiatives Branch Website: www.gov.bc.ca/roadsafetybc Twitter: http://twitter.com/ October 2018
Insolvency Statistics in Canada. Second Quarter of 2012
 Insolvency Statistics in Canada Second Quarter of 2012 Insolvency Statistics in Canada Second Quarter 2012 List of Tables Table 1: Total Insolvencies...1 Table 2: Insolvencies Filed by Consumers...2 Table
HIGH PROFILE RETAIL SPACE ON ICONIC GREEN BAY ROAD
 LEASE OVERVIEW AVAILABLE SF: LEASE RATE: YEAR BUILT: 2017 ZONING: MARKET: 2,000-6,200 SF $29.00 SF/Yr (NNN) Village Center Pedestrian Commercial West Chicago PROPERTY DESCRIPTION Incredible retail lease
Analysis of Road Crash Statistics Western Australia 1990 to Report. December Project: Transport/21
 Analysis of Road Crash Statistics Western Australia 1990 to 1999 Report December 2000 Project: Transport/21 Analysis of Road Crash Statistics Western Australia 1990 to 1999 December 2000 Client: Transport
Missouri Seat Belt Usage Survey for 2017
 Missouri Seat Belt Usage Survey for 2017 Conducted for the Highway Safety & Traffic Division of the Missouri Department of Transportation by The Missouri Safety Center University of Central Missouri Final
2017 MBNCanada Performance Measurement Report Licensing - 109
 2017 MBNCanada Performance Measurement Report Licensing - 109 Fig. 19.1 Number of Taxi Driver Licenses Issued per 100,000 Population A taxi driver license is issued to an individual and permits them to
Options and Recommendations. Douglas County Park and Ride
 Options and Recommendations Douglas County Park and Ride Northwest Regional Planning Commission February 2012 Douglas County Park and Ride Options and Recommendations ENERGY COMMITTEE David Conley, Chair
SULPHUR IN DIESEL FUEL REGULATIONS [FEDERAL]
![SULPHUR IN DIESEL FUEL REGULATIONS [FEDERAL]](/thumbs/88/116043249.jpg "SULPHUR IN DIESEL FUEL REGULATIONS [FEDERAL]") PDF Version [Printer-friendly - ideal for printing entire document] SULPHUR IN DIESEL FUEL REGULATIONS [FEDERAL] Published by Quickscribe Services Ltd. Updated To: [includes SOR/2006-163 amendments] Important:
PDF Version [Printer-friendly - ideal for printing entire document] SULPHUR IN DIESEL FUEL REGULATIONS [FEDERAL] Published by Quickscribe Services Ltd. Updated To: [includes SOR/2006-163 amendments] Important:
Canadian Motor Vehicle Traffic Collision Statistics
 TP3322 (11/2010) Canadian Motor Vehicle Traffic Collision Statistics Collected in cooperation with the Canadian Council of Motor Transport Administrators TC-1004019 *TC-1003618* Collisions and Casualties
Water Consumption Statistics Report
 Water Consumption Statistics Report Operations and Maintenance Department 29 Edition TABLE OF CONTENTS 29 Water Consumption Statistics Report October 21 SYSTEM AND MUNICIPAL CONSUMPTION 29 GVWD Statistics
Municipal District of Taber Synchronized With The Alberta Township System
 Municipal District of Taber Synchronized With The Alberta Township System The Alberta Township System The Alberta Township System is another Name for the Dominion Land Survey System that was developed
Robb Drive Development
 O f f e r i n g M e m o r a n d u m Robb Drive Development Interstate 80 & Robb Drive Reno, Nevada 8 5 A c r e s p r e s e n t e d e x c l u s i v e l y b y R o n C o b b Principal Direct: (775) 329-4000
2016 Community Report De Baca County
 6 De Baca County Produced for the New Mexico Department of Transportation, Traffic Safety Division, Traffic Records Bureau, Under Contract 58 by the University of New Mexico, Geospatial and Population
Summary findings. 1 Missouri has a greater population than any State ranked 1-9 in core group labor force participation.
 Labor in Missouri MSCDC Economic Report Series No. 9903 December 2000 By Professor John O. Ward, Chairman, UMKC Department of Economics Kurt V. Krueger, Department of Economics Graduate Student Michael
NSWRL JUNIOR RUGBY LEAGUE COMPETITIONS. DRAFT Conferences Proposal
 JUNIOR RUGBY LEAGUE COMPETITIONS DRAFT Conferences Proposal ITEMS 1. CONFERENCE COMPETITIONS. FORMAT AND AGE GROUPS. CALENDAR (PRE AND REGULAR SEASON). RULES AND BYLAWS. JUDICIARY AND CODE OF CONDUCT.
The Courtyard Building - 2nd & 3rd Floor For Sale
 Executive Summary PROPERTY SUMMARY Sale Price: $2,011,000 Subject Property SqFt: 36,575 SF Price Per SF: $54.98 Parking Spaces: 226 Building Renovated: 2016 Zoning: Sea Pines Commercial Market: Hilton
The Manitoba Workplace Injury Statistics Report
 2008 2017 The Manitoba Workplace Injury Statistics Report Table of Contents Methodology Note for 2008-2017 Injury Statistics Report... 3 Major Highlights of Manitoba Workplace Injury Data, 2008 to 2017...
LONG-TERM DEVELOPMENT PLAN for Manitoba Hydro's Electrical Transmission System
 LONG-TERM DEVELOPMENT PLAN 2013 for Manitoba Hydro's Electrical Transmission System Manitoba Hydro s Existing Generating Stations and Transmission System Missi Falls Laurie River #2 Laurie River #1 Notigi
National Center for Statistics and Analysis Research and Development
 U.S. Department of Transportation National Highway Traffic Safety Administration DOT HS 809 271 June 2001 Technical Report Published By: National Center for Statistics and Analysis Research and Development
GERIATRIC PSYCHIATRY PROGRAMME CLINICAL / RESEARCH BULLETIN NUMBER 16
 GERIATRIC PSYCHIATRY PROGRAMME CLINICAL / RESEARCH BULLETIN NUMBER 16 DEMENTIA PROJECTIONS FOR THE COUNTIES, REGIONAL MUNICIPALITIES, AND CENSUS DIVISIONS OF ONTARIO (USING CSHA PREVALENCE DATA) Robert
The Manitoba Workplace Injury Statistics Report
 The Manitoba Workplace Injury Statistics Report 2000 2014 Table of Contents Acknowledgements... 2 Methodology Note on 2009 Extension of WCB Coverage and Change in Average Weekly Earnings... 2 Major Highlights
TRAFFIC IMPACT STUDY VICDOM BROCK ROAD PIT EXPANSION
 TRAFFIC IMPACT STUDY VICDOM BROCK ROAD PIT EXPANSION TOWNSHIP OF UXBRIDGE P/N 05-1993 June 2011 Revised -August 2011 Prepared by: Skelton, Brumwell & Associates Inc. 93 Bell Farm Road, Suite 107 Barrie,
CITY OF GRANDE PRAIRIE OFFICE CONSOLIDATION BYLAW C A Bylaw to Establish a Transportation System For the City of Grande Prairie
 CITY OF GRANDE PRAIRIE OFFICE CONSOLIDATION BYLAW C-1265 A Bylaw to Establish a Transportation System For the City of Grande Prairie (As Amended by Bylaws C-1265A and C-1265B) WHEREAS the Council of the
Produced by the BPDA Research Division:
 March 2018 Produced by the BPDA Research Division: Alvaro Lima Director Jonathan Lee Deputy Director Christina Kim Research Manager Phillip Granberry Senior Researcher/Demographer Matthew Resseger Senior
The Manitoba Workplace Injury Statistics Report
 The Manitoba Workplace Injury Statistics Report 2007 2016 Table of Contents Methodology Note for 2007-2016 Injury Statistics Report... 2 Major Highlights of Manitoba Workplace Injury Data, 2007 to 2016...
2015 Community Report Los Lunas
 25 Los Lunas Produced for the New Mexico Department of Transportation, Traffic Safety Division, Traffic Records Bureau, Under Contract 58 by the University of New Mexico, Geospatial and Population Studies,
Transportation Statistical Data Development Report BAY COUNTY 2035 LONG RANGE TRANSPORTATION PLAN
 Transportation Statistical Data Development Report BAY COUNTY 2035 LONG RANGE TRANSPORTATION PLAN Prepared for Bay County Transportation Planning Organization and The Florida Department of Transportation,
car2go Toronto Proposal for on-street parking pilot project
 car2go Toronto Proposal for on-street parking pilot project Public Works & Infrastructure Committee June 18, 2014 Car2go Overview car2go is currently operating in 14 cities in North America, 12 cities
Kettle River Transmission Project
 April 2012 Why are you receiving this project information package? New transmission facilities are needed in the Fort McMurray area. ATCO Electric has been directed by the Alberta Electric System Operator
Bohn to Kettle River Transmission Project
 April 2012 Why are you receiving this project information package? New transmission facilities are needed in the Fort McMurray area. ATCO Electric has been directed by the Alberta Electric System Operator
Report 2.0 RECOMMENDATION 1.0 PURPOSE 3.0 EXECUTIVE SUMMARY 4.0 INPUT FROM OTHER SOURCES
 Report To: Community Services Committee Item: Date of Report: CS-11-13 January 12,201 1 From: Bob Duignan File: Date of Meeting: City Manager D-1100 January 20,2011 Subject: Craig Kelly, Director Works
Chapter 1 POPULATION
 Chapter 1 POPULATION Women & Men In India- 2016 1 2 Population related Statistics Population and related Statistics This chapter presents the important statistics on population characteristics from a gender
FITCHBURG GAS AND ELECTRIC LIGHT COMPANY NET METERING SCHEDULE NM
 Sheet 1 FITCHBURG GAS AND ELECTRIC LIGHT COMPANY SCHEDULE NM Applicability The following tariff provisions shall be applicable to a Host Customer, as defined herein, that requests net metering services
POPULATION. Chapter 1
 Chapter 1 POPULATION Coverage Rural urban Distribution of Sex Ratio and Population Growth Rate in Post-Independence India State-wise percent share of Female population in Total Population Year-wise State-wise
GREENE COUNTY SCHOOLS ENROLLMENT PROJECTIONS REPORT APRIL 12, 2017
 APRIL 12, 2017 PREPARED FOR: Greene County Schools 910 West Summer Street Greeneville, TN 37743 T 423-639-4194 PREPARED BY: Cooperative Strategies 3325 Hilliard Rome Road Hilliard, OH 43026 T 614.798.8828
2014 Community Report Los Lunas
 4 Los Lunas Produced for the New Mexico Department of Transportation, Traffic Safety Division, Traffic Records Bureau, Under Contract 58 by the University of New Mexico, Geospatial and Population Studies,
Fire Station Location Study
 Fire Rescue Department Fire Station Location Study March 24, 2015 PRESENTATION OUTLINE BACKGROUND SCOPE OF THE STUDY STUDY METHODOLOGY STUDY COMPONENTS SUMMARY QUESTIONS CURRENT SERVICE LEVEL NUMBER OF
STRATEGIC PRIORITIES AND POLICY COMMITTEE MAY 5, 2016
 STRATEGIC PRIORITIES AND POLICY COMMITTEE MAY 5, 2016 Shift Rapid Transit Initiative Largest infrastructure project in the city s history. Rapid Transit initiative will transform London s public transit
Pole Side Impact GTR: Assessment of Safety Need: Updated Data Collection
 Pole Side Impact GTR: Assessment of Safety Need: Updated Data Collection Thomas Belcher 2 nd Meeting - GRSP Informal Group on a Pole Side Impact GTR Brussels, Belgium, 3-4 March 2011 Definition of Pole
Gold Saskatchewan Provincial Economic Accounts. January 2018 Edition. Saskatchewan Bureau of Statistics Ministry of Finance
 Gold Saskatchewan Provincial Economic Accounts January 2018 Edition Saskatchewan Bureau of Statistics Ministry of Finance Contents Introduction and Overview... 1 Introduction... 1 Revisions in the January
WORTHINGTON SCHOOLS ENROLLMENT PROJECTIONS REPORT JANUARY 25, 2019
 JANUARY 25, 2019 PREPARED FOR: Worthington Schools 200 E. Wilson Bridge Rd. Worthington, OH 43085 T 614.450.6000 PREPARED BY: Cooperative Strategies 3325 Hilliard Rome Road Hilliard, OH 43026 T 614.798.8828
TORONTO TRANSIT COMMISSION REPORT NO.
 Revised: March/13 TORONTO TRANSIT COMMISSION REPORT NO. MEETING DATE: March 26, 2014 SUBJECT: COMMUNITY BUS SERVICES ACTION ITEM RECOMMENDATION It is recommended that the Board not approve any routing
Evaluation of the Performance of Back-to-Back HVDC Converter and Variable Frequency Transformer for Power Flow Control in a Weak Interconnection
 Evaluation of the Performance of Back-to-Back HVDC Converter and Variable Frequency Transformer for Power Flow Control in a Weak Interconnection B. Bagen, D. Jacobson, G. Lane and H. M. Turanli Manitoba
Manitoba Hydro Generation Interconnection Exploratory Study Notice September 28, 2006
 Manitoba Hydro Generation Interconnection Exploratory Study Notice September 28, 2006 As per the Manitoba Hydro Open Access Interconnection Tariff, the Transmission Owner has contracted TransGrid Solutions
2015 Community Report White Rock
 5 White Rock Produced for the New Mexico Department of Transportation, Traffic Safety Division, Traffic Records Bureau, Under Contract 58 by the University of New Mexico, Geospatial and Population Studies,
Postal Standards Lettermail
 Canada Post Prices - 2018 Postal Standards Lettermail CONSUMER (COUNTER) PRICES Effective January 15, 2018 Trade-mark of Canada Post Corporation. OM Official mark of Canada Post Corporation. canadapost.ca/prices
Copyright Australian Hearing Demographic Details
 1 Demographic Details Of young Australians aged less than 26 years with a hearing loss, who have been fitted with a hearing aid or cochlear implant at 31 December 2016 2 Summary: This circular contains
Postal Standards Lettermail
 Canada Post Prices - 2017 Postal Standards Lettermail CONSUMER (COUNTER) PRICES Effective January 16, 2017 Trade-mark of Canada Post Corporation. OM Official mark of Canada Post Corporation. canadapost.ca/prices
2016 Community Report Portales
 6 Portales Produced for the New Mexico Department of Transportation, Traffic Safety Division, Traffic Records Bureau, Under Contract 58 by the University of New Mexico, Geospatial and Population Studies,
2015 Community Report Grants
 5 Grants Produced for the New Mexico Department of Transportation, Traffic Safety Division, Traffic Records Bureau, Under Contract 58 by the University of New Mexico, Geospatial and Population Studies,
Manitoba Immunization Monitoring System (MIMS)
") Manitoba Immunization Report Manitoba Immunization Monitoring System (MIMS) Annual Report 2007 COMMUNICABLE DISEASE CONTROL Communicable Disease Control Branch Public Health Division Manitoba Health and
Manitoba Immunization Report Manitoba Immunization Monitoring System (MIMS) Annual Report 2007 COMMUNICABLE DISEASE CONTROL Communicable Disease Control Branch Public Health Division Manitoba Health and
2016 Community Report Los Alamos County
 6 Los Alamos County Produced for the New Mexico Department of Transportation, Traffic Safety Division, Traffic Records Bureau, Under Contract 58 by the University of New Mexico, Geospatial and Population
2014 Community Report Portales
 4 Portales Produced for the New Mexico Department of Transportation, Traffic Safety Division, Traffic Records Bureau, Under Contract 58 by the University of New Mexico, Geospatial and Population Studies,
2015 Community Report Las Vegas
 5 Las Vegas Produced for the New Mexico Department of Transportation, Traffic Safety Division, Traffic Records Bureau, Under Contract 58 by the University of New Mexico, Geospatial and Population Studies,
2012/13 Power Resource Development Plan The Sales Package
 MANITOBA HYDRO 2012/13 POWER RESOURCE PLAN Date: September 30, 2012 The purpose of the 2012/13 Power Resource Plan is to provide plans for the long-term power resource development plan for Manitoba Hydro
TRAVEL DEMAND FORECASTS
 Jiangxi Ji an Sustainable Urban Transport Project (RRP PRC 45022) TRAVEL DEMAND FORECASTS A. Introduction 1. The purpose of the travel demand forecasts is to assess the impact of the project components
2014 Community Report Luna County
 4 Luna County Produced for the New Mexico Department of Transportation, Traffic Safety Division, Traffic Records Bureau, Under Contract 58 by the University of New Mexico, Geospatial and Population Studies,
THE BELT RAILWAY COMPANY OF CHICAGO
 THE BELT RAILWAY COMPANY OF CHICAGO CORA Update 2017-003 Effective 0001, June 19, 2017: Summary of Changes: Replacement section for entire BRC Section of CORA Operating Guide Designation of Lines with
2015 Community Report Tularosa
 5 Tularosa Produced for the New Mexico Department of Transportation, Traffic Safety Division, Traffic Records Bureau, Under Contract 58 by the University of New Mexico, Geospatial and Population Studies,
Municipalities of the Province of Manitoba. Municipalités de la province du Manitoba
 2007 6 Municipalities of the Province of Manitoba Municipalités de la province du Manitoba 2 FOREWORD The 2007 Statistical Information for Municipalities in the Province of Manitoba provides statistical
2016 Community Report Torrance County
 6 Torrance County Produced for the New Mexico Department of Transportation, Traffic Safety Division, Traffic Records Bureau, Under Contract 58 by the University of New Mexico, Geospatial and Population
2015 Community Report Torrance County
 5 Torrance County Produced for the New Mexico Department of Transportation, Traffic Safety Division, Traffic Records Bureau, Under Contract 58 by the University of New Mexico, Geospatial and Population
Monthly Biodiesel Production Report
 Monthly Biodiesel Production Report With data for June 2017 August 2017 Independent Statistics & Analysis www.eia.gov U.S. Department of Energy Washington, DC 20585 This report was prepared by the U.S.
2015 Community Report Chaparral
 5 Chaparral Produced for the New Mexico Department of Transportation, Traffic Safety Division, Traffic Records Bureau, Under Contract 58 by the University of New Mexico, Geospatial and Population Studies,
2016 Community Report Aztec
 Aztec Produced for the New Mexico Department of Transportation, Traffic Safety Division, Traffic Records Bureau, Under Contract 58 by the University of New Mexico, Geospatial and Population Studies, Traffic
2015 Community Report Aztec
 25 Aztec Produced for the New Mexico Department of Transportation, Traffic Safety Division, Traffic Records Bureau, Under Contract 58 by the University of New Mexico, Geospatial and Population Studies,
2014 Community Report Las Vegas
 4 Las Vegas Produced for the New Mexico Department of Transportation, Traffic Safety Division, Traffic Records Bureau, Under Contract 58 by the University of New Mexico, Geospatial and Population Studies,
2014 Community Report Truth or Consequences
 4 Truth or Consequences Produced for the New Mexico Department of Transportation, Traffic Safety Division, Traffic Records Bureau, Under Contract 58 by the University of New Mexico, Geospatial and Population
2016 Community Report Santa Fe County
 26 Santa Fe County Produced for the New Mexico Department of Transportation, Traffic Safety Division, Traffic Records Bureau, Under Contract 58 by the University of New Mexico, Geospatial and Population
NDC. National Demographics Corporation. City of Merced 2015 Public Participation Districting Kit. Printed Contents (in the Acrobat PDF file)
") NDC National Demographics Corporation Printed Contents (in the Acrobat PDF file) City of Merced 2015 Public Participation Districting Kit 1. This information and instruction page. 2. Listing of criteria
NDC National Demographics Corporation Printed Contents (in the Acrobat PDF file) City of Merced 2015 Public Participation Districting Kit 1. This information and instruction page. 2. Listing of criteria
2014 Community Report Tularosa
 4 Tularosa Produced for the New Mexico Department of Transportation, Traffic Safety Division, Traffic Records Bureau, Under Contract 8 by the University of New Mexico, Geospatial and Population Studies,
2016 Community Report San Juan County
 26 San Juan County Produced for the New Mexico Department of Transportation, Traffic Safety Division, Traffic Records Bureau, Under Contract 58 by the University of New Mexico, Geospatial and Population
2015 Community Report San Juan County
 25 San Juan County Produced for the New Mexico Department of Transportation, Traffic Safety Division, Traffic Records Bureau, Under Contract 58 by the University of New Mexico, Geospatial and Population
2015 Community Report Doña Ana County
 25 Doña Ana County Produced for the New Mexico Department of Transportation, Traffic Safety Division, Traffic Records Bureau, Under Contract 58 by the University of New Mexico, Geospatial and Population
One-Hundred-Year Storm Elevation Requirements for Habitable Structures Located Seaward of a Coastal Construction Control Line
 One-Hundred-Year Elevation Requirements for Habitable Structures Located Seaward of a Coastal Construction Control Line ELEVATION CERTIFICATE AND INSTRUCTIONS Prepared by: Florida Department of Environmental
2014 Community Report Aztec
 Aztec Produced for the New Mexico Department of Transportation, Traffic Safety Division, Traffic Records Bureau, Under Contract 58 by the University of New Mexico, Geospatial and Population Studies, Traffic
Total Three Months 8. Breastfed Two Weeks 5. Total Twelve Months 12. Breastfed Twelve Months 13. Total Two Weeks 4. Initiated Breastfeeding 3
 Preliminary Breastfeeding Initiation and Duration at Weeks and,, Six and Months for CHB City of Residence 1 2 Months 7 Minnesota Department of Health WIC Program 1 July 2018 Months 9 Six Six Aitkin-Itasca-
inter.noise 2000 The 29th International Congress and Exhibition on Noise Control Engineering August 2000, Nice, FRANCE
 Copyright SFA - InterNoise 2000 1 inter.noise 2000 The 29th International Congress Exhibition on Noise Control Engineering 27-30 August 2000, Nice, FRANCE I-INCE Classification: 0.2 ITALIAN LEGISLATION
Chapter 2 HEALTH. Women & Men In India
 Chapter 2 HEALTH Women & Men In India 2016 19 20 Health related statistics Health A healthy population being the basic necessity for development, it is essential to assess the variability in terms of gender
HALTON REGION SUB-MODEL
 WORKING DRAFT GTA P.M. PEAK MODEL Version 2.0 And HALTON REGION SUB-MODEL Documentation & Users' Guide Prepared by Peter Dalton July 2001 Contents 1.0 P.M. Peak Period Model for the GTA... 4 Table 1 -