2018 Municipal Census RESULTS CENSUS2018
|
|
|
- Jonathan Bruce
- 5 years ago
- Views:
Transcription


1 2018 Municipal Census RESULTS CENSUS2018
2 Introduction The 2018 Municipal Census was conducted by the City of Fort Saskatchewan, Legislative Services Department. This report provides data collected between April 2, 2018 and June 5, 2018 on the number of City residents in the home, the age and gender of each person, employment status, employment location, and length of residence in the City, as well as other information. Additional details on the 2018 Municipal Census can be obtained from: Legislative Services City of Fort Saskatchewan Street Fort Saskatchewan, AB T8L 2C5 Website: fortsask.ca Methods Under the supervision of the Legislative Services Department, residents were able to complete the census online. Enumerators entered census information electronically at each household which did not complete their census online prior to April 23, This report represents the results of the census in tables and figures. Where possible, census data from 2017, 2016, 2015, and 2014 are provided for comparison and to identify population trends. 1
3 Results Total Population The total population of Fort Saskatchewan as of April 2, 2018 was 26,328 (Table 1). This includes 541 residents of the Fort Saskatchewan Correctional Centre. The population has increased by 795 residents in 2018 from 2017, which represents an increase of 3.11% (Table 2). Table 1. Total Population Year Population 26,328 25,533 24,569 24,040 22,808 21,795 20,475 18,653 17,469 Table 2. Annual Percent Increase in Population Census Year Percent Increase Population by Gender In 2018, 47.1% of the population is male, while 45.8% is female (Table 3). Table 3. Population by Gender Gender N % N % N % N % N % Male 12, , , , , Female 12, , , , , Other Not Stated 1, , , , Total 26, , , , ,
4 Population by Age and Gender Table 4 and Figure 1 show that the age group includes the most number of residents, followed closely by the and the age groups. Table 4. Population by Age and Gender Gender Age Age N % N % N % N % N % , Male , , , , , , , , , , , Not Stated Not Stated Total Male 12, , , ,
5 Table 4. Population by Age and Gender (Continued) Gender Age Age N % N % N % N % N % , Female , , , , , , , , , Not Stated Not Stated Total Female 12, , , , Not Stated 1, , , , Other Total 26, , , , , * The 5-19, 25-44, 45-64, and age groups were further expanded in

6 Figure 1. Population by Age and Gender 5
7 Household Size The most common number of residents per household continues to be two people (Table 5). Table 5. Household Size Size N % N % N % N % N % 1 Person 2, , , , , People 3, , , , , People 1, , , , , People 1, , , , , People People Total 9, , , , , Profile of Dwellings The total number of Fort Saskatchewan dwellings in 2018 was 11,179. The occupancy rate is 88.9% and the vacancy rate is 5.8% as shown in Table 6. There were also 435 vacant lots (not shown in table). Table 6. Profile of Dwellings Status N % N % N % N % N % Occupied 9, , , , , Vacant Dwelling Under Construction , Total 11, , , , ,
8 Dwelling Type Single detached houses remain the predominant type of dwelling in Fort Saskatchewan (Table 7). Apartments, duplexes, and row houses are the next popular dwelling types for Fort Saskatchewan. Vacant dwellings were recorded at 650 (Table 6) and there was a total of 911 no responses for this question. Table 7. Dwelling Types Type N % N % N % N % N % Single Detached 5, , , , , Apartment 1, , , , Duplex 1, , Row House Tri/Quadraplex Mobile Home Secondary Suite* Other** Not Stated , Total 9, , , , , * Secondary Suite includes separate suites in single detached houses and single dwellings attached to non-residential structures. ** Other includes institutions and collective dwellings. 7

9 Employment Status The employment status results show that 39.1% of residents who responded are employed fulltime and that Fort Saskatchewan has a 4.86% unemployment rate. Table 8. Employment Status by Gender Employment status Male Female Other 2018 Not Stated Total % Employed Full-time 6,193 4, , Employed Part-time 420 1, , Homemaker Other Permanently Unable to Work Retired 1,292 1, , Student , Unemployed, Seeking Work Not Stated ,744 2, Not Eligible to Answer * 2,649 2, , Total 12,392 12, ,852 26, * Responses from Age 0-14 are counted as Not Eligible to Answer and are omitted from the graph. ** Student category was added for Youths/adults may not be working, but are going to school full-time. Figure 2. Employment Status 8
10 Figure 3. Employment Status by Gender 9
11 Table 9. Employment Status by Age Employment status Employed Full-time Employed Part-time and Over Not Stated ,428 1,638 1,467 1,231 1,068 1, , ,727 Homemaker Other Permanently Unable to Work Retired ,883 Student ,183 Unemployed, Seeking Work Not Stated ,867 2,883 Not Eligible to Answer * 1,862 1,768 1,543 5,173 Total 1,862 1,768 1, ,381 2,045 2,380 2,084 1,643 1,448 1,474 1,417 1, ,119 1,970 26,328 Total * Responses from Age 0-14 are counted as Not Eligible to Answer and are omitted from the graph. 10

12 Figure 4. Employment status by age 11
13 Employment Location The 2018 Census included a question on employment location showing 18.7% of residents who responded work locally within Fort Saskatchewan. Table 10. Employment Location by Gender Employment Location Male Female Other 2018 Not Stated Total % Beaumont Bon Accord Devon Edmonton Downtown Edmonton NE Edmonton NW Edmonton SE Edmonton SW Fort Saskatchewan 2,168 2, , Gibbons Leduc Leduc County Morinville No Usual Place of Work Other Other Municipality in Alberta Other Province in Canada Outside Canada Parkland County Redwater Rural Strathcona County Sherwood Park Spruce Grove St. Albert Sturgeon County Works at Home Not Stated 3,103 4, ,776 8, Not Eligible to Answer * 2,649 2, , Total 12,392 12, ,852 26, * Responses from Age 0-14 are counted as Not Eligible to Answer and are omitted from the graph. 12


14 Figure 5. Employment Location Figure 6. Employment Location by Gender 13
15 Table 11. Employment Location by Age 2018 Employment Location and Over Not Stated Total Beaumont Bon Accord Devon 1 1 Edmonton Downtown Edmonton NE Edmonton NW Edmonton SE Edmonton SW Fort Saskatchewan ,932 Gibbons Leduc Leduc County Morinville No Usual Place of Work Other Other Municipality in Alberta Other Province in Canada Outside Canada Parkland County Redwater Rural Strathcona County Sherwood Park Spruce Grove St. Albert Sturgeon County Works at Home Not Stated ,100 1,913 8,953 Not Eligible to Answer * 1,862 1,768 1,543 5,173 Total 1,862 1,768 1, ,381 2,045 2,380 2,084 1,643 1,448 1,474 1,417 1, ,119 1,970 26,328 * Responses from Age 0-14 are counted as Not Eligible to Answer 14

16 Length of Residency The 2018 Census included a question on the length of residency within Fort Saskatchewan showing 35.9% of residents who responded have lived here 10 years or longer. Table 12. Length of Residency by Gender Length of Residency Male Female Other 2018 Not Stated Total % Less than 6 months months to less than 1 year , year to less than 2 years , years to less than 5 years 2,494 2, , years to less than 10 years 2,464 2, , or more years 4,730 4, , Not Stated ,724 2, Total 12,392 12, ,852 26, Figure 7. Length of Residency 15
17 Figure 8. Length of Residency by Gender 16
18 Table 13. Length of Residency by Age Length of Residency Less than 6 months months to less than 1 year ,394 1 year to less than 2 years ,879 2 years to less than 5 years ,077 5 years to less than 10 years 7 1, , or more years ,433 Not Stated ,825 2,728 Total 1,862 1,768 1, ,381 2,045 2,380 2,084 1,643 1,448 1,474 1,417 1, ,119 1,970 26, and Over Not Stated Total 17
19 Figure 9. Length of Residency by Age 18
20 Education The predominant level of education in Fort Saskatchewan is a Post-Secondary Diploma/ Certificate at 19.0% followed by a High School Diploma at 16.2%. Table 14. Level of Education by Gender Education Level Male Female Other 2018 Not Stated Total % Grades K-8 1,566 1, , Some High School 1, , High School Diploma 2,016 2, , Some College/Tech. 1,521 1, , Post Sec. Dip./Cert. 2,667 2, , Some University University Degree 1,032 1, , Master s Degree or Higher Other Not Stated , Not Eligible to Answer * ,762 3, Total 12,392 12, ,852 26, * Responses from Age 0-4 are counted as Not Eligible to Answer and are omitted from the graph. Figure 10. Level of Education 19

21 Figure 11. Level of Education by Gender 20
22 Table 15. Level of Education by Age 2018 Education Level and Over Not Stated Total Grades K-8 1,611 1, ,053 Some High School ,934 High School Diploma ,254 Some College/Tech ,661 Post Sec. Dip./Cert ,001 Some University University Degree ,633 Master s Degree Other Not Stated ,895 3,349 Not Eligible to Answer * 1,862 1,862 Total 1,862 1,768 1, ,381 2,045 2,380 2,084 1,643 1,448 1,474 1,417 1, ,119 1,970 26,328 * Responses from Age 0-4 are counted as Not Eligible to Answer and are omitted from the graph. 21
23 Figure 12. Level of Education by Age 22
24 Language Spoken at Home The 2018 Census shows that 87.4% of residents speak English at home, while 9.5% of residents chose not to answer this question. Table 16. Language Spoken at Home by Gender Language spoken at Home Male Female Other 2018 Not Stated Total % English 11,413 11, , French Other Not Stated ,595 2, Total 12,392 12, ,852 26, Figure 13. Language Spoken at Home 23

25 Figure 14. Language Spoken at Home by Gender 24
26 Table 17. Language Spoken at Home by Age Language spoken at Home English 1,769 1,684 1, ,266 1,861 2,154 1,864 1,516 1,358 1,406 1,365 1, ,005 French Other Not Stated ,629 2,506 Total 1,862 1,768 1, ,381 2,045 2,380 2,084 1,643 1,448 1,474 1,417 1, ,119 1,970 26, and Over Not Stated Total * Responses from Age 0-4 are counted, and are omitted from the graph. 25

27 Figure 15. Language Spoken at Home by Age 26
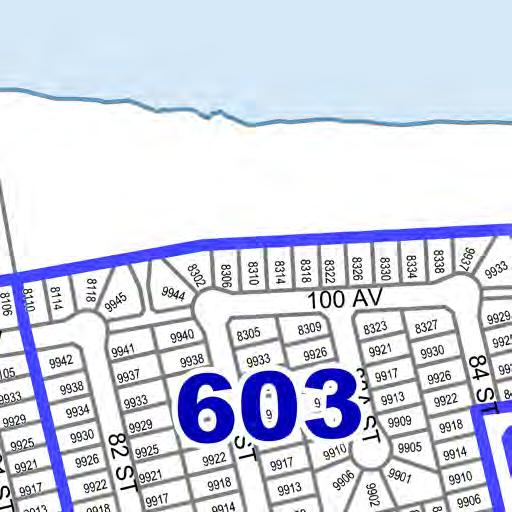
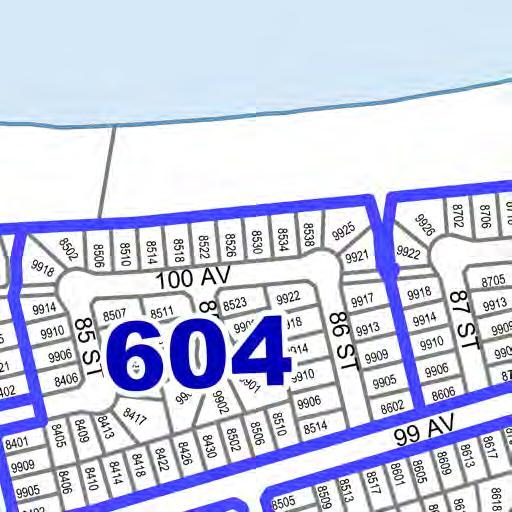
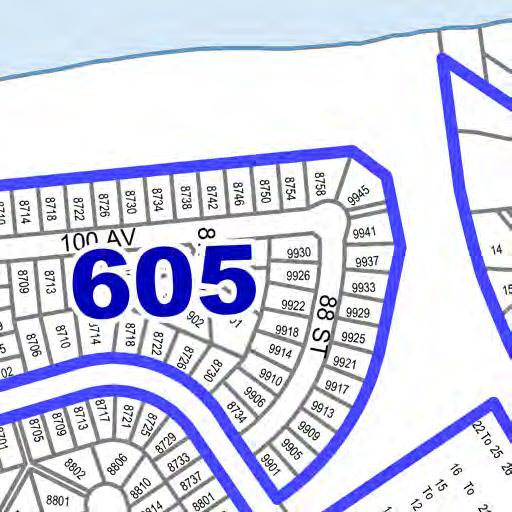
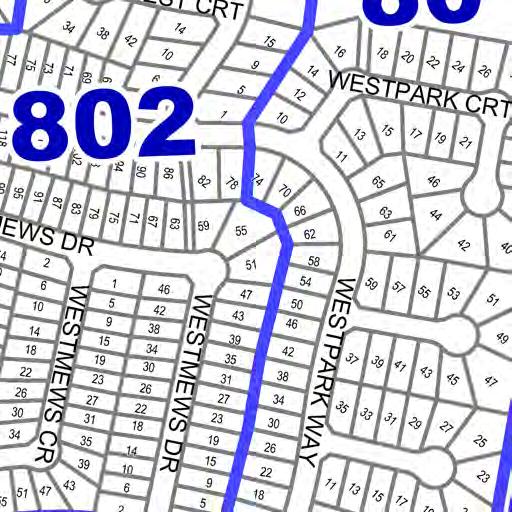
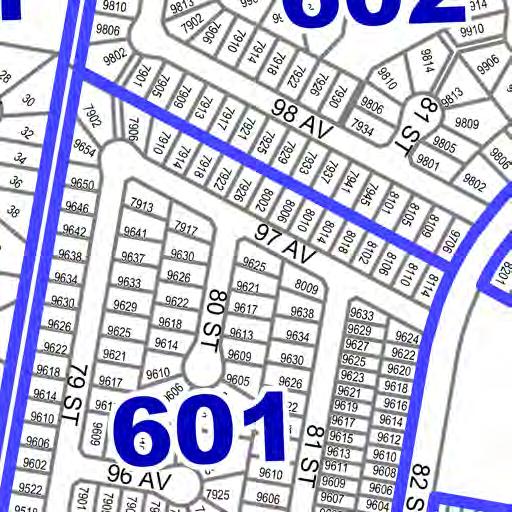
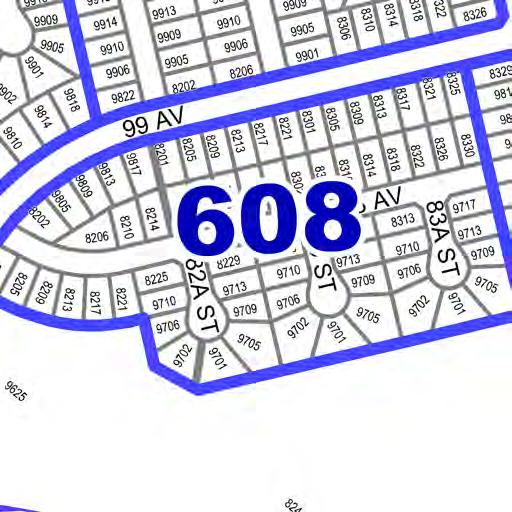
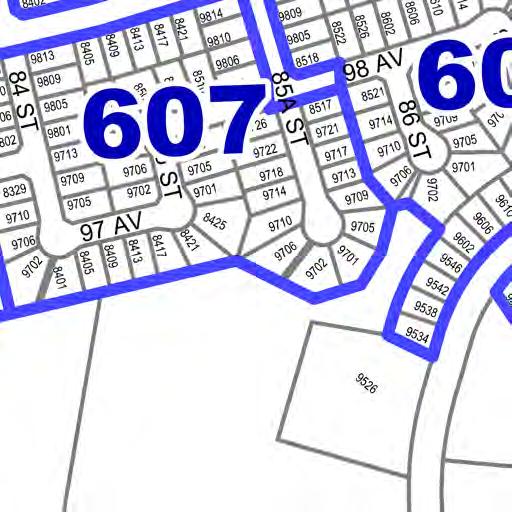
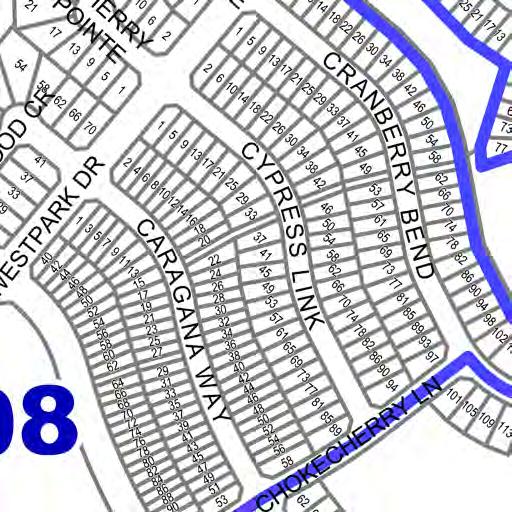
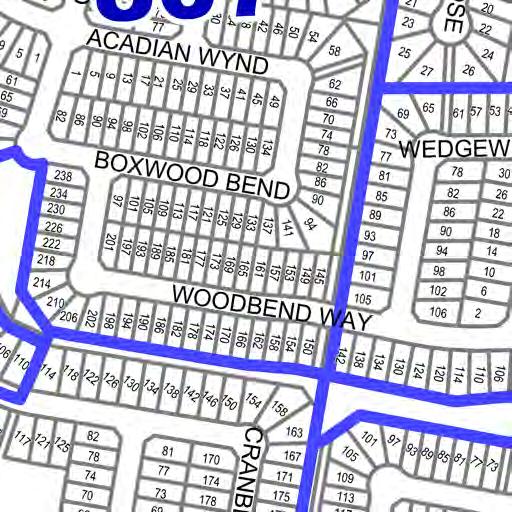
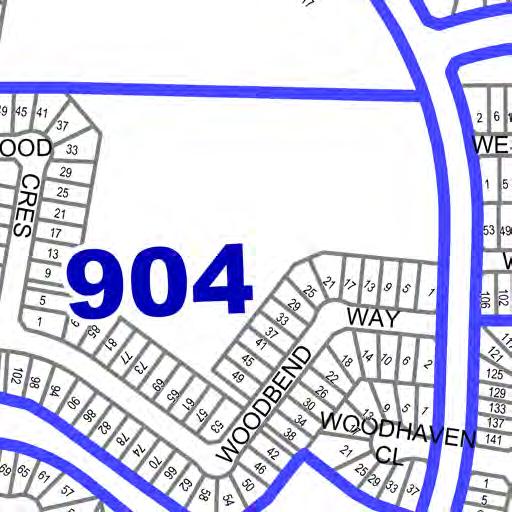
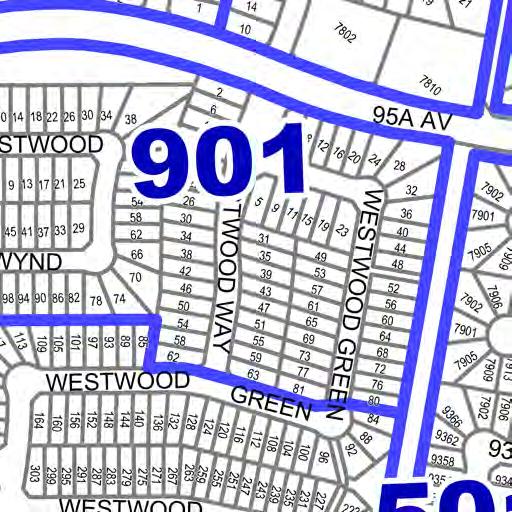
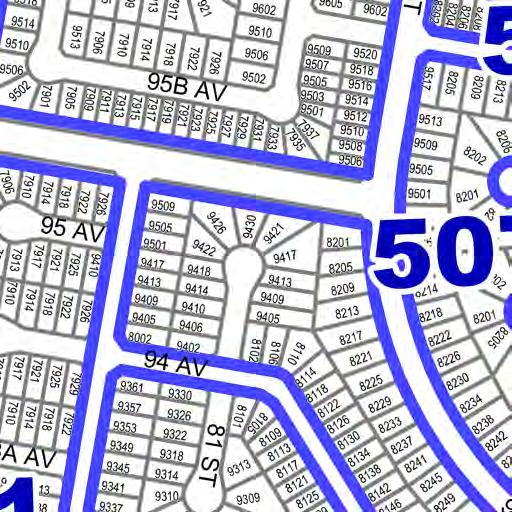
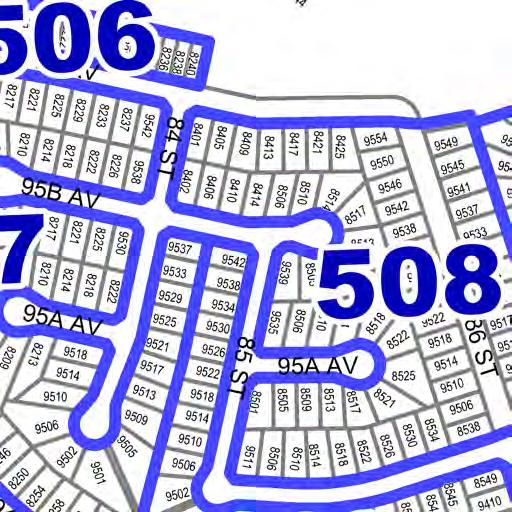
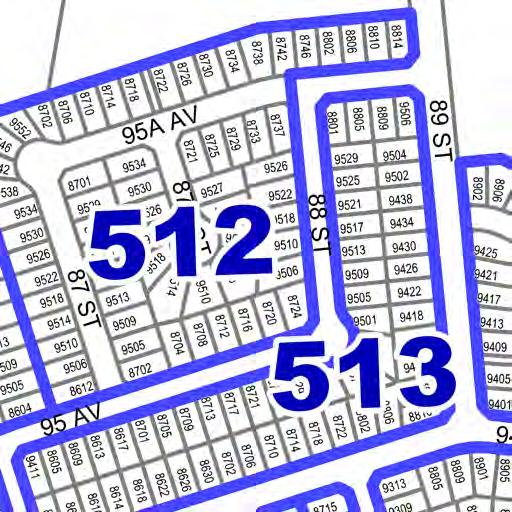
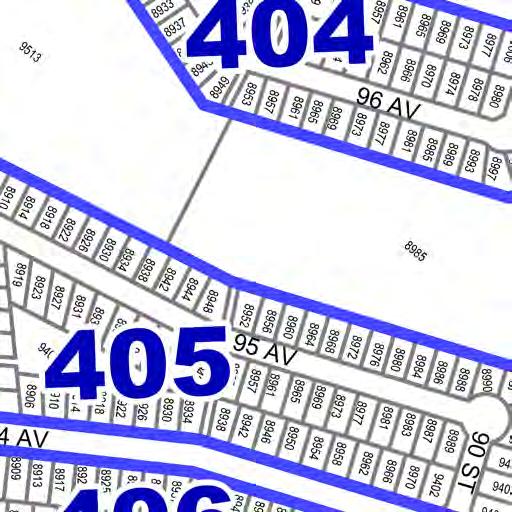
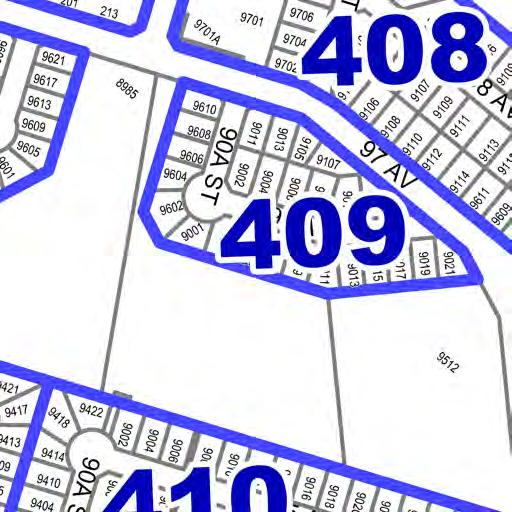
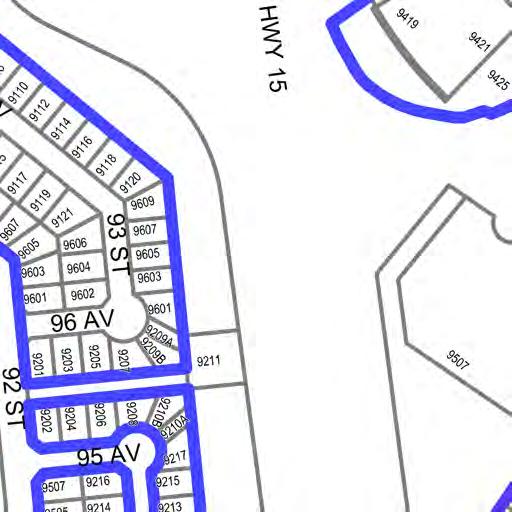
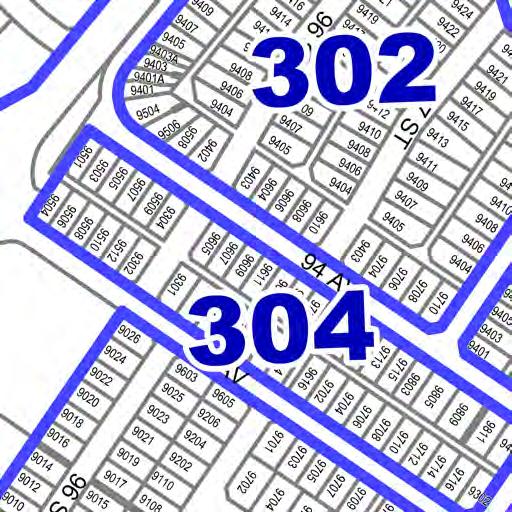
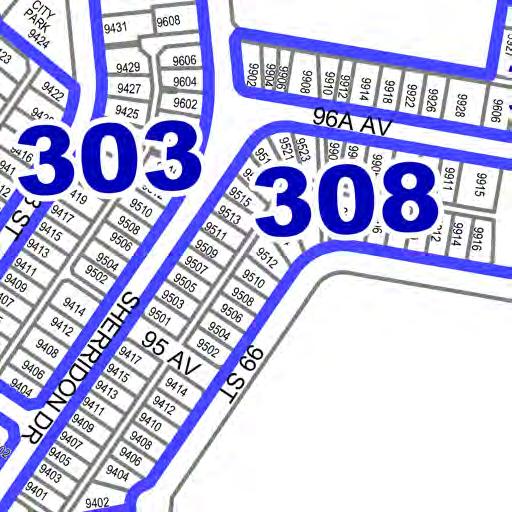
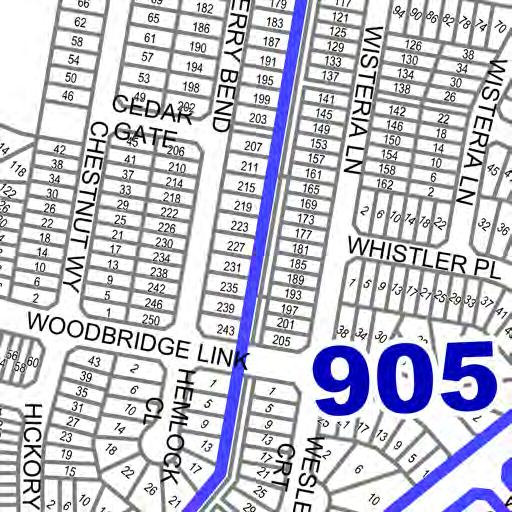
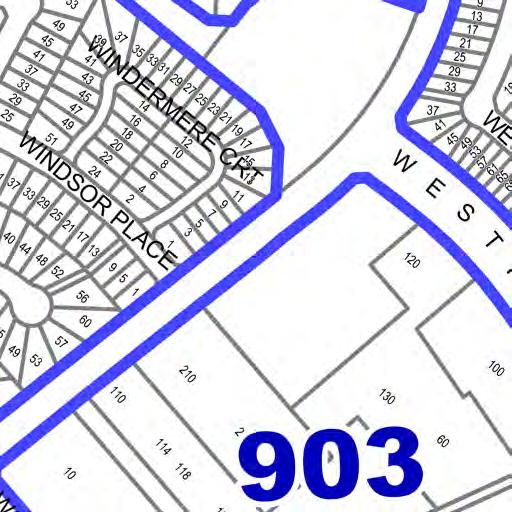
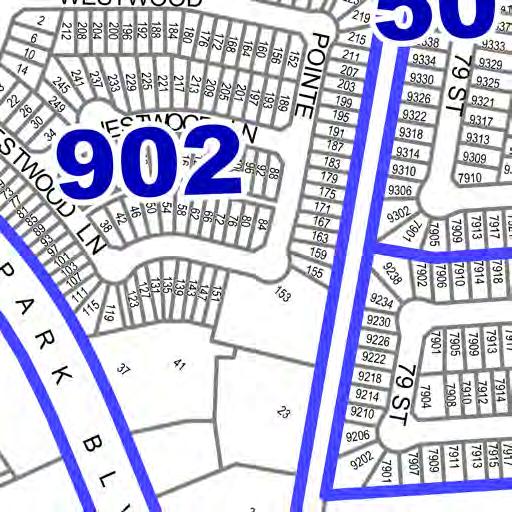
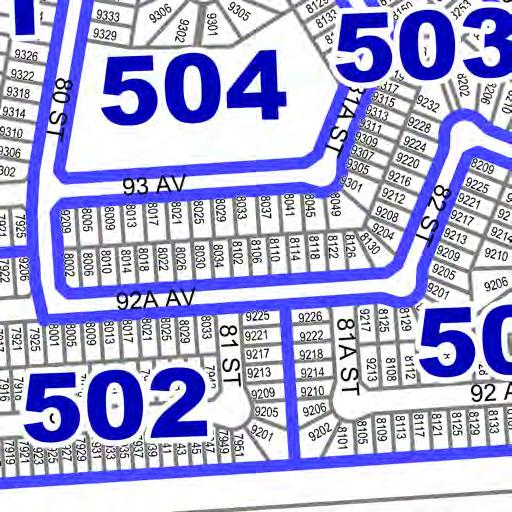
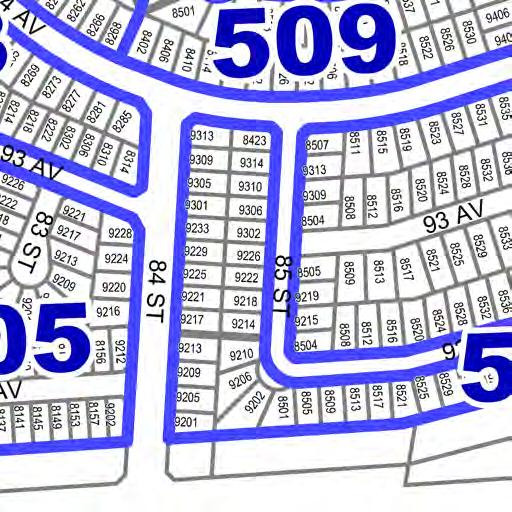
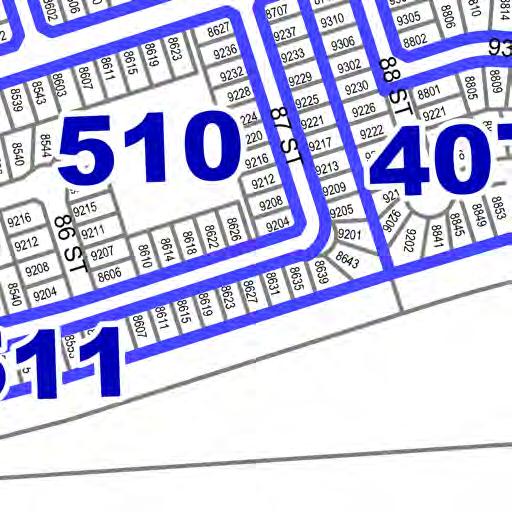
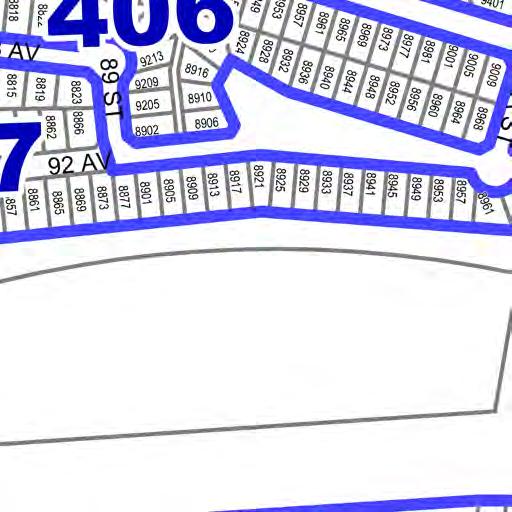
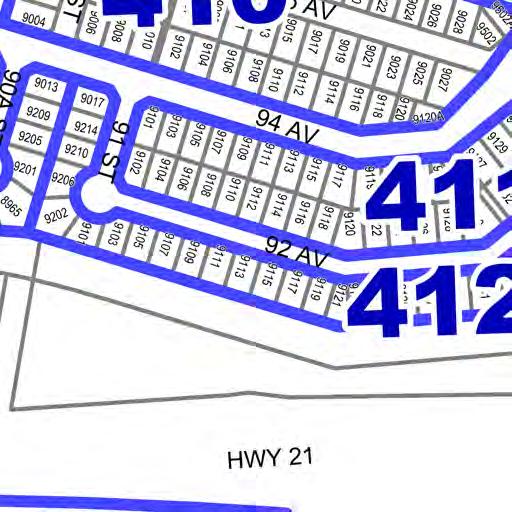
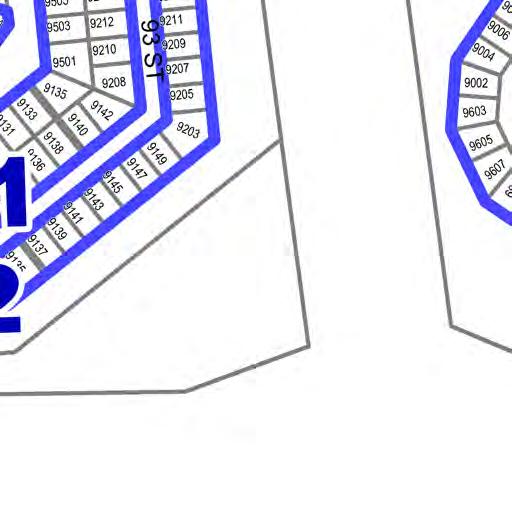
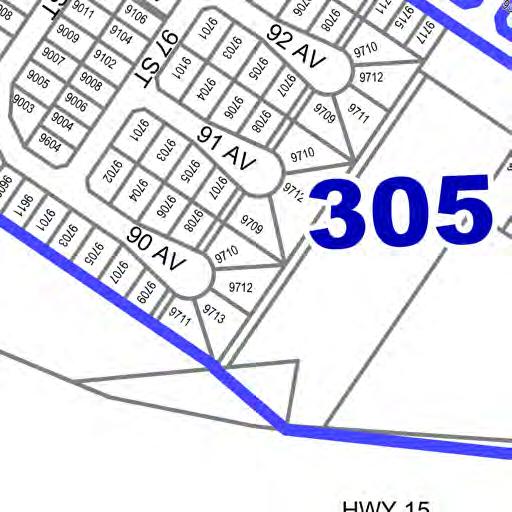
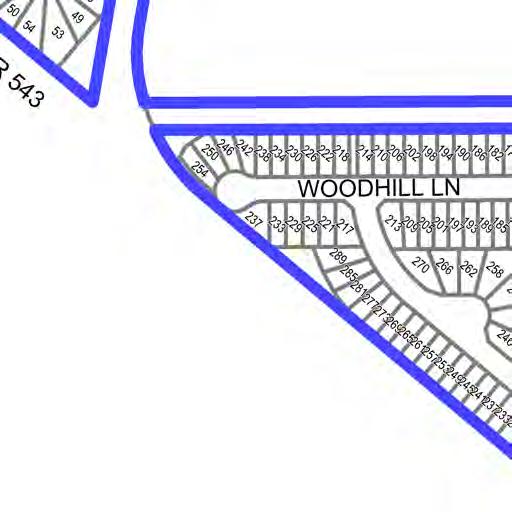
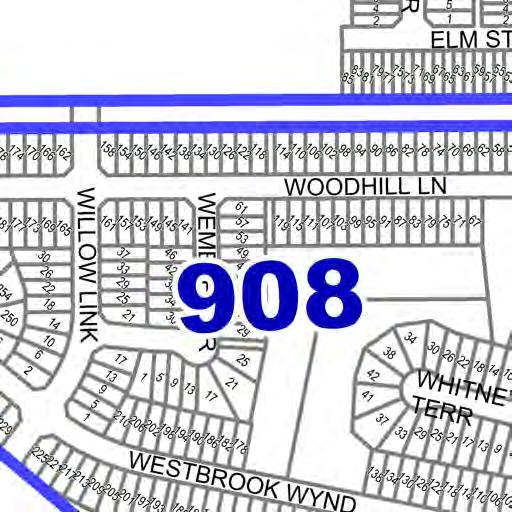
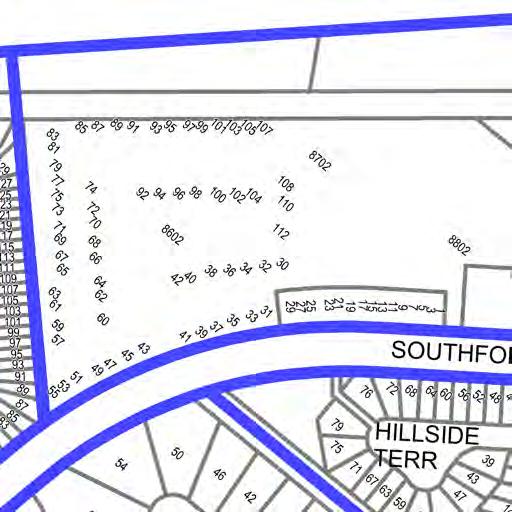
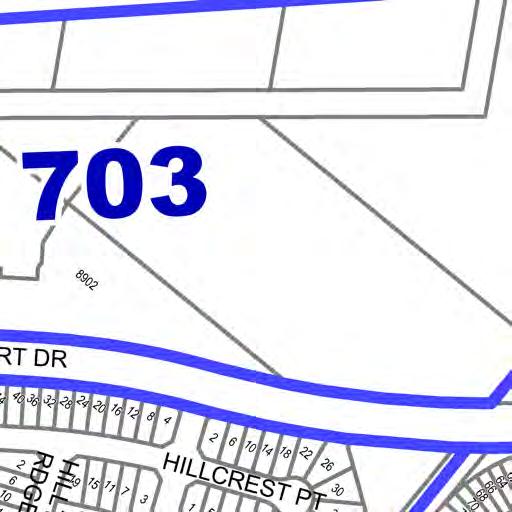
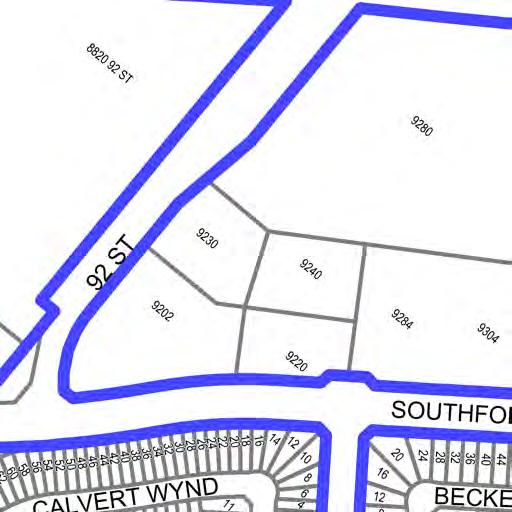
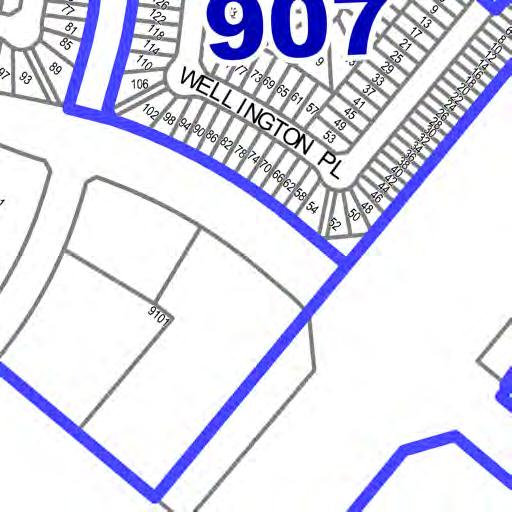
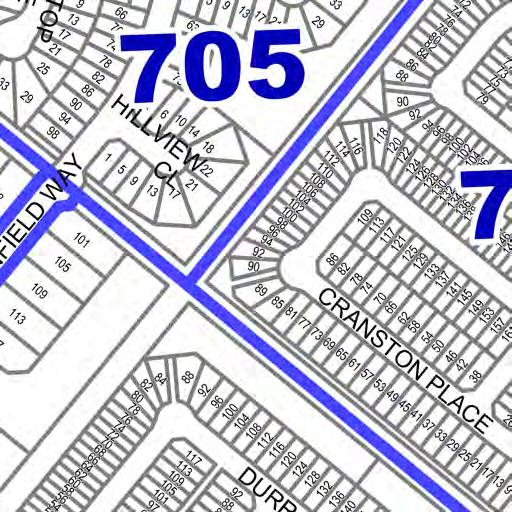
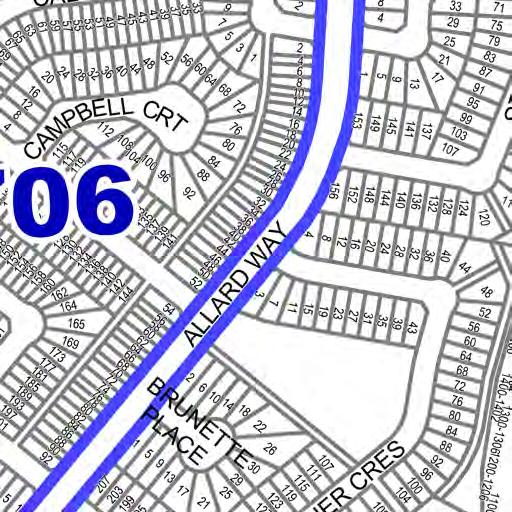
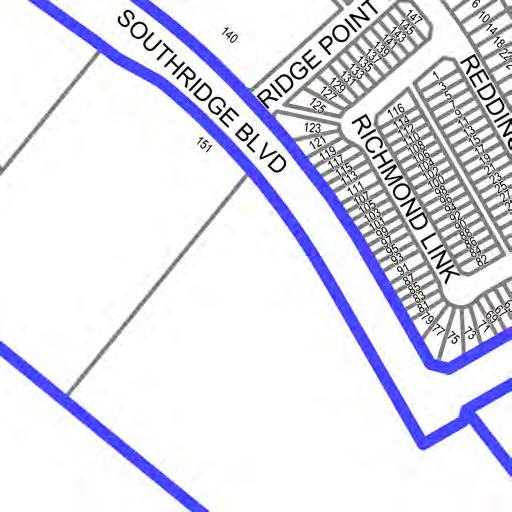
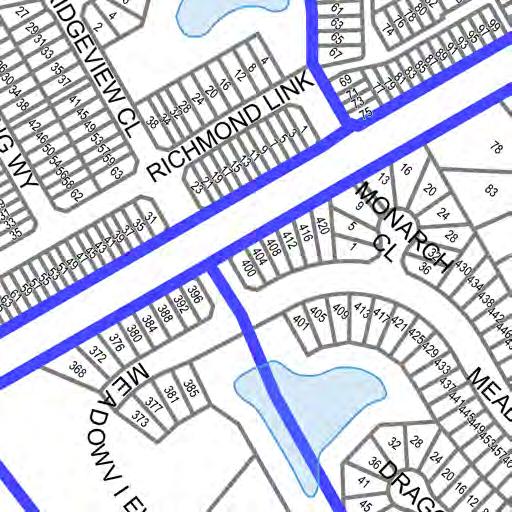
28 Information by Enumeration Area Table 18 and Figures show the number of residents and the count of non-occupied dwellings by enumeration area. Table 18. Residents and Non-Occupied Dwellings by Enumeration Area Area Residents Vacant Under Construction Empty Lot Residents Vacant Under Construction Empty Lot Residents Vacant Under Construction Empty Lot 27
29 Area Residents Vacant Under Construction Empty Lot Residents Vacant Under Construction Empty Lot Residents Vacant Under Construction Empty Lot 28
30 Area Residents Vacant Under Construction Empty Lot Residents Vacant Under Construction Empty Lot Residents Vacant Under Construction Empty Lot 29
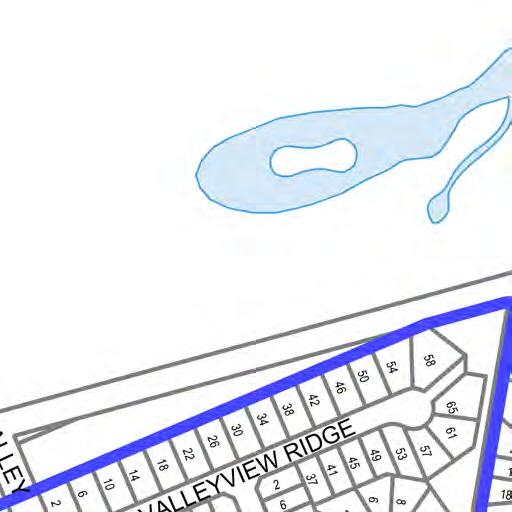
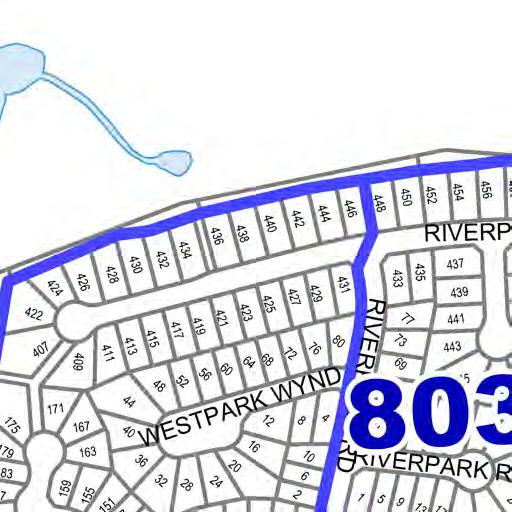
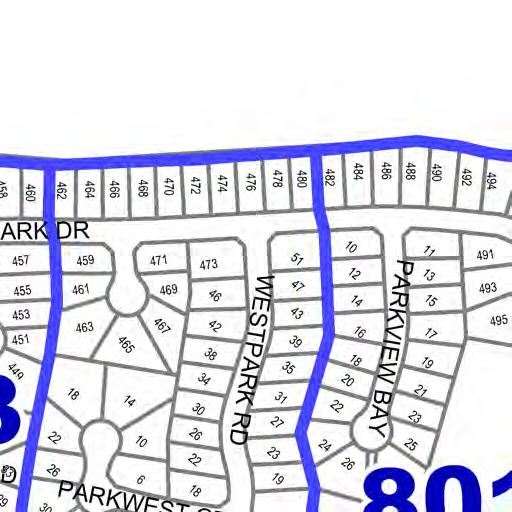
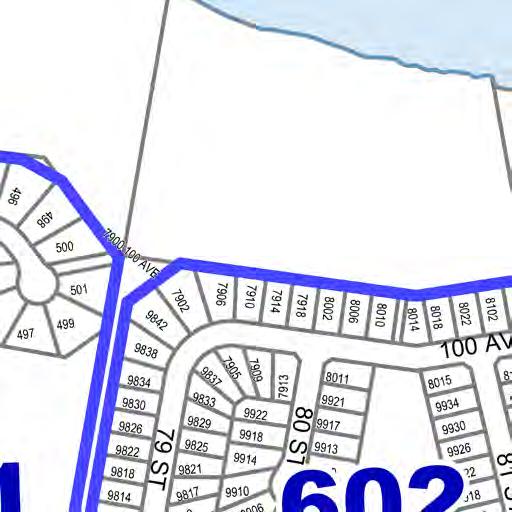
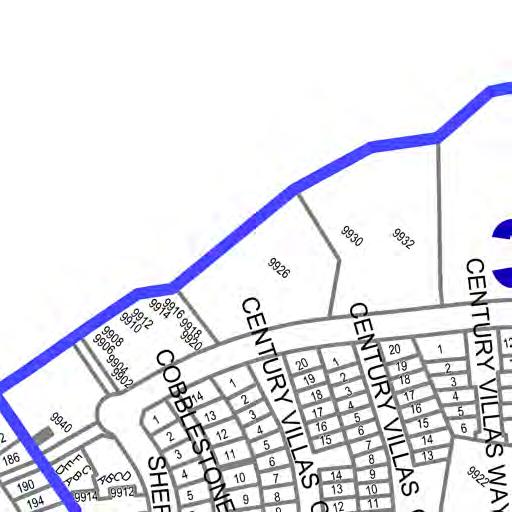
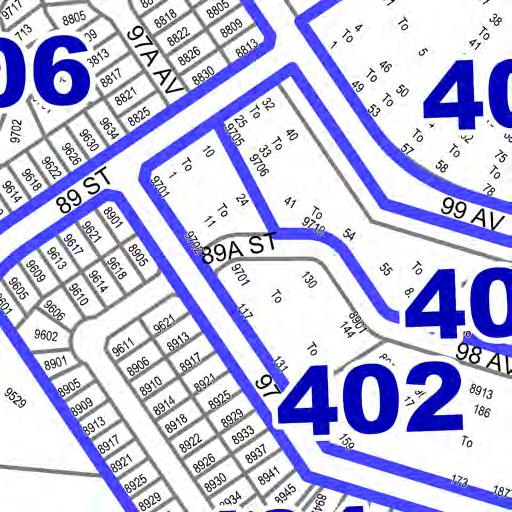
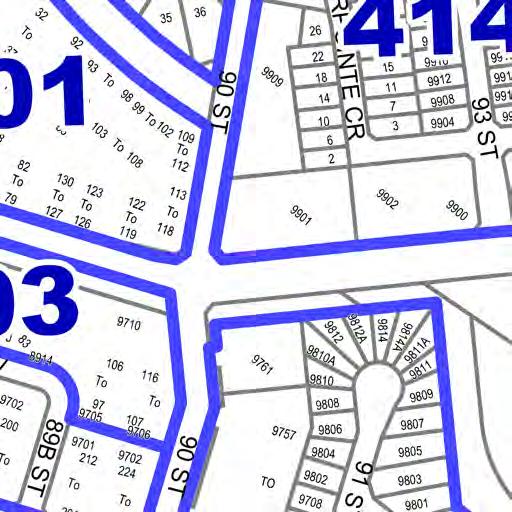
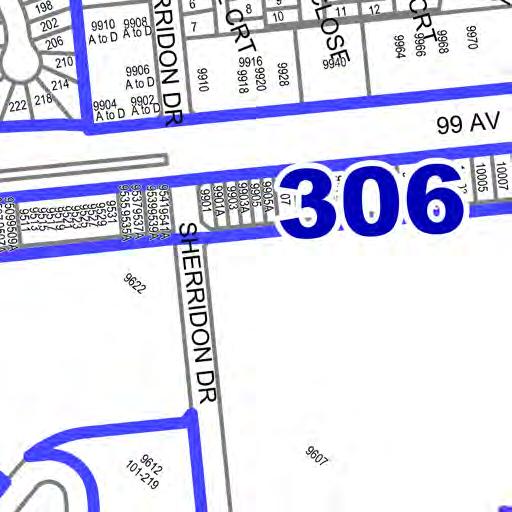
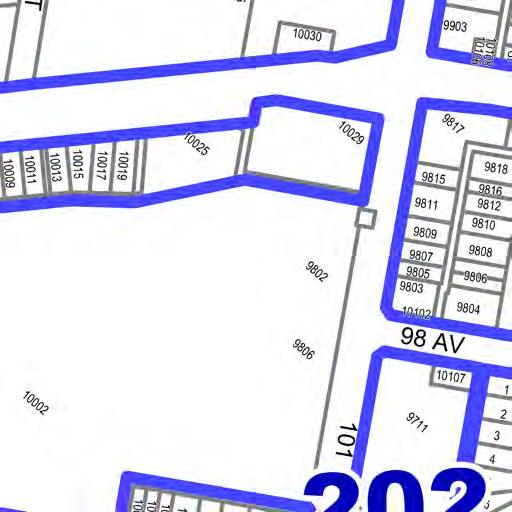
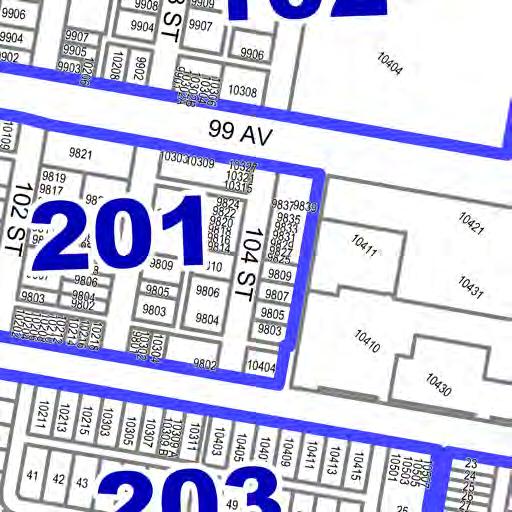
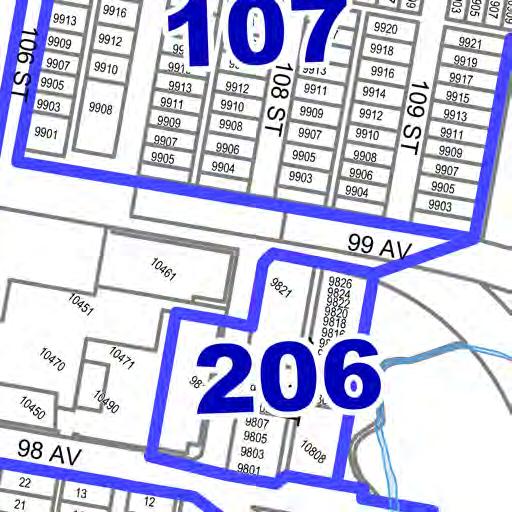
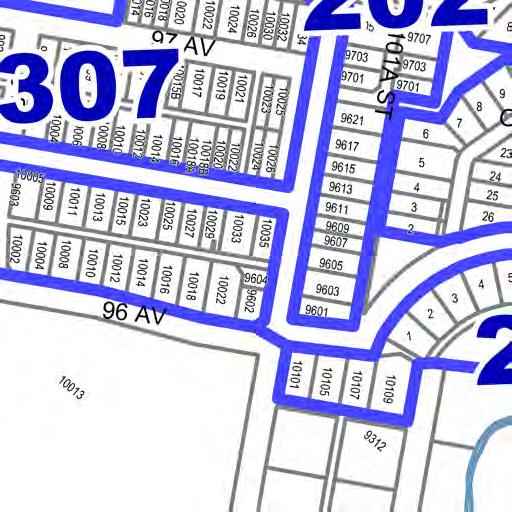
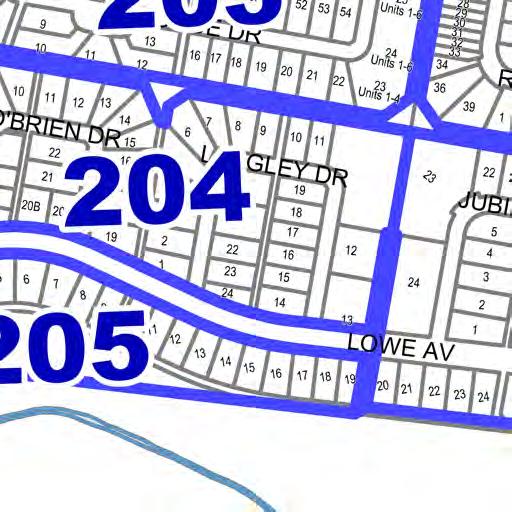
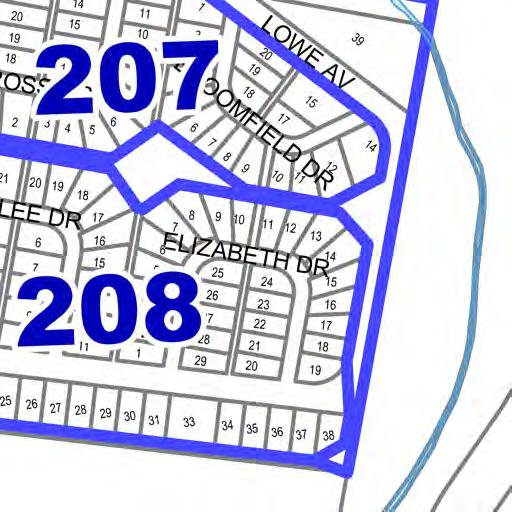
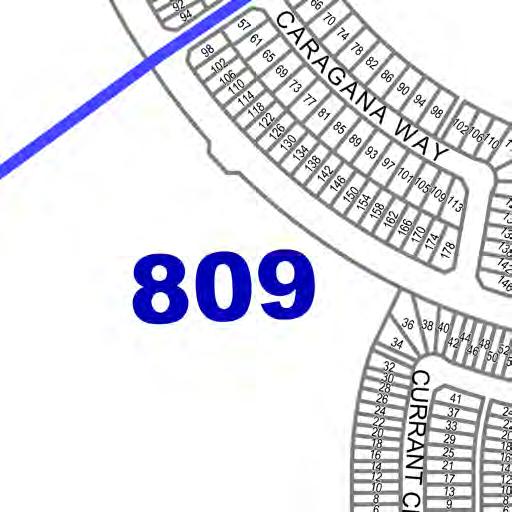
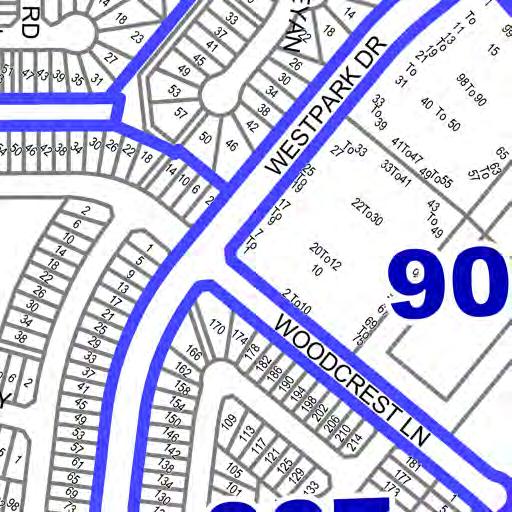
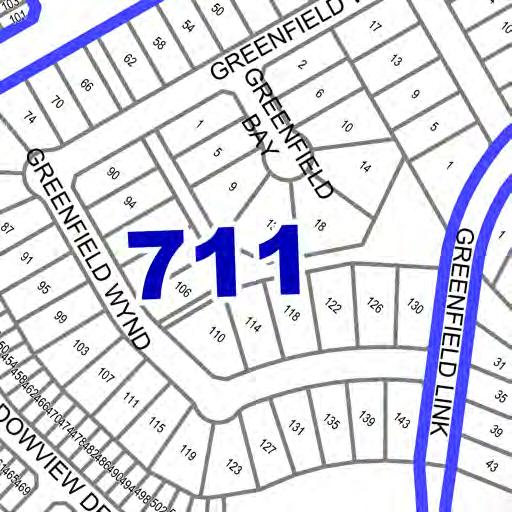
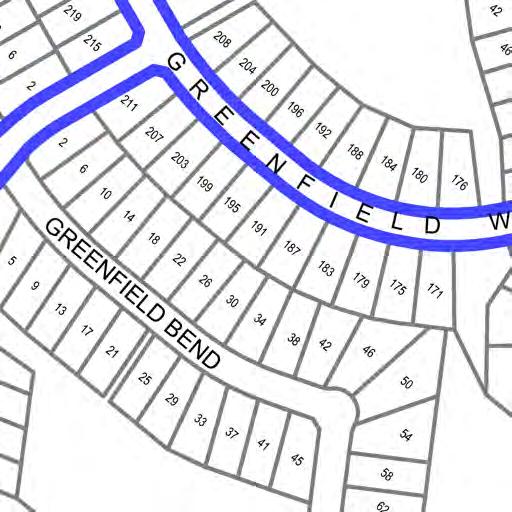
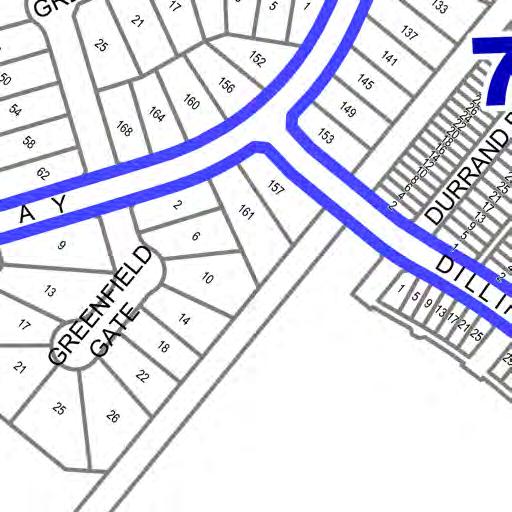
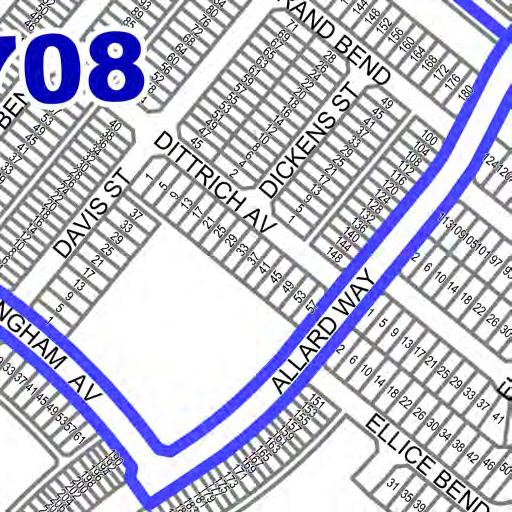
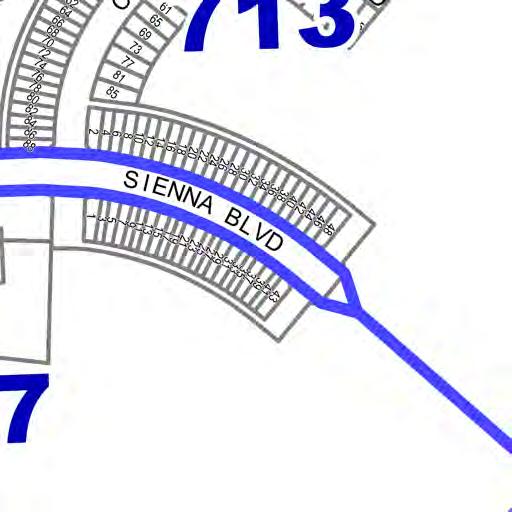
31 Area Residents Vacant Under Construction Empty Lot Residents Vacant Under Construction Empty Lot Residents Vacant Under Construction Total 26, , , Empty Lot * Enumeration areas 714, 715, 716, 717, and 809 were modified due to growth in these areas. * New Enumeration area 810 was added to the 2018 Census. 30

32 Figure 16. Population by Enumeration Area ( ) 31

33 Figure 17. Population by Enumeration Area ( ) 32

34 Figure 18. Population by Enumeration Area ( ) 33

35 Figure 19. Population by Enumeration Area ( ) 34


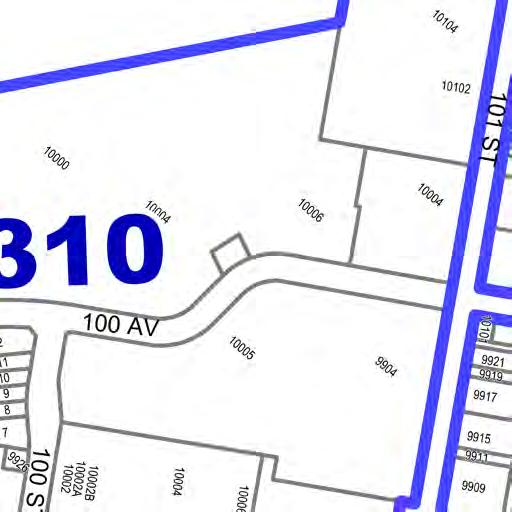
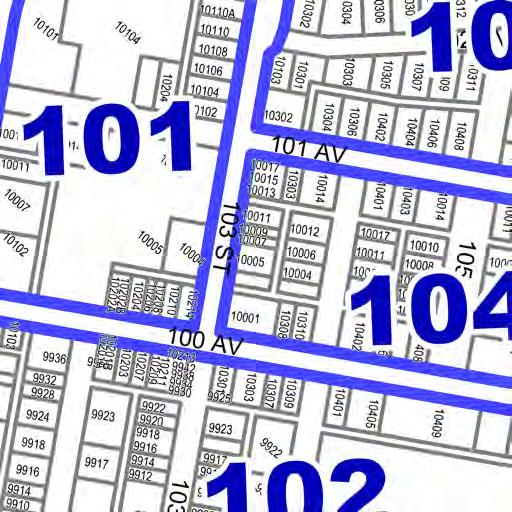
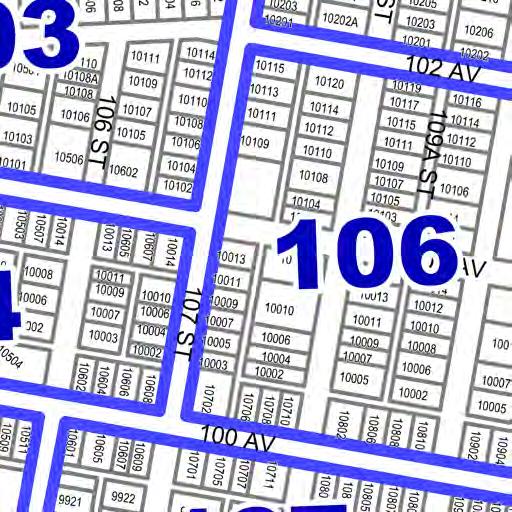

36 2018 Municipal Census Boundaries File Name: \\cdr\fsgis\geomedia Toolbox\Geoworkspaces\Municipal Census Boundary.gws 35

37 Table 19. Population Comparison with Neighbouring Municipalities 2008 % Increase 2009 % Increase 2010 % Increase 2011 % Increase 2012 % Increase 2013 % Increase 2014 % Increase 2015 % Increase 2016 % Increase 2017 % Increase 2018 % Increase Beaumont Edmonton 10,820 11% 11,794 9% 12, % 13, % 13, % 14, % 15, % 16, % 17, % 18, % 18, % 752,412 3% 782, % 782, , , % 817, , % 877, , % 932, % 932,546 Fort Saskatchewan 16,793 4% 17,469 4% 18, % 18,653 20, % 21, % 22, % 24, % 24, % 25, % 26, % Leduc (City) Redwater Spruce Grove St. Albert Stony Plain Strathcona County Sturgeon County 20,529 21% 21, % 23, % 24, % 25, % 27, % 28, % 29, % 30,498 4% 31,130 2% 32, % 2,192 2,192 2,192 2,192 2, % 2,116 2,116 2,116 2,116 2, % 2,053 19,496 23, % 24, % 24,646 26, % 27, % 29, % 32, % 33,640 5% 34,881 4% 34,881 58, % 58,501 60, % 60,138 61, % 61,466 63, % 63,255 64, % 65, % 65,589 12,363 12,363 14, % 14,177 15, % 15,051 15,051 16, % 16,127 17, % 17,189 85, % 87, % 87,998 87,998 92, % 92,490 92,490 95, % 95,567 98, % 98,044 19, % 19,165 19,165 19,165 19, % 19,578 19,578 19,578 19,578 20, % 20,495 No population increase from previous year population to be released in September. Figure 20. Population Comparison with Neighbouring Municipalities * City of Edmonton is removed from data. 36
HOUSING NOW Edmonton CMA
 H o u s i n g M a r k e t I n f o r m a t i o n HOUSING NOW Edmonton CMA C a n a d a M o r t g a g e a n d H o u s i n g C o r p o r a t i o n Table of Contents Date Released: January 2014 1 Highlights
HOUSING NOW Edmonton CMA
 Housing Market Information HOUSING NOW Edmonton CMA Table of Contents Date Released: March 2015 1 Highlights Highlights Actual housing starts increase in February Average absorbed price of single-detached
Table of Contents. 1.0 Introduction Demographic Characteristics Travel Behaviour Aggregate Trips 28
 Table of Contents 1.0 Introduction 1 1.1 Overview of the Household Travel Survey 1 1.2 Study Area 2 1.3 Scaling 5 1.4 Sample Accuracy 6 2.0 Demographic Characteristics 8 2.1 Population, Employment and
Edmonton CMA. Edmonton s Housing Starts Decrease in October
 H o u s i n g M a r k e t I n f o r m a t i o n Housing Now Edmonton CMA Canada Mortgage and Housing Corporation Table of Contents Date Released: November Edmonton s Housing Starts Decrease in ober since
Single-detached starts amounted to 498 units in September, representing a modest gain over the 481 units started in September 2009.
 H o u s i n g M a r k e t I n f o r m a t i o n Housing Now Edmonton CMA Canada Mortgage and Housing Corporation Table of Contents Date Released: October New Home Market Census Metropolitan Area (CMA)
Edmonton Region Commodity Flow Study
 A Joint Alberta Transportation, City of Edmonton and Economic Development Edmonton Venture Supported by: Alberta Motor Transport Association (AMTA) Alberta Capital Region Alliance (ACRA) Page 1 27,748
Unemployment Rates August 2010
 September 3, 2010 DATA BRIEF: Black Employment and Unemployment in August 2010 by Sylvia Allegretto, Ary Amerikaner, and Steven Pitts The unemployment rate for Blacks was 16.3% last month. This is according
Unemployment Rates - November 2011
 December 2, 2011 DATA BRIEF: Black Employment and Unemployment in November 2011 The unemployment rate for Blacks was 15.5% last month. This is according to the latest report on the nation s employment
Unemployment Rates January 2011
 February 4, 2011 DATA BRIEF: Black Employment and Unemployment in January 2011 by Sylvia Allegretto, Ary Amerikaner, and Steven Pitts The unemployment rate for Blacks was 15.7% last month. This is according
Passenger seat belt use in Durham Region
 Facts on Passenger seat belt use in Durham Region June 2017 Highlights In 2013/2014, 85 per cent of Durham Region residents 12 and older always wore their seat belt when riding as a passenger in a car,
Black Employm ent an d Unemploymen t Decembe r 2013 Page 1
 January 10, 2014 DATA BRIEF: Black Employment and Unemployment in December 2013 The unemployment rate for Blacks was 11.9% last month. This is according to the latest report on the nation s employment
Black Employm ent an d Unemploymen t July Page 1
 August 3, 2012 DATA BRIEF: Black Employment and Unemployment in July 2012 The unemployment rate for Blacks was 14.1% last month. This is according to the latest report on the nation s employment situation
Taxi Cab Safety Bylaw
 Enclosure I Taxi Cab Safety Bylaw Update Document: #5771205 HISTORY January 29 and March 8, 2008 Direction Request who licenses taxi cab companies in Sherwood Park should Strathcona County have a taxi
Black Employm ent an d Unemploymen t Au gust Page 1
 September 7, 2012 DATA BRIEF: Black Employment and Unemployment in August 2012 The unemployment rate for Blacks was 14.1% last month. This is according to the latest report on the nation s employment situation
Black Employm ent an d Unemploymen t Ap ril Page 1
 May 6, 2012 DATA BRIEF: Black Employment and Unemployment in April 2012 The unemployment rate for Blacks was 13.0% last month. This is according to the latest report on the nation s employment situation
Saskatchewan Health Populations
 Saskatchewan Health Populations Data Source The following pages present data from the Health Insurance Registration File (HIRF) for the City of Saskatoon as reported by ehealth Saskatchewan. This information,
Summary findings. 1 Missouri has a greater population than any State ranked 1-9 in core group labor force participation.
 Labor in Missouri MSCDC Economic Report Series No. 9903 December 2000 By Professor John O. Ward, Chairman, UMKC Department of Economics Kurt V. Krueger, Department of Economics Graduate Student Michael
Europass website activity report 2008 (Czech Republic, Czech) Visits from Czech Republic during 2008
 Visits from Czech Republic during 2008") Europass website activity report 2008 (Czech Republic, Czech) Visits from Czech Republic during 2008 Page 1 of 14 Month Visits 6,062 6,818 7,784 8,015 6,163 5,334 4,734 4,004 5,284 6,307 7,295 4,603 72,403
Europass website activity report 2008 (Czech Republic, Czech) Visits from Czech Republic during 2008 Page 1 of 14 Month Visits 6,062 6,818 7,784 8,015 6,163 5,334 4,734 4,004 5,284 6,307 7,295 4,603 72,403
Drivers License Status Report for Milwaukee County
 University of Wisconsin Milwaukee UWM Digital Commons ETI Publications Employment Training Institute 2012 Drivers License Status Report for Milwaukee County John Pawasarat University of Wisconsin - Milwaukee,
Statistics South Africa CENSUS Census in brief
 Statistics South Africa CENSUS 2001 Census in brief General information Statistics South Africa Private Bag X44 Pretoria 0001 South Africa 170 Andries Street Pretoria 0002 User information service: (012)
Alberta s Third Party Auditor Certification Program. Testing Your Knowledge at the Third Party Auditor Interview Stage
 Part One: Alberta s Third Party Auditor Certification Program Testing Your Knowledge at the Third Party Auditor Interview Stage For questions 1 4, circle the correct answer (answers may be found at the
RURAL ROAD MAINTENANCE PROGRAM GUIDELINES
 RURAL ROAD MAINTENANCE PROGRAM GUIDELINES April 2015 Contents: Overview:.. 1 Policy Goals and Objectives:... 1 Definitions:.. 1 Program Requirements:. 2 Road Standards and Specifications: 3 Right-of-Way:....
TRANSIT DEMAND IN RURAL DOUGLAS COUNTY: PRELIMINARY BACKGROUND DATA
 TRANSIT DEMAND IN RURAL DOUGLAS COUNTY: PRELIMINARY BACKGROUND DATA Lawrence-Douglas County MPO Regional Transit Advisory Committee Lawrence, Kans. Tuesday October 31, 2017 Chris Zeilinger Assistant Director
OLYMPIC GATEWAY PLAZA
 OLYMPIC GATEWAY PLAZA ABERDEEN, WA MICHAEL S SUBLEASE AVAILABLE IMMEDIATELY Property Highlights Located in the Olympic Gateway Plaza Great Visibility to State Hwy 12 13,258 sf Available (103 front x 129
HOUSING NOW Calgary CMA
 H o u s i n g M a r k e t I n f o r m a t i o n HOUSING NOW Calgary CMA C a n a d a M o r t g a g e a n d H o u s i n g C o r p o r a t i o n Date Released: January 2012 New Home Market Calgary housing
SOCIO-ECONOMIC and LAND USE DATA
 SOCIO-ECONOMIC and LAND USE DATA FUTURE CONDITIONS January CHATHAM URBAN TRANSPORTATION STUDY - 1 - Table of Contents Introduction 3 TAZ - Municipality - Map Index...8 2005 Socio-economic and Land Use
MIG DATA FILE. Table 1: Respondent Information by Community Community Number
 MIG DATA FILE Table 1: Respondent Information by Community Community Number 1 2 3 4 5 6 7 Observations 36 13 22 19 38 24 16 168 Observations 21.4 7.7 13.1 11.3 22.6 14.3 9.5 100.0 Place of Survey Home
Allowances for Tenant-Furnished Utilities and Other Services
 Heating a. Natural Gas 7.00 8.00 9.00 10.00 11.00 11.00 c. Electric 7.00 9.00 10.00 12.00 14.00 15.00 d. Electric Heat Pump 6.00 7.00 9.00 10.00 11.00 12.00 a. Natural Gas 2.00 2.00 4.00 4.00 6.00 6.00
CITY OF EDMONTON COMMERCIAL VEHICLE MODEL UPDATE USING A ROADSIDE TRUCK SURVEY
 CITY OF EDMONTON COMMERCIAL VEHICLE MODEL UPDATE USING A ROADSIDE TRUCK SURVEY Matthew J. Roorda, University of Toronto Nico Malfara, University of Toronto Introduction The movement of goods and services
The Brief. presented by
 The Brief. presented by 1 Project Information: Date of Brief: 12/04/2015 Project Name: Vehicle(s): Market(s)/Regional Cluster(s): Canada s Next Top Ad Exec 2015/2016 FTNVBs Chevrolet Portfolio Canada -
Automotive Repair Technician
 Automotive Repair Technician Inland Empire/Desert Region (Riverside-San Bernardino-Ontario Metropolitan Statistical Area) Summary Employment for the automotive repair occupational group is expected to
GREENE COUNTY SCHOOLS ENROLLMENT PROJECTIONS REPORT APRIL 12, 2017
 APRIL 12, 2017 PREPARED FOR: Greene County Schools 910 West Summer Street Greeneville, TN 37743 T 423-639-4194 PREPARED BY: Cooperative Strategies 3325 Hilliard Rome Road Hilliard, OH 43026 T 614.798.8828
Certificate in a vocational program
 N 3,328 5,148 2,928 3,219 3,546 2,004 3,730 3,982 2,327 30,212 GOALS AND PLANS 2. What is your educational goal at this college? High school diploma or GED 1.9 1.3 2.2 1.4 2.2 2.2 1.9 2.0 1.7 1.8 Certificate
Tony Roma s (Closed) Fully Equipped Restaurant Building
 Fully Equipped Restaurant Building") Tony Roma s (Closed) Fully Equipped Restaurant Building 5221 Tacoma Mall Blvd, Tacoma CBA Listing #52400 Price $900,000 Fully Equipped Restaurant Building for $900,000 Great Location! I-5 Exposure Building
Tony Roma s (Closed) Fully Equipped Restaurant Building 5221 Tacoma Mall Blvd, Tacoma CBA Listing #52400 Price $900,000 Fully Equipped Restaurant Building for $900,000 Great Location! I-5 Exposure Building
HOLY SPIRIT RCSRD NO.4 BUS DRIVER S GUIDE
 HOLY SPIRIT RCSRD NO.4 BUS DRIVER S GUIDE Updated May 2017 Holy Spirit RCSRD No.4 Bus Driver s Guide TABLE OF CONTENTS INTRODUCTION... 3 CARRIER PROFILE... 4 BUS DRIVERS... 5 Authorized Driver... 5 Un-authorized
Yonge-Eglinton. Mobility Hub Profile. September 19, 2012 YONGE- EGLINTON
 September 19, 2012 PEEL YORK HALTON DURHAM HAMILTON TORONTO YONGE- EGLINTON MOBILITY HUBS: places of connectivity between regional and rapid transit services, where different modes of transportation come
2009/10 NWT Aurora Visitor Survey Report. Industry, Tourism and Investment Government of the Northwest Territories
 2009/10 NWT Aurora Visitor Survey Report Industry, Tourism and Investment Government of the Northwest Territories INTRODUCTION... 3 SURVEY METHODOLOGY... 4 EXECUTIVE SUMMARY... 5 VISITOR PROFILE... 7 AGE...
HOUSING NOW Regina CMA
 H o u s i n g M a r k e t I n f o r m a t i o n HOUSING NOW Regina CMA C a n a d a M o r t g a g e a n d H o u s i n g C o r p o r a t i o n Date Released: Fourth Quarter 2012 Table of Contents New Home
FHI 360-UNC Public Health Fellowship Application. Due Date: Thursday, January 22, 2015
 FHI 360-UNC Public Health Fellowship Application Due Date: Thursday, January 22, 2015 FHI 360 s mission is to improve lives worldwide by addressing complex public health issues through research, education
Fall 2016 Student Headcount By Race/Ethnicity
 By Level 2942, 29% 7157, 71% Total Undergraduate Total Graduate 27, 0% By Race/Ethnicity 453, 5% 39, 0% 145, 1% 503, 5% 3237, 32% 2271, 23% 161, 2% 3263, 32% By Gender 2934, 29% 7165, 71% Foreign Hispanic
American Driving Survey,
 RESEARCH BRIEF American Driving Survey, 2015 2016 This Research Brief provides highlights from the AAA Foundation for Traffic Safety s 2016 American Driving Survey, which quantifies the daily driving patterns
Morning Parking Utilization Trends
 MEMORANDUM Date: November 6 th, 2015 Project #: 18130 To: From: Subject: Rebecca Houghtaling, Senior Planner, Oregon State University Lisa Scherf, Transportation Services Supervisor, City of Corvallis
Who has trouble reporting prior day events?
 Vol. 10, Issue 1, 2017 Who has trouble reporting prior day events? Tim Triplett 1, Rob Santos 2, Brian Tefft 3 Survey Practice 10.29115/SP-2017-0003 Jan 01, 2017 Tags: missing data, recall data, measurement
Survey of users of wheelchair seat elevators
 Survey of users of wheelchair seat elevators The Rehabilitation Engineering and Applied Research Center in collaboration with Quantum Rehab surveyed wheelchair users whose powered wheelchairs are equipped
Produced by the BPDA Research Division:
 March 2018 Produced by the BPDA Research Division: Alvaro Lima Director Jonathan Lee Deputy Director Christina Kim Research Manager Phillip Granberry Senior Researcher/Demographer Matthew Resseger Senior
About Half View Tim s image as positive, overall
 FOR IMMEDIATE RELEASE About Half View Tim s image as positive, overall But about two-fifths say they visit less than they used to Toronto, April 23 rd In a random sampling of public opinion taken by The
201 SOUTH MARY STREET Sunnyvale, CA
 201 SOUTH MARY STREET Sunnyvale, CA RETAIL SPACE FOR SUBLEASE AVAILABLE Rear Entranceway SIZE: 1,991 square feet Property Highlights POSSESSION: Immediate ASKING RENT: $2.75 per Sq. Ft. per Month NNN COMMENTS:
City of Clearlake Housing Element
 City of Clearlake Housing Element 2014-19 Chapter 8 of the Clearlake 2040 General Plan Adopted on March 26, 2015 City Council Resolution 2015-06 Prepared by: 2 TABLE OF CONTENTS 8.1 Introduction... 3 Purpose...
[Report Title] [Report Tag Line]
![[Report Title] [Report Tag Line]](/thumbs/90/104316182.jpg "[Report Title] [Report Tag Line]") [Report Title] [Report Tag Line] TTS 6 REGIONAL MUNICIPALITY OF PEEL SUMMARY BY WARD MARCH 8 Bess Ashby, Research Director 5 Yonge St. Toronto, ON M5B E7 Phone: (6) 6-6 ext. E-mail: b.ashby@malatest.com
[Report Title] [Report Tag Line] TTS 6 REGIONAL MUNICIPALITY OF PEEL SUMMARY BY WARD MARCH 8 Bess Ashby, Research Director 5 Yonge St. Toronto, ON M5B E7 Phone: (6) 6-6 ext. E-mail: b.ashby@malatest.com
Explaining AER Setbacks
 Explaining AER Setbacks This EnerFAQs explains setbacks in the energy industry, how they are determined, and how they may affect Albertans and their communities. What is a setback? A setback is the absolute
Teaching English to Foreigners: 2008
 15 June 2009 1100 hrs 106/2009 In 2008, 83,288 foreign students followed courses at local English-language specialised schools. This shows a decrease of 0.8 per cent over 2007. Teaching English to Foreigners:
TRAFFIC DEPARTMENT 404 EAST WASHINGTON BROWNSVILLE, TEXAS City of Brownsville Speed Hump Installation Policy
 A. GENERAL Speed humps are an effective and appropriate device for safely reducing vehicle speeds on certain types of streets when installed accordance with the provisions of this policy. In order for
Activity in the townhome and apartment segments helped bolster up February s construction numbers. The old City of Ottawa led the way
 Housing Market Information HOUSING NOW Ottawa * Date Released: March 2011 New Home Market Multiple family construction leads in February According to the latest preliminary data released by the Canada
1 Background and definitions
 EUROPEAN COMMISSION DG Employment, Social Affairs and Inclusion Europe 2020: Employment Policies European Employment Strategy Youth neither in employment nor education and training (NEET) Presentation
THE MARKET FOR LED LIGHTING IN CANADA S PARKING INFRASTRUCTURE PREPARED FOR: NATURAL RESOURCES CANADA DATE ISSUED:
 ` THE MARKET FOR LED LIGHTING IN CANADA S PARKING INFRASTRUCTURE PREPARED FOR: NATURAL RESOURCES CANADA WE BUILD WISDOM TO INSPIRE LEADERSHIP FOR HEALTHY URBAN COMMUNITIES www.canurb.org INFRASTRUCTURE
1 Have you used Sun Trolley (which also includes Riverwalk Trolley)? Yes (Go to Question #2) No (Go to Question #10)
? Yes (Go to Question #2) No (Go to Question #10)") 1 Have you used Sun Trolley (which also includes Riverwalk Trolley)? Yes (Go to Question #2) No (Go to Question #10) 2 How often do you use Sun Trolley? Sporadically as needed Somewhat frequently (up to
1 Have you used Sun Trolley (which also includes Riverwalk Trolley)? Yes (Go to Question #2) No (Go to Question #10) 2 How often do you use Sun Trolley? Sporadically as needed Somewhat frequently (up to
Single Family Months of Inventory. Condo Months of Inventory. May calgary regional housing market statistics
 May 2011 calgary regional housing market statistics INNER CITY HOUSING MARKET LEADS IN SALES Buyers find value in inner city communities Total Single Family Months of Inventory Calgary, June 1, 2011 According
TAPESTRY SEGMENTATION esri.com/tapestry Summary Table. Demographic Profile by Urbanization Group. Marital Status (%)
") Demographic Profile by Urbanization Group 2010-18 Marital Status (%) Ann. Pop. Pop. Average Diversity Median Population by Age (%) Never Widowed/ Households Population Chg (%) Density 1 Household Type
Demographic Profile by Urbanization Group 2010-18 Marital Status (%) Ann. Pop. Pop. Average Diversity Median Population by Age (%) Never Widowed/ Households Population Chg (%) Density 1 Household Type
DRAFT. Enrollment Projections Report. November 25, 2015
 November 25, 2015 3325 Hilliard Rome Road Hilliard, Ohio 43026 P: 614.798.8828 f: 614.798.8839 www.dejongrichter.com Table of Contents Acknowledgements... 1 Executive Summary... 3 Enrollment Projection
Ministry of Infrastructure and Watermanagement
 Ministry of Infrastructure and Watermanagement User characteristics and trip patterns of e-bike use in the Netherlands Results from the Dutch National Travel Survey and the Mobility Panel Netherlands Maarten
HOUSING NOW Halifax CMA
 Housing Market Information HOUSING NOW Halifax CMA Date Released: February 2015 Highlights There were 54 total housing starts in the Halifax CMA in compared to 47 starts in January 2014 Of the 54 starts
P0360 Rural Survey June Embargo: 11:00 Date: 17 June 1999
 P0360 Rural Survey June 1999 Embargo: 11:00 Date: 17 June 1999 Rural survey, 1997 Data and metadata set The data and metadata set from the 1997 Rural survey is available on CD-ROM at the following prices:
BC Region. New Home Market. Subscribe Now! Table of Contents. Housing market intelligence you can count on
 H o u s i n g M a r k e t I n f o r m a t i o n Housing Now BC Region C a n a d a M o r t g a g e a n d H o u s i n g C o r p o r a t i o n Date Released: Third Quarter 2011 Table of Contents 1 New Home
ADULTS HOT FLAVOURED MILK DRINKS- PAST 7 DAYS Page 267
 ADULTS - PAST 7 DAYS Page 267 COMMUNITY PROVINCE TOTAL 250 000 40 000-500- LESS THAN W. CAPE N. CAPE F.STATE E. CAPE OR MORE 249 999 39 999 500 12408 12408 6168 6168 2626 2626 1604 1604 2010 2010 1674
Housing NOW Peterborough CMA
 Housing Market Information Housing NOW Canada Mortgage and Housing Corporation Date Released: Fourth Quarter 2008 New Homes Market New housing starts in the first nine months of 2008 rose slightly by two
WORTHINGTON SCHOOLS ENROLLMENT PROJECTIONS REPORT JANUARY 25, 2019
 JANUARY 25, 2019 PREPARED FOR: Worthington Schools 200 E. Wilson Bridge Rd. Worthington, OH 43085 T 614.450.6000 PREPARED BY: Cooperative Strategies 3325 Hilliard Rome Road Hilliard, OH 43026 T 614.798.8828
Mandatory Entry Level Training for Class 1 drivers Agriculture industry
 Mandatory Entry Level Training for Class 1 drivers Agriculture industry Mandatory Entry Level Training (MELT) for commercial drivers Mandatory Entry Level Training (MELT) is a mandatory training program
THE WAY WE MOVE LRT FOR EVERYONE
 THE WAY WE MOVE LRT FOR EVERYONE 2 LRT for Everyone LRT FOR EVERYONE Light rail is about more than transit; it s about transforming Edmonton. As the city grows, so do its transportation needs. LRT is an
Canadian College Student Survey, Canadian Millennium Scholarship Foundation. Frequencies
 Canadian College Student Survey, 2004 Canadian Millennium Scholarship Foundation Frequencies reg Region 1 BC & Territories 2912 31.0 31.0 31.0 2 Western Canada 2362 25.1 25.1 56.1 3 Ontario 1793 19.1 19.1
WORTHINGTON SCHOOLS ENROLLMENT PROJECTIONS REPORT FEBRUARY 14, 2018
 FEBRUARY 14, 2018 PREPARED FOR: Worthington Schools 200 E. Wilson Bridge Rd. Worthington, OH 43085 T 614.450.6000 PREPARED BY: Cooperative Strategies 3325 Hilliard Rome Road Hilliard, OH 43026 T 614.798.8828
Jeff s House. Downtown Charlottesville. PEC Office
 Jeff s House Downtown Charlottesville PEC Office Year 2000 US Census Data Employed persons over 16 Percentage of Employed Persons Locality Avg Commute (in minutes) Drove Public Transit Walk/Bike Other
ADULT FEMALES SANITARY PROTECTION TAMPONS - PAST 4 WEEKS Page 1852
 ADULT FEMALES TAMPONS - PAST 4 WEEKS Page 1852 COMMUNITY PROVINCE TOTAL 250 000 40 000-500- LESS THAN W. CAPE N. CAPE F.STATE E. CAPE OR MORE 249 999 39 999 500 6195 6195 3089 3089 1317 1317 784 784 1005
ADULTS HAND-HELD ICE-CREAMS - PAST 7 DAYS Page 141
 ADULTS - PAST 7 DAYS Page 141 COMMUNITY PROVINCE TOTAL 250 000 40 000-500- LESS THAN W. CAPE N. CAPE F.STATE E. CAPE OR MORE 249 999 39 999 500 12408 12408 6168 6168 2626 2626 1604 1604 2010 2010 1674
Denver Car Share Program 2017 Program Summary
 Denver Car Share Program 2017 Program Summary Prepared for: Prepared by: Project Manager: Malinda Reese, PE Apex Design Reference No. P170271, Task Order #3 January 2018 Table of Contents 1. Introduction...
LOADING AND UNLOADING SURVEY NATIONAL SCHOOL BUS. Kansas leads the world in the success of each student.
 NATIONAL SCHOOL BUS LOADING AND UNLOADING SURVEY Kansas leads the world in the success of each student. January 2018 The Kansas State Department of Education School Bus Safety Unit wishes to thank the
Nusaresearch PANEL ATTRIBUTES
 Nusaresearch PANEL ATTRIBUTES December 28 An actively managed panel of W&S Joint Stock Company 1 121,394 CURRENT ACTIVE PANEL MEMBERS Indonesia MEMBERS OF ONLINE PANEL 121,394 Table of content About W&S
TECHNICAL COORDINATING COMMITTEE (TCC) UPDATE PRESENTATION APRIL 26, 2017
 UPDATE PRESENTATION APRIL 26, 2017") TECHNICAL COORDINATING COMMITTEE (TCC) UPDATE PRESENTATION APRIL 26, 2017 THE TRANSIT DEVELOPMENT PLAN (TDP) WILL IDENTIFY: TRANSIT NEEDS AND DESIRES OF THE COMMUNITY COMMUNITY AND AGENCY STAKEHOLDER S
TECHNICAL COORDINATING COMMITTEE (TCC) UPDATE PRESENTATION APRIL 26, 2017 THE TRANSIT DEVELOPMENT PLAN (TDP) WILL IDENTIFY: TRANSIT NEEDS AND DESIRES OF THE COMMUNITY COMMUNITY AND AGENCY STAKEHOLDER S
ENROLLMENT MANAGEMENT REPORT SCHOOL PROFILE PUBLIC HEALTH FALL 2018
 ENROLLMENT MANAGEMENT REPORT SCHOOL PROFILE PUBLIC HEALTH FALL 218 INTRODUCTION COLLEGE PROFILE The following college profile has been developed to tailor our annual enrollment report to your school s
Included in this Stakeholder Information Package:
 Who can you contact for more information? Yellowhead Area Transmission Reinforcement: TERA Environmental Consultants Dave Sare Phone: 403-538-5734 Email: dsare@teraenv.com Drayton Valley Area AltaLink
Transportation Statistical Data Development Report BAY COUNTY 2035 LONG RANGE TRANSPORTATION PLAN
 Transportation Statistical Data Development Report BAY COUNTY 2035 LONG RANGE TRANSPORTATION PLAN Prepared for Bay County Transportation Planning Organization and The Florida Department of Transportation,
School Districts of Randolph County, IN Demographic Study
 School Districts of Randolph County, IN Demographic Study November 15, 2017 McKibben Demographic Research Jerome McKibben, Ph.D. Rock Hill, SC j.mckibben@mckibbendemographics.com 978-501-7069 Assumptions
Allows the Licence Holder to Operate Minimum Age Medical Requirements Requirements up to
 Class Licences Professional and non-professional licences Applying for your licence Taking knowledge and road tests Chart showing the class of licence you require Table of Contents Different licences for
Boston in Context: Neighborhoods American Community Survey. January Longwood, taken by Peter Vanderwarker, from BPDA Archives
 Longwood, taken by Peter Vanderwarker, from BPDA Archives Old North Church, taken by Peter Vanderwarker, from BPDA Archives Boston in Context: Neighborhoods 2011-2015 American Community Survey January
TABLE OF CONTENTS 1. GENERAL LABOUR COSTS EQUIPMENT COSTS...2
 TABLE OF CONTENTS 1. GENERAL...2 2. LABOUR COSTS...2 3. EQUIPMENT COSTS...2 4. DISTRIBUTION MATERIAL COSTS (EDS AND OIL AND GAS FIELD SERVICE MODELS)..3 5. STREET LIGHTING...3 6. TRANSMISSION LINES...3
Global Status Report on Road Safety: Respondents' Questionnaire
 Global Status Report on Road Safety: Respondents' Questionnaire Country: Respondent's Information Name: Position: Institution: Email: Telephone: Fax: National Data Coordinator Name: Position: Institution:
HOUSING NOW Saint John, Moncton CMAs and Fredericton CA
 Housing Market Information HOUSING NOW Saint John, Moncton CMAs and Fredericton CA Date Released: Second Quarter 2015 Highlights First quarter construction activity produced mixed results for the three
Calgary CMA. New Home Market. Calgary housing starts decline in July. Calgary CMA - Single-Detached Starts. Subscribe Now!
 H o u s i n g M a r k e t I n f o r m a t i o n Housing Now Calgary CMA C a n a d a M o r t g a g e a n d H o u s i n g C o r p o r a t i o n Date Released: August 2011 Table of Contents New Home Market
Solar Energy Society of Alberta September 6, Charging Up! Edmonton s Electric Vehicle Strategy
 Solar Energy Society of Alberta September 6, 2018 Charging Up! Edmonton s Electric Vehicle Strategy Strategic Alignment Implementation of Edmonton s Electric Vehicle Strategy contributes to the City s
Kitchener and Guelph CMAs
 H o u s i n g M a r k e t I n f o r m a t i o n Housing Now Kitchener and Guelph CMAs C a n a d a M o r t g a g e a n d H o u s i n g C o r p o r a t i o n Date Released: First Quarter 2012 New Home Market
Targeting TDM Policies Based on Individual Transport Emissions
 Targeting TDM Policies Based on Individual Transport Emissions Yusak O. Susilo, University of the West of England, Bristol, Dominic Stead, Delft University of Technology, the Netherlands Who has the largest
HOUSING NOW Saskatoon CMA
 H o u s i n g M a r k e t I n f o r m a t i o n HOUSING NOW Saskatoon CMA C a n a d a M o r t g a g e a n d H o u s i n g C o r p o r a t i o n Date Released: Fourth Quarter 2011 Table of Contents New
% % % % % LANGUAGE
 POPULATION GROUP Black African 38 15% 221 5% 75 7% 513 14% 847 9% Coloured 81 32% 3 638 84% 350 31% 3 027 84% 7 097 76% Indian or Asian 0 0% 27 1% 1 0% 36 1% 65 1% White 136 53% 456 10% 702 61% 22 1% 1
INTERNET ACCESS GOALS AND PLANS
 i. Which do you consider to be your primary college* 2-year college Other 4-year Valley West Total 484 518 122 154 169 94 398 415 405 31 118 2,908 16.6 17.8 4.2 5.3 5.8 3.2 13.7 14.3 13.9 1.1 4.1 100.0
HOUSING NOW Hamilton and Brantford CMAs
 Housing Market Information HOUSING NOW Hamilton and Brantford CMAs Date Released: August 2011 New Home Market Fewer New Home Starts in July Although starts were down in both Hamilton and Brantford, developments
LEASE Cornelius Retail on Catawba
 Presented by G Brokerage Property Details Offering both retail and office spaces, these spaces are priced at $14 per square foot for office and $14 per square foot for retail. Options are available to
Kettle River Transmission Project
 April 2012 Why are you receiving this project information package? New transmission facilities are needed in the Fort McMurray area. ATCO Electric has been directed by the Alberta Electric System Operator
Kitchener-Cambridge-Waterloo and Guelph CMAs
 H o u s i n g M a r k e t I n f o r m a t i o n Housing Now Kitchener-Cambridge-Waterloo and Guelph CMAs C a n a d a M o r t g a g e a n d H o u s i n g C o r p o r a t i o n Table of Contents Date Released:
LAGUNA HONDA. Commercial Property For Sale SAN FRANCISCO, CA
 Commercial Property For Sale LOCATED IN Forest Hill PRICE: $2,475,000.00 Price per Square Foot: $201.00 SBA financing available for owner/user Great investment property with existing tenants Located on
14 September 2018 FINAL RESULTS
 14 September 2018 FINAL RESULTS ReachTEL conducted a survey of 854 residents across the New South Wales federal electorate of Warringah during the night of 13 September 2018. Question 1: If a Federal election
CIF # City of Barrie. Large Curbside Containers. Final Report. Final Project Report, September City of Barrie. CIF Project # 801.
 Final Report CIF #801.5 City of Barrie Large Curbside Containers Final Project Report, September 2015 City of Barrie CIF 801.5 City of Barrie: Large Curbside Containers, September 2015 1 CIF Project #